Embed Size (px)
Citation preview

TUBERCLE BLADE POWER PERFORMANCE TEST REPORT- WHALEPOWER CORPORATION
_____________________________________________________________________________________________________
Wind Energy Institute of Canada - 1 - July 2008
July 2008
Wind Energy Institute of Canada
WHALEPOWER TUBERCLE
BLADE POWER PERFORMANCE
TEST REPORT

TUBERCLE BLADE POWER PERFORMANCE TEST REPORT- WHALEPOWER CORPORATION
_____________________________________________________________________________________________________
Wind Energy Institute of Canada - 3 - July 2008
Wind Energy Institute of Canada
WhalePower Tubercle Blade Power Performance Test Report
Prepared by:
Wind Energy Institute of Canada 21741 Route 12
North Cape, PE C0B 2B0
Prepared for:
WhalePower Corporation 27 Tyrrel Avenue
Toronto, ON M6G 2G1

TUBERCLE BLADE POWER PERFORMANCE TEST REPORT- WHALEPOWER CORPORATION
_____________________________________________________________________________________________________
Wind Energy Institute of Canada - 4 - July 2008
Table of Contents
1 DISCLAMER ............................................................................................................................................ 8
2 BACKGROUND ....................................................................................................................................... 9
3 TEST OBJECTIVE ..................................................................................................................................... 9
4 WIND TURBINE CONFIGURATION ........................................................................................................ 10
4.1 TURBINE INFORMATION ............................................................................................................................... 10 4.2 ROTOR INFORMATION ................................................................................................................................. 11 4.3 POWER RATING ......................................................................................................................................... 11 4.4 BLADE INFORMATION .................................................................................................................................. 12 4.5 TOWER INFORMATION ................................................................................................................................ 13 4.6 CONTROL SYSTEMS ..................................................................................................................................... 13 4.7 GRID CONNECTIONS ................................................................................................................................... 14
5 TEST SITE ............................................................................................................................................. 14
5.1 PHOTOGRAPHS OF SITE................................................................................................................................ 15 5.2 SITE LAYOUT ............................................................................................................................................. 16 5.3 SITE ASSESSMENT ....................................................................................................................................... 17 5.4 SITE CALIBRATION ...................................................................................................................................... 18
6 TEST EQUIPMENT ................................................................................................................................ 19
6.1 SENSORS AND DATA ACQUISITION SYSTEM ...................................................................................................... 19 6.2 DESCRIPTION OF CUP ANEMOMETERS ............................................................................................................ 20 6.3 DIAGRAM OF METEOROLOGICAL MAST .......................................................................................................... 21 6.4 CALIBRATION CONTINUITY ........................................................................................................................... 22
7 MEASUREMENT PROCEDURE ............................................................................................................... 22
7.1 MEASUREMENT PERIOD .............................................................................................................................. 22 7.2 LOG BOOK ................................................................................................................................................ 23 7.3 DATA REJECTION ........................................................................................................................................ 23
8 MEASURED DATA ................................................................................................................................ 24
8.1 SCATTER PLOT OF POWER OUTPUT AS A FUNCTION OF WIND SPEED .................................................................... 24 8.2 SCATTER PLOT OF WIND SPEED AS A FUNCTION OF VALID WIND DIRECTION .......................................................... 24 8.3 SCATTER PLOT OF TURBULENCE INTENSITY AS A FUNCTION OF WIND SPEED .......................................................... 25
9 POWER CURVES ................................................................................................................................... 26
9.1 POWER CURVE NORMALIZED TO STANDARD AIR DENSITY .................................................................................. 26 9.2 POWER CURVE NORMALIZED TO SITE AVERAGE AIR DENSITY .............................................................................. 28
10 POWER COEFFICIENT ........................................................................................................................... 30
11 ANNUAL ENERGY PRODUCTION ........................................................................................................... 31
11.1 ANNUAL ENERGY PRODUCTION (STANDARD AIR DENSITY)............................................................................. 31 11.2 ANNUAL ENERGY PRODUCTION (SITE AVERAGE AIR DENSITY) ........................................................................ 31
12 UNCERTAINTY OF MEASUREMENT ...................................................................................................... 32

TUBERCLE BLADE POWER PERFORMANCE TEST REPORT- WHALEPOWER CORPORATION
_____________________________________________________________________________________________________
Wind Energy Institute of Canada - 5 - July 2008
13 DEVIATIONS FROM IEC-61400-12-1PROCEDURE .................................................................................. 33
APPENDIX A: WEATHER PRAMETERS AT NORTH CAPE .................................................................................. 35
APPENDIX B: REJECTION ANGLE CALCULATIONS ........................................................................................... 36
APPENDIX C: WENVOR LOG BOOK FOR THE YEAR 2008 ................................................................................ 37

TUBERCLE BLADE POWER PERFORMANCE TEST REPORT- WHALEPOWER CORPORATION
_____________________________________________________________________________________________________
Wind Energy Institute of Canada - 6 - July 2008
List of Tables
TABLE 4-1 - WENVOR NAME PLATE ............................................................................................................................. 11 TABLE 9-1 - MEASURED POWER CURVE NORMALIZED TO STANDARD AIR DENSITY ............................................................... 26 TABLE 9-2 - MEASURED POWER CURVE NORMALIZED TO SITE AVERAGE AIR DENSITY ........................................................... 28 TABLE 11-1: ANNUAL ENERGY PRODUCTION NORMALIZED TO STANDARD AIR DENSITY ......................................................... 31 TABLE 11-2: ANNUAL ENERGY PRODUCTION NORMALIZED TO SITE AVERAGE AIR DENSITY .................................................... 31 TABLE 12-1: TYPE B UNCERTAINTIES ........................................................................................................................... 32
TUBERCLE BLADE POWER PERFORMANCE TEST REPORT- WHALEPOWER CORPORATION
_____________________________________________________________________________________________________
Wind Energy Institute of Canada - 7 - July 2008
List of Figures
FIGURE 4-1 - WENVOR TEST TURBINE FITTED WITH WHALEPOWER BLADES ......................................................................... 10 FIGURE 4-2: WHALEPOWER CORPORATION TEST BLADE .................................................................................................. 12 FIGURE 4-3 – WHALEPOWER POWER TRANSDUCER CONNECTIONS ..................................................................................... 14 FIGURE 5-1 – PICTURES OF SITE TAKEN FROM BASE OF WHALEPOWER ............................................................................... 15 FIGURE 5-2 - WEICAN SITE TOPOGRAPHY ..................................................................................................................... 16 FIGURE 5-3 - VALID WIND DIRECTIONS ......................................................................................................................... 17 FIGURE 5-4: SITE CALIBRATION REGIONS ....................................................................................................................... 18 FIGURE 6-1 - ANEMOMETER CONFIGURATION ................................................................................................................ 20 FIGURE 6-2 - DIAGRAM OF METEOROLOGICAL MAST ....................................................................................................... 21 FIGURE 6-3: SENSOR ORIENTATION AND WIND ROSE AT 50M ........................................................................................... 22 FIGURE 8-1 - SCATTER PLOT OF POWER OUTPUT AS A FUNCTION OF WIND SPEED ................................................................ 24 FIGURE 8-2 - SCATTER PLOT OF WIND SPEED AND TURBULENCE AS A FUNCTION OF WIND DIRECTION ...................................... 25 FIGURE 8-3 - SCATTER PLOT OF TURBULENCE INTENSITY AS A FUNCTION OF WIND SPEED ....................................................... 25 FIGURE 9-1 - MEASURED POWER CURVE NORMALIZED TO STANDARD AIR DENSITY ............................................................... 27 FIGURE 9-2 - MEASURED POWER CURVE NORMALIZED TO SITE AVERAGE AIR DENSITY .......................................................... 29 FIGURE 10-1 - POWER COEFFICIENT (CP) ...................................................................................................................... 30

TUBERCLE BLADE POWER PERFORMANCE TEST REPORT- WHALEPOWER CORPORATION
_____________________________________________________________________________________________________
Wind Energy Institute of Canada - 8 - July 2008
1 DISCLAMER
This report was prepared as an account of work sponsored by Natural Resources Canada. The test results documented in this report define the characteristics of the test article as configured under the conditions tested.
Neither the Wind Energy Institute of Canada (WEICan), nor any of their employees, makes any warranty, express or implied, or assumes any legal liability or responsibility for the usefulness of any information, apparatus, product, or process disclosed, or represents that its use would not infringe privately owned rights. Nor do they assume legal liability or responsibility for the performance of the test article or any similarly named article when tested under other conditions or using different test procedures.
The Wind Energy Institute of Canada shall not be liable for special, consequential or incidental damages. Reference herein to any specific commercial product, process, or service by trade name, trademark, manufacturer or otherwise does not necessarily constitute or imply its endorsement, recommendation, or favouring by WEICan. The views and opinions of the authors expressed herein do not necessarily state or reflect those of the WEICan.
The Wind Energy Institute of Canada is a non-profit research institution. It is partially funded by: Natural Resources Canada, the Atlantic Canada Opportunity Agency of the Government of Canada, and the Prince Edward Island Energy Corporation of the Prince Edward Island Government.
This report may only be reproduced with written permission from either WEICan or WhalePower Corporation.

TUBERCLE BLADE POWER PERFORMANCE TEST REPORT- WHALEPOWER CORPORATION
_____________________________________________________________________________________________________
Wind Energy Institute of Canada - 9 - July 2008
2 BACKGROUND
This test is designed to determine the performance characteristics of the WhalePower Corporation’s turbine blades, which are modeled after humpback whale flippers. These blades contain tubercles along most of the leading edge of the blade, much in the same way that humpback whales have tubercles on their flippers. The blades have been fitted to a Wenvor 25kW turbine. Both Wenvor and WhalePower Corporation are based in Ontario, Canada.
This turbine has been installed at WEICan’s test site located at North Cape, Prince Edward Island, Canada. WEICan has been the leading institute for wind energy research and development in Canada since 1981. WEICan conducts power performance testing on a variety of turbines.
3 TEST OBJECTIVE
The objective of this test is to characterize the power performance of the Wenvor 25kW wind turbine with WhalePower Corporation’s blades. To meet this objective, measurements were collected and analyzed in accordance with International Electrotechnical Commission (IEC) standards for power performance measurements of electricity producing wind turbines (IEC 61400-12-1), unless otherwise stated. This report is formatted according to section 9 of IEC 61400-12-1.
_____________________________________________________________________________________________________
Wind Energy Institute of Canada
4 WIND TURBINE CONFIGU
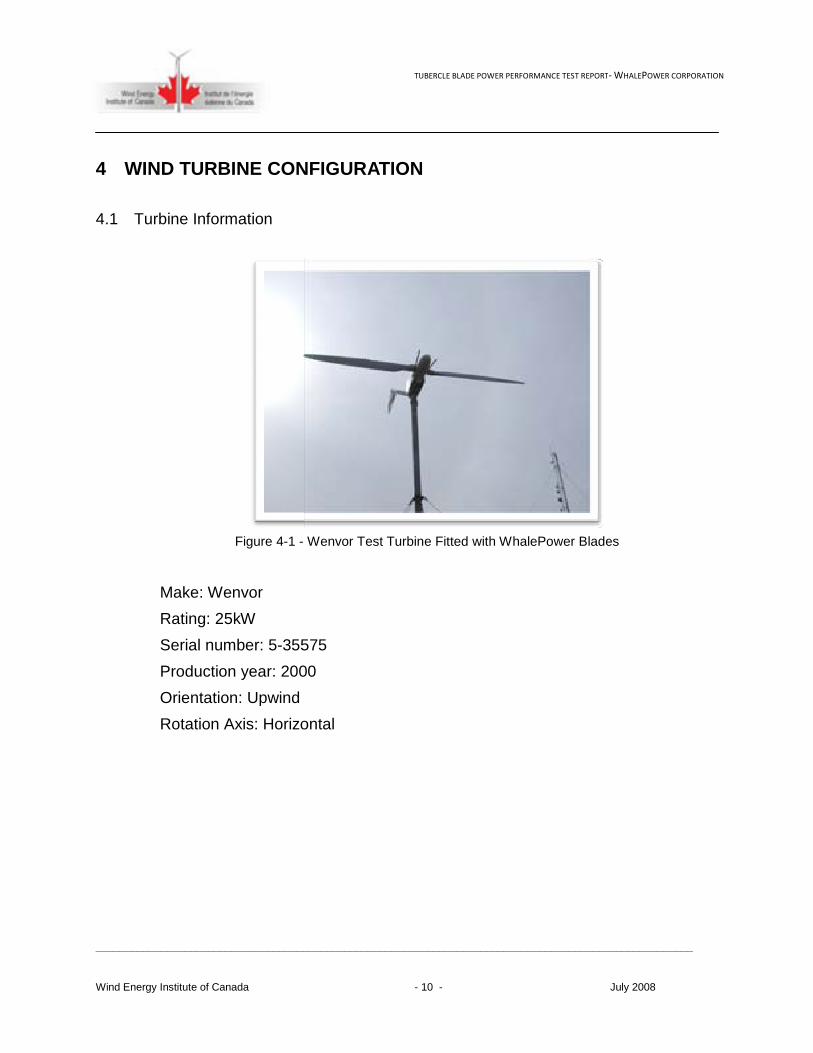
4.1 Turbine Information
Figure 4-1 -
Make: Wenvor
Rating: 25kW
Serial number: 5-35575
Production year: 2000
Orientation: Upwind
Rotation Axis: Horizontal
TUBERCLE BLADE POWER PERFORMANCE TEST REPORT
_____________________________________________________________________________________________________
- 10 -
WIND TURBINE CONFIGURATION
Wenvor Test Turbine Fitted with WhalePower Blades
35575
Production year: 2000
Orientation: Upwind
Rotation Axis: Horizontal
ORT- WHALEPOWER CORPORATION
_____________________________________________________________________________________________________
July 2008
Blades
TUBERCLE BLADE POWER PERFORMANCE TEST REPORT- WHALEPOWER CORPORATION
_____________________________________________________________________________________________________
Wind Energy Institute of Canada - 11 - July 2008
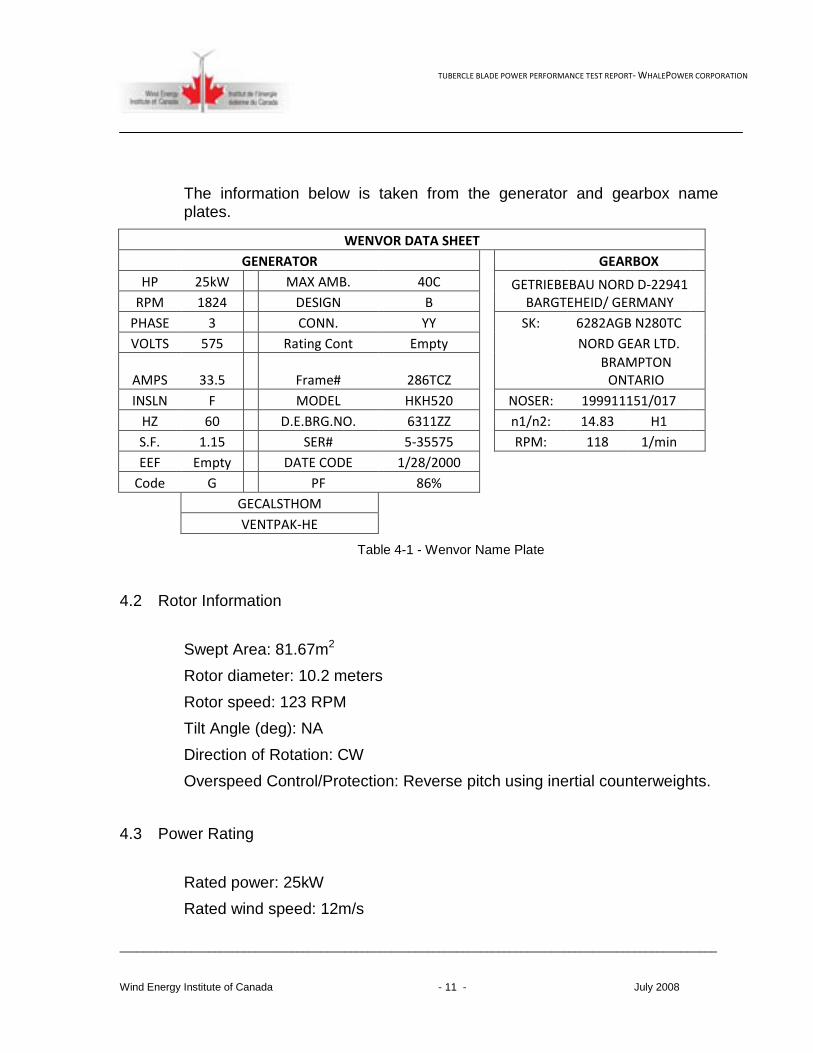
The information below is taken from the generator and gearbox name plates.
WENVOR DATA SHEET
GENERATOR
GEARBOX
HP 25kW
MAX AMB. 40C
GETRIEBEBAU NORD D-22941
BARGTEHEID/ GERMANY RPM 1824
DESIGN B
PHASE 3
CONN. YY
SK: 6282AGB N280TC
VOLTS 575
Rating Cont Empty
NORD GEAR LTD.
AMPS 33.5
Frame# 286TCZ
BRAMPTON
ONTARIO
INSLN F
MODEL HKH520
NOSER: 199911151/017
HZ 60
D.E.BRG.NO. 6311ZZ
n1/n2: 14.83 H1
S.F. 1.15
SER# 5-35575
RPM: 118 1/min
EEF Empty
DATE CODE 1/28/2000
Code G
PF 86%
GECALSTHOM
VENTPAK-HE
Table 4-1 - Wenvor Name Plate
4.2 Rotor Information
Swept Area: 81.67m2
Rotor diameter: 10.2 meters
Rotor speed: 123 RPM
Tilt Angle (deg): NA
Direction of Rotation: CW
Overspeed Control/Protection: Reverse pitch using inertial counterweights.
4.3 Power Rating
Rated power: 25kW
Rated wind speed: 12m/s
_____________________________________________________________________________________________________
Wind Energy Institute of Canada
Power Regulation: Passive
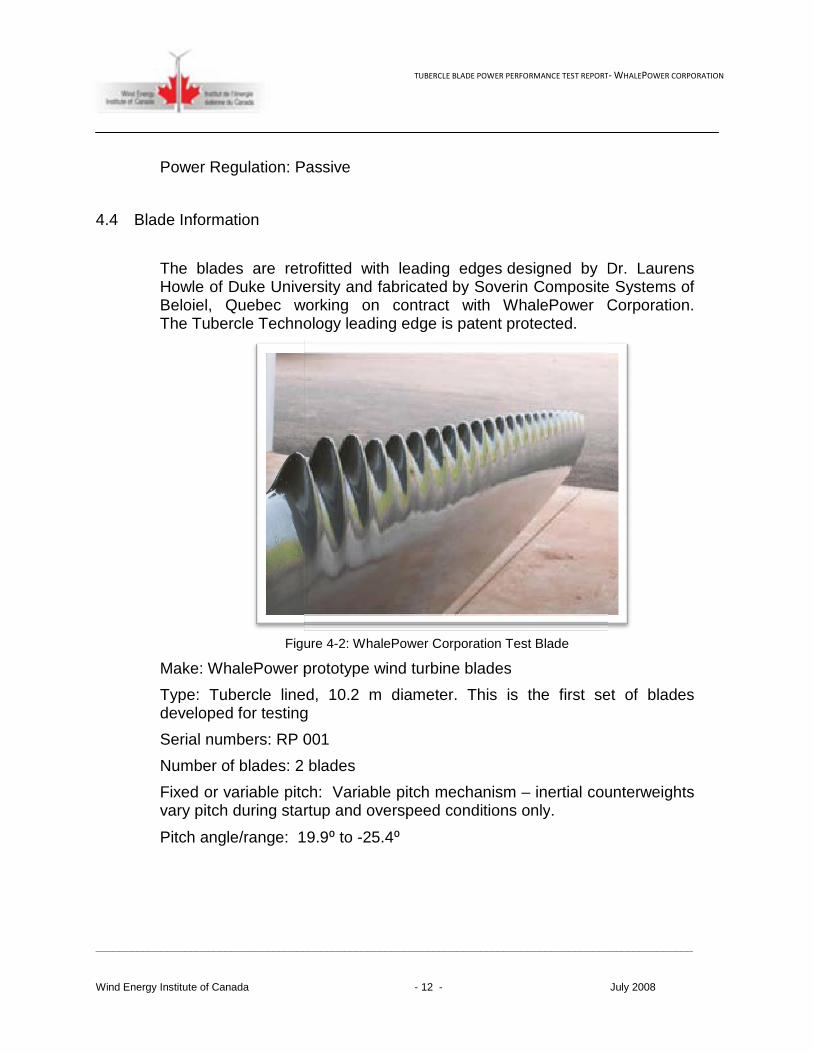
4.4 Blade Information
The blades are retrofitted with leading edgesHowle of Duke University and fabricatedBeloiel, Quebec working on contract with WhalePower Corporation. The Tubercle Technology leading edge
Figure
Make: WhalePower prototype wind turbine blades
Type: Tubercle lined, 10developed for testing
Serial numbers: RP 001
Number of blades: 2 blades
Fixed or variable pitchvary pitch during startup and overspeed conditions only
Pitch angle/range: 19.9
TUBERCLE BLADE POWER PERFORMANCE TEST REPORT
_____________________________________________________________________________________________________
- 12 -
Power Regulation: Passive
The blades are retrofitted with leading edges designed by Dr. Laurens Howle of Duke University and fabricated by Soverin Composite Systems of Beloiel, Quebec working on contract with WhalePower Corporation.
Tubercle Technology leading edge is patent protected.
Figure 4-2: WhalePower Corporation Test Blade
Make: WhalePower prototype wind turbine blades
Type: Tubercle lined, 10.2 m diameter. This is the first set of blades developed for testing
Serial numbers: RP 001
: 2 blades
Fixed or variable pitch: Variable pitch mechanism – inertial counterweights vary pitch during startup and overspeed conditions only.
19.9⁰ to -25.4⁰
ORT- WHALEPOWER CORPORATION
_____________________________________________________________________________________________________
July 2008
designed by Dr. Laurens by Soverin Composite Systems of
Beloiel, Quebec working on contract with WhalePower Corporation.
This is the first set of blades
inertial counterweights

TUBERCLE BLADE POWER PERFORMANCE TEST REPORT- WHALEPOWER CORPORATION
_____________________________________________________________________________________________________
Wind Energy Institute of Canada - 13 - July 2008
4.5 Tower Information
Hub Height: The height of the centre of the turbine hub is 27.5m from ground level.
Tower type: The tower is of metal tube design and was supplied by Wenvor. It is held vertically by a guyed support system of cables. The tower is designed to tilt up and down using a pole and pulley.
4.6 Control Systems
The WhalePower controller is a WEICan custom-built controller based on a Microchip PIC18C452 microcontroller chip. The signals monitored by the controller are:
Turbine on line
Generator voltage
Generator current
Generator frequency
The turbine on line signal is read by the data acquisition system as a status signal.
When the generator frequency is between 60 and 68 Hz the generator is connected to the electrical grid. The controller monitors the generator voltage and current and calculates the PF (Power factor). When the PF goes negative for 10 seconds the turbine is taken off line and freewheels.
On line: 60 Hz <RPM <68 Hz
Off Line: PF < 0 (for 10 sec)
During high wind situations, the turbine is manually disconnected from the electrical grid and the brake is manually applied.

TUBERCLE BLADE POWER PERFORMANCE TEST REPORT- WHALEPOWER CORPORATION
_____________________________________________________________________________________________________
Wind Energy Institute of Canada - 14 - July 2008
4.7 Grid Connections
Grid Voltage: 3 ph 600VAC
Tolerance: ± 5%
Grid Frequency: 60Hz
Tolerance: ± 0.00083%
Figure 4-3 – WhalePower power transducer connections
5 TEST SITE
The WEICan Site is located on the northern tip of Prince Edward Island, at 47.055⁰N, 63.997⁰W. Situated on the coast of the Northumberland Strait, it has a 300 degree exposure to the ocean winds. WEICan Site is approximately 6 - 12 meters above sea level. Figure 5-2 shows a plot plan of the test site.
TUBERCLE BLADE POWER PERFORMANCE TEST REPORT- WHALEPOWER CORPORATION
_____________________________________________________________________________________________________
Wind Energy Institute of Canada - 15 - July 2008
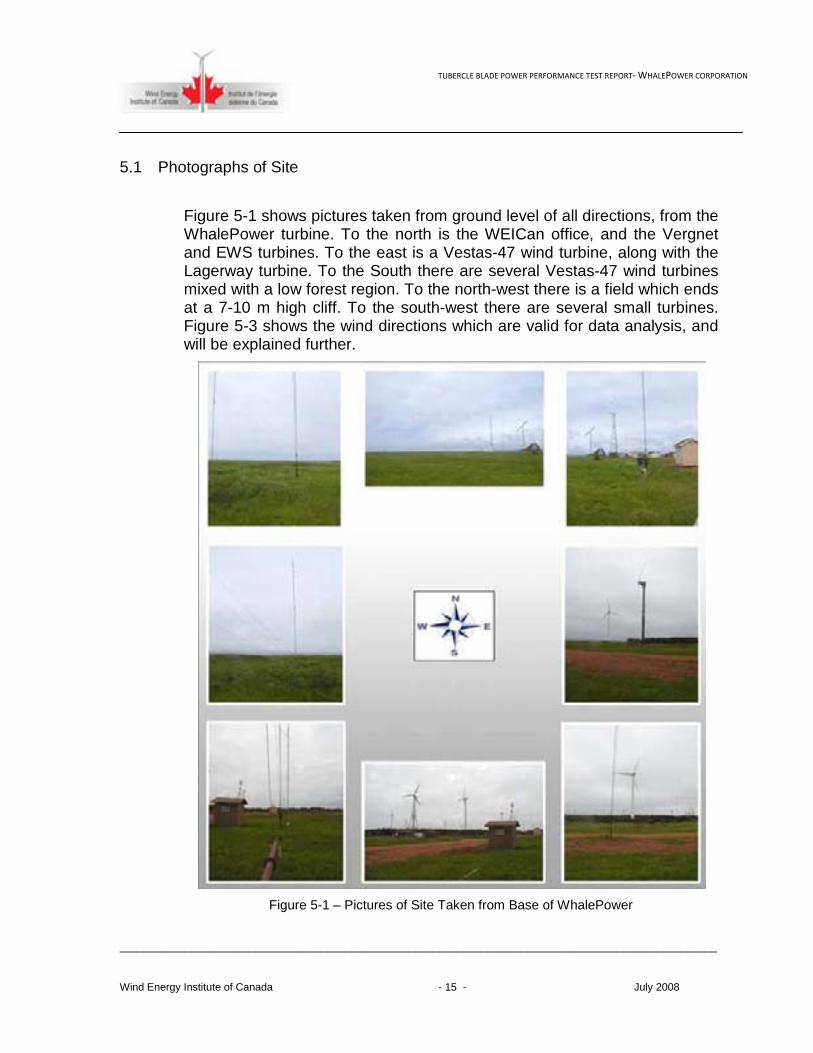
5.1 Photographs of Site
Figure 5-1 shows pictures taken from ground level of all directions, from the WhalePower turbine. To the north is the WEICan office, and the Vergnet and EWS turbines. To the east is a Vestas-47 wind turbine, along with the Lagerway turbine. To the South there are several Vestas-47 wind turbines mixed with a low forest region. To the north-west there is a field which ends at a 7-10 m high cliff. To the south-west there are several small turbines. Figure 5-3 shows the wind directions which are valid for data analysis, and will be explained further.
Figure 5-1 – Pictures of Site Taken from Base of WhalePower
TUBERCLE BLADE POWER PERFORMANCE TEST REPORT- WHALEPOWER CORPORATION
_____________________________________________________________________________________________________
Wind Energy Institute of Canada - 16 - July 2008
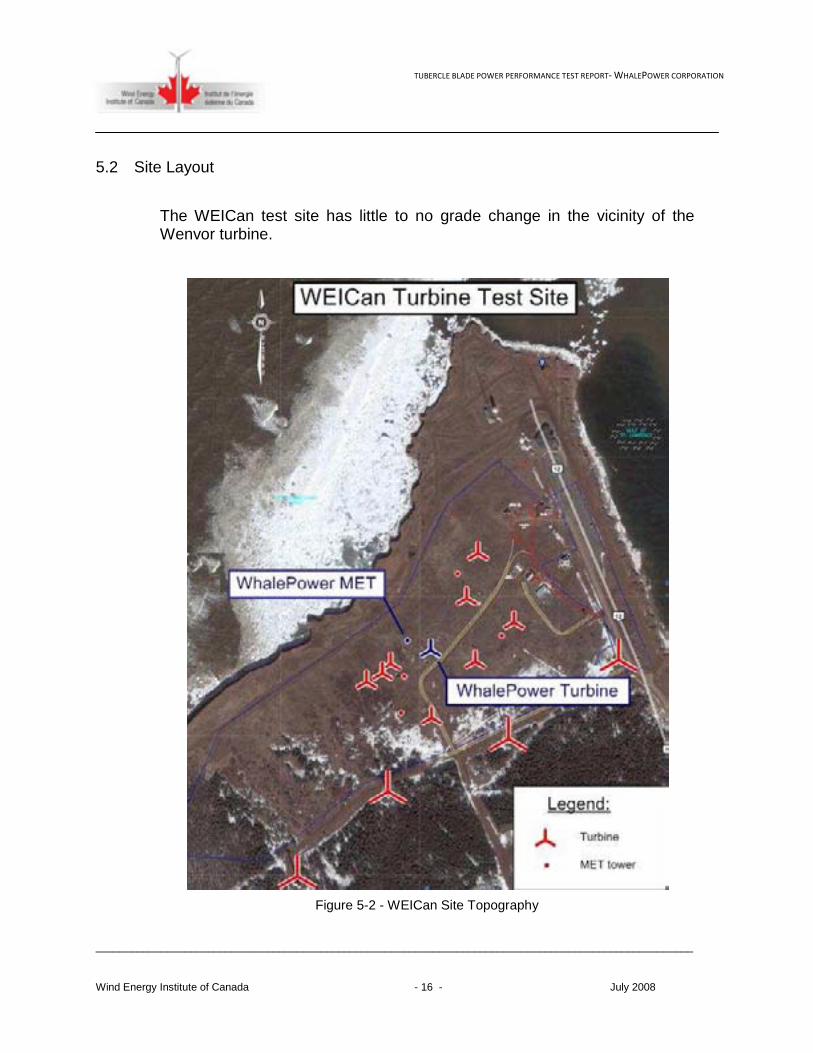
5.2 Site Layout
The WEICan test site has little to no grade change in the vicinity of the Wenvor turbine.
Figure 5-2 - WEICan Site Topography

TUBERCLE BLADE POWER PERFORMANCE TEST REPORT- WHALEPOWER CORPORATION
_____________________________________________________________________________________________________
Wind Energy Institute of Canada - 17 - July 2008
5.3 Site Assessment
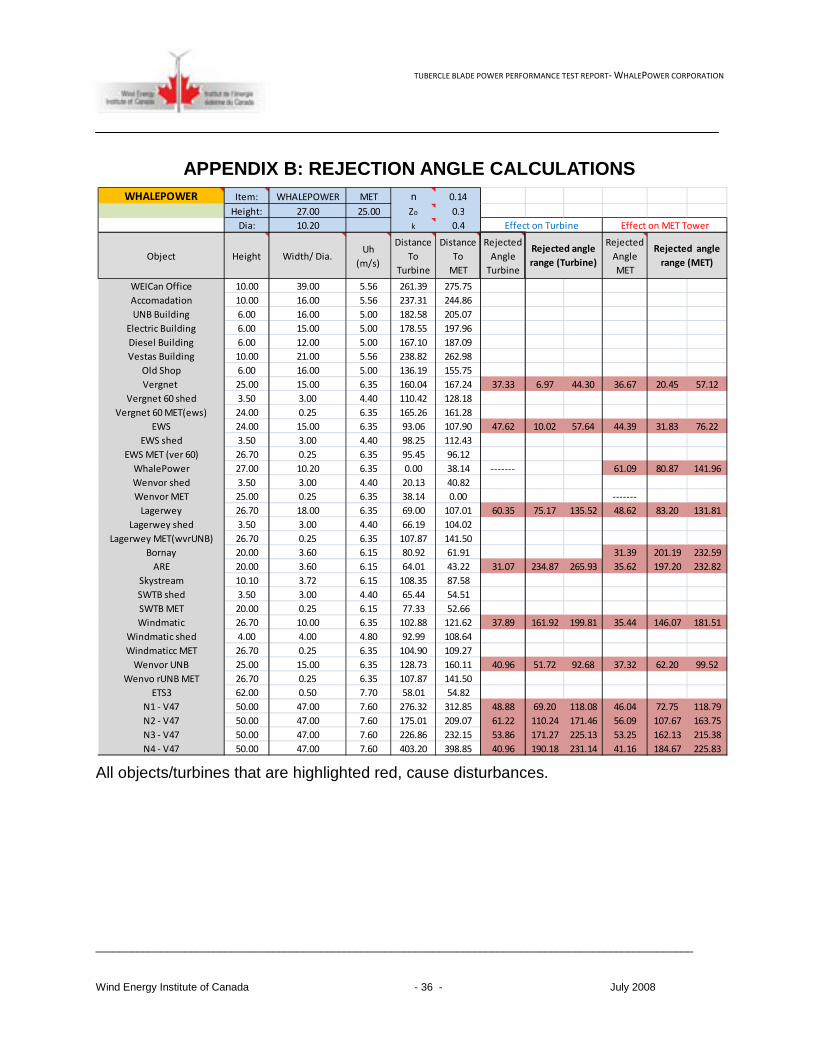
Figure 5-3 shows valid wind directions that are not disturbed by other turbines or obstacles. There were ten objects on site that were classified as significant according to IEC-61400-12-1: the Lagerway turbine located to the east of the Whalepower, four Vestas-47 turbines located east to south-west of the WhalePower, the Vergnet and EWS turbines located to the north, the Wenvor UNB to the north-east, the ARE turbine to the south-west, and the Windmatic to the south of the WhalePower The valid measurement sector that is available ranges from 266.1 to 6.8 degrees, shown as the area with green vertical shading below. Please see Appendix B for further information on angle selection process.
Figure 5-3 - Valid Wind Directions
TUBERCLE BLADE POWER PERFORMANCE TEST REPORT- WHALEPOWER CORPORATION
_____________________________________________________________________________________________________
Wind Energy Institute of Canada - 18 - July 2008
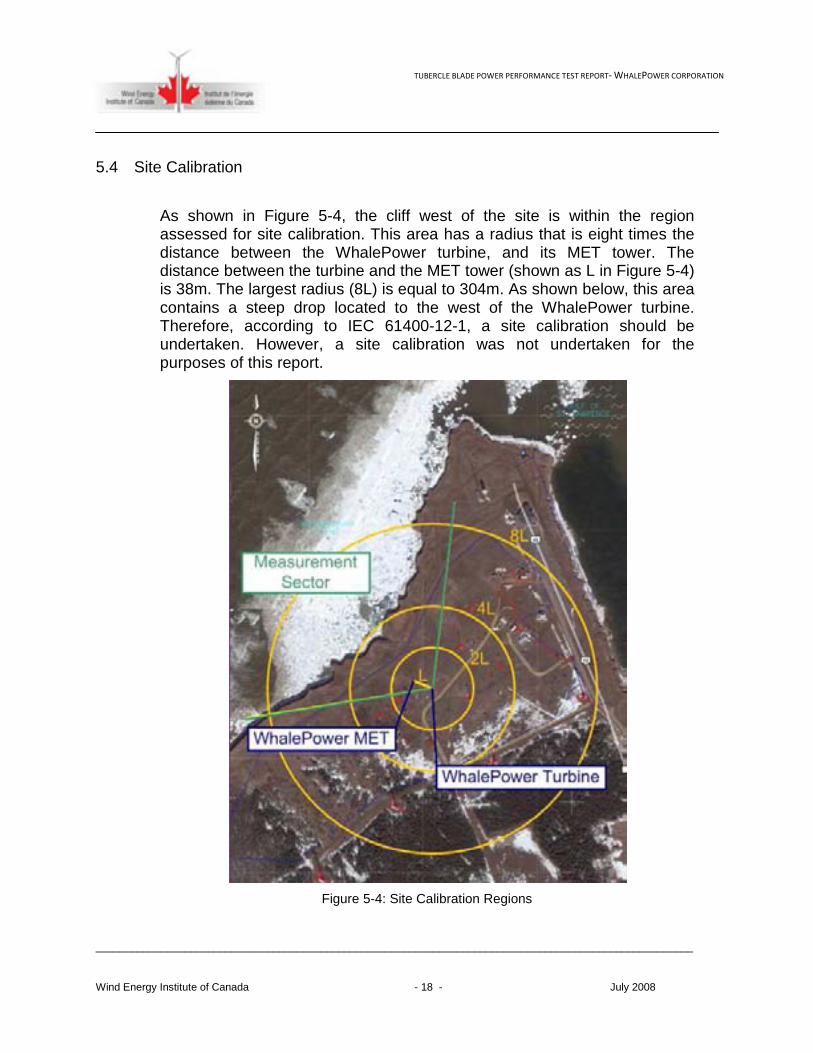
5.4 Site Calibration
As shown in Figure 5-4, the cliff west of the site is within the region assessed for site calibration. This area has a radius that is eight times the distance between the WhalePower turbine, and its MET tower. The distance between the turbine and the MET tower (shown as L in Figure 5-4) is 38m. The largest radius (8L) is equal to 304m. As shown below, this area contains a steep drop located to the west of the WhalePower turbine. Therefore, according to IEC 61400-12-1, a site calibration should be undertaken. However, a site calibration was not undertaken for the purposes of this report.
Figure 5-4: Site Calibration Regions

TUBERCLE BLADE POWER PERFORMANCE TEST REPORT- WHALEPOWER CORPORATION
_____________________________________________________________________________________________________
Wind Energy Institute of Canada - 19 - July 2008
6 TEST EQUIPMENT
All test equipment meets IEC 61400-12-1 standards and was mounted accordingly, with the exception of the power transducer not meeting IEC 60688.
.
6.1 Sensors and Data Acquisition System
Data Acquisition System: Campbell Scientific CR21XL Ser#4202 with a SM16 Storage Module
Anemometers Riso Model P2546A Ser#3470 & Ser#3471, replaced with Ser#4382 & Ser#4386
Temperature Campbell Scientific Model 107 Ser# 41303
Barometric Pressure RMYoung #61205V Ser#BP04834
Direction vane Met1 020C Ser#G2561
Power transducer Ohio Semitronics Model GWV5-006EY24
Ser#02090217
See Appendix D for calibration sheets.
TUBERCLE BLADE POWER PERFORMANCE TEST REPORT- WHALEPOWER CORPORATION
_____________________________________________________________________________________________________
Wind Energy Institute of Canada - 20 - July 2008
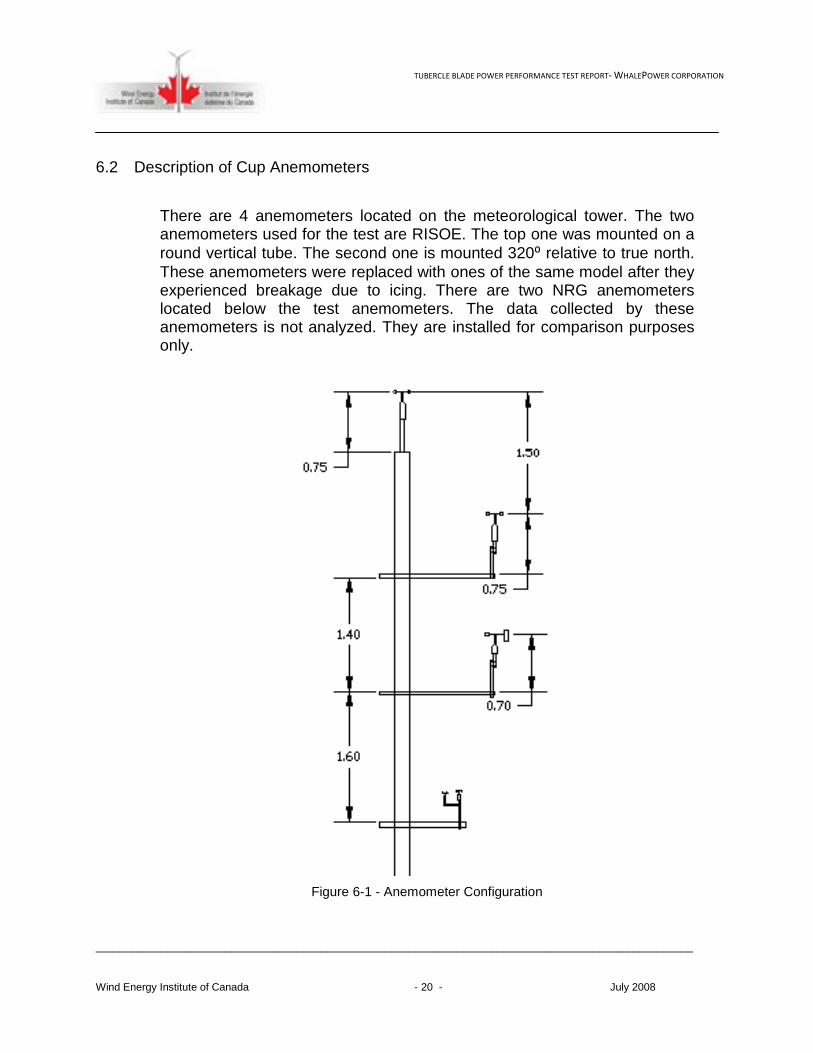
6.2 Description of Cup Anemometers
There are 4 anemometers located on the meteorological tower. The two anemometers used for the test are RISOE. The top one was mounted on a round vertical tube. The second one is mounted 320⁰ relative to true north. These anemometers were replaced with ones of the same model after they experienced breakage due to icing. There are two NRG anemometers located below the test anemometers. The data collected by these anemometers is not analyzed. They are installed for comparison purposes only.
Figure 6-1 - Anemometer Configuration

TUBERCLE BLADE POWER PERFORMANCE TEST REPORT- WHALEPOWER CORPORATION
_____________________________________________________________________________________________________
Wind Energy Institute of Canada - 21 - July 2008
6.3 Diagram of Meteorological Mast
Below is a diagram showing dimensions and orientation of sensors. The tower contains, from top to bottom: anemometer, anemometer, direction vane, two anemometers, temperature sensor and a barometric pressure sensor. The meteorological tower is located 38 meters from the test turbine. This equates to 3.7 times the diameter of the turbine blades. This falls in the allowable range of 2 to 4 times the diameter.
Figure 6-2 - Diagram of Meteorological Mast

TUBERCLE BLADE POWER PERFORMANCE TEST REPORT- WHALEPOWER CORPORATION
_____________________________________________________________________________________________________
Wind Energy Institute of Canada - 22 - July 2008
Figure 6-3: Sensor Orientation and Wind Rose at 50m
6.4 Calibration Continuity
Instruments will be sent for calibration verification.
7 MEASUREMENT PROCEDURE
7.1 Measurement Period
The measurement of data started on January 4, 2008 and continued through until June 2, 2008. There were a few points in this range where the turbine was not operational. Weather conditions such as icing and precipitation accounted for much downtime and data rejection, since testing was done during winter months. Please refer to Appendix C to see all down time due to maintenance and other issues.

TUBERCLE BLADE POWER PERFORMANCE TEST REPORT- WHALEPOWER CORPORATION
_____________________________________________________________________________________________________
Wind Energy Institute of Canada - 23 - July 2008
Readings of wind speed, power output, temperature, barometric pressure and wind direction were collected at a sampling rate of 1Hz (1-second data). From these one second readings, one minute groupings of contiguous data were derived. These one-minute groupings were ensured to be of a complete sixty seconds each. Average, standard deviation, maximum and minimum values were calculated for each one-minute data set.
7.2 Log Book
The log book was updated each day significant events occurred. Please see Appendix C for all entries in the log book.
7.3 Data Rejection
All data was reviewed and any data falling under the following circumstances were rejected:
- The turbine was offline due to low wind speeds. - External conditions other than wind speed are out of the operating
range of the wind turbine (e.g. due to fog). - Turbine cannot operate because of a turbine fault condition - Turbine is manually shut down or in a test of maintenance
operating mode - Failure or degradation of test equipment (e.g. due to icing) - Wind direction outside the measurement sector(s) as defined in
Site Assessment - Wind directions outside valid (complete) site calibration sectors.
This does not apply to the WEICan test site.
Since the turbine is manually shut off at times of high winds, no significant hysteresis effect should be occurring, and therefore a hysteresis analysis was not undertaken.

TUBERCLE BLADE POWER PERFORMANCE TEST REPORT- WHALEPOWER CORPORATION
_____________________________________________________________________________________________________
Wind Energy Institute of Canada - 24 - July 2008
8 MEASURED DATA
The following section includes a presentation of the raw one minute test data as it was collected. No normalization has been undergone to account for site specific atmospheric conditions. Figure 8-3 displays distinct arches in the turbulence pattern, at low wind speeds. This is a normal occurrance, due to the characteristic of the RISOE anemometer, which produces only two pulses per revolution.
8.1 Scatter Plot of Power Output as a function of Wind Speed
Figure 8-1 - Scatter Plot of Power Output as a Function of Wind Speed
8.2 Scatter Plot of Wind Speed as a Function of Valid Wind Direction

TUBERCLE BLADE POWER PERFORMANCE TEST REPORT- WHALEPOWER CORPORATION
_____________________________________________________________________________________________________
Wind Energy Institute of Canada - 25 - July 2008
Figure 8-2 - Scatter Plot of Wind Speed and Turbulence as a Function of Wind Direction
8.3 Scatter Plot of Turbulence Intensity as a Function of Wind Speed
Figure 8-3 - Scatter Plot of Turbulence Intensity as a Function of Wind Speed
TUBERCLE BLADE POWER PERFORMANCE TEST REPORT- WHALEPOWER CORPORATION
_____________________________________________________________________________________________________
Wind Energy Institute of Canada - 26 - July 2008
9 POWER CURVES
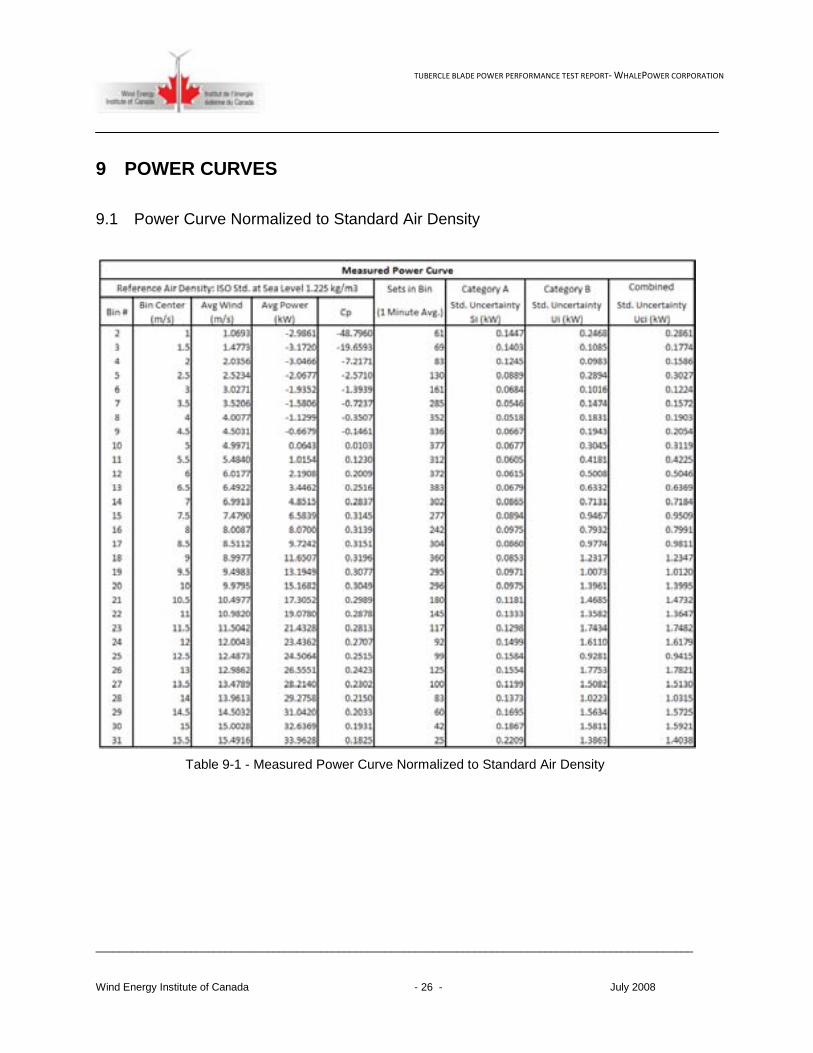
9.1 Power Curve Normalized to Standard Air Density
Table 9-1 - Measured Power Curve Normalized to Standard Air Density

TUBERCLE BLADE POWER PERFORMANCE TEST REPORT- WHALEPOWER CORPORATION
_____________________________________________________________________________________________________
Wind Energy Institute of Canada - 27 - July 2008
Figure 9-1 - Measured Power Curve Normalized to Standard Air Density

TUBERCLE BLADE POWER PERFORMANCE TEST REPORT- WHALEPOWER CORPORATION
_____________________________________________________________________________________________________
Wind Energy Institute of Canada - 28 - July 2008
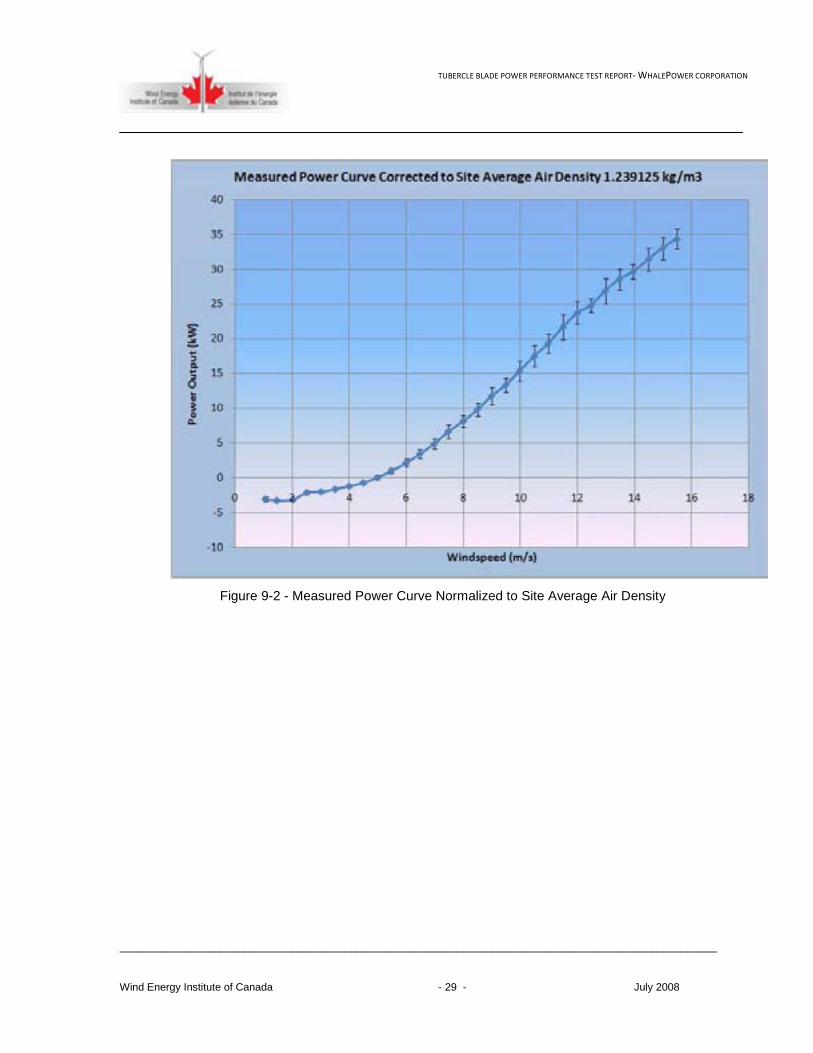
9.2 Power Curve Normalized to Site Average Air Density
Note that Site average air density was calculated during times of valid data collection
Table 9-2 - Measured Power Curve Normalized to Site Average Air Density
TUBERCLE BLADE POWER PERFORMANCE TEST REPORT- WHALEPOWER CORPORATION
_____________________________________________________________________________________________________
Wind Energy Institute of Canada - 29 - July 2008
Figure 9-2 - Measured Power Curve Normalized to Site Average Air Density

TUBERCLE BLADE POWER PERFORMANCE TEST REPORT- WHALEPOWER CORPORATION
_____________________________________________________________________________________________________
Wind Energy Institute of Canada - 30 - July 2008
10 POWER COEFFICIENT
Figure 10-1 - Power Coefficient (Cp)
-0.10
-0.05
0.00
0.05
0.10
0.15
0.20
0.25
0.30
0.35
0 2 4 6 8 10 12 14 16 18
Po
we
r C
oe
ffic
ien
t
Windspeed (m/s)
Power Coefficient (Cp)

TUBERCLE BLADE POWER PERFORMANCE TEST REPORT- WHALEPOWER CORPORATION
_____________________________________________________________________________________________________
Wind Energy Institute of Canada - 31 - July 2008
11 ANNUAL ENERGY PRODUCTION
11.1 Annual Energy Production (Standard Air Density)
Table 11-1: Annual Energy Production Normalized to Standard Air Density
11.2 Annual Energy Production (Site Average Air Density)
Table 11-2: Annual Energy Production Normalized to Site Average Air Density
TUBERCLE BLADE POWER PERFORMANCE TEST REPORT- WHALEPOWER CORPORATION
_____________________________________________________________________________________________________
Wind Energy Institute of Canada - 32 - July 2008
12 UNCERTAINTY OF MEASUREMENT
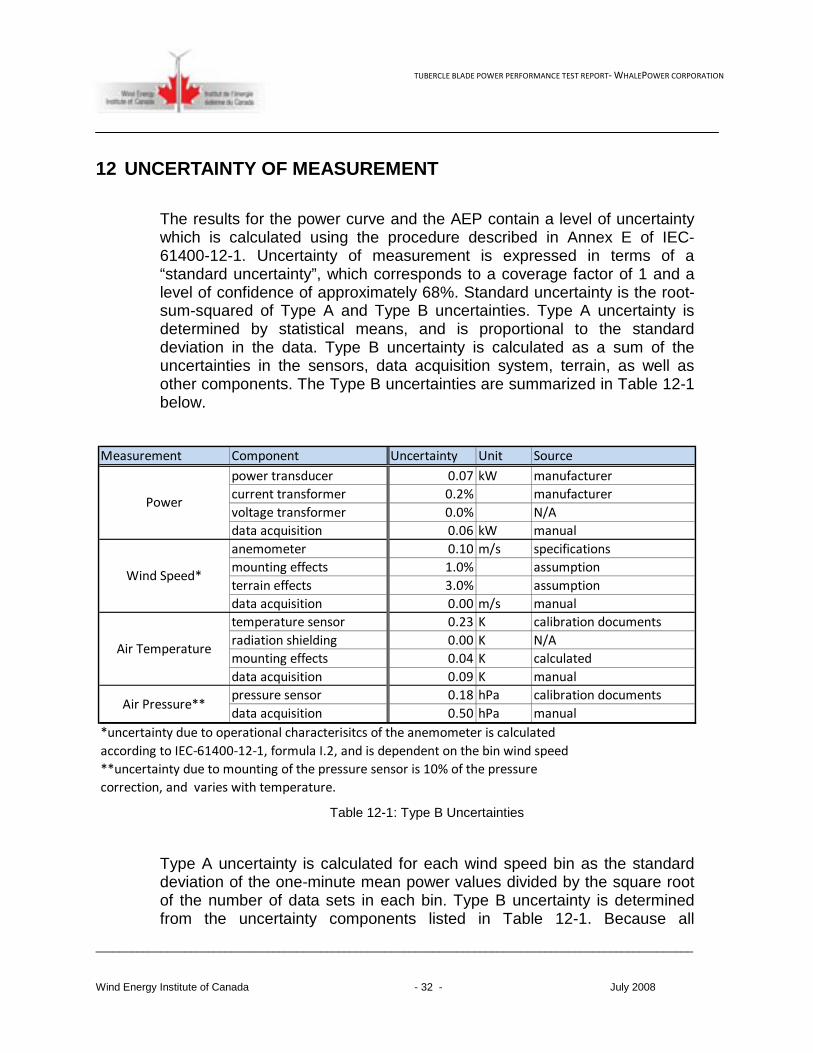
The results for the power curve and the AEP contain a level of uncertainty which is calculated using the procedure described in Annex E of IEC-61400-12-1. Uncertainty of measurement is expressed in terms of a “standard uncertainty”, which corresponds to a coverage factor of 1 and a level of confidence of approximately 68%. Standard uncertainty is the root-sum-squared of Type A and Type B uncertainties. Type A uncertainty is determined by statistical means, and is proportional to the standard deviation in the data. Type B uncertainty is calculated as a sum of the uncertainties in the sensors, data acquisition system, terrain, as well as other components. The Type B uncertainties are summarized in Table 12-1 below.
Table 12-1: Type B Uncertainties
Type A uncertainty is calculated for each wind speed bin as the standard deviation of the one-minute mean power values divided by the square root of the number of data sets in each bin. Type B uncertainty is determined from the uncertainty components listed in Table 12-1. Because all
Measurement Component Uncertainty Unit Source
power transducer 0.07 kW manufacturer
current transformer 0.2% manufacturer
voltage transformer 0.0% N/A
data acquisition 0.06 kW manual
anemometer 0.10 m/s specifications
mounting effects 1.0% assumption
terrain effects 3.0% assumption
data acquisition 0.00 m/s manual
temperature sensor 0.23 K calibration documents
radiation shielding 0.00 K N/A
mounting effects 0.04 K calculated
data acquisition 0.09 K manual
pressure sensor 0.18 hPa calibration documents
data acquisition 0.50 hPa manual
*uncertainty due to operational characterisitcs of the anemometer is calculated
according to IEC-61400-12-1, formula I.2, and is dependent on the bin wind speed
**uncertainty due to mounting of the pressure sensor is 10% of the pressure
correction, and varies with temperature.
Power
Wind Speed*
Air Temperature
Air Pressure**
TUBERCLE BLADE POWER PERFORMANCE TEST REPORT- WHALEPOWER CORPORATION
_____________________________________________________________________________________________________
Wind Energy Institute of Canada - 33 - July 2008
components are assumed to be uncorrelated, they are combined using the root-sum-squared method. In order to express all uncertainties in terms of power (i.e.: kW), sensitivity factors are used. The sensitivity factor for wind speed is the local slope of the power versus wind speed curve. The sensitivity factor for air pressure at sea-level air density is equal to the bin average power divided by sea-level barometric pressure (101.3 kPa). The sensitivity factor for air temperature is equal to the bin average power divided by 288.15 K. Both power curve and AEP uncertainties are composed of Type A and Type B uncertainties. The difference between the two is the way in which Type A and Type B uncertainties are combined. Power curve uncertainty is the root sum of the squares of Type A and Type B uncertainties. AEP uncertainty is combined in the same way, except that the for each wind speed, the probability of the wind speed in each bin is added into the calculation.
Uncertainty due to site calibration was not calculated.
13 DEVIATIONS FROM IEC-61400-12-1PROCEDURE
• Site calibration was not undertaken, and uncertainty was calculated assuming that site calibration was not necessary.
• Only two current transformers are used for the data acquisition system. Despite this, uncertainty calculations were done as if three transformers were in use.
• The power transducer was not tested for compliance with IEC 60688 • The current transformers were not tested for compliance with IEC
60044 • The height of the main anemometer is not within 2.5% of hub height.

TUBERCLE BLADE POWER PERFORMANCE TEST REPORT- WHALEPOWER CORPORATION
_____________________________________________________________________________________________________
Wind Energy Institute of Canada - 34 - July 2008

TUBERCLE BLADE POWER PERFORMANCE TEST REPORT- WHALEPOWER CORPORATION
_____________________________________________________________________________________________________
Wind Energy Institute of Canada - 35 - July 2008
APPENDIX A: WEATHER PRAMETERS AT NORTH CAPE
Average annual wind speed at 50m: 8.2 m/s
Predominant wind direction: WNW – WSW
Environment Canada meteorological site data: http://tinyurl.com/2wxmxz
TUBERCLE BLADE POWER PERFORMANCE TEST REPORT- WHALEPOWER CORPORATION
_____________________________________________________________________________________________________
Wind Energy Institute of Canada - 36 - July 2008
APPENDIX B: REJECTION ANGLE CALCULATIONS
All objects/turbines that are highlighted red, cause disturbances.
WHALEPOWER Item: WHALEPOWER MET n 0.14
Height: 27.00 25.00 Zo 0.3
Dia: 10.20 k 0.4
Object Height Width/ Dia.Uh
(m/s)
Distance
To
Turbine
Distance
To
MET
Rejected
Angle
Turbine
Rejected
Angle
MET
WEICan Office 10.00 39.00 5.56 261.39 275.75
Accomadation 10.00 16.00 5.56 237.31 244.86
UNB Building 6.00 16.00 5.00 182.58 205.07
Electric Building 6.00 15.00 5.00 178.55 197.96
Diesel Building 6.00 12.00 5.00 167.10 187.09
Vestas Building 10.00 21.00 5.56 238.82 262.98
Old Shop 6.00 16.00 5.00 136.19 155.75
Vergnet 25.00 15.00 6.35 160.04 167.24 37.33 6.97 44.30 36.67 20.45 57.12
Vergnet 60 shed 3.50 3.00 4.40 110.42 128.18
Vergnet 60 MET(ews) 24.00 0.25 6.35 165.26 161.28
EWS 24.00 15.00 6.35 93.06 107.90 47.62 10.02 57.64 44.39 31.83 76.22
EWS shed 3.50 3.00 4.40 98.25 112.43
EWS MET (ver 60) 26.70 0.25 6.35 95.45 96.12
WhalePower 27.00 10.20 6.35 0.00 38.14 ------- 61.09 80.87 141.96
Wenvor shed 3.50 3.00 4.40 20.13 40.82
Wenvor MET 25.00 0.25 6.35 38.14 0.00 -------
Lagerwey 26.70 18.00 6.35 69.00 107.01 60.35 75.17 135.52 48.62 83.20 131.81
Lagerwey shed 3.50 3.00 4.40 66.19 104.02
Lagerwey MET(wvrUNB) 26.70 0.25 6.35 107.87 141.50
Bornay 20.00 3.60 6.15 80.92 61.91 31.39 201.19 232.59
ARE 20.00 3.60 6.15 64.01 43.22 31.07 234.87 265.93 35.62 197.20 232.82
Skystream 10.10 3.72 6.15 108.35 87.58
SWTB shed 3.50 3.00 4.40 65.44 54.51
SWTB MET 20.00 0.25 6.15 77.33 52.66
Windmatic 26.70 10.00 6.35 102.88 121.62 37.89 161.92 199.81 35.44 146.07 181.51
Windmatic shed 4.00 4.00 4.80 92.99 108.64
Windmaticc MET 26.70 0.25 6.35 104.90 109.27
Wenvor UNB 25.00 15.00 6.35 128.73 160.11 40.96 51.72 92.68 37.32 62.20 99.52
Wenvo rUNB MET 26.70 0.25 6.35 107.87 141.50
ETS3 62.00 0.50 7.70 58.01 54.82
N1 - V47 50.00 47.00 7.60 276.32 312.85 48.88 69.20 118.08 46.04 72.75 118.79
N2 - V47 50.00 47.00 7.60 175.01 209.07 61.22 110.24 171.46 56.09 107.67 163.75
N3 - V47 50.00 47.00 7.60 226.86 232.15 53.86 171.27 225.13 53.25 162.13 215.38
N4 - V47 50.00 47.00 7.60 403.20 398.85 40.96 190.18 231.14 41.16 184.67 225.83
Rejected angle
range (Turbine)
Rejected angle
range (MET)
Effect on Turbine Effect on MET Tower

TUBERCLE BLADE POWER PERFORMANCE TEST REPORT- WHALEPOWER CORPORATION
_____________________________________________________________________________________________________
Wind Energy Institute of Canada - 37 - July 2008
APPENDIX C: WENVOR LOG BOOK FOR THE YEAR 2008
• Day 47 to 51 (February 16th-20th): - Broken anemometer
• Day 51 (February 20th):
- Replaced anemometer
• Day 52 (February 21st): - Changed Programming - UNB students arrived
• Day 54 (February 23rd): - UNB students caused power outage on site
• Day 57, 58 (February 26th, 27th):
- Icing on site
• Day 69 (March 9th): - Replaced UPS
• Day 94 (April 3rd):
- Breaker tripped, offline
• Day 105-119 (April 14th – 28th): - Defective (intermittent) anemometer cable
• Day 129-141 (May 8th – 20th):
- Turbine taken down due to site construction