Embed Size (px)
Citation preview
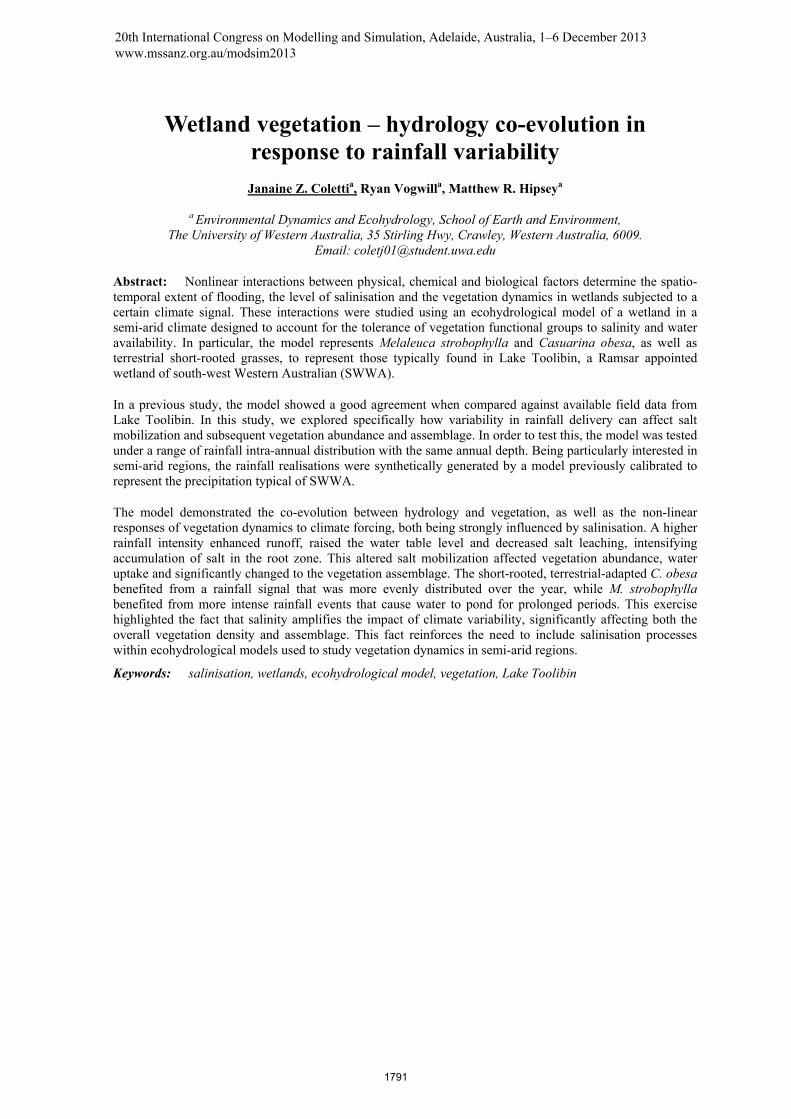
Wetland vegetation – hydrology co-evolution in response to rainfall variability
Janaine Z. Colettia, Ryan Vogwilla, Matthew R. Hipseya
a Environmental Dynamics and Ecohydrology, School of Earth and Environment, The University of Western Australia, 35 Stirling Hwy, Crawley, Western Australia, 6009.
Email: [email protected]
Abstract: Nonlinear interactions between physical, chemical and biological factors determine the spatio-temporal extent of flooding, the level of salinisation and the vegetation dynamics in wetlands subjected to a certain climate signal. These interactions were studied using an ecohydrological model of a wetland in a semi-arid climate designed to account for the tolerance of vegetation functional groups to salinity and water availability. In particular, the model represents Melaleuca strobophylla and Casuarina obesa, as well as terrestrial short-rooted grasses, to represent those typically found in Lake Toolibin, a Ramsar appointed wetland of south-west Western Australian (SWWA).
In a previous study, the model showed a good agreement when compared against available field data from Lake Toolibin. In this study, we explored specifically how variability in rainfall delivery can affect salt mobilization and subsequent vegetation abundance and assemblage. In order to test this, the model was tested under a range of rainfall intra-annual distribution with the same annual depth. Being particularly interested in semi-arid regions, the rainfall realisations were synthetically generated by a model previously calibrated to represent the precipitation typical of SWWA.
The model demonstrated the co-evolution between hydrology and vegetation, as well as the non-linear responses of vegetation dynamics to climate forcing, both being strongly influenced by salinisation. A higher rainfall intensity enhanced runoff, raised the water table level and decreased salt leaching, intensifying accumulation of salt in the root zone. This altered salt mobilization affected vegetation abundance, water uptake and significantly changed to the vegetation assemblage. The short-rooted, terrestrial-adapted C. obesa benefited from a rainfall signal that was more evenly distributed over the year, while M. strobophylla benefited from more intense rainfall events that cause water to pond for prolonged periods. This exercise highlighted the fact that salinity amplifies the impact of climate variability, significantly affecting both the overall vegetation density and assemblage. This fact reinforces the need to include salinisation processes within ecohydrological models used to study vegetation dynamics in semi-arid regions.
Keywords: salinisation, wetlands, ecohydrological model, vegetation, Lake Toolibin
20th International Congress on Modelling and Simulation, Adelaide, Australia, 1–6 December 2013 www.mssanz.org.au/modsim2013
1791
Coletti et al., Vegetation–hydrology co-evolution in wetlands as a response to rainfall variability
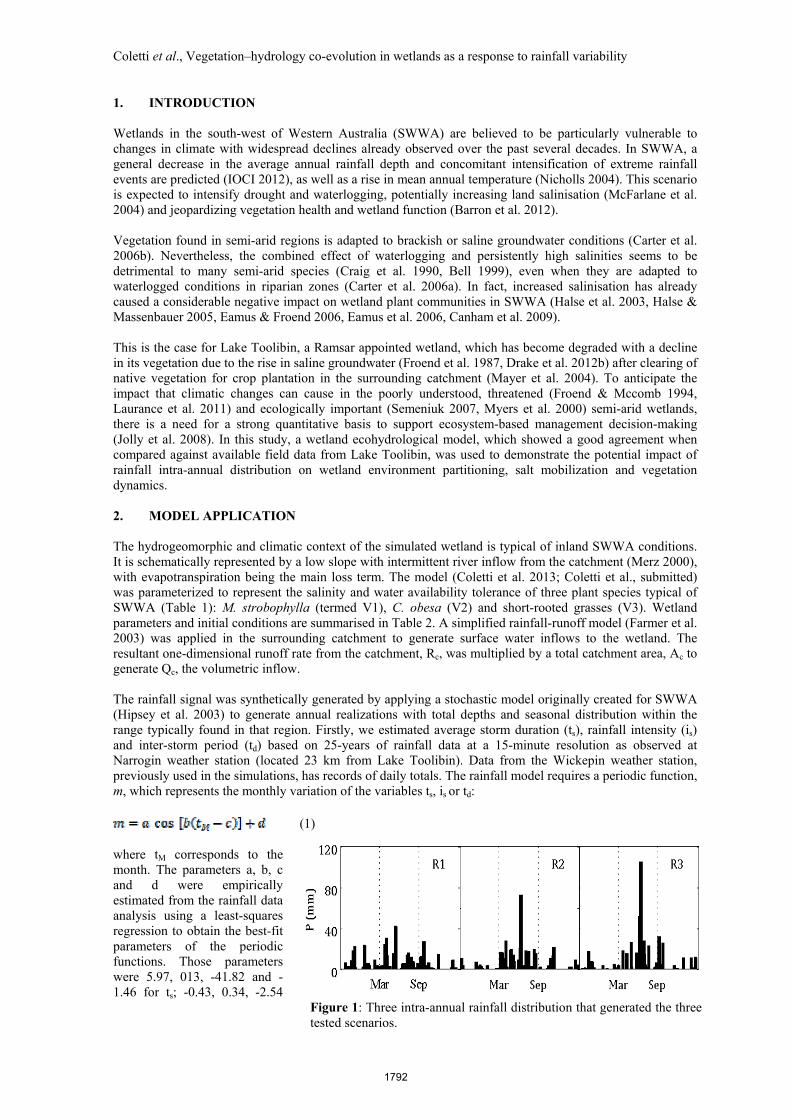
Figure 1: Three intra-annual rainfall distribution that generated the three tested scenarios.
1. INTRODUCTION Wetlands in the south-west of Western Australia (SWWA) are believed to be particularly vulnerable to changes in climate with widespread declines already observed over the past several decades. In SWWA, a general decrease in the average annual rainfall depth and concomitant intensification of extreme rainfall events are predicted (IOCI 2012), as well as a rise in mean annual temperature (Nicholls 2004). This scenario is expected to intensify drought and waterlogging, potentially increasing land salinisation (McFarlane et al. 2004) and jeopardizing vegetation health and wetland function (Barron et al. 2012). Vegetation found in semi-arid regions is adapted to brackish or saline groundwater conditions (Carter et al. 2006b). Nevertheless, the combined effect of waterlogging and persistently high salinities seems to be detrimental to many semi-arid species (Craig et al. 1990, Bell 1999), even when they are adapted to waterlogged conditions in riparian zones (Carter et al. 2006a). In fact, increased salinisation has already caused a considerable negative impact on wetland plant communities in SWWA (Halse et al. 2003, Halse & Massenbauer 2005, Eamus & Froend 2006, Eamus et al. 2006, Canham et al. 2009). This is the case for Lake Toolibin, a Ramsar appointed wetland, which has become degraded with a decline in its vegetation due to the rise in saline groundwater (Froend et al. 1987, Drake et al. 2012b) after clearing of native vegetation for crop plantation in the surrounding catchment (Mayer et al. 2004). To anticipate the impact that climatic changes can cause in the poorly understood, threatened (Froend & Mccomb 1994, Laurance et al. 2011) and ecologically important (Semeniuk 2007, Myers et al. 2000) semi-arid wetlands, there is a need for a strong quantitative basis to support ecosystem-based management decision-making (Jolly et al. 2008). In this study, a wetland ecohydrological model, which showed a good agreement when compared against available field data from Lake Toolibin, was used to demonstrate the potential impact of rainfall intra-annual distribution on wetland environment partitioning, salt mobilization and vegetation dynamics. 2. MODEL APPLICATION
The hydrogeomorphic and climatic context of the simulated wetland is typical of inland SWWA conditions. It is schematically represented by a low slope with intermittent river inflow from the catchment (Merz 2000), with evapotranspiration being the main loss term. The model (Coletti et al. 2013; Coletti et al., submitted) was parameterized to represent the salinity and water availability tolerance of three plant species typical of SWWA (Table 1): M. strobophylla (termed V1), C. obesa (V2) and short-rooted grasses (V3). Wetland parameters and initial conditions are summarised in Table 2. A simplified rainfall-runoff model (Farmer et al. 2003) was applied in the surrounding catchment to generate surface water inflows to the wetland. The resultant one-dimensional runoff rate from the catchment, Rc, was multiplied by a total catchment area, Ac to generate Qc, the volumetric inflow. The rainfall signal was synthetically generated by applying a stochastic model originally created for SWWA (Hipsey et al. 2003) to generate annual realizations with total depths and seasonal distribution within the range typically found in that region. Firstly, we estimated average storm duration (ts), rainfall intensity (is) and inter-storm period (td) based on 25-years of rainfall data at a 15-minute resolution as observed at Narrogin weather station (located 23 km from Lake Toolibin). Data from the Wickepin weather station, previously used in the simulations, has records of daily totals. The rainfall model requires a periodic function, m, which represents the monthly variation of the variables ts, is or td:
(1) where tM corresponds to the month. The parameters a, b, c and d were empirically estimated from the rainfall data analysis using a least-squares regression to obtain the best-fit parameters of the periodic functions. Those parameters were 5.97, 013, -41.82 and -1.46 for ts; -0.43, 0.34, -2.54
1792
Coletti et al., Vegetation–hydrology co-evolution in wetlands as a response to rainfall variability
and 0.52 for is, and -0.56, 22.74 and 123.7 for td. They correspond to maximum ts of 4.5 hours, maximum is of 1 mm per hour, and maximum td of 200 hours. Those parameters were subsequently used as inputs to randomly generate one year of synthetic data for precipitation at 15-minute resolution. Secondly, to manipulate the seasonality of the rainfall, a, b, c and d were adjusted to create 3 rainfall time series with distinct delivery patterns. The sequences were based on changes in inter- rainfall intensity (is) and storm period (td) but with the same total rainfall depth, set as 480 mm per year. Specifically, we generated rainfall time series using the stochastic model described above with values of is and td of 1, 1.15 and 1.8 mm h-1, and 200, 250 and 300 hours, respectively, creating scenarios R1, R2 and R3 (Figure 1). Note that the time-series were accumulated to have 1 day resolution. To allow the system to reach dynamic equilibrium (quasi-steady state), the three annual rainfall time series were repeated 30 times, so each simulation comprised 30 identical years. The results reported in this section refer to the averages for the last 10 years of simulation. Table 1: Vegetation parameters used in the simulations.
Parameter/Symbol V1 V2 V3* Reference Strategy representation based on
Melaleuca strobophylla
Casuarina obesa
grasses (Drake et al. 2012b, Bell 1999)
Total root depth, hr 3 m 1.5 m 0.5 m (Drake et al. 2012b) Preferential uptake depth observed in the field
10cm above hS
1m bgl 0.5 m DEC unpublished data
Soil potential that stops carbon assimilation (Ψsoil= Ψθ+ΨΠ )
-3.7 MPa -5.1 MPa -3.29 MPa (Drake et al. 2012b)
Wilting point, θW ( no salinity restrictions)
0.1 m3m-3 0.07 m3m-3 0.11 m3m-3 (Drake et al. 2012b)
Optimum soil moisture for carbon uptake, θ0
0.45 m3m-3 0.45 m3m-3 0.55 m3m-3 (Drake et al. 2012a)
Maximum salt concentration acceptable in U, ς max U
38 dS m-1 66.5 dS m-1 40 dS m-1 (Drake et al. 2012b)
Maximum salt concentration acceptable in S, ς max S
20 dS m-1 12 dS m-1 - Parameters were based on the fact that both Melaleuca strobophylla and Casuarina obesa can survive under flooded conditions. However, under high salinity and flooded conditions both species decline productivity, specially Casuarina obesa, which decreases its ability of water filtration (Carter et al. 2006a)
Maximum salt concentration acceptable in L, ς max L
3.7 dS m-1 ++ 1.8 dS m-1 + -
Salt concentration actually consumed by plant in U, ς up
U
0.2 kg m-3 0.2 kg m-3 0.2 kg m-3
Salt concentration actually consumed by plant in S, ς up S
0.2 kg m-3 0.3 kg m-3 0.2 kg m-3
Carbon uptake efficiency to reach carbon assimilation rate ηΠ U
1.10 kg C kg CO2
-1 1.05 kg C kg CO2
-1 1.50 kg C kg CO2
-1
Carbon uptake efficiency to reach carbon assimilation rate ηΠ S
0.30 kg C kg CO2
-1 0.20 kg C kg CO2
-1 0 kg C kg CO2
-1
Carbon uptake efficiency to reach carbon assimilation rate ηΠ L
0.90 kg C kg CO2
-1 0.20 kg C kg CO2
-1 0 kg C kg CO2
-1
Respiration to biomass parameter, kR U
50 m2d-1 10 m2d-1 37 m2d-1
Respiration to biomass parameter, kR S
10 m2d-1 10 m2d-1 10 m2d-1
Respiration to biomass parameter, kR L
20 m2d-1 20 m2d-1 20 m2d-1
*Parameters regarding V3 are arbitrarily adjusted to represent the biomass density that was visualized in the field. ++ Slightly saline waters (Brouwer & Heibloem 1986). + Non saline waters(Brouwer & Heibloem 1986).
1793
Coletti et al., Vegetation–hydrology co-evolution in wetlands as a response to rainfall variability
0 0.5 10255075100
AL/AW
Time (%)
R1R2R3
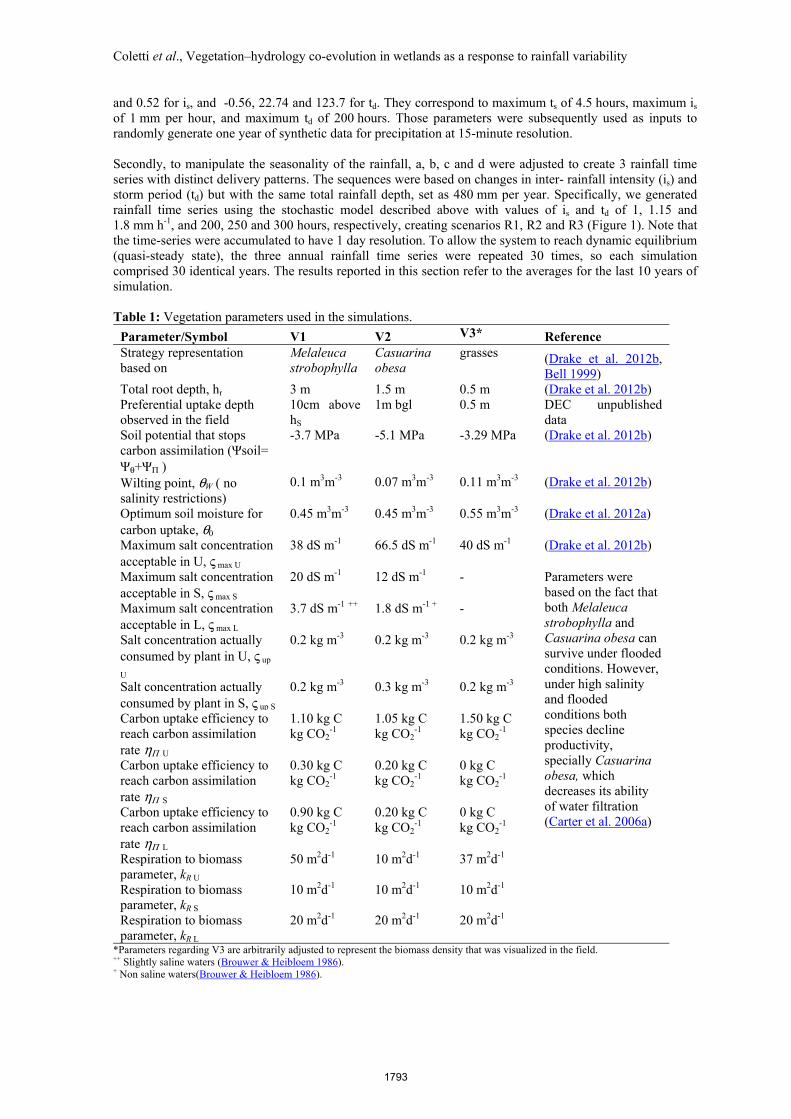
Figure 2: Hydroperiod in response to rainfall intra-annual distribution.
Table 2: Initial conditions and wetland parameters. Parameter Symbo
l Units Value Reference/Remarks
Maximum radius rW m 1060
Idealized topography of Lake Toolibin; Coletti et al 2013.
Maximum depth hW m 4 Maximum area AW m2 3.55× 10⁶ Relation between hL and rL b - 1.77× 10⁻³ Maximum wetland volume (soil + lake volume)
Wmax m3 1.42× 10⁷
Maximum soil volume (function of φ )
mws m3 4.05× 10⁶
Maximum lake volume Lmax m3 3.55× 10⁶ Capillarity rise fraction kA - 10-6 × Ssat DEC, unpublished data. Soil porosity φ m3m-3 0.38 Taplin 2010, Drake et al. 2012b Soil moisture at field capacity φfc m3m-3 0.12 Lowered to represent the quick water
infiltration and lower soil moisture experienced by plants.
Vertical hydraulic conductivity ks m d-1 0.33 Taplin 2010 Vertical hydraulic conductivity after drought
ksd m d-1 17 Drake et al. 2012b
Horizontal hydraulic conductivity
kh m d-1 10× ks Merz 2000
Vertical hydraulic conductivity of the deepest soil layer
αg m d-1 4.4 10-4 Assumed
Albedo - 0.25 Ward & Trimble 2004 Pan-to-lake evaporation factor c - 0.8 Dogramaci et al., 1996.
Variable Initial value
Lake level hL cm 50, George et al., (1997). Water table hS m 0.35× hW Merz, 2000; Barret-Lennard, 2008.
Jolly et al., 2002; Barret-Lennard, 2008.
Soil moisture θ - 0.15
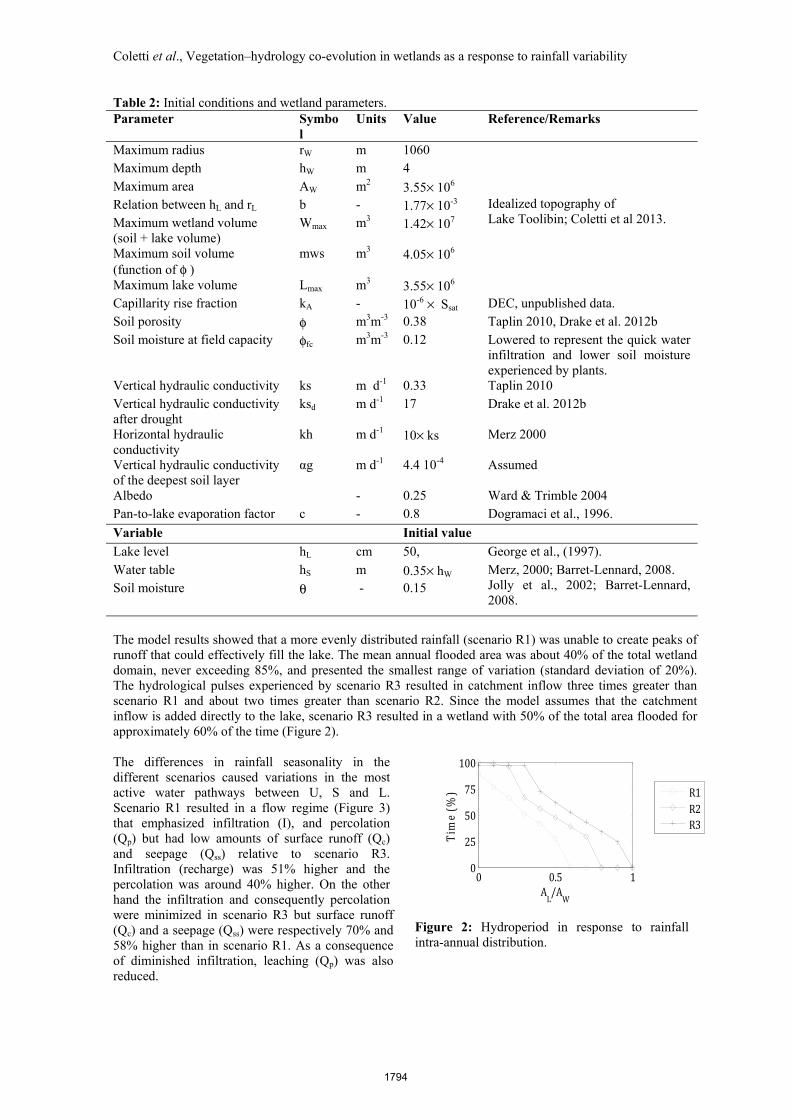
The model results showed that a more evenly distributed rainfall (scenario R1) was unable to create peaks of runoff that could effectively fill the lake. The mean annual flooded area was about 40% of the total wetland domain, never exceeding 85%, and presented the smallest range of variation (standard deviation of 20%). The hydrological pulses experienced by scenario R3 resulted in catchment inflow three times greater than scenario R1 and about two times greater than scenario R2. Since the model assumes that the catchment inflow is added directly to the lake, scenario R3 resulted in a wetland with 50% of the total area flooded for approximately 60% of the time (Figure 2). The differences in rainfall seasonality in the different scenarios caused variations in the most active water pathways between U, S and L. Scenario R1 resulted in a flow regime (Figure 3) that emphasized infiltration (I), and percolation (Qp) but had low amounts of surface runoff (Qc) and seepage (Qss) relative to scenario R3. Infiltration (recharge) was 51% higher and the percolation was around 40% higher. On the other hand the infiltration and consequently percolation were minimized in scenario R3 but surface runoff (Qc) and a seepage (Qss) were respectively 70% and 58% higher than in scenario R1. As a consequence of diminished infiltration, leaching (Qp) was also reduced.
1794
Coletti et al., Vegetation–hydrology co-evolution in wetlands as a response to rainfall variability
Figure 3: Flow pathways and the salinisation response to a rainfall distribution with shorter inter-storm period and lower rainfall intensity (scenario R1).
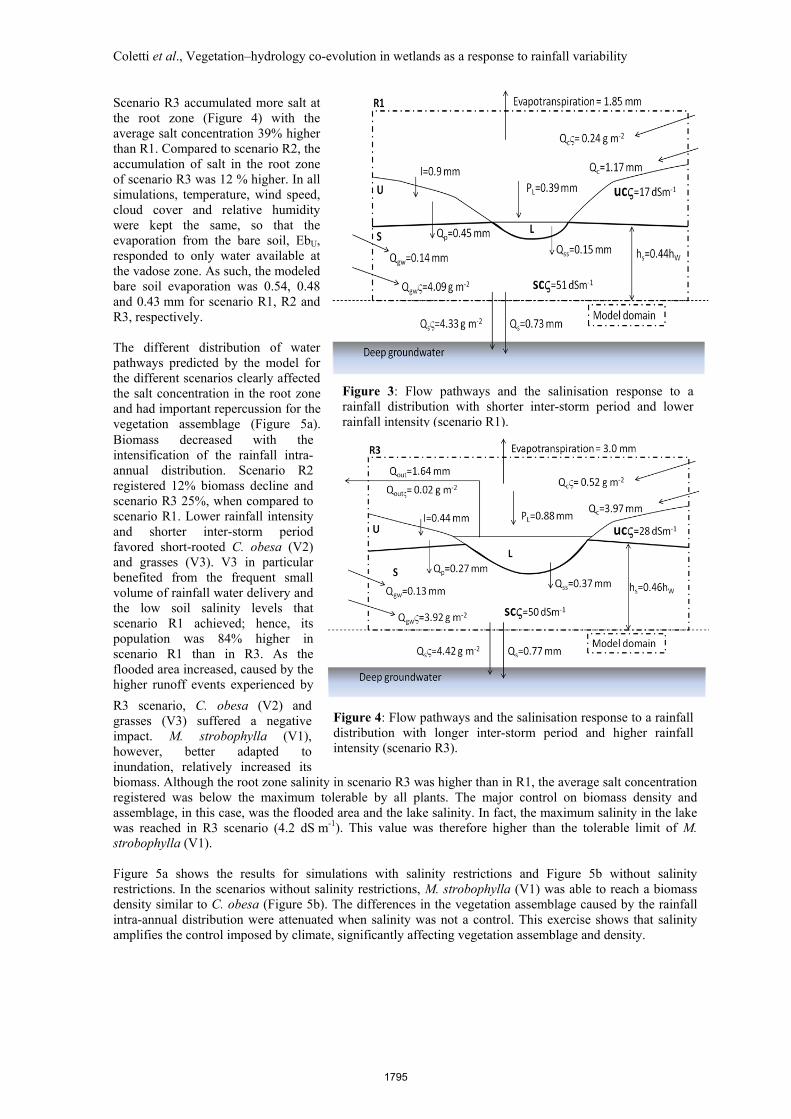
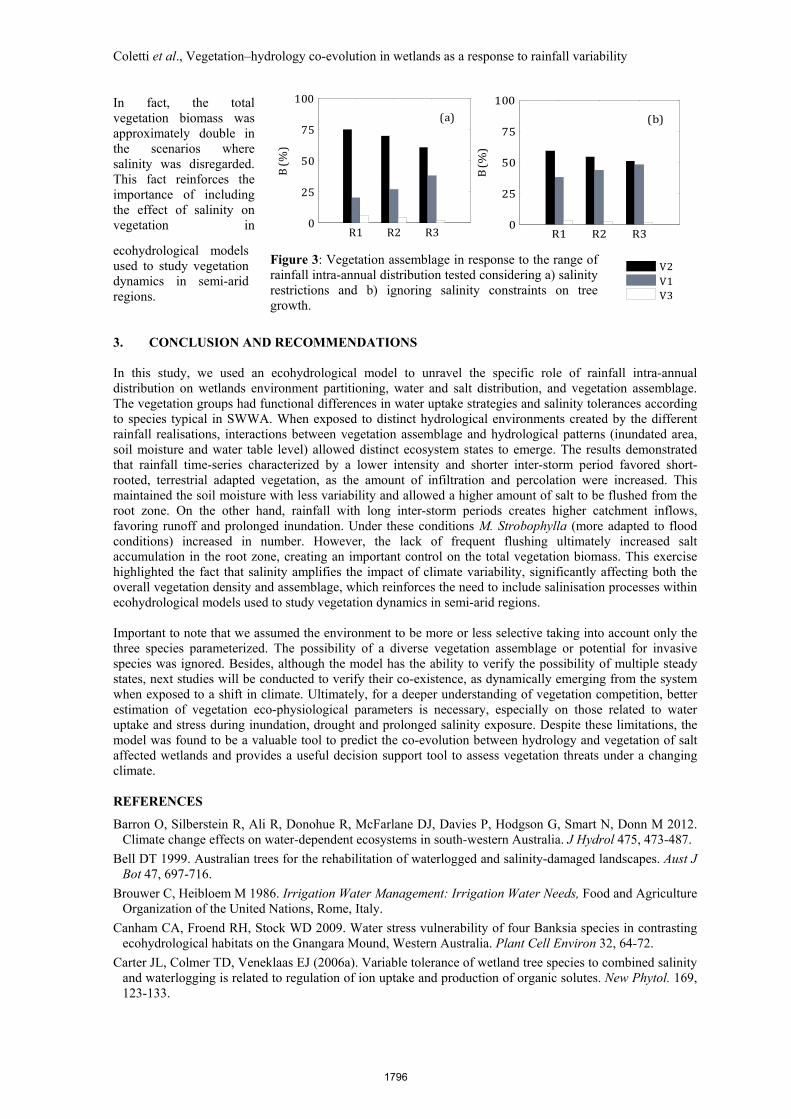
Scenario R3 accumulated more salt at the root zone (Figure 4) with the average salt concentration 39% higher than R1. Compared to scenario R2, the accumulation of salt in the root zone of scenario R3 was 12 % higher. In all simulations, temperature, wind speed, cloud cover and relative humidity were kept the same, so that the evaporation from the bare soil, EbU, responded to only water available at the vadose zone. As such, the modeled bare soil evaporation was 0.54, 0.48 and 0.43 mm for scenario R1, R2 and R3, respectively. The different distribution of water pathways predicted by the model for the different scenarios clearly affected the salt concentration in the root zone and had important repercussion for the vegetation assemblage (Figure 5a). Biomass decreased with the intensification of the rainfall intra-annual distribution. Scenario R2 registered 12% biomass decline and scenario R3 25%, when compared to scenario R1. Lower rainfall intensity and shorter inter-storm period favored short-rooted C. obesa (V2) and grasses (V3). V3 in particular benefited from the frequent small volume of rainfall water delivery and the low soil salinity levels that scenario R1 achieved; hence, its population was 84% higher in scenario R1 than in R3. As the flooded area increased, caused by the higher runoff events experienced by
R3 scenario, C. obesa (V2) and grasses (V3) suffered a negative impact. M. strobophylla (V1), however, better adapted to inundation, relatively increased its biomass. Although the root zone salinity in scenario R3 was higher than in R1, the average salt concentration registered was below the maximum tolerable by all plants. The major control on biomass density and assemblage, in this case, was the flooded area and the lake salinity. In fact, the maximum salinity in the lake was reached in R3 scenario (4.2 dS m-1). This value was therefore higher than the tolerable limit of M. strobophylla (V1). Figure 5a shows the results for simulations with salinity restrictions and Figure 5b without salinity restrictions. In the scenarios without salinity restrictions, M. strobophylla (V1) was able to reach a biomass density similar to C. obesa (Figure 5b). The differences in the vegetation assemblage caused by the rainfall intra-annual distribution were attenuated when salinity was not a control. This exercise shows that salinity amplifies the control imposed by climate, significantly affecting vegetation assemblage and density.
Figure 4: Flow pathways and the salinisation response to a rainfall distribution with longer inter-storm period and higher rainfall intensity (scenario R3).
1795
Coletti et al., Vegetation–hydrology co-evolution in wetlands as a response to rainfall variability
V2V1V3
In fact, the total vegetation biomass was approximately double in the scenarios where salinity was disregarded. This fact reinforces the importance of including the effect of salinity on vegetation in
ecohydrological models used to study vegetation dynamics in semi-arid regions. 3. CONCLUSION AND RECOMMENDATIONS In this study, we used an ecohydrological model to unravel the specific role of rainfall intra-annual distribution on wetlands environment partitioning, water and salt distribution, and vegetation assemblage. The vegetation groups had functional differences in water uptake strategies and salinity tolerances according to species typical in SWWA. When exposed to distinct hydrological environments created by the different rainfall realisations, interactions between vegetation assemblage and hydrological patterns (inundated area, soil moisture and water table level) allowed distinct ecosystem states to emerge. The results demonstrated that rainfall time-series characterized by a lower intensity and shorter inter-storm period favored short-rooted, terrestrial adapted vegetation, as the amount of infiltration and percolation were increased. This maintained the soil moisture with less variability and allowed a higher amount of salt to be flushed from the root zone. On the other hand, rainfall with long inter-storm periods creates higher catchment inflows, favoring runoff and prolonged inundation. Under these conditions M. Strobophylla (more adapted to flood conditions) increased in number. However, the lack of frequent flushing ultimately increased salt accumulation in the root zone, creating an important control on the total vegetation biomass. This exercise highlighted the fact that salinity amplifies the impact of climate variability, significantly affecting both the overall vegetation density and assemblage, which reinforces the need to include salinisation processes within ecohydrological models used to study vegetation dynamics in semi-arid regions. Important to note that we assumed the environment to be more or less selective taking into account only the three species parameterized. The possibility of a diverse vegetation assemblage or potential for invasive species was ignored. Besides, although the model has the ability to verify the possibility of multiple steady states, next studies will be conducted to verify their co-existence, as dynamically emerging from the system when exposed to a shift in climate. Ultimately, for a deeper understanding of vegetation competition, better estimation of vegetation eco-physiological parameters is necessary, especially on those related to water uptake and stress during inundation, drought and prolonged salinity exposure. Despite these limitations, the model was found to be a valuable tool to predict the co-evolution between hydrology and vegetation of salt affected wetlands and provides a useful decision support tool to assess vegetation threats under a changing climate. REFERENCES
Barron O, Silberstein R, Ali R, Donohue R, McFarlane DJ, Davies P, Hodgson G, Smart N, Donn M 2012. Climate change effects on water-dependent ecosystems in south-western Australia. J Hydrol 475, 473-487.
Bell DT 1999. Australian trees for the rehabilitation of waterlogged and salinity-damaged landscapes. Aust J Bot 47, 697-716.
Brouwer C, Heibloem M 1986. Irrigation Water Management: Irrigation Water Needs, Food and Agriculture Organization of the United Nations, Rome, Italy.
Canham CA, Froend RH, Stock WD 2009. Water stress vulnerability of four Banksia species in contrasting ecohydrological habitats on the Gnangara Mound, Western Australia. Plant Cell Environ 32, 64-72.
Carter JL, Colmer TD, Veneklaas EJ (2006a). Variable tolerance of wetland tree species to combined salinity and waterlogging is related to regulation of ion uptake and production of organic solutes. New Phytol. 169, 123-133.
R1 R2 R30255075100
B (%)
(a)
R1 R2 R30255075100
B (%)
(b)
Figure 3: Vegetation assemblage in response to the range of rainfall intra-annual distribution tested considering a) salinity restrictions and b) ignoring salinity constraints on tree growth.
1796
Coletti et al., Vegetation–hydrology co-evolution in wetlands as a response to rainfall variability
Carter JL, Veneklaas EJ, Colmer TD, Eastham J, Hatton TJ (2006b). Contrasting water relations of three coastal tree species with different exposure to salinity. Physiol Plantarum 127, 360-373.
Coletti J, Hinz C, Vogwill R, Hipsey MR (2013). Hydrological controls on carbon metabolism in wetlands. Ecological Modelling 249, 3-18.
Coletti J, Vogwill R, Hinz C, Hipsey MR (2013). A model to explore controls on vegetation-hydrology co-evolution in wetlands. Ecohydrol., submitted.
Craig GF, Bell DT, Atkins CA 1990. Response to Salt and Waterlogging Stress of 10 Taxa of Acacia Selected from Naturally Saline Areas of Western-Australia. Aust J Bot 38, 619-630.
Drake P, Coleman B, Taplin R (2012a). Optimising conditions of the root zone to restore wetland vegetation. In: SERA (ed) Society for Ecological Restoration Australasia Conference. Perth, Australia.
Drake P, Coleman B, Vogwill R (2012b). The response of semi-arid ephemeral wetland plants to flooding: linking water use to hydrological processes. Ecohydrology, DOI: 10.1002/eco.1309.
Eamus D, Froend R (2006). Groundwater-dependent ecosystems: the where, what and why of GDEs. Aust J Bot 54, 91-96.
Eamus D, Hatton T, Cook P, Colvin C (2006). Ecohydrology: Vegetation Function, Water and Resource Mangement, CSIRO Pub.
Farmer D, Sivapalan M, Jothityangkoon C (2003). Climate, soil, and vegetation controls upon the variability of water balance in temperate and semiarid landscapes: Downward approach to water balance analysis. Water Resour Res 39. 1035
Froend RH, Heddle E, Bell D, Mccomb AJ (1987). Effects of salinity and waterlogging on the vegetation of Lake Toolibin, Western Australia. Aust J Ecol 12, 281-298.
Froend RH, Mccomb AJ (1994). Distribution, productivity and reproductive phenology of emergent macrophytes in relation to water regimes at wetlands of South-Western Australia. Aust J Mar Fresh Res 45, 1491-1508.
Halse SA, Massenbauer T (2005). Incorporating research results into wetland management: lessons from recovery catchments in saline landscapes. Hydrobiologia 552, 33-44.
Halse SA, Ruprecht JK, Pinder AM (2003). Salinisation and prospects for biodiversity in rivers and wetlands of south-west Western Australia. Aust J Bot 51, 673-688.
Hipsey MR, Sivapalan M, Menabde M (2003). A risk-based approach to the design of rural water supply catchments across Western Australia. Hydrolog Sci J 48, 709-727.
IOCI (2012). Western Australia's Weather and Climate. In: Bates B, Frederiksen, C., Wormworth, J. (ed) Climate Adaptation Flagship, pp 119. CSIRO and BoM, Australia.
Jolly ID, McEwan K, Holland K 2008. Groundwater - surface water interactions in arid/semi-arid wetlands and the consequences of salinity for wetland ecology. Ecohydrology 1.
Laurance WF, Dell B, Turton SM, Lawes MJ, Hutley LB, McCallum H, Dale P, Bird M, Hardy G, Prideaux G, Gawne B, McMahon CR, Yu R, Hero J-M, Schwarzkopf L, Krockenberger A, Douglas M, Silvester E, Mahony M, Vella K, Saikia U, Wahren C-H, Xu Z, Smith B, Cocklin C (2011). The 10 Australian ecosystems most vulnerable to tipping points. Biol Conserv 144, 1472-1480.
Mayer X, Ruprecht JK, Muirden P, Bari M (2004). A review of stream salinity in the South-West of Western Australia. National Salinity Engineering Conference, pp 61-66. Engineers Australia, Barton, A.C.T.
McFarlane D, George R, Caccetta P (2004). The Extent and Potential Area of Salt-affected Land in Western Australia Estimated Using Remote Sensing and Digital Terrain Models. National Salinity Engineering Conference (1st : 2004 : Perth, W.A.), pp [55]-[60]. Engineers Australia, Barton, A.C.T.
Merz SK (2000). Lake Toolibin Numerical Groundwater Model. CALM WA, Armadale, Australia.
Myers N, Mittermeier RA, Mittermeier CG, da Fonseca GAB, Kent J (2000). Biodiversity hotspots for conservation priorities. Nature 403, 853-858.
Nicholls N (2004). The changing nature of Australian droughts. Climatic Change 63, 323-336.
Semeniuk C (2007). The Becher wetlands, a Ramsar site: evolution of wetlands habitats and vegetation associations on a Holocene coastal plain, South-Western Australia, Springer, Dordrecht, The Netherlands
Taplin R (2010). Time scales of a wetland regime: impacts of climate and management on Lake Toolibin, WA. School of Earth and Environment, pp 76. The University of Western Australia, Perth, Australia.
Ward A, Trimble S (2004). Enviromental Hydrology, Lewis Publ.
1797