Embed Size (px)
Citation preview
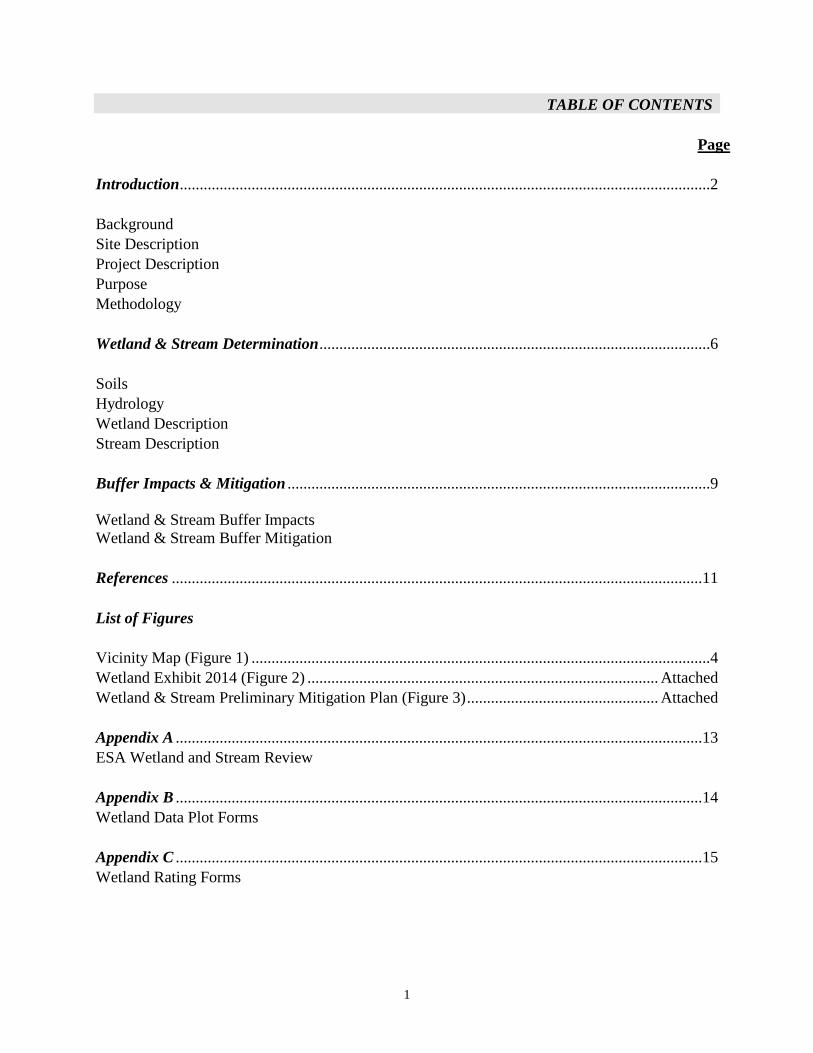
WETLAND & STREAM DETERMINATION
AND PRELIMINARY BUFFER MITIGATION
RIVA TOWNHOMES
Site Development Permit
City of Issaquah, Washington
Prepared for:
Aron Golden Conner Homes
12600 S.E. 38th Street, Suite 250 Bellevue, WA 98006
Prepared by:
C. Gary Schulz Wetland / Forest Ecologist 7700 S. Lakeridge Drive
Seattle, Washington 98178 206-772-6514
October 14, 2015
1
TABLE OF CONTENTS Page Introduction .....................................................................................................................................2 Background Site Description Project Description Purpose Methodology Wetland & Stream Determination ..................................................................................................6 Soils Hydrology Wetland Description Stream Description Buffer Impacts & Mitigation ..........................................................................................................9 Wetland & Stream Buffer Impacts Wetland & Stream Buffer Mitigation References .....................................................................................................................................11 List of Figures Vicinity Map (Figure 1) ...................................................................................................................4 Wetland Exhibit 2014 (Figure 2) ........................................................................................ Attached Wetland & Stream Preliminary Mitigation Plan (Figure 3) ................................................ Attached Appendix A ....................................................................................................................................13 ESA Wetland and Stream Review Appendix B ....................................................................................................................................14 Wetland Data Plot Forms Appendix C ....................................................................................................................................15 Wetland Rating Forms
2
INTRODUCTION Background A wetland and stream determination was conducted on the Riva Townhomes Property (formerly Issaquah Farms) from July to October 2014 (Wetland and Stream Determination for Issaquah Farms Property (Parcel #042308-9029): City of Issaquah, Schulz 10/14/14). The Property is located along the north side of Newport Way NW at the intersection of NW Oakcrest Dr. and has a total area of 365,304 square feet (8.38 acres) (Figure 1). It appears a wetland boundary was delineated on the Property more than 5 years ago as shown on an older survey of the area (ALTA/ACSM Land Title Survey for Issaquah Farms Associates, LLC - Barghausen Engineers 10/24/08). This wetland report is an update to the previous wetland and stream determination (Schulz 10/14/14) and includes revisions from City peer review, City engineering and planning departments, and a preliminary mitigation plan (conceptual mitigation) to support the proposed Riva Townhomes project. Wetland and stream boundaries were field-delineated and professionally surveyed by Core Design (Issaquah Farms Wetland Exhibit 2014). The Wetland Exhibit - survey drawing is included as Figure 2 to show the Property boundaries, detailed wetland and stream boundary flagging with standard buffers that was submitted with the initial determination report (Schulz 10/14/14). This investigation identified one distinct wetland area (A) crossing onto the Property. Wetland data plots were installed on the site to confirm existing conditions. The City engaged ESA environmental consulting firm to peer review the wetland and stream determination (Appendix A 1/26/15 Letter). An ESA staff fisheries biologist and wetland biologist reviewed the Schulz 2014 report findings and data including a site visit on 1/7/15. ESA verified the Schulz report and concluded that only one significant revision was needed to identify Stream S1 from the Property to its connection with Tibbetts Creek as potential fish-bearing due to the observed continuous flow of water. As a result the tributary - Stream S1 is rated as Class 2S. During the preliminary review period of the proposed project the City of Issaquah secured FEMA funding to relocate Anti-Aircraft Creek (Stream S2) and construct a new conveyance system under Newport Way NW for flood control. The City has initiated its own permitting requirements and plans as a separate project that will be constructed, in part, on the Riva Townhomes Property. The attached Preliminary Wetland & Stream Buffer Mitigation Plan (Figure 3) shows the site plan, the City project, and the resulting wetland and stream boundaries (Sheet L3.01 Core Design 10/16/15).
3
Site Description The subject Property is undeveloped land with the majority being forest habitat. The Property gently slopes down from Newport Way NW towards Tibbetts Creek located east of the site. Most of the forest area is wetland habitat and is located on the lower northern and eastern portions. The upper upland area adjacent to Newport Way NW has been significantly disturbed and is dominated throughout with blackberry shrubs. Two streams, approximately mapped by the City, flow across the Property from west to east. The streams originate in the Cougar Mountain Regional Wildland Park located immediately west of Newport Way NW. Both streams are conveyed under the roadway by culverts. The northern stream is named Anti-aircraft Creek and has been disturbed and altered on the upstream side of Newport Way NW. The Property includes flat and gentle sloping topography oriented north and northeast from Newport Way NW. The upper elevation of about 88 feet along Newport Way extends to down an elevation of 62 feet near the wetland boundary. The tree cover is scattered and primarily deciduous in upland areas. Trees are dominated by big leaf maple (Acer macrophyllum) on the southeast side and black cottonwood (Populus balsamifera) on the northwest side. Shrub cover throughout the upland is dominated by Himalayan blackberry (Rubus discolor) but also includes some salmonberry (Rubus spectabilis), red elderberry (Sambucus racemosa), and Indian plum (Oemleria cerasiformis). The groundcover includes sword fern (Polystichum munitum) but is limited due to the dense cover of blackberry shrubs. Project Description The Riva Townhomes project proposed as a site development permit to provide new residential housing that includes developing 36 townhomes. A critical areas tract or native growth easement will be established for the wetland, streams, and associated buffers. The proposed roadway layout is designed to access the site from Newport Way NW, provide necessary traffic circulation, and avoid direct wetland and stream impacts. Surface water runoff will be collected for detention and water quality treatment in three underground stormwater detention vaults located on developed portions of the Property. Treated stormwater will be conveyed to the wetland buffer and controlled using storm drain dispersal / infiltration trenches.

5
Purpose The purpose of this report is to provide a wetland and stream determination study for the proposed property development. In addition, this study includes wetland and stream buffer mitigation measures intended to meet or exceed City of Issaquah’s critical area regulations included in their municipal code (IMC 18.10). A pre-application meeting was held with City planning and public works staff on 7/27/15. Methodology Typically defined, wetlands are ... "those areas that are inundated or saturated by surface or groundwater at a frequency and duration to support, and that under normal circumstances do support, a prevalence of vegetation typically adapted for life in saturated soil conditions. Wetlands generally include swamps, marshes, bogs, and similar areas". Through the State Environmental Policy Act (SEPA), the Growth Management Act (GMA), and local critical areas regulations, the City reviews proposals that potentially impact wetland and other critical areas. Because of observed site conditions, combined with jurisdictional wetland regulations, wetland presence and extent must be determined for site feasibility or the permitting process. In accordance with current State requirements, the 1987 US Army Corps of Engineers Wetlands Delineation Manual (FICWD 1987) was used for wetland determination. The methodology is based on the presence of dominant hydrophytic vegetation (i.e. plant species adapted to, or tolerant of, growing in saturated soil conditions), hydric soils, and observed wetland hydrology as described in the Manual and consistent with the Regional Supplemental to the Corps of Engineers Wetland Delineation Manual (US Army Corps of Engineers 2010). The Washington State Wetland Rating System for Western Washington (Ecology Pub. # 04-06-025) was used to rate wetlands per the City’s critical areas code (IMC Chapter 18.10.640.C.). The Rating System forms are attached to this report. Data for the wetland determination was collected on the Property during the site investigation. A total of seven wetland data plots were installed to document upland and wetland conditions. Wetland data plot forms are attached to this report and reference their locations relative to surveyed flags. Orange plastic flagging was used to mark the wetland boundary. The on-site streams were delineated using Ordinary High Water Mark (OHWM) where visible. Pink plastic flagging was used to mark the edges of stream on right and left stream banks. Figure 2 is an 11 x 17 inch drawing that depicts the surveyed wetland and stream areas and related buffers (Issaquah Farms Wetland Exhibit, Core Design 2014). Buffers are shown based on City critical areas code and the assessments in this report. The Preliminary Wetland & Stream Buffer Mitigation Plan is also being provided as a full-size, scaled drawing in the permit application submittal.
6
WETLAND & STREAM DETERMINATION The Property was investigated during the period of July - October 2014. Based on the investigation of observed soils, hydrology, and dominant vegetation cover, one wetland (A) was delineated on the Property. The wetland and stream areas have been professionally surveyed as shown on Figure 3 (Preliminary Wetland & Stream Buffer Mitigation Plan - Sheet L3.01 Core Design 10/16/15). Wetland A’s boundary extends onto the Property from the north and continues east towards Tibbetts Creek Soils According to the King County Area - Soil Survey (US Soil Conservation Service 1973), the property is mapped as having Mixed Alluvial Land (Ma). The Mixed Alluvial Land soil series consists of a variety alluvial soils that are individually too small to map as separate units. These soils are sand and gravely sand to silty clay loam. They are well drained to very poorly drained. Very poorly drained soils are typically hydric (wetland) soils. Hydrology Wetland A appears to be a seasonally flooded area supported by shallow groundwater. Surface water was observed in the wetland after recent rainfall. However, the soil excavations along the wetland boundary did not observed groundwater or saturation. The wetland appears to drain towards Tibbetts Creek but a distinct upland berm is present between the Creek’s floodway channel and Wetland A. Tibbetts Creek runs along the eastern side of the Property and flows north towards Lake Sammamish. Wetland Description Wetland A Wetland A is a sloped and depression area on the site that extends to the north near Tibbetts Creek. The off-site portion on the north is very disturbed and was cleared years ago probably for pasture. Wetland A’s habitat functions are higher on the Property. Wetland hydrology is influenced by shallow groundwater and local rainfall. The on-site portion of Wetland A is forested with the tree cover dominated by red alder (Alnus rubra) and some scattered Pacific willow (Salix lasiandra). The shrub cover is dense
7
salmonberry (Rubus spectabilis) and Himalayan blackberry (Rubus discolor). Red osier dogwood (Cornus stolonifera) and red elderberry (Sambucus racemosa) shrubs are also present. The groundcover vegetation is diverse with dominant cover of skunk cabbage (Lysichiton americanum), lady fern (Athyrium felix-femina), and giant horsetail (Equisetum telmateia). There is significant cover of slough sedge (Carex obnupta), tall mannagrass (Glyceria elata), and hedge nettle (Stachys ciliata). Very dark brown, low chroma value (7.5YR 4/1) mineral soil was observed within the upper layer of soil in the wetland. Redoximorphic indicators (mottling) were also present in the wetland soil excavations. In accordance with the Washington State Wetland Rating System, this wetland was rated as Category II having a total score of 61 points with 19 Habitat points. Based on the City’s critical areas code, Category II wetlands with a Habitat score of less than 22 points have a standard buffer of 75 feet (Chapter 18.10.640.C.). Stream Description The stream assessments for the Property have been verified by the City and revised as needed (Appendix A). The preliminary assessment was focused on the potential for fish use in the upper segments of both on-site streams. A number of site visits were conducted to review the streams related to physical characteristics, hydrology, and potential fish use. Photographs of both streams (S1 and S2) were included in the initial wetland and stream determination report (10/14/14 Schulz). Stream S1 Stream S1 enters the Property at the southern “triangular” corner. It is conveyed under the roadway by an old concrete box culvert. The stream flows north into Wetland A at Flag #S1-9. At this point the stream channel ends in a stand of mostly skunk cabbage. Approximately 20 feet below S1-9 the stream emerges as a narrow channel. Between these points there is no visible stream channel but surface flow observed during the peer review in January 2015. The lower channel continues to an outlet that is connected to the Tibbetts Creek floodway area. The Creek floodway is described as a wetland bench area that is elevated more than 1 foot above the main Creek channel. The stream varies in width from several feet to less than 1 foot. Some portions of the channel are hard to see and overgrown by blackberry shrubs. The physical characteristics are described as a relatively flat channel with portions that are very narrow. Most of the upper channel segment above Flag #S1-9 does not have stream banks but gravels are visible from surface water flows. Typical stream habitats (pools, riffles, glides, rapids) are not present. Several portions are
8
described as gravel washouts. This stream has intermittent flows and was still dry during this month of October. Based on the observed stream flow during the winter the City peer review determined the upper portion of this stream can support fish. The stream rating for the on-site segment was determined to be Class 2S used by salmonids (IMC 18.10.780.B.). Class 2S streams have a standard buffer of 100 feet (IMC 18.10.785.C.2.). Stream S2 Stream S2 (Anti-aircraft Creek) flows onto the Property at the northern “triangular” corner adjacent to Newport Way NW. It is conveyed under the roadway by culvert connections that divert the drainage into a right-of-way ditch and then into a culvert under the roadway. The stream flows south and east into Wetland A. At the point Flag #S2-18 it enters the wetland. The stream channel ends in a stand of mostly reed canarygrass. Approximately 30 feet below S2-18 the stream emerges into a channel approximately 3 feet wide. Because there is no visible stream channel water appears to flow subsurface between these points (Stream Flags #S2-18/S-18A and #1L/1R). The lower segment of stream channel continues to an outlet that is connected to the Tibbetts Creek floodway area. The Creek floodway is described as a wetland bench area that is elevated more than 1 foot above the main Creek channel. Surface water with low gradient flow was observed in the lower portion of Stream S2 after recent rainfall. The description of Stream S2 is similar to Stream S1. This stream also varies in width from several feet to less than 1.5 feet. The uppermost portion near the roadway is a deeply incised channel. About 60 feet below the roadway the channel is hard to see and overgrown by blackberry shrubs. The upper portion of this stream has intermittent flows and was still dry during this month of October. The physical characteristics are described as a deeply incised channel that changes to a flat and narrow channel within a short distance. Most of the upper channel segment above Flag #S2-18 does not have significant stream banks but gravels are visible from surface water flows. Typical stream habitats (pools, riffles, glides, rapids) are not present. Based on the described observations Stream S2 has a fish barrier because there is no conveyance channel or flow that fish could move through to reach the upper portion. Stream S2 has intermittent or ephemeral water flow. The City peer review determined the upper segment of this stream does not support salmonid fish. Therefore, the stream rating for the upper segment is a Class 3 with a standard buffer of 50 feet (IMC 18.10.780.D. & 18.10.785.C.4.).
9
BUFFER IMPACTS & MITIGATION This section addresses wetland buffer impacts, reductions, and mitigation measures. The project has several locations where temporary wetland buffer impacts would occur adjacent to new construction activities. The majority of these locations are directly related to the construction and grading. A total of four stormwater dispersal trenches are planned in the wetland buffer. Due to past disturbances and lack of native vegetation cover in the wetland and stream buffers, reduced buffers with enhancements are proposed. Critical area buffer standards and mitigation measures are discussed as follows. Wetland & Stream Buffer Impacts Temporary Buffer Impacts The project site exists several feet below the roadway grade of Newport Way NW. Proposed grading or filling of the project site is necessary for proper access to and from Newport Way NW. In order to reasonably develop the project site as planned the outer edge of the wetland buffer would be filled in several locations. A small area of fill is also planned in the buffer of Stream S1 related to roadway design. These areas are also part of the buffer areas that would be enhanced and replanted with native vegetation as mitigation for allowed buffer reduction. The dominant vegetation cover throughout is Himalayan blackberry shrubs. There are four locations on the project site where temporary buffer impacts could occur for the installation of stormwater dispersal / infiltration trenches. Treated stormwater runoff would be discharged to Wetland A via the dispersal trenches. Due to the site sloping down to Wetland A the outlets of the stormwater detention vaults and related elevations require the dispersal trenches be installed in the wetland buffer. The dispersal trenches are typically designed to infiltrate and spread out the stormwater leaving the detention vaults. Typically impacts associated with installation are minimal grading and vegetation removal. The wetland boundary and adjacent wetland buffer areas have low gradient slopes oriented to the north. These sloping areas have shallow groundwater discharging into the lower depressional portion of the wetland. The stormwater dispersal trenches will be located on sloping areas with gradients that range from 5 to 8 percent slopes. This detailed information is shown on the Onsite Utility Plan (Sheet SDP-06 Core Design 10/16/15). Due to sloping conditions and natural groundwater discharge there are no anticipated wetland impacts from hydrology related to the dispersal trenches. The site grading and stormwater dispersal trenches are also shown on Figure 3 (attached).
10
Wetland & Stream Buffer Reduction The Riva Townhomes Property has nearly 75 percent of its area in critical areas. Due to the constraints wetland and stream buffers are proposed to be reduced as part of the City’s code standards. The standards for wetland buffer reduction with enhancement are found in IMC 18.10.650. The similar standards for stream buffer reduction are found in IMC 18.10.790. Theses standards allow for a 25 percent reduction in buffer width with an approved enhancement – mitigation plan. The criteria for buffer reduction includes more than 40 percent of the buffer area is covered by non-native and/or invasive plant species; or tree and/or shrub vegetation cover less than 25 percent of the buffer area; and the wetland / stream buffer has slopes of less than 25 percent (IMC 18.10.650.D.3. & 18.10.790.D.4.) The buffer areas have slopes that are less than 25 percent. The buffers have a dominant and dense cover of non-native blackberry with tree cover estimated as less than 25 percent in the buffer areas. The project site has disturbed conditions that would allow for buffer reduction with mitigation improvements. Wetland & Stream Buffer Mitigation Potential impacts to buffer areas from grading and the installation of stormwater dispersal trenches are temporary and can be restored to natural conditions. Trees and shrubs with native groundcover or seeding can restore the areas that are graded. These areas will have complete blackberry shrub removal and then be replanted. The stormwater dispersal trenches are linear and narrow areas. Required excavation is shallow and will be restored with the proposed buffer enhancement. The trenches areas can be replanted using willow live stakes Wetland A Wetland A’s standard buffer of 75 feet can be reduced to 56.25 feet. The proposed area of buffer reduction (12,875 square feet) would be mitigated with the enhancement of the entire buffer area (40,800 square feet) proposed for buffer reduction. This provides an enhanced wetland buffer area that is greater than the reduction. Areas and a list of plant species are shown on Figure 3.
11
Stream S1 A relatively small portion of the stream buffer is proposed for reduction. The standard buffer of 100 feet can be reduced to 75 feet. The proposed area of buffer reduction (3,769 square feet) would be mitigated with the enhanced buffer area (15,113 square feet). This provides an enhanced stream buffer area that is greater than the reduction. The Preliminary Buffer Mitigation Plan (Figure 3) depicts the areas proposed for enhancement and a list of native trees and shrubs appropriate to increase vegetative structure, add plant diversity, and increase overall buffer functions. Per the standards of IMC 18.10, the proposed buffer enhancement plan will remove all invasive, non-native vegetation; plant appropriate native tree and shrub species at a minimum planting density of ten feet on center for trees and five feet on center for shrubs; and provide a monitoring and maintenance plan for the buffer for a five year period. In addition, the final enhancement – mitigation plan will incorporate the King County Critical Areas Mitigation Guidelines (2012) for planting installation, maintenance, and monitoring.
12
REFERENCES Core Design, 2015. Preliminary Wetland & Stream Buffer Mitigation Plan – Riva Townhomes for Conner Homes 10/16/15. City of Issaquah. 2013. City of Issaquah Municipal Code (Chapter 18.10 – Critical Areas Regulations). Cowardin, L., V. Carter, F. Golet, and E. LaRoe. 1979. Classification of Wetlands and Deepwater Habitats of the United States. Office of Biological Services, Fish and Wildlife Service, United states Department of the Interior, FWS/OBS-79-31. Environmental Laboratory. 1987. "Corps of Engineers Wetlands Delineation Manual," Technical Report Y-87-1, U.S. Army Engineer Waterways Experiment Station, Vicksburg, Miss. ESA. 2015. “Wetland and Stream Review for Issaquah Farms Property”, 1/26/15 City peer review letter. Hitchcock, C.L., A. Cronquist, M. Ownbey, and J.W. Thompson. 1977. Vascular Plants of the Pacific Northwest. University Press Seattle, Washington. Soil Conservation Service. 1985. Hydric Soils of the State of Washington. U.S. Department of Agriculture, Washington, D.C. US Army Corps of Engineers. 2010. Regional Supplement to the Corps of Engineers Wetland Delineation Manual: Western Mountains, Valleys, and Coast Region (Version 2.0). United States Department of Agriculture, Soil Conservation Service. 1973. Soil Survey of King
County Area, Washington. Prepared in cooperation with Washington Agricultural Experiment Station. Hruby, T. 2004. Washington State Wetland Rating System for Western Washington State - Revised. Washington State Department of Ecology Publication # 04-06-025.

13
APPENDIX A
ESA WETLAND and STREAM REVIEW
5309 Shilshole Avenue NW
Suite 200
Seattle, WA 98107
206.789.9658 phone
206.789.9684 fax
www.esassoc.com
January 26, 2015
Mr. Peter Rosen
Environmental Planner
City of Issaquah
Development Services Department
PO Box 1307
Issaquah, WA 98027-1307
Subject: Wetland and Stream Review for Issaquah Farms Property
Dear Peter:
This letter summarizes ESA’s independent review of a wetland and stream determination on the Issaquah Farms
Property (Parcel #042308-9029). The original determination was prepared by Gary Shulz, on behalf of the
developer and permit applicant, Derek Doke. Our review is based upon our site reconnaissance conducted with
you and Mr. Shulz on January 7, 2015.
Weather conditions during the site visit were dry, with the last reported rainfall of approximately 0.32 inches
falling three days earlier on January 4, 2015 (NWS, 2015). Month-to-date rainfall in the area was reported
approximately 0.78 inches. The following text summarizes the results of the field reconnaissance and provides a
rationale for our findings.
Stream Determination
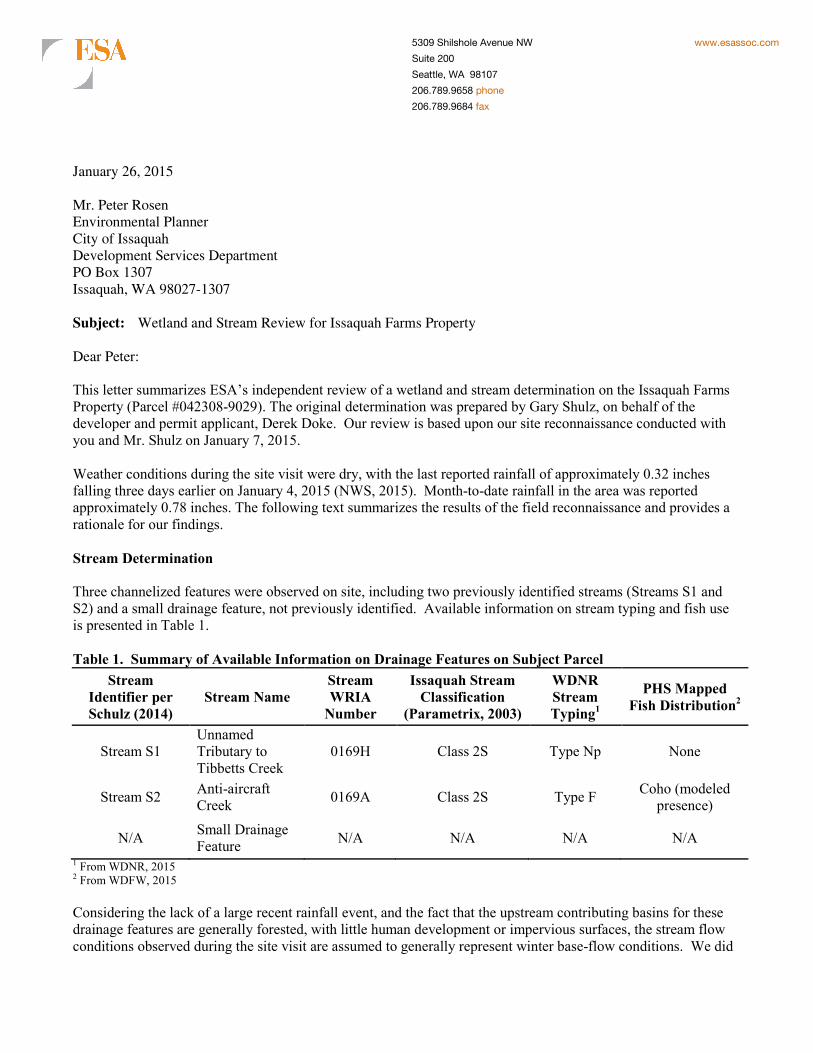
Three channelized features were observed on site, including two previously identified streams (Streams S1 and
S2) and a small drainage feature, not previously identified. Available information on stream typing and fish use
is presented in Table 1.
Table 1. Summary of Available Information on Drainage Features on Subject Parcel
Stream
Identifier per
Schulz (2014)
Stream Name
Stream
WRIA
Number
Issaquah Stream
Classification
(Parametrix, 2003)
WDNR
Stream
Typing1
PHS Mapped
Fish Distribution2
Stream S1
Unnamed
Tributary to
Tibbetts Creek
0169H Class 2S Type Np None
Stream S2 Anti-aircraft
Creek 0169A Class 2S Type F
Coho (modeled
presence)
N/A Small Drainage
Feature N/A N/A N/A N/A
1 From WDNR, 2015 2 From WDFW, 2015
Considering the lack of a large recent rainfall event, and the fact that the upstream contributing basins for these
drainage features are generally forested, with little human development or impervious surfaces, the stream flow
conditions observed during the site visit are assumed to generally represent winter base-flow conditions. We did
Mr. Peter Rosen Issaquah Farms Review January 23, 2015 Page 2
not observe signs of channel erosion or incision and there was little indication of flashy flows. These observations
are consistent with largely undeveloped basin conditions, w. The following discussion summarizes observed
stream flow and habitat conditions within each of the observed drainage features.
Stream S1
Based on conditions he observed in fall 2014, Gary Schulz identified the upper portion of Stream S1 as a Class 3
stream (intermittent or ephemeral during years of normal rainfall and not used by salmonids) requiring a 50-foot
buffer (Issaquah Municipal Code [IMC] 18.10.780.D, 18.10.785.C).
At the time of our site visit, Stream S1 had substantial surface flow from Newport Way NW to its confluence
with Tibbetts Creek. A continuous stream channel with bed and bank was present over the entire observed reach,
although flow was also dispersed into multiple flow-paths near the boundary of Wetland A. The mouth of the
stream had a slight drop into Tibbetts Creek (<1.5 feet total vertical drop over approximately 10 feet of channel
length); however entry of fish (juvenile or adult) is not precluded based on slope (<16 percent) or drop height of
individual steps (< 0.8 feet). A majority of the stream bed consisted of gravels and small cobbles, with the
remainder of the bed consisting of silts and sands. Average stream width is approximately 2 to 3 feet over the
observed reach. The applicant’s flagging of the stream’s ordinary high water mark (OHWM) appeared to be
accurate.
Stream flow is likely intermittent, based on observed habitat and flow conditions, as well as information provided
by the City (K. Ritland, 2015 personal communication). The stream is mapped by DNR as non-fish bearing
(WDNR, 2015), although the location of the stream is mismapped, as it is shown confluencing with Stream S2,
not Tibbetts Creek. However, based on the results of the site visit, the stream may support fish, including
salmonids, between the fall and the spring. As no features were noted that would prevent fish access or
upstream/downstream migration of salmonids (particularly juvenile salmonids) and suitable habitat is present
within the subject parcel, it is our recommendation that the appropriate City Stream Type for the reach of
Stream 1 downstream of Newport Way NW to the stream mouth at Tibbetts Creek should be Class 2S. The
required buffer for Class 2S streams in Issaquah is 100 feet (IMC 18.10.785.C).
Stream S2
Gary Schulz identified the upper portion of Stream S2 as a Class 3 stream (intermittent or ephemeral during years
of normal rainfall and not used by salmonids) requiring a 50-foot buffer (IMC 18.10.780.D, 18.10.785.C).
At the time of the site visit, Stream S2, also known as Anti-Aircraft Creek, demonstrated substantial surface flow
from upstream of Newport Way NW to the stream confluence with Tibbetts Creek. Stream flow is likely
intermittent based on recorded stream flow conditions from October and November and information provided by
the City (K. Ritland, 2015 personal communication). It appears the hydrology of the stream is relatively natural
fed by wintertime baseflow from Cougar Mountain, which is heavily forested. Although we saw no obvious
signs of erosion at the project site, the stream reach above Newport Way acts as a sediment trap during large,
infrequent storm events (K. Ritland, 2015 personal communication). These large storm events have resulted in
flooding of Newport Way.
Mr. Peter Rosen Issaquah Farms Review January 23, 2015 Page 3
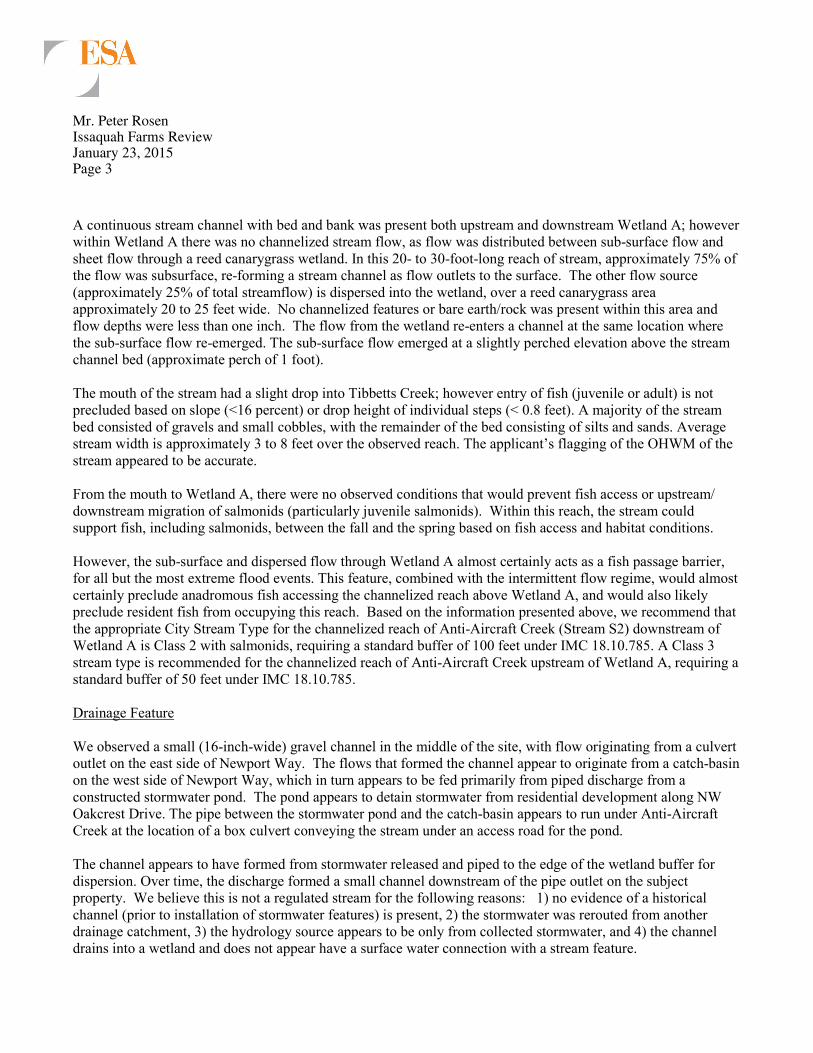
A continuous stream channel with bed and bank was present both upstream and downstream Wetland A; however
within Wetland A there was no channelized stream flow, as flow was distributed between sub-surface flow and
sheet flow through a reed canarygrass wetland. In this 20- to 30-foot-long reach of stream, approximately 75% of
the flow was subsurface, re-forming a stream channel as flow outlets to the surface. The other flow source
(approximately 25% of total streamflow) is dispersed into the wetland, over a reed canarygrass area
approximately 20 to 25 feet wide. No channelized features or bare earth/rock was present within this area and
flow depths were less than one inch. The flow from the wetland re-enters a channel at the same location where
the sub-surface flow re-emerged. The sub-surface flow emerged at a slightly perched elevation above the stream
channel bed (approximate perch of 1 foot).
The mouth of the stream had a slight drop into Tibbetts Creek; however entry of fish (juvenile or adult) is not
precluded based on slope (<16 percent) or drop height of individual steps (< 0.8 feet). A majority of the stream
bed consisted of gravels and small cobbles, with the remainder of the bed consisting of silts and sands. Average
stream width is approximately 3 to 8 feet over the observed reach. The applicant’s flagging of the OHWM of the
stream appeared to be accurate.
From the mouth to Wetland A, there were no observed conditions that would prevent fish access or upstream/
downstream migration of salmonids (particularly juvenile salmonids). Within this reach, the stream could
support fish, including salmonids, between the fall and the spring based on fish access and habitat conditions.
However, the sub-surface and dispersed flow through Wetland A almost certainly acts as a fish passage barrier,
for all but the most extreme flood events. This feature, combined with the intermittent flow regime, would almost
certainly preclude anadromous fish accessing the channelized reach above Wetland A, and would also likely
preclude resident fish from occupying this reach. Based on the information presented above, we recommend that
the appropriate City Stream Type for the channelized reach of Anti-Aircraft Creek (Stream S2) downstream of
Wetland A is Class 2 with salmonids, requiring a standard buffer of 100 feet under IMC 18.10.785. A Class 3
stream type is recommended for the channelized reach of Anti-Aircraft Creek upstream of Wetland A, requiring a
standard buffer of 50 feet under IMC 18.10.785.
Drainage Feature
We observed a small (16-inch-wide) gravel channel in the middle of the site, with flow originating from a culvert
outlet on the east side of Newport Way. The flows that formed the channel appear to originate from a catch-basin
on the west side of Newport Way, which in turn appears to be fed primarily from piped discharge from a
constructed stormwater pond. The pond appears to detain stormwater from residential development along NW
Oakcrest Drive. The pipe between the stormwater pond and the catch-basin appears to run under Anti-Aircraft
Creek at the location of a box culvert conveying the stream under an access road for the pond.
The channel appears to have formed from stormwater released and piped to the edge of the wetland buffer for
dispersion. Over time, the discharge formed a small channel downstream of the pipe outlet on the subject
property. We believe this is not a regulated stream for the following reasons: 1) no evidence of a historical
channel (prior to installation of stormwater features) is present, 2) the stormwater was rerouted from another
drainage catchment, 3) the hydrology source appears to be only from collected stormwater, and 4) the channel
drains into a wetland and does not appear have a surface water connection with a stream feature.
Mr. Peter Rosen Issaquah Farms Review January 23, 2015 Page 4
Wetland Determination
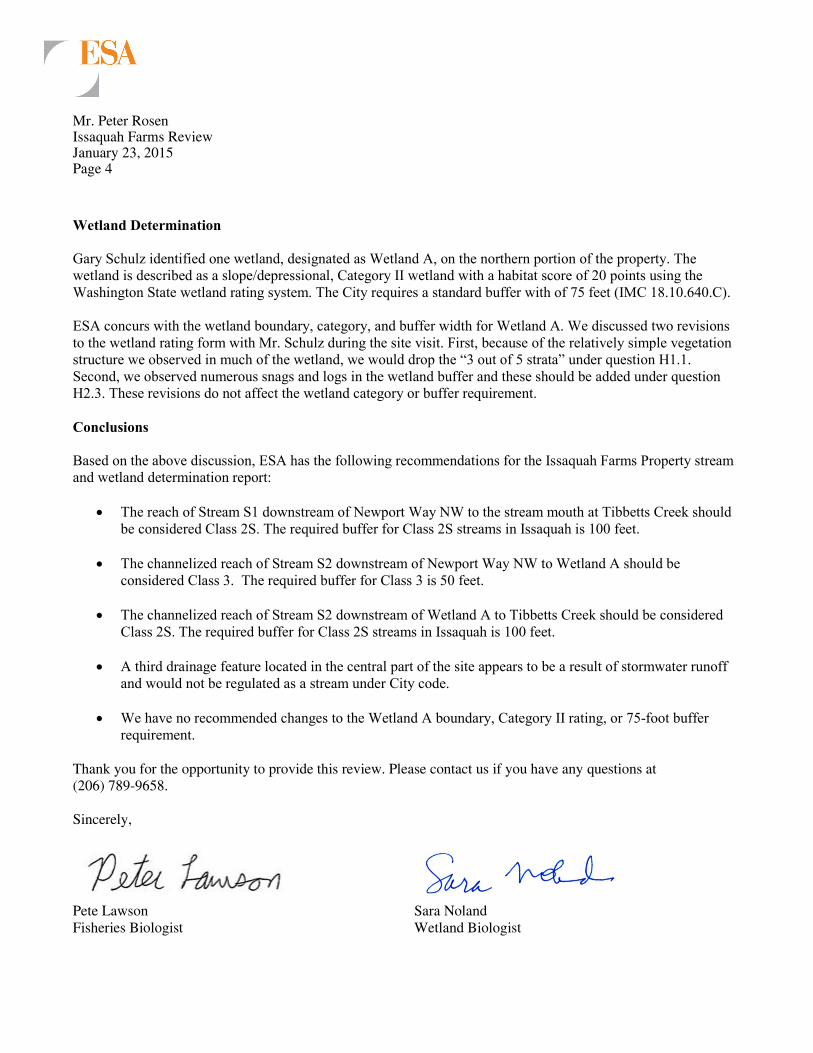
Gary Schulz identified one wetland, designated as Wetland A, on the northern portion of the property. The
wetland is described as a slope/depressional, Category II wetland with a habitat score of 20 points using the
Washington State wetland rating system. The City requires a standard buffer with of 75 feet (IMC 18.10.640.C).
ESA concurs with the wetland boundary, category, and buffer width for Wetland A. We discussed two revisions
to the wetland rating form with Mr. Schulz during the site visit. First, because of the relatively simple vegetation
structure we observed in much of the wetland, we would drop the “3 out of 5 strata” under question H1.1.
Second, we observed numerous snags and logs in the wetland buffer and these should be added under question
H2.3. These revisions do not affect the wetland category or buffer requirement.
Conclusions
Based on the above discussion, ESA has the following recommendations for the Issaquah Farms Property stream
and wetland determination report:
• The reach of Stream S1 downstream of Newport Way NW to the stream mouth at Tibbetts Creek should
be considered Class 2S. The required buffer for Class 2S streams in Issaquah is 100 feet.
• The channelized reach of Stream S2 downstream of Newport Way NW to Wetland A should be
considered Class 3. The required buffer for Class 3 is 50 feet.
• The channelized reach of Stream S2 downstream of Wetland A to Tibbetts Creek should be considered
Class 2S. The required buffer for Class 2S streams in Issaquah is 100 feet.
• A third drainage feature located in the central part of the site appears to be a result of stormwater runoff
and would not be regulated as a stream under City code.
• We have no recommended changes to the Wetland A boundary, Category II rating, or 75-foot buffer
requirement.
Thank you for the opportunity to provide this review. Please contact us if you have any questions at
(206) 789-9658.
Sincerely,
Pete Lawson Sara Noland
Fisheries Biologist Wetland Biologist

Mr. Peter Rosen Issaquah Farms Review January 23, 2015 Page 5
Attachment: References
Mr. Peter Rosen Issaquah Farms Review January 23, 2015 Page 6
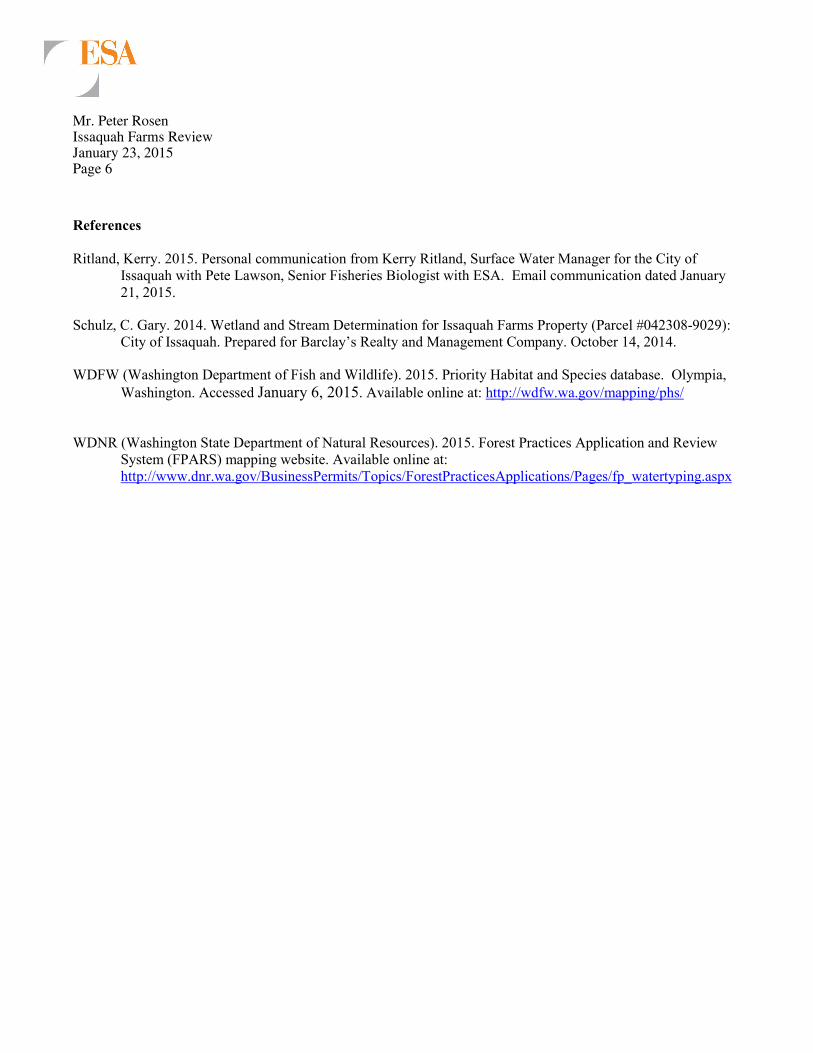
References
Ritland, Kerry. 2015. Personal communication from Kerry Ritland, Surface Water Manager for the City of
Issaquah with Pete Lawson, Senior Fisheries Biologist with ESA. Email communication dated January
21, 2015.
Schulz, C. Gary. 2014. Wetland and Stream Determination for Issaquah Farms Property (Parcel #042308-9029):
City of Issaquah. Prepared for Barclay’s Realty and Management Company. October 14, 2014.
WDFW (Washington Department of Fish and Wildlife). 2015. Priority Habitat and Species database. Olympia,
Washington. Accessed January 6, 2015. Available online at: http://wdfw.wa.gov/mapping/phs/
WDNR (Washington State Department of Natural Resources). 2015. Forest Practices Application and Review
System (FPARS) mapping website. Available online at:
http://www.dnr.wa.gov/BusinessPermits/Topics/ForestPracticesApplications/Pages/fp_watertyping.aspx

14
APPENDIX B
WETLAND DATA PLOT FORMS
US Army Corps of Engineers Western Mountains, Valleys, and Coast – Version 2.0
WETLAND DETERMINATION DATA FORM – Western Mountains, Valleys, and Coast Region
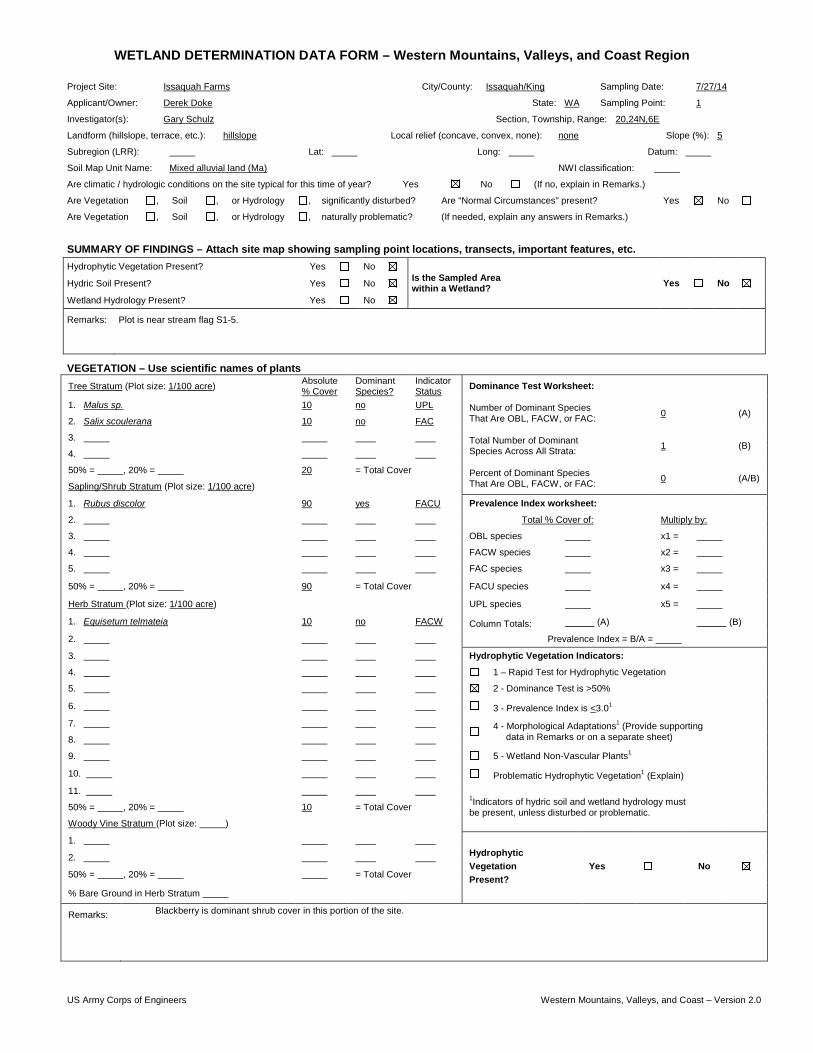
VEGETATION – Use scientific names of plants Tree Stratum (Plot size: 1/100 acre) Absolute
% Cover Dominant Species?
Indicator Status Dominance Test Worksheet:
1. Malus sp. 10 no UPL Number of Dominant Species That Are OBL, FACW, or FAC: 0 (A)
2. Salix scoulerana 10 no FAC
3. Total Number of Dominant Species Across All Strata: 1 (B)
4.
50% = , 20% = 20 = Total Cover Percent of Dominant Species That Are OBL, FACW, or FAC: 0 (A/B)
Sapling/Shrub Stratum (Plot size: 1/100 acre)
1. Rubus discolor 90 yes FACU Prevalence Index worksheet:
2. Total % Cover of: Multiply by:
3. OBL species x1 =
4. FACW species x2 =
5. FAC species x3 =
50% = , 20% = 90 = Total Cover FACU species x4 =
Herb Stratum (Plot size: 1/100 acre) UPL species x5 =
1. Equisetum telmateia 10 no FACW Column Totals: (A) (B)
2. Prevalence Index = B/A =
3. Hydrophytic Vegetation Indicators:
4. 1 – Rapid Test for Hydrophytic Vegetation
5. 2 - Dominance Test is >50%
6. 3 - Prevalence Index is <3.01 7.
4 - Morphological Adaptations1 (Provide supporting data in Remarks or on a separate sheet) 8.
9. 5 - Wetland Non-Vascular Plants1
10. Problematic Hydrophytic Vegetation1 (Explain) 11.
1Indicators of hydric soil and wetland hydrology must be present, unless disturbed or problematic. 50% = , 20% = 10 = Total Cover
Woody Vine Stratum (Plot size: )
1. Hydrophytic Vegetation Present?
Yes No 2.
50% = , 20% = = Total Cover
% Bare Ground in Herb Stratum
Remarks: Blackberry is dominant shrub cover in this portion of the site.
Project Site: Issaquah Farms City/County: Issaquah/King Sampling Date: 7/27/14
Applicant/Owner: Derek Doke State: WA Sampling Point: 1
Investigator(s): Gary Schulz Section, Township, Range: 20,24N,6E
Landform (hillslope, terrace, etc.): hillslope Local relief (concave, convex, none): none Slope (%): 5
Subregion (LRR): Lat: Long: Datum:
Soil Map Unit Name: Mixed alluvial land (Ma) NWI classification:
Are climatic / hydrologic conditions on the site typical for this time of year? Yes No (If no, explain in Remarks.)
Are Vegetation , Soil , or Hydrology , significantly disturbed? Are “Normal Circumstances” present? Yes No
Are Vegetation , Soil , or Hydrology , naturally problematic? (If needed, explain any answers in Remarks.)
SUMMARY OF FINDINGS – Attach site map showing sampling point locations, transects, important features, etc. Hydrophytic Vegetation Present? Yes No
Is the Sampled Area within a Wetland? Yes No Hydric Soil Present? Yes No
Wetland Hydrology Present? Yes No
Remarks:
Plot is near stream flag S1-5.

US Army Corps of Engineers Western Mountains, Valleys, and Coast – Version 2.0
SOIL Sampling Point: 1 Profile Description: (Describe to the depth needed to document the indicator or confirm the absence of indicators.)
Depth Matrix Redox Features
(inches) Color (moist) % Color (moist) % Type1 Loc2 Texture Remarks
15 10YR3/2 100 sandy loam very loose, dry
17 10YR4/2 100 sandy loam blocky, dry
1Type: C= Concentration, D=Depletion, RM=Reduced Matrix, CS=Covered or Coated Sand Grains. 2Location: PL=Pore Lining, M=Matrix
Hydric Soil Indicators: (Applicable to all LRRs, unless otherwise noted.) Indicators for Problematic Hydric Soils3:
Histosol (A1) Sandy Redox (S5) 2 cm Muck (A10)
Histic Epipedon (A2) Stripped Matrix (S6) Red Parent Material (TF2)
Black Histic (A3) Loamy Mucky Mineral (F1) (except MLRA 1) Very Shallow Dark Surface (TF12)
Hydrogen Sulfide (A4) Loamy Gleyed Matrix (F2) Other (Explain in Remarks)
Depleted Below Dark Surface (A11) Depleted Matrix (F3)
3Indicators of hydrophytic vegetation and wetland hydrology must be present, unless disturbed or problematic.
Thick Dark Surface (A12) Redox Dark Surface (F6)
Sandy Mucky Mineral (S1) Depleted Dark Surface (F7)
Sandy Gleyed Matrix (S4) Redox Depressions (F8)
Restrictive Layer (if present):
Hydric Soils Present? Yes No
Type:
Depth (inches):
Remarks:
HYDROLOGY Wetland Hydrology Indicators:
Primary Indicators (minimum of one required; check all that apply) Secondary Indicators (2 or more required)
Surface Water (A1) Water-Stained Leaves (B9) Water-Stained Leaves (B9)
High Water Table (A2) (except MLRA 1, 2, 4A, and 4B) (MLRA 1, 2, 4A, and 4B)
Saturation (A3) Salt Crust (B11) Drainage Patterns (B10)
Water Marks (B1) Aquatic Invertebrates (B13) Dry-Season Water Table (C2)
Sediment Deposits (B2) Hydrogen Sulfide Odor (C1) Saturation Visible on Aerial Imagery (C9)
Drift Deposits (B3) Oxidized Rhizospheres along Living Roots (C3) Geomorphic Position (D2)
Algal Mat or Crust (B4) Presence of Reduced Iron (C4) Shallow Aquitard (D3)
Iron Deposits (B5) Recent Iron Reduction in Tilled Soils (C6) FAC-Neutral Test (D5)
Surface Soil Cracks (B6) Stunted or Stresses Plants (D1) (LRR A) Raised Ant Mounds (D6) (LRR A)
Inundation Visible on Aerial Imagery (B7) Other (Explain in Remarks) Frost-Heave Hummocks (D7)
Sparsely Vegetated Concave Surface (B8)
Field Observations:
Surface Water Present? Yes No Depth (inches): Wetland Hydrology Present?
Yes
No
Water Table Present? Yes No Depth (inches):
Saturation Present? (includes capillary fringe) Yes No Depth (inches):
Describe Recorded Data (stream gauge, monitoring well, aerial photos, previous inspections), if available: Remarks: Assumed by non-hydric soil.
Project Site: Issaquah Farms
US Army Corps of Engineers Western Mountains, Valleys, and Coast – Version 2.0
WETLAND DETERMINATION DATA FORM – Western Mountains, Valleys, and Coast Region
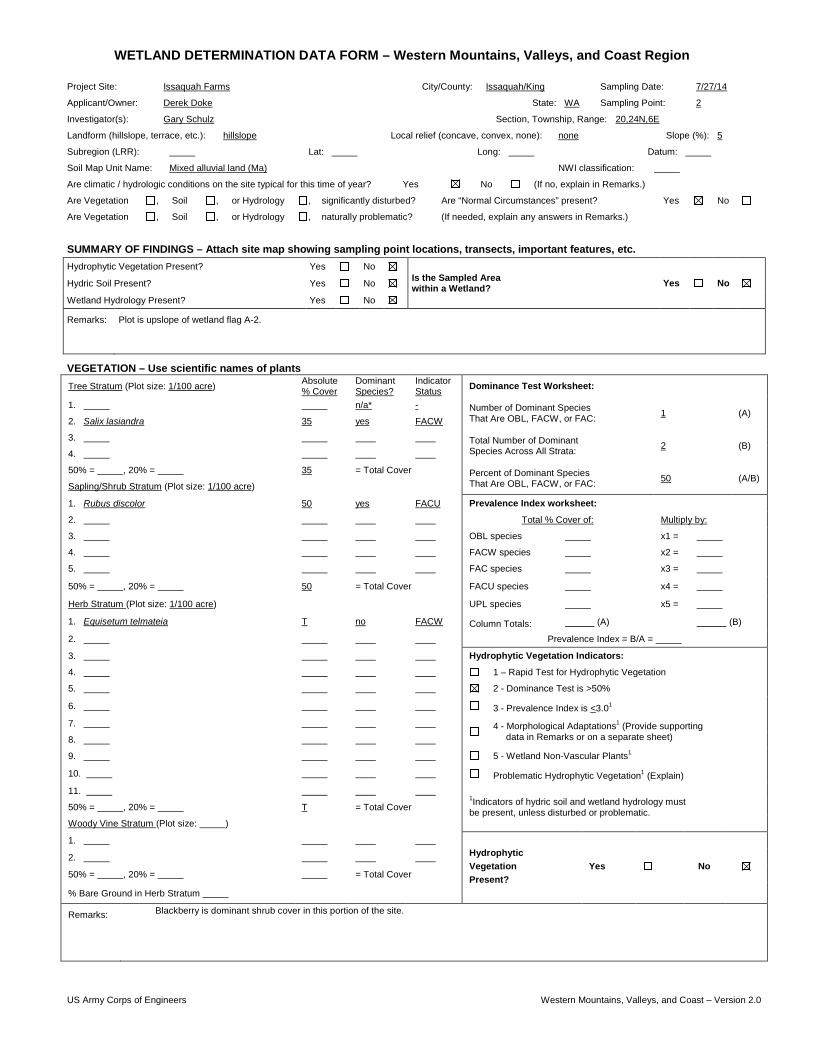
VEGETATION – Use scientific names of plants Tree Stratum (Plot size: 1/100 acre) Absolute
% Cover Dominant Species?
Indicator Status Dominance Test Worksheet:
1. n/a* - Number of Dominant Species That Are OBL, FACW, or FAC: 1 (A)
2. Salix lasiandra 35 yes FACW
3. Total Number of Dominant Species Across All Strata: 2 (B)
4.
50% = , 20% = 35 = Total Cover Percent of Dominant Species That Are OBL, FACW, or FAC: 50 (A/B)
Sapling/Shrub Stratum (Plot size: 1/100 acre)
1. Rubus discolor 50 yes FACU Prevalence Index worksheet:
2. Total % Cover of: Multiply by:
3. OBL species x1 =
4. FACW species x2 =
5. FAC species x3 =
50% = , 20% = 50 = Total Cover FACU species x4 =
Herb Stratum (Plot size: 1/100 acre) UPL species x5 =
1. Equisetum telmateia T no FACW Column Totals: (A) (B)
2. Prevalence Index = B/A =
3. Hydrophytic Vegetation Indicators:
4. 1 – Rapid Test for Hydrophytic Vegetation
5. 2 - Dominance Test is >50%
6. 3 - Prevalence Index is <3.01 7.
4 - Morphological Adaptations1 (Provide supporting data in Remarks or on a separate sheet) 8.
9. 5 - Wetland Non-Vascular Plants1
10. Problematic Hydrophytic Vegetation1 (Explain) 11.
1Indicators of hydric soil and wetland hydrology must be present, unless disturbed or problematic. 50% = , 20% = T = Total Cover
Woody Vine Stratum (Plot size: )
1. Hydrophytic Vegetation Present?
Yes No 2.
50% = , 20% = = Total Cover
% Bare Ground in Herb Stratum
Remarks: Blackberry is dominant shrub cover in this portion of the site.
Project Site: Issaquah Farms City/County: Issaquah/King Sampling Date: 7/27/14
Applicant/Owner: Derek Doke State: WA Sampling Point: 2
Investigator(s): Gary Schulz Section, Township, Range: 20,24N,6E
Landform (hillslope, terrace, etc.): hillslope Local relief (concave, convex, none): none Slope (%): 5
Subregion (LRR): Lat: Long: Datum:
Soil Map Unit Name: Mixed alluvial land (Ma) NWI classification:
Are climatic / hydrologic conditions on the site typical for this time of year? Yes No (If no, explain in Remarks.)
Are Vegetation , Soil , or Hydrology , significantly disturbed? Are “Normal Circumstances” present? Yes No
Are Vegetation , Soil , or Hydrology , naturally problematic? (If needed, explain any answers in Remarks.)
SUMMARY OF FINDINGS – Attach site map showing sampling point locations, transects, important features, etc. Hydrophytic Vegetation Present? Yes No
Is the Sampled Area within a Wetland? Yes No Hydric Soil Present? Yes No
Wetland Hydrology Present? Yes No
Remarks:
Plot is upslope of wetland flag A-2.
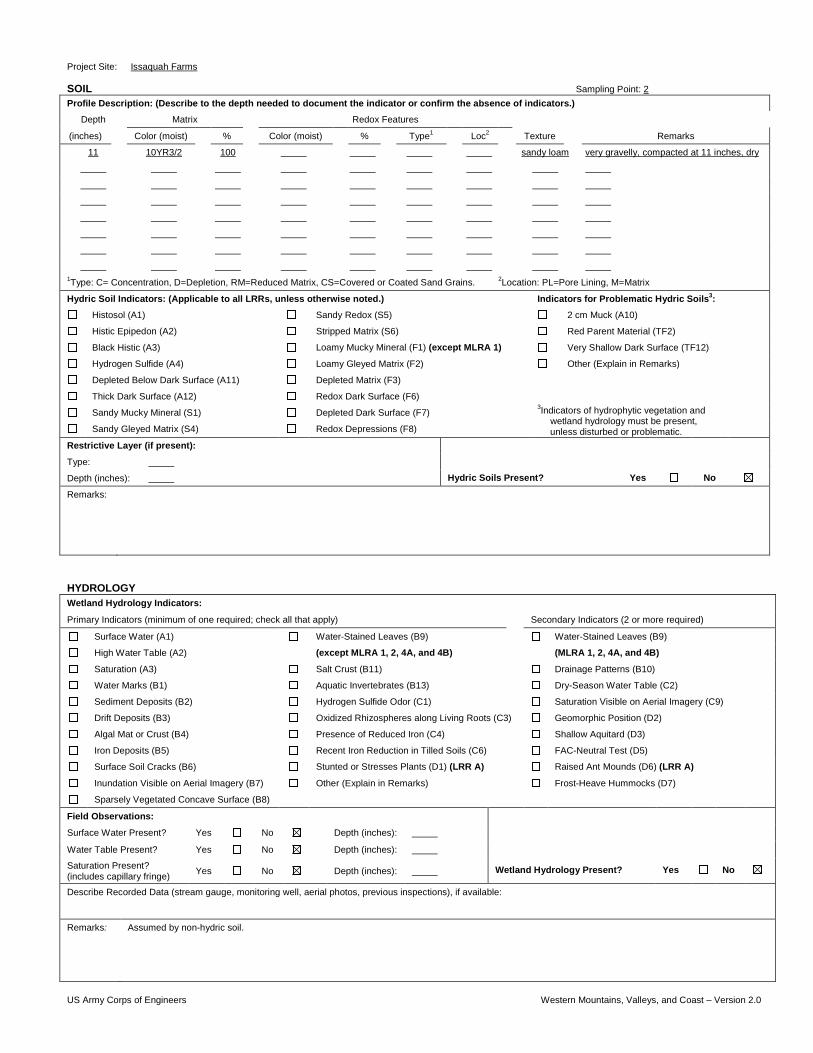
US Army Corps of Engineers Western Mountains, Valleys, and Coast – Version 2.0
SOIL Sampling Point: 2 Profile Description: (Describe to the depth needed to document the indicator or confirm the absence of indicators.)
Depth Matrix Redox Features
(inches) Color (moist) % Color (moist) % Type1 Loc2 Texture Remarks
11 10YR3/2 100 sandy loam very gravelly, compacted at 11 inches, dry
1Type: C= Concentration, D=Depletion, RM=Reduced Matrix, CS=Covered or Coated Sand Grains. 2Location: PL=Pore Lining, M=Matrix
Hydric Soil Indicators: (Applicable to all LRRs, unless otherwise noted.) Indicators for Problematic Hydric Soils3:
Histosol (A1) Sandy Redox (S5) 2 cm Muck (A10)
Histic Epipedon (A2) Stripped Matrix (S6) Red Parent Material (TF2)
Black Histic (A3) Loamy Mucky Mineral (F1) (except MLRA 1) Very Shallow Dark Surface (TF12)
Hydrogen Sulfide (A4) Loamy Gleyed Matrix (F2) Other (Explain in Remarks)
Depleted Below Dark Surface (A11) Depleted Matrix (F3)
3Indicators of hydrophytic vegetation and wetland hydrology must be present, unless disturbed or problematic.
Thick Dark Surface (A12) Redox Dark Surface (F6)
Sandy Mucky Mineral (S1) Depleted Dark Surface (F7)
Sandy Gleyed Matrix (S4) Redox Depressions (F8)
Restrictive Layer (if present):
Hydric Soils Present? Yes No
Type:
Depth (inches):
Remarks:
HYDROLOGY Wetland Hydrology Indicators:
Primary Indicators (minimum of one required; check all that apply) Secondary Indicators (2 or more required)
Surface Water (A1) Water-Stained Leaves (B9) Water-Stained Leaves (B9)
High Water Table (A2) (except MLRA 1, 2, 4A, and 4B) (MLRA 1, 2, 4A, and 4B)
Saturation (A3) Salt Crust (B11) Drainage Patterns (B10)
Water Marks (B1) Aquatic Invertebrates (B13) Dry-Season Water Table (C2)
Sediment Deposits (B2) Hydrogen Sulfide Odor (C1) Saturation Visible on Aerial Imagery (C9)
Drift Deposits (B3) Oxidized Rhizospheres along Living Roots (C3) Geomorphic Position (D2)
Algal Mat or Crust (B4) Presence of Reduced Iron (C4) Shallow Aquitard (D3)
Iron Deposits (B5) Recent Iron Reduction in Tilled Soils (C6) FAC-Neutral Test (D5)
Surface Soil Cracks (B6) Stunted or Stresses Plants (D1) (LRR A) Raised Ant Mounds (D6) (LRR A)
Inundation Visible on Aerial Imagery (B7) Other (Explain in Remarks) Frost-Heave Hummocks (D7)
Sparsely Vegetated Concave Surface (B8)
Field Observations:
Surface Water Present? Yes No Depth (inches): Wetland Hydrology Present?
Yes
No
Water Table Present? Yes No Depth (inches):
Saturation Present? (includes capillary fringe) Yes No Depth (inches):
Describe Recorded Data (stream gauge, monitoring well, aerial photos, previous inspections), if available: Remarks: Assumed by non-hydric soil.
Project Site: Issaquah Farms
US Army Corps of Engineers Western Mountains, Valleys, and Coast – Version 2.0
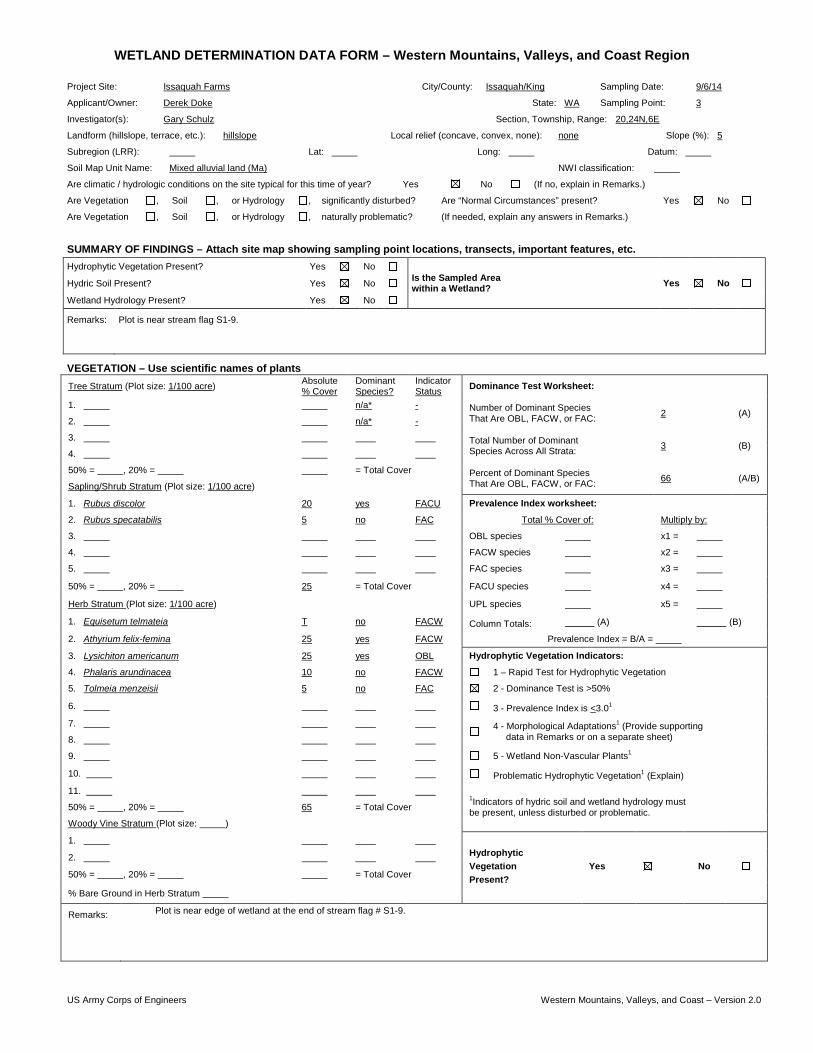
WETLAND DETERMINATION DATA FORM – Western Mountains, Valleys, and Coast Region
VEGETATION – Use scientific names of plants Tree Stratum (Plot size: 1/100 acre) Absolute
% Cover Dominant Species?
Indicator Status Dominance Test Worksheet:
1. n/a* - Number of Dominant Species That Are OBL, FACW, or FAC: 2 (A)
2. n/a* -
3. Total Number of Dominant Species Across All Strata: 3 (B)
4.
50% = , 20% = = Total Cover Percent of Dominant Species That Are OBL, FACW, or FAC: 66 (A/B)
Sapling/Shrub Stratum (Plot size: 1/100 acre)
1. Rubus discolor 20 yes FACU Prevalence Index worksheet:
2. Rubus specatabilis 5 no FAC Total % Cover of: Multiply by:
3. OBL species x1 =
4. FACW species x2 =
5. FAC species x3 =
50% = , 20% = 25 = Total Cover FACU species x4 =
Herb Stratum (Plot size: 1/100 acre) UPL species x5 =
1. Equisetum telmateia T no FACW Column Totals: (A) (B)
2. Athyrium felix-femina 25 yes FACW Prevalence Index = B/A =
3. Lysichiton americanum 25 yes OBL Hydrophytic Vegetation Indicators:
4. Phalaris arundinacea 10 no FACW 1 – Rapid Test for Hydrophytic Vegetation
5. Tolmeia menzeisii 5 no FAC 2 - Dominance Test is >50%
6. 3 - Prevalence Index is <3.01 7.
4 - Morphological Adaptations1 (Provide supporting data in Remarks or on a separate sheet) 8.
9. 5 - Wetland Non-Vascular Plants1
10. Problematic Hydrophytic Vegetation1 (Explain) 11.
1Indicators of hydric soil and wetland hydrology must be present, unless disturbed or problematic. 50% = , 20% = 65 = Total Cover
Woody Vine Stratum (Plot size: )
1. Hydrophytic Vegetation Present?
Yes No 2.
50% = , 20% = = Total Cover
% Bare Ground in Herb Stratum
Remarks: Plot is near edge of wetland at the end of stream flag # S1-9.
Project Site: Issaquah Farms City/County: Issaquah/King Sampling Date: 9/6/14
Applicant/Owner: Derek Doke State: WA Sampling Point: 3
Investigator(s): Gary Schulz Section, Township, Range: 20,24N,6E
Landform (hillslope, terrace, etc.): hillslope Local relief (concave, convex, none): none Slope (%): 5
Subregion (LRR): Lat: Long: Datum:
Soil Map Unit Name: Mixed alluvial land (Ma) NWI classification:
Are climatic / hydrologic conditions on the site typical for this time of year? Yes No (If no, explain in Remarks.)
Are Vegetation , Soil , or Hydrology , significantly disturbed? Are “Normal Circumstances” present? Yes No
Are Vegetation , Soil , or Hydrology , naturally problematic? (If needed, explain any answers in Remarks.)
SUMMARY OF FINDINGS – Attach site map showing sampling point locations, transects, important features, etc. Hydrophytic Vegetation Present? Yes No
Is the Sampled Area within a Wetland? Yes No Hydric Soil Present? Yes No
Wetland Hydrology Present? Yes No
Remarks:
Plot is near stream flag S1-9.
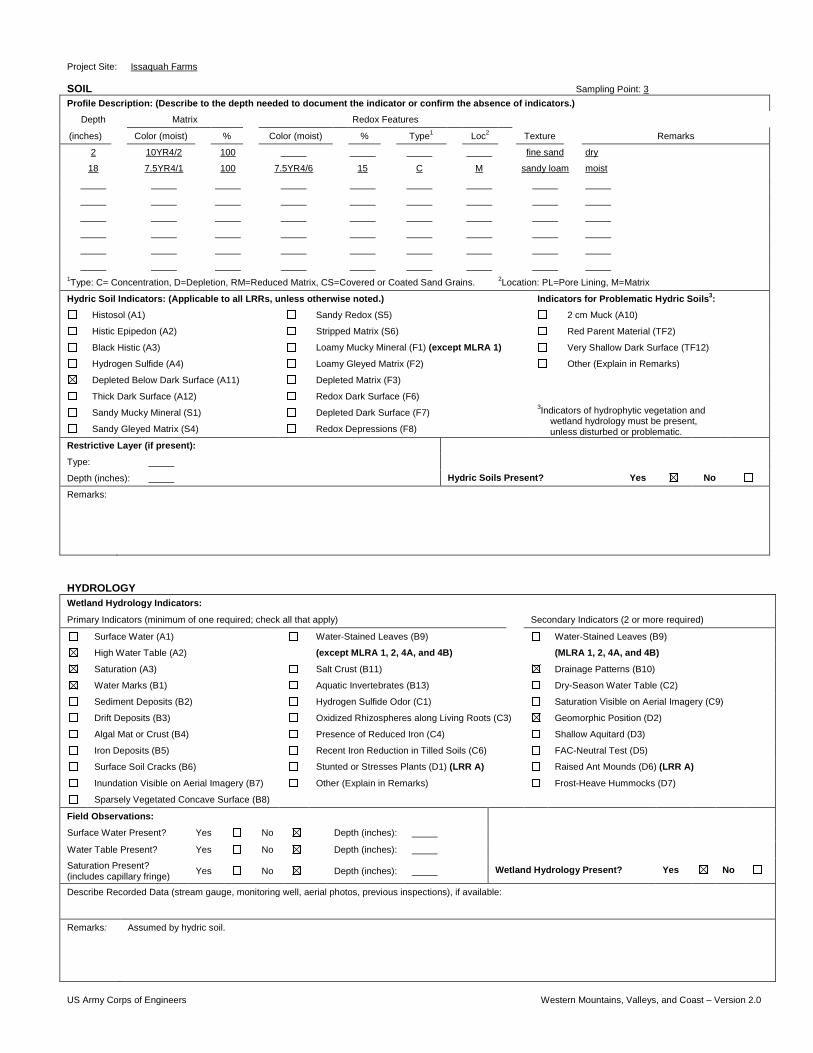
US Army Corps of Engineers Western Mountains, Valleys, and Coast – Version 2.0
SOIL Sampling Point: 3 Profile Description: (Describe to the depth needed to document the indicator or confirm the absence of indicators.)
Depth Matrix Redox Features
(inches) Color (moist) % Color (moist) % Type1 Loc2 Texture Remarks
2 10YR4/2 100 fine sand dry
18 7.5YR4/1 100 7.5YR4/6 15 C M sandy loam moist
1Type: C= Concentration, D=Depletion, RM=Reduced Matrix, CS=Covered or Coated Sand Grains. 2Location: PL=Pore Lining, M=Matrix
Hydric Soil Indicators: (Applicable to all LRRs, unless otherwise noted.) Indicators for Problematic Hydric Soils3:
Histosol (A1) Sandy Redox (S5) 2 cm Muck (A10)
Histic Epipedon (A2) Stripped Matrix (S6) Red Parent Material (TF2)
Black Histic (A3) Loamy Mucky Mineral (F1) (except MLRA 1) Very Shallow Dark Surface (TF12)
Hydrogen Sulfide (A4) Loamy Gleyed Matrix (F2) Other (Explain in Remarks)
Depleted Below Dark Surface (A11) Depleted Matrix (F3)
3Indicators of hydrophytic vegetation and wetland hydrology must be present, unless disturbed or problematic.
Thick Dark Surface (A12) Redox Dark Surface (F6)
Sandy Mucky Mineral (S1) Depleted Dark Surface (F7)
Sandy Gleyed Matrix (S4) Redox Depressions (F8)
Restrictive Layer (if present):
Hydric Soils Present? Yes No
Type:
Depth (inches):
Remarks:
HYDROLOGY Wetland Hydrology Indicators:
Primary Indicators (minimum of one required; check all that apply) Secondary Indicators (2 or more required)
Surface Water (A1) Water-Stained Leaves (B9) Water-Stained Leaves (B9)
High Water Table (A2) (except MLRA 1, 2, 4A, and 4B) (MLRA 1, 2, 4A, and 4B)
Saturation (A3) Salt Crust (B11) Drainage Patterns (B10)
Water Marks (B1) Aquatic Invertebrates (B13) Dry-Season Water Table (C2)
Sediment Deposits (B2) Hydrogen Sulfide Odor (C1) Saturation Visible on Aerial Imagery (C9)
Drift Deposits (B3) Oxidized Rhizospheres along Living Roots (C3) Geomorphic Position (D2)
Algal Mat or Crust (B4) Presence of Reduced Iron (C4) Shallow Aquitard (D3)
Iron Deposits (B5) Recent Iron Reduction in Tilled Soils (C6) FAC-Neutral Test (D5)
Surface Soil Cracks (B6) Stunted or Stresses Plants (D1) (LRR A) Raised Ant Mounds (D6) (LRR A)
Inundation Visible on Aerial Imagery (B7) Other (Explain in Remarks) Frost-Heave Hummocks (D7)
Sparsely Vegetated Concave Surface (B8)
Field Observations:
Surface Water Present? Yes No Depth (inches): Wetland Hydrology Present?
Yes
No
Water Table Present? Yes No Depth (inches):
Saturation Present? (includes capillary fringe) Yes No Depth (inches):
Describe Recorded Data (stream gauge, monitoring well, aerial photos, previous inspections), if available: Remarks: Assumed by hydric soil.
Project Site: Issaquah Farms
US Army Corps of Engineers Western Mountains, Valleys, and Coast – Version 2.0
WETLAND DETERMINATION DATA FORM – Western Mountains, Valleys, and Coast Region
VEGETATION – Use scientific names of plants Tree Stratum (Plot size: 1/100 acre) Absolute
% Cover Dominant Species?
Indicator Status Dominance Test Worksheet:
1. n/a* - Number of Dominant Species That Are OBL, FACW, or FAC: 2 (A)
2. Alnus rubra 25 yes FAC
3. Total Number of Dominant Species Across All Strata: 3 (B)
4.
50% = , 20% = 25 = Total Cover Percent of Dominant Species That Are OBL, FACW, or FAC: 66 (A/B)
Sapling/Shrub Stratum (Plot size: 1/100 acre)
1. Rubus discolor 50 yes FACU Prevalence Index worksheet:
2. Rubus spectabilis 50 yes FAC Total % Cover of: Multiply by:
3. OBL species x1 =
4. FACW species x2 =
5. FAC species x3 =
50% = , 20% = 100 = Total Cover FACU species x4 =
Herb Stratum (Plot size: 1/100 acre) UPL species x5 =
1. n/a* - Column Totals: (A) (B)
2. Prevalence Index = B/A =
3. Hydrophytic Vegetation Indicators:
4. 1 – Rapid Test for Hydrophytic Vegetation
5. 2 - Dominance Test is >50%
6. 3 - Prevalence Index is <3.01 7.
4 - Morphological Adaptations1 (Provide supporting data in Remarks or on a separate sheet) 8.
9. 5 - Wetland Non-Vascular Plants1
10. Problematic Hydrophytic Vegetation1 (Explain) 11.
1Indicators of hydric soil and wetland hydrology must be present, unless disturbed or problematic. 50% = , 20% = T = Total Cover
Woody Vine Stratum (Plot size: )
1. Hydrophytic Vegetation Present?
Yes No 2.
50% = , 20% = = Total Cover
% Bare Ground in Herb Stratum
Remarks: Blackberry is a dominant shrub cover in this portion of the site.
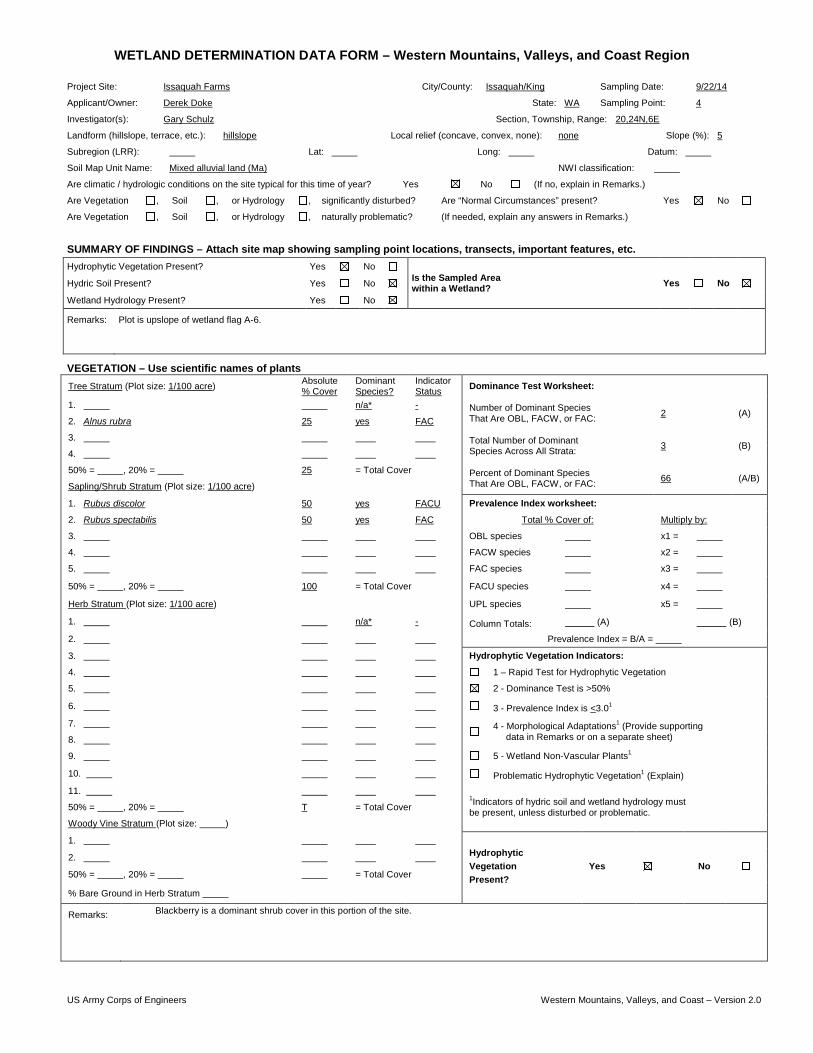
Project Site: Issaquah Farms City/County: Issaquah/King Sampling Date: 9/22/14
Applicant/Owner: Derek Doke State: WA Sampling Point: 4
Investigator(s): Gary Schulz Section, Township, Range: 20,24N,6E
Landform (hillslope, terrace, etc.): hillslope Local relief (concave, convex, none): none Slope (%): 5
Subregion (LRR): Lat: Long: Datum:
Soil Map Unit Name: Mixed alluvial land (Ma) NWI classification:
Are climatic / hydrologic conditions on the site typical for this time of year? Yes No (If no, explain in Remarks.)
Are Vegetation , Soil , or Hydrology , significantly disturbed? Are “Normal Circumstances” present? Yes No
Are Vegetation , Soil , or Hydrology , naturally problematic? (If needed, explain any answers in Remarks.)
SUMMARY OF FINDINGS – Attach site map showing sampling point locations, transects, important features, etc. Hydrophytic Vegetation Present? Yes No
Is the Sampled Area within a Wetland? Yes No Hydric Soil Present? Yes No
Wetland Hydrology Present? Yes No
Remarks:
Plot is upslope of wetland flag A-6.

US Army Corps of Engineers Western Mountains, Valleys, and Coast – Version 2.0
SOIL Sampling Point: 4 Profile Description: (Describe to the depth needed to document the indicator or confirm the absence of indicators.)
Depth Matrix Redox Features
(inches) Color (moist) % Color (moist) % Type1 Loc2 Texture Remarks
15 10YR3/2 50 sandy loam dry
10YR4/2 50
17 10YR4/1 7.5YR4/4 5 C M sandy loam dry
1Type: C= Concentration, D=Depletion, RM=Reduced Matrix, CS=Covered or Coated Sand Grains. 2Location: PL=Pore Lining, M=Matrix
Hydric Soil Indicators: (Applicable to all LRRs, unless otherwise noted.) Indicators for Problematic Hydric Soils3:
Histosol (A1) Sandy Redox (S5) 2 cm Muck (A10)
Histic Epipedon (A2) Stripped Matrix (S6) Red Parent Material (TF2)
Black Histic (A3) Loamy Mucky Mineral (F1) (except MLRA 1) Very Shallow Dark Surface (TF12)
Hydrogen Sulfide (A4) Loamy Gleyed Matrix (F2) Other (Explain in Remarks)
Depleted Below Dark Surface (A11) Depleted Matrix (F3)
3Indicators of hydrophytic vegetation and wetland hydrology must be present, unless disturbed or problematic.
Thick Dark Surface (A12) Redox Dark Surface (F6)
Sandy Mucky Mineral (S1) Depleted Dark Surface (F7)
Sandy Gleyed Matrix (S4) Redox Depressions (F8)
Restrictive Layer (if present):
Hydric Soils Present? Yes No
Type:
Depth (inches):
Remarks:
HYDROLOGY Wetland Hydrology Indicators:
Primary Indicators (minimum of one required; check all that apply) Secondary Indicators (2 or more required)
Surface Water (A1) Water-Stained Leaves (B9) Water-Stained Leaves (B9)
High Water Table (A2) (except MLRA 1, 2, 4A, and 4B) (MLRA 1, 2, 4A, and 4B)
Saturation (A3) Salt Crust (B11) Drainage Patterns (B10)
Water Marks (B1) Aquatic Invertebrates (B13) Dry-Season Water Table (C2)
Sediment Deposits (B2) Hydrogen Sulfide Odor (C1) Saturation Visible on Aerial Imagery (C9)
Drift Deposits (B3) Oxidized Rhizospheres along Living Roots (C3) Geomorphic Position (D2)
Algal Mat or Crust (B4) Presence of Reduced Iron (C4) Shallow Aquitard (D3)
Iron Deposits (B5) Recent Iron Reduction in Tilled Soils (C6) FAC-Neutral Test (D5)
Surface Soil Cracks (B6) Stunted or Stresses Plants (D1) (LRR A) Raised Ant Mounds (D6) (LRR A)
Inundation Visible on Aerial Imagery (B7) Other (Explain in Remarks) Frost-Heave Hummocks (D7)
Sparsely Vegetated Concave Surface (B8)
Field Observations:
Surface Water Present? Yes No Depth (inches): Wetland Hydrology Present?
Yes
No
Water Table Present? Yes No Depth (inches):
Saturation Present? (includes capillary fringe) Yes No Depth (inches):
Describe Recorded Data (stream gauge, monitoring well, aerial photos, previous inspections), if available: Remarks: Assumed by non-hydric soil.
Project Site: Issaquah Farms
US Army Corps of Engineers Western Mountains, Valleys, and Coast – Version 2.0
WETLAND DETERMINATION DATA FORM – Western Mountains, Valleys, and Coast Region
VEGETATION – Use scientific names of plants Tree Stratum (Plot size: 1/100 acre) Absolute
% Cover Dominant Species?
Indicator Status Dominance Test Worksheet:
1. n/a* - Number of Dominant Species That Are OBL, FACW, or FAC: 2 (A)
2. Alnus rubra 80 yes FAC
3. Total Number of Dominant Species Across All Strata: 2 (B)
4.
50% = , 20% = 80 = Total Cover Percent of Dominant Species That Are OBL, FACW, or FAC: 100 (A/B)
Sapling/Shrub Stratum (Plot size: 1/100 acre)
1. n/a* - Prevalence Index worksheet:
2. Rubus spectabilis 85 yes FAC Total % Cover of: Multiply by:
3. OBL species x1 =
4. FACW species x2 =
5. FAC species x3 =
50% = , 20% = 85 = Total Cover FACU species x4 =
Herb Stratum (Plot size: 1/100 acre) UPL species x5 =
1. Polystichum munitum 5 no FACU Column Totals: (A) (B)
2. Maianthemum dilatatum 5 no FAC Prevalence Index = B/A =
3. Hydrophytic Vegetation Indicators:
4. 1 – Rapid Test for Hydrophytic Vegetation
5. 2 - Dominance Test is >50%
6. 3 - Prevalence Index is <3.01 7.
4 - Morphological Adaptations1 (Provide supporting data in Remarks or on a separate sheet) 8.
9. 5 - Wetland Non-Vascular Plants1
10. Problematic Hydrophytic Vegetation1 (Explain) 11.
1Indicators of hydric soil and wetland hydrology must be present, unless disturbed or problematic. 50% = , 20% = 10 = Total Cover
Woody Vine Stratum (Plot size: )
1. Hydrophytic Vegetation Present?
Yes No 2.
50% = , 20% = = Total Cover
% Bare Ground in Herb Stratum
Remarks: Upland lobe has native vegetation as dominant cover.
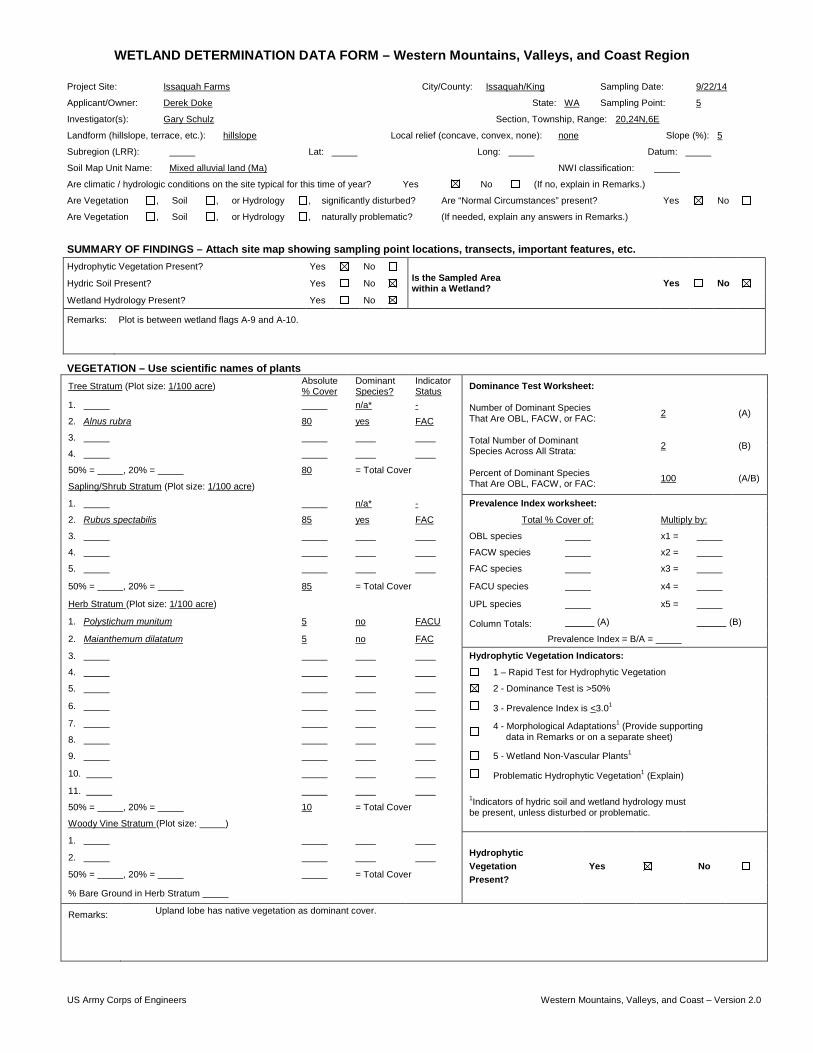
Project Site: Issaquah Farms City/County: Issaquah/King Sampling Date: 9/22/14
Applicant/Owner: Derek Doke State: WA Sampling Point: 5
Investigator(s): Gary Schulz Section, Township, Range: 20,24N,6E
Landform (hillslope, terrace, etc.): hillslope Local relief (concave, convex, none): none Slope (%): 5
Subregion (LRR): Lat: Long: Datum:
Soil Map Unit Name: Mixed alluvial land (Ma) NWI classification:
Are climatic / hydrologic conditions on the site typical for this time of year? Yes No (If no, explain in Remarks.)
Are Vegetation , Soil , or Hydrology , significantly disturbed? Are “Normal Circumstances” present? Yes No
Are Vegetation , Soil , or Hydrology , naturally problematic? (If needed, explain any answers in Remarks.)
SUMMARY OF FINDINGS – Attach site map showing sampling point locations, transects, important features, etc. Hydrophytic Vegetation Present? Yes No
Is the Sampled Area within a Wetland? Yes No Hydric Soil Present? Yes No
Wetland Hydrology Present? Yes No
Remarks:
Plot is between wetland flags A-9 and A-10.

US Army Corps of Engineers Western Mountains, Valleys, and Coast – Version 2.0
SOIL Sampling Point: 5 Profile Description: (Describe to the depth needed to document the indicator or confirm the absence of indicators.)
Depth Matrix Redox Features
(inches) Color (moist) % Color (moist) % Type1 Loc2 Texture Remarks
14 10YR3/2 60 sandy loam +gravel, dry
gravel
1Type: C= Concentration, D=Depletion, RM=Reduced Matrix, CS=Covered or Coated Sand Grains. 2Location: PL=Pore Lining, M=Matrix
Hydric Soil Indicators: (Applicable to all LRRs, unless otherwise noted.) Indicators for Problematic Hydric Soils3:
Histosol (A1) Sandy Redox (S5) 2 cm Muck (A10)
Histic Epipedon (A2) Stripped Matrix (S6) Red Parent Material (TF2)
Black Histic (A3) Loamy Mucky Mineral (F1) (except MLRA 1) Very Shallow Dark Surface (TF12)
Hydrogen Sulfide (A4) Loamy Gleyed Matrix (F2) Other (Explain in Remarks)
Depleted Below Dark Surface (A11) Depleted Matrix (F3)
3Indicators of hydrophytic vegetation and wetland hydrology must be present, unless disturbed or problematic.
Thick Dark Surface (A12) Redox Dark Surface (F6)
Sandy Mucky Mineral (S1) Depleted Dark Surface (F7)
Sandy Gleyed Matrix (S4) Redox Depressions (F8)
Restrictive Layer (if present):
Hydric Soils Present? Yes No
Type:
Depth (inches):
Remarks: Very restrictive due to the amount of gravel mixed with loose soil.
HYDROLOGY Wetland Hydrology Indicators:
Primary Indicators (minimum of one required; check all that apply) Secondary Indicators (2 or more required)
Surface Water (A1) Water-Stained Leaves (B9) Water-Stained Leaves (B9)
High Water Table (A2) (except MLRA 1, 2, 4A, and 4B) (MLRA 1, 2, 4A, and 4B)
Saturation (A3) Salt Crust (B11) Drainage Patterns (B10)
Water Marks (B1) Aquatic Invertebrates (B13) Dry-Season Water Table (C2)
Sediment Deposits (B2) Hydrogen Sulfide Odor (C1) Saturation Visible on Aerial Imagery (C9)
Drift Deposits (B3) Oxidized Rhizospheres along Living Roots (C3) Geomorphic Position (D2)
Algal Mat or Crust (B4) Presence of Reduced Iron (C4) Shallow Aquitard (D3)
Iron Deposits (B5) Recent Iron Reduction in Tilled Soils (C6) FAC-Neutral Test (D5)
Surface Soil Cracks (B6) Stunted or Stresses Plants (D1) (LRR A) Raised Ant Mounds (D6) (LRR A)
Inundation Visible on Aerial Imagery (B7) Other (Explain in Remarks) Frost-Heave Hummocks (D7)
Sparsely Vegetated Concave Surface (B8)
Field Observations:
Surface Water Present? Yes No Depth (inches): Wetland Hydrology Present?
Yes
No
Water Table Present? Yes No Depth (inches):
Saturation Present? (includes capillary fringe) Yes No Depth (inches):
Describe Recorded Data (stream gauge, monitoring well, aerial photos, previous inspections), if available: Remarks: Assumed by non-hydric soil.
Project Site: Issaquah Farms

US Army Corps of Engineers Western Mountains, Valleys, and Coast – Version 2.0
WETLAND DETERMINATION DATA FORM – Western Mountains, Valleys, and Coast Region
VEGETATION – Use scientific names of plants Tree Stratum (Plot size: 1/100 acre) Absolute
% Cover Dominant Species?
Indicator Status Dominance Test Worksheet:
1. n/a* - Number of Dominant Species That Are OBL, FACW, or FAC: 2 (A)
2. Alnus rubra 65 yes FAC
3. Total Number of Dominant Species Across All Strata: 2 (B)
4.
50% = , 20% = 65 = Total Cover Percent of Dominant Species That Are OBL, FACW, or FAC: 100 (A/B)
Sapling/Shrub Stratum (Plot size: 1/100 acre)
1. Ilex sp. 5 no NL (UPL) Prevalence Index worksheet:
2. Rubus spectabilis 75 yes FAC Total % Cover of: Multiply by:
3. Oemleria cerasiformis T no FACU OBL species x1 =
4. FACW species x2 =
5. FAC species x3 =
50% = , 20% = 75 = Total Cover FACU species x4 =
Herb Stratum (Plot size: 1/100 acre) UPL species x5 =
1. Polystichum munitum 15 no FACU Column Totals: (A) (B)
2. Prevalence Index = B/A =
3. Hydrophytic Vegetation Indicators:
4. 1 – Rapid Test for Hydrophytic Vegetation
5. 2 - Dominance Test is >50%
6. 3 - Prevalence Index is <3.01 7.
4 - Morphological Adaptations1 (Provide supporting data in Remarks or on a separate sheet) 8.
9. 5 - Wetland Non-Vascular Plants1
10. Problematic Hydrophytic Vegetation1 (Explain) 11.
1Indicators of hydric soil and wetland hydrology must be present, unless disturbed or problematic. 50% = , 20% = 15 = Total Cover
Woody Vine Stratum (Plot size: )
1. Hydrophytic Vegetation Present?
Yes No 2.
50% = , 20% = = Total Cover
% Bare Ground in Herb Stratum
Remarks: Blackberry is a dominant shrub cover in this portion of the site.
Project Site: Issaquah Farms City/County: Issaquah/King Sampling Date: 9/22/14
Applicant/Owner: Derek Doke State: WA Sampling Point: 6
Investigator(s): Gary Schulz Section, Township, Range: 20,24N,6E
Landform (hillslope, terrace, etc.): hillslope Local relief (concave, convex, none): none Slope (%): 5
Subregion (LRR): Lat: Long: Datum:
Soil Map Unit Name: Mixed alluvial land (Ma) NWI classification:
Are climatic / hydrologic conditions on the site typical for this time of year? Yes No (If no, explain in Remarks.)
Are Vegetation , Soil , or Hydrology , significantly disturbed? Are “Normal Circumstances” present? Yes No
Are Vegetation , Soil , or Hydrology , naturally problematic? (If needed, explain any answers in Remarks.)
SUMMARY OF FINDINGS – Attach site map showing sampling point locations, transects, important features, etc. Hydrophytic Vegetation Present? Yes No
Is the Sampled Area within a Wetland? Yes No Hydric Soil Present? Yes No
Wetland Hydrology Present? Yes No
Remarks:
Plot is outside of wetland flag A-16.
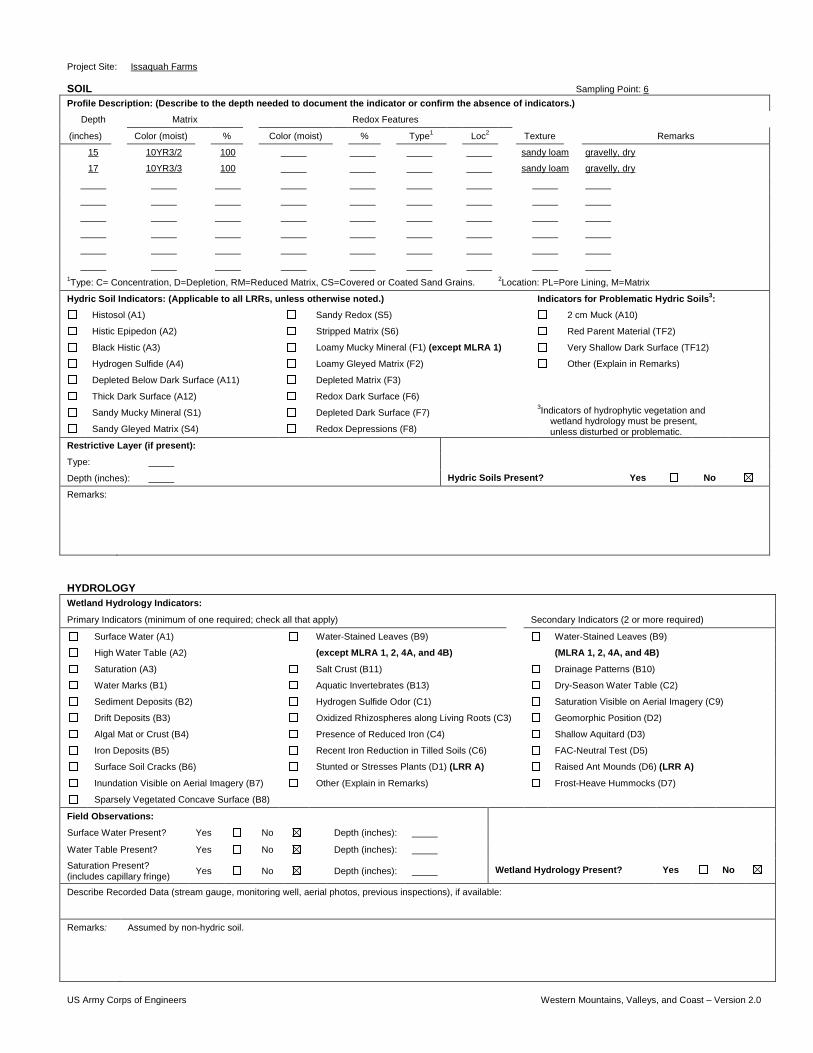
US Army Corps of Engineers Western Mountains, Valleys, and Coast – Version 2.0
SOIL Sampling Point: 6 Profile Description: (Describe to the depth needed to document the indicator or confirm the absence of indicators.)
Depth Matrix Redox Features
(inches) Color (moist) % Color (moist) % Type1 Loc2 Texture Remarks
15 10YR3/2 100 sandy loam gravelly, dry
17 10YR3/3 100 sandy loam gravelly, dry
1Type: C= Concentration, D=Depletion, RM=Reduced Matrix, CS=Covered or Coated Sand Grains. 2Location: PL=Pore Lining, M=Matrix
Hydric Soil Indicators: (Applicable to all LRRs, unless otherwise noted.) Indicators for Problematic Hydric Soils3:
Histosol (A1) Sandy Redox (S5) 2 cm Muck (A10)
Histic Epipedon (A2) Stripped Matrix (S6) Red Parent Material (TF2)
Black Histic (A3) Loamy Mucky Mineral (F1) (except MLRA 1) Very Shallow Dark Surface (TF12)
Hydrogen Sulfide (A4) Loamy Gleyed Matrix (F2) Other (Explain in Remarks)
Depleted Below Dark Surface (A11) Depleted Matrix (F3)
3Indicators of hydrophytic vegetation and wetland hydrology must be present, unless disturbed or problematic.
Thick Dark Surface (A12) Redox Dark Surface (F6)
Sandy Mucky Mineral (S1) Depleted Dark Surface (F7)
Sandy Gleyed Matrix (S4) Redox Depressions (F8)
Restrictive Layer (if present):
Hydric Soils Present? Yes No
Type:
Depth (inches):
Remarks:
HYDROLOGY Wetland Hydrology Indicators:
Primary Indicators (minimum of one required; check all that apply) Secondary Indicators (2 or more required)
Surface Water (A1) Water-Stained Leaves (B9) Water-Stained Leaves (B9)
High Water Table (A2) (except MLRA 1, 2, 4A, and 4B) (MLRA 1, 2, 4A, and 4B)
Saturation (A3) Salt Crust (B11) Drainage Patterns (B10)
Water Marks (B1) Aquatic Invertebrates (B13) Dry-Season Water Table (C2)
Sediment Deposits (B2) Hydrogen Sulfide Odor (C1) Saturation Visible on Aerial Imagery (C9)
Drift Deposits (B3) Oxidized Rhizospheres along Living Roots (C3) Geomorphic Position (D2)
Algal Mat or Crust (B4) Presence of Reduced Iron (C4) Shallow Aquitard (D3)
Iron Deposits (B5) Recent Iron Reduction in Tilled Soils (C6) FAC-Neutral Test (D5)
Surface Soil Cracks (B6) Stunted or Stresses Plants (D1) (LRR A) Raised Ant Mounds (D6) (LRR A)
Inundation Visible on Aerial Imagery (B7) Other (Explain in Remarks) Frost-Heave Hummocks (D7)
Sparsely Vegetated Concave Surface (B8)
Field Observations:
Surface Water Present? Yes No Depth (inches): Wetland Hydrology Present?
Yes
No
Water Table Present? Yes No Depth (inches):
Saturation Present? (includes capillary fringe) Yes No Depth (inches):
Describe Recorded Data (stream gauge, monitoring well, aerial photos, previous inspections), if available: Remarks: Assumed by non-hydric soil.
Project Site: Issaquah Farms
US Army Corps of Engineers Western Mountains, Valleys, and Coast – Version 2.0
WETLAND DETERMINATION DATA FORM – Western Mountains, Valleys, and Coast Region
VEGETATION – Use scientific names of plants Tree Stratum (Plot size: 1/100 acre) Absolute
% Cover Dominant Species?
Indicator Status Dominance Test Worksheet:
1. n/a* - Number of Dominant Species That Are OBL, FACW, or FAC: 1 (A)
2. Populus balsamifera 25 yes FAC
3. Total Number of Dominant Species Across All Strata: 2 (B)
4.
50% = , 20% = 25 = Total Cover Percent of Dominant Species That Are OBL, FACW, or FAC: 50 (A/B)
Sapling/Shrub Stratum (Plot size: 1/100 acre)
1. Rubus discolor 80 yes FACU Prevalence Index worksheet:
2. Rubus spectabilis T no FAC Total % Cover of: Multiply by:
3. OBL species x1 =
4. FACW species x2 =
5. FAC species x3 =
50% = , 20% = 80 = Total Cover FACU species x4 =
Herb Stratum (Plot size: 1/100 acre) UPL species x5 =
1. Athyrium felix-femina 5 no FACW Column Totals: (A) (B)
2. Geum macrophyllum 5 no FAC Prevalence Index = B/A =
3. Hydrophytic Vegetation Indicators:
4. 1 – Rapid Test for Hydrophytic Vegetation
5. 2 - Dominance Test is >50%
6. 3 - Prevalence Index is <3.01 7.
4 - Morphological Adaptations1 (Provide supporting data in Remarks or on a separate sheet) 8.
9. 5 - Wetland Non-Vascular Plants1
10. Problematic Hydrophytic Vegetation1 (Explain) 11.
1Indicators of hydric soil and wetland hydrology must be present, unless disturbed or problematic. 50% = , 20% = 10 = Total Cover
Woody Vine Stratum (Plot size: )
1. Hydrophytic Vegetation Present?
Yes No 2.
50% = , 20% = = Total Cover
% Bare Ground in Herb Stratum
Remarks: Blackberry is a dominant shrub cover in this portion of the site.
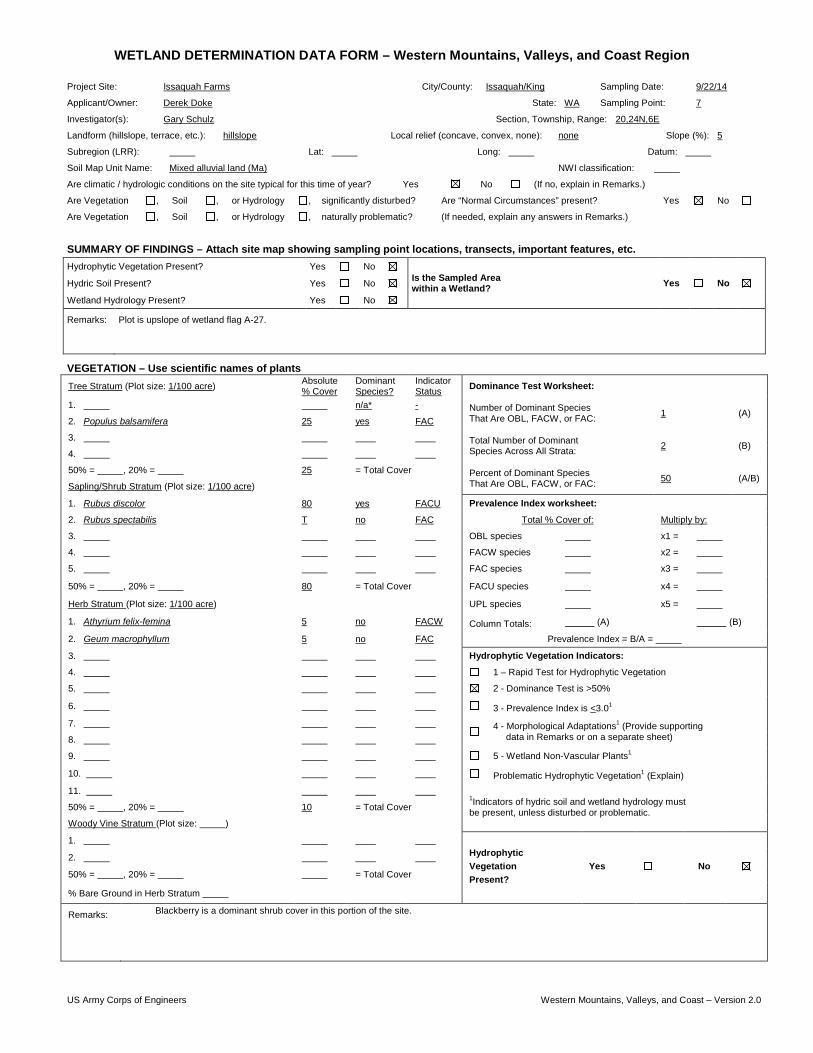
Project Site: Issaquah Farms City/County: Issaquah/King Sampling Date: 9/22/14
Applicant/Owner: Derek Doke State: WA Sampling Point: 7
Investigator(s): Gary Schulz Section, Township, Range: 20,24N,6E
Landform (hillslope, terrace, etc.): hillslope Local relief (concave, convex, none): none Slope (%): 5
Subregion (LRR): Lat: Long: Datum:
Soil Map Unit Name: Mixed alluvial land (Ma) NWI classification:
Are climatic / hydrologic conditions on the site typical for this time of year? Yes No (If no, explain in Remarks.)
Are Vegetation , Soil , or Hydrology , significantly disturbed? Are “Normal Circumstances” present? Yes No
Are Vegetation , Soil , or Hydrology , naturally problematic? (If needed, explain any answers in Remarks.)
SUMMARY OF FINDINGS – Attach site map showing sampling point locations, transects, important features, etc. Hydrophytic Vegetation Present? Yes No
Is the Sampled Area within a Wetland? Yes No Hydric Soil Present? Yes No
Wetland Hydrology Present? Yes No
Remarks:
Plot is upslope of wetland flag A-27.
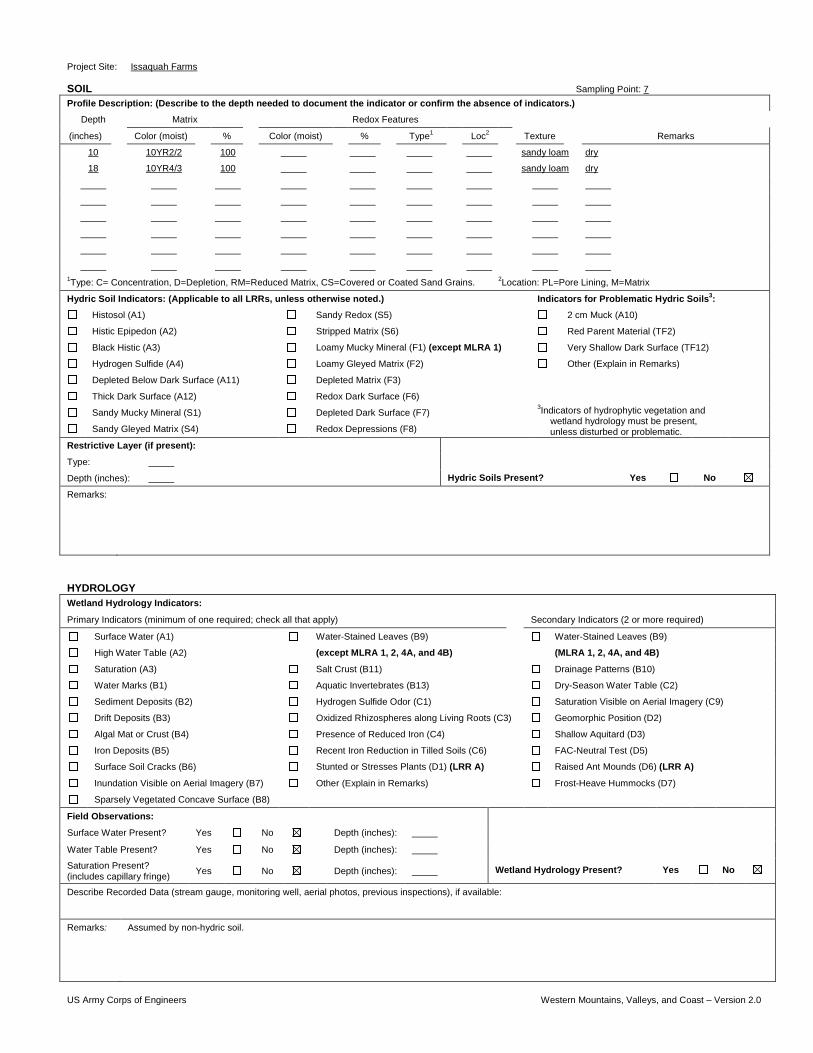
US Army Corps of Engineers Western Mountains, Valleys, and Coast – Version 2.0
SOIL Sampling Point: 7 Profile Description: (Describe to the depth needed to document the indicator or confirm the absence of indicators.)
Depth Matrix Redox Features
(inches) Color (moist) % Color (moist) % Type1 Loc2 Texture Remarks
10 10YR2/2 100 sandy loam dry
18 10YR4/3 100 sandy loam dry
1Type: C= Concentration, D=Depletion, RM=Reduced Matrix, CS=Covered or Coated Sand Grains. 2Location: PL=Pore Lining, M=Matrix
Hydric Soil Indicators: (Applicable to all LRRs, unless otherwise noted.) Indicators for Problematic Hydric Soils3:
Histosol (A1) Sandy Redox (S5) 2 cm Muck (A10)
Histic Epipedon (A2) Stripped Matrix (S6) Red Parent Material (TF2)
Black Histic (A3) Loamy Mucky Mineral (F1) (except MLRA 1) Very Shallow Dark Surface (TF12)
Hydrogen Sulfide (A4) Loamy Gleyed Matrix (F2) Other (Explain in Remarks)
Depleted Below Dark Surface (A11) Depleted Matrix (F3)
3Indicators of hydrophytic vegetation and wetland hydrology must be present, unless disturbed or problematic.
Thick Dark Surface (A12) Redox Dark Surface (F6)
Sandy Mucky Mineral (S1) Depleted Dark Surface (F7)
Sandy Gleyed Matrix (S4) Redox Depressions (F8)
Restrictive Layer (if present):
Hydric Soils Present? Yes No
Type:
Depth (inches):
Remarks:
HYDROLOGY Wetland Hydrology Indicators:
Primary Indicators (minimum of one required; check all that apply) Secondary Indicators (2 or more required)
Surface Water (A1) Water-Stained Leaves (B9) Water-Stained Leaves (B9)
High Water Table (A2) (except MLRA 1, 2, 4A, and 4B) (MLRA 1, 2, 4A, and 4B)
Saturation (A3) Salt Crust (B11) Drainage Patterns (B10)
Water Marks (B1) Aquatic Invertebrates (B13) Dry-Season Water Table (C2)
Sediment Deposits (B2) Hydrogen Sulfide Odor (C1) Saturation Visible on Aerial Imagery (C9)
Drift Deposits (B3) Oxidized Rhizospheres along Living Roots (C3) Geomorphic Position (D2)
Algal Mat or Crust (B4) Presence of Reduced Iron (C4) Shallow Aquitard (D3)
Iron Deposits (B5) Recent Iron Reduction in Tilled Soils (C6) FAC-Neutral Test (D5)
Surface Soil Cracks (B6) Stunted or Stresses Plants (D1) (LRR A) Raised Ant Mounds (D6) (LRR A)
Inundation Visible on Aerial Imagery (B7) Other (Explain in Remarks) Frost-Heave Hummocks (D7)
Sparsely Vegetated Concave Surface (B8)
Field Observations:
Surface Water Present? Yes No Depth (inches): Wetland Hydrology Present?
Yes
No
Water Table Present? Yes No Depth (inches):
Saturation Present? (includes capillary fringe) Yes No Depth (inches):
Describe Recorded Data (stream gauge, monitoring well, aerial photos, previous inspections), if available: Remarks: Assumed by non-hydric soil.
Project Site: Issaquah Farms

15
APPENDIX C
WETLAND RATING FORMS


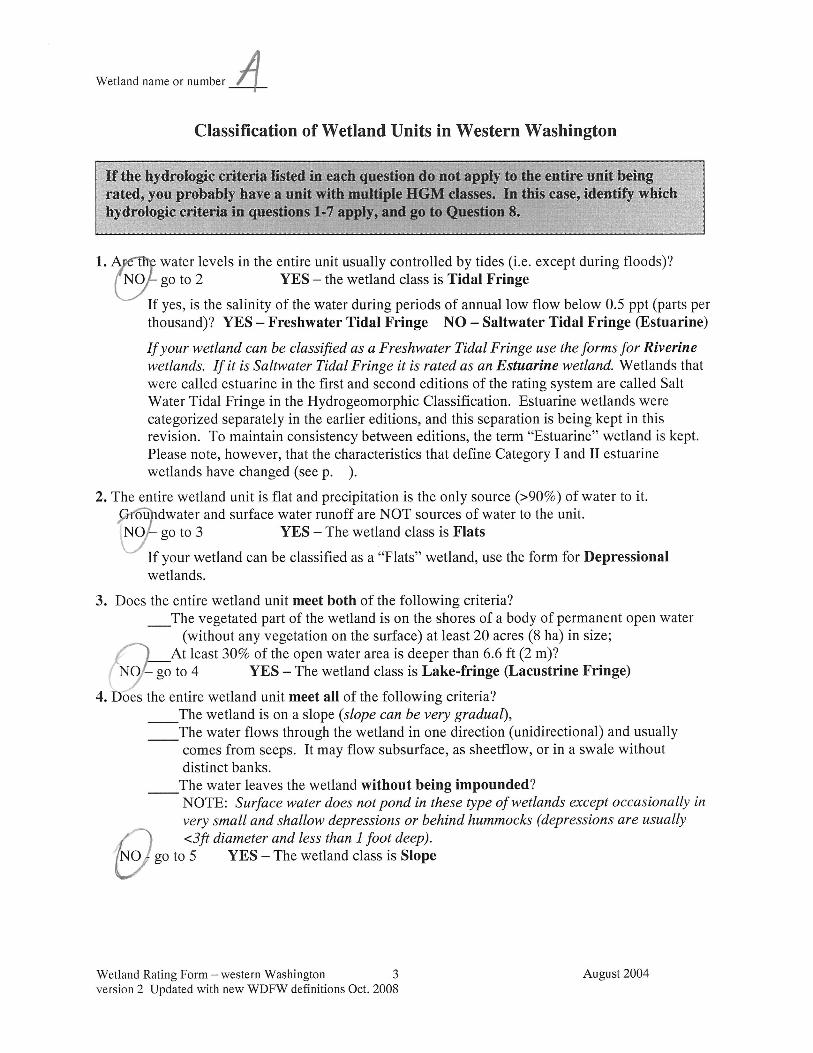
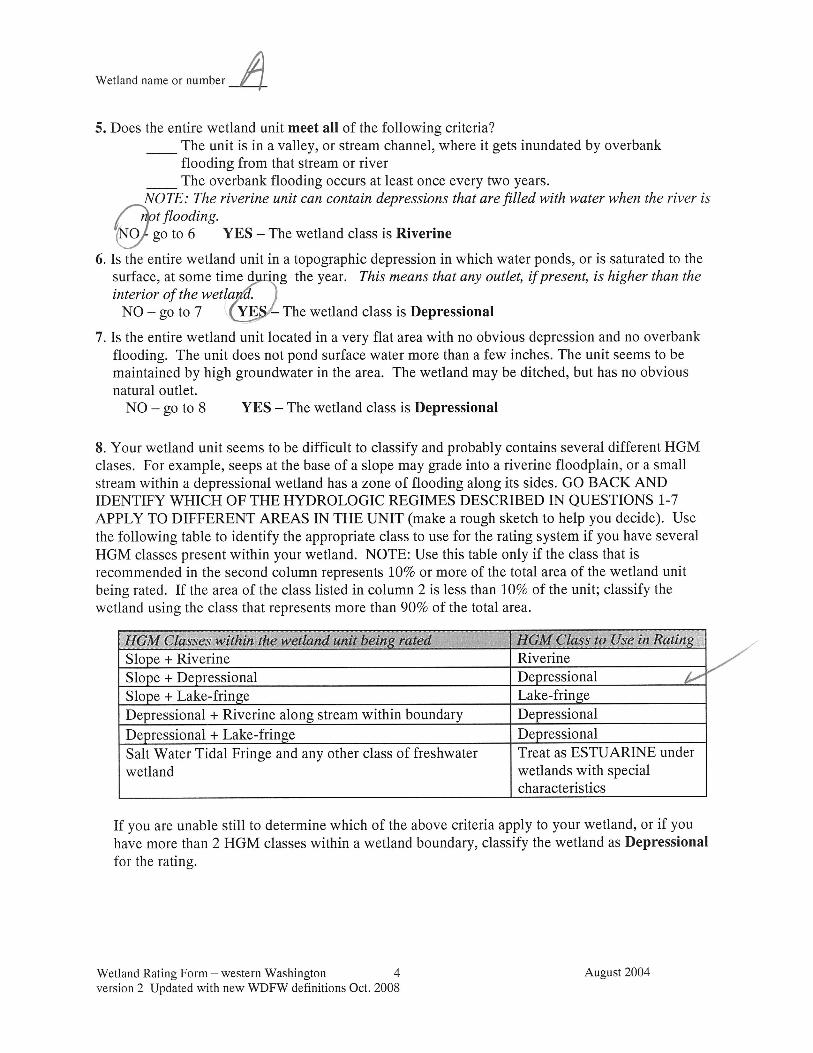
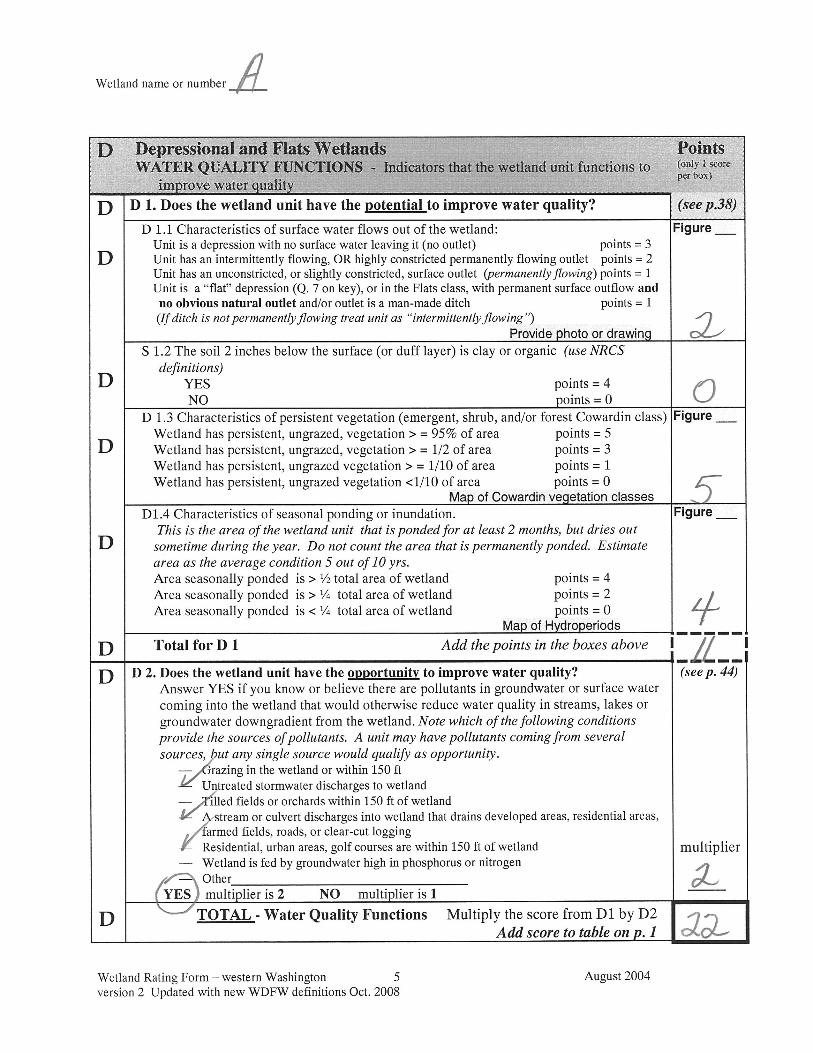
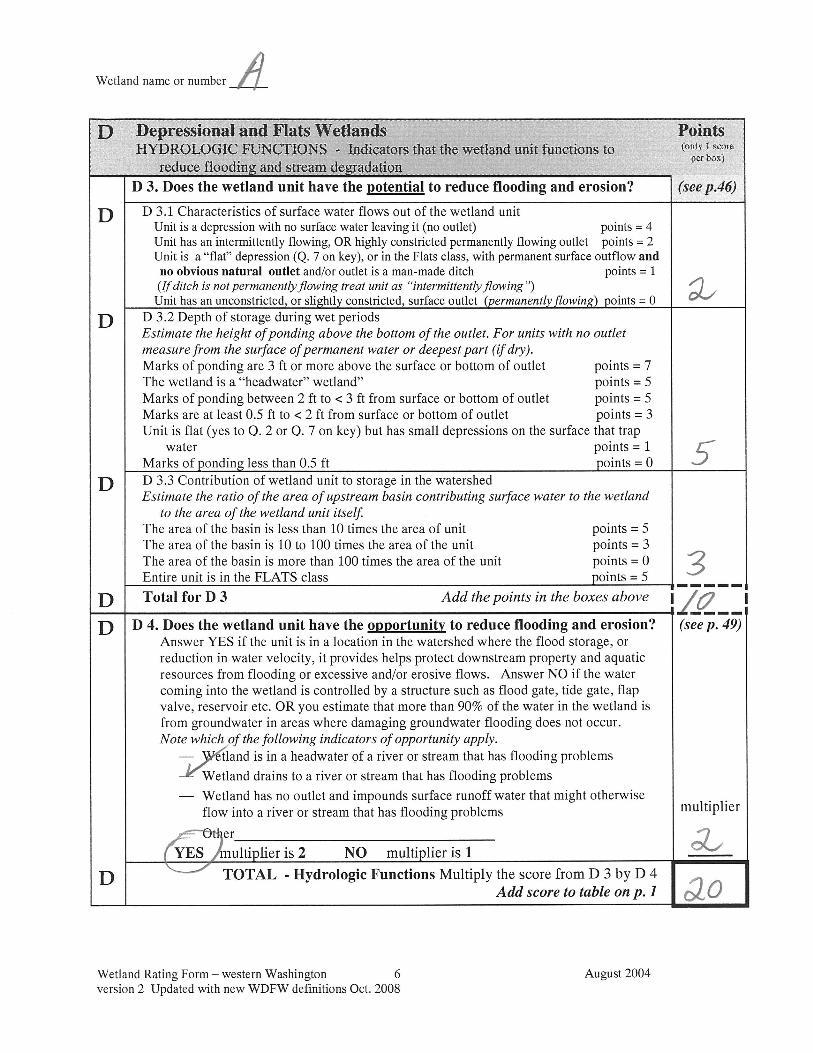
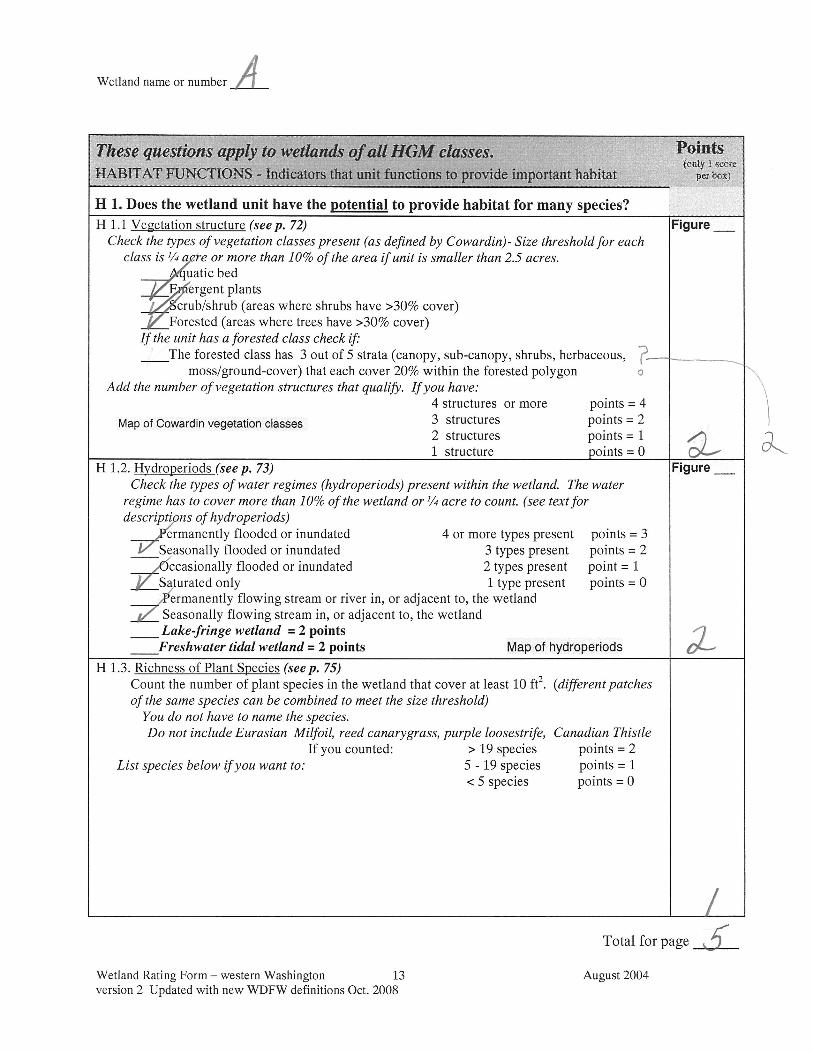
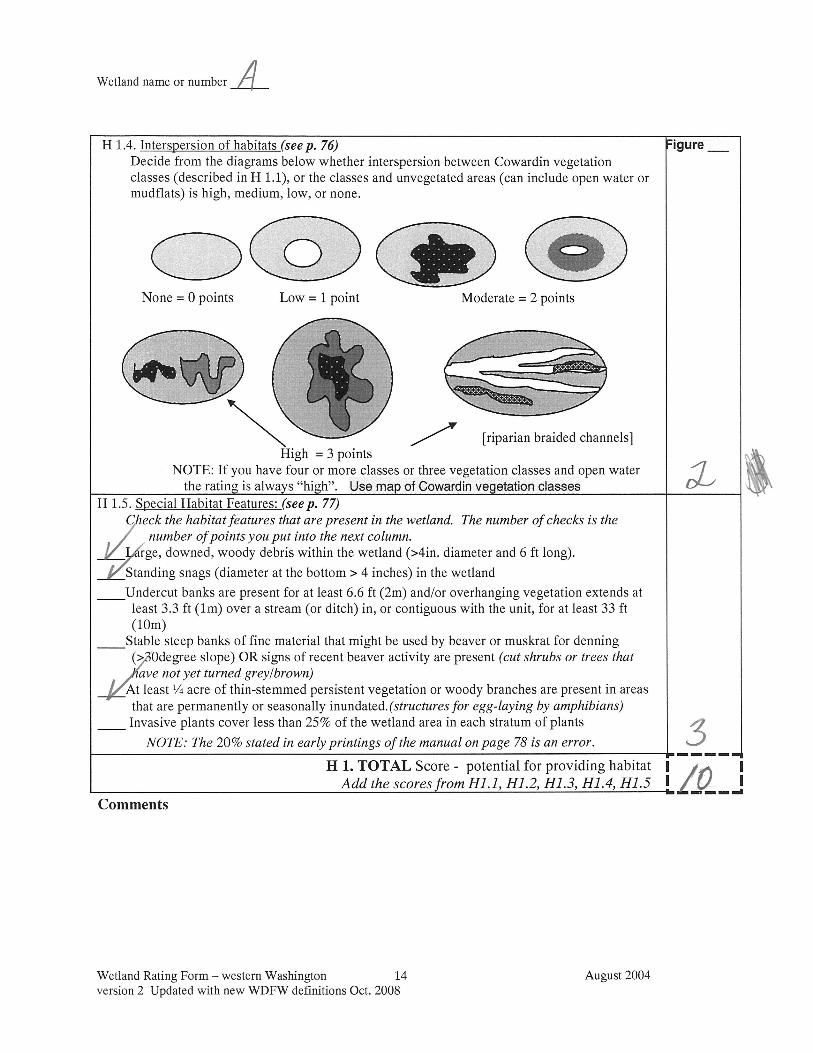
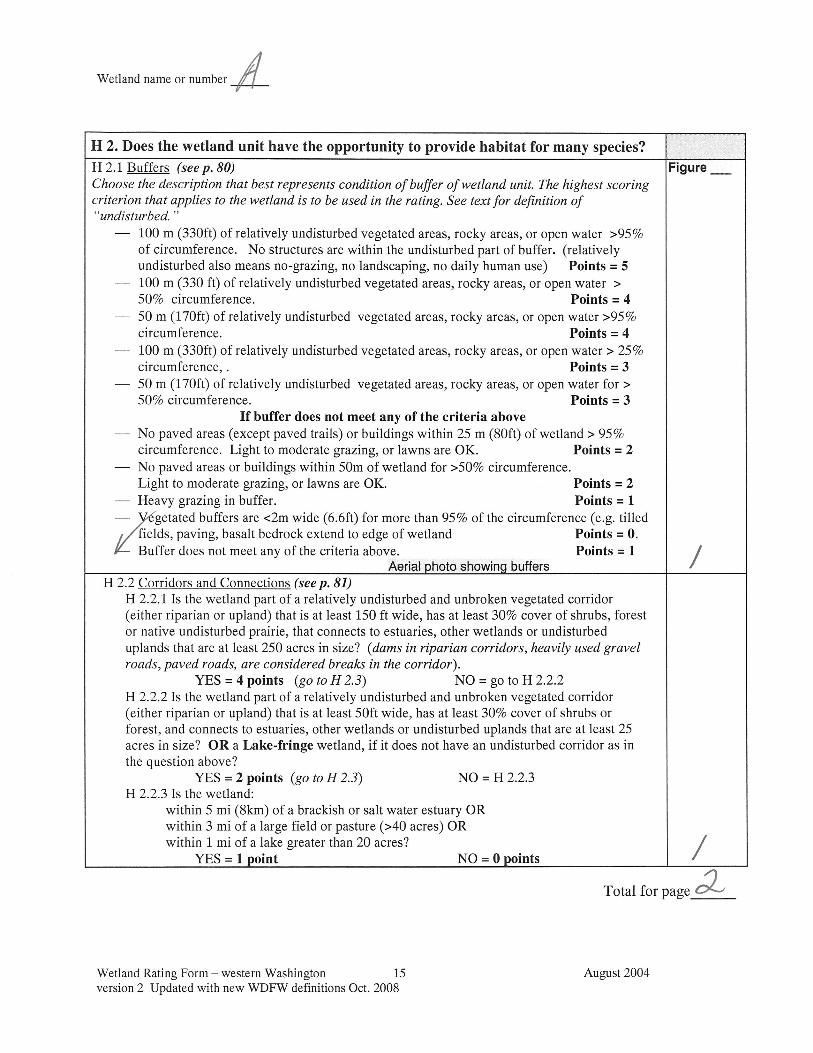
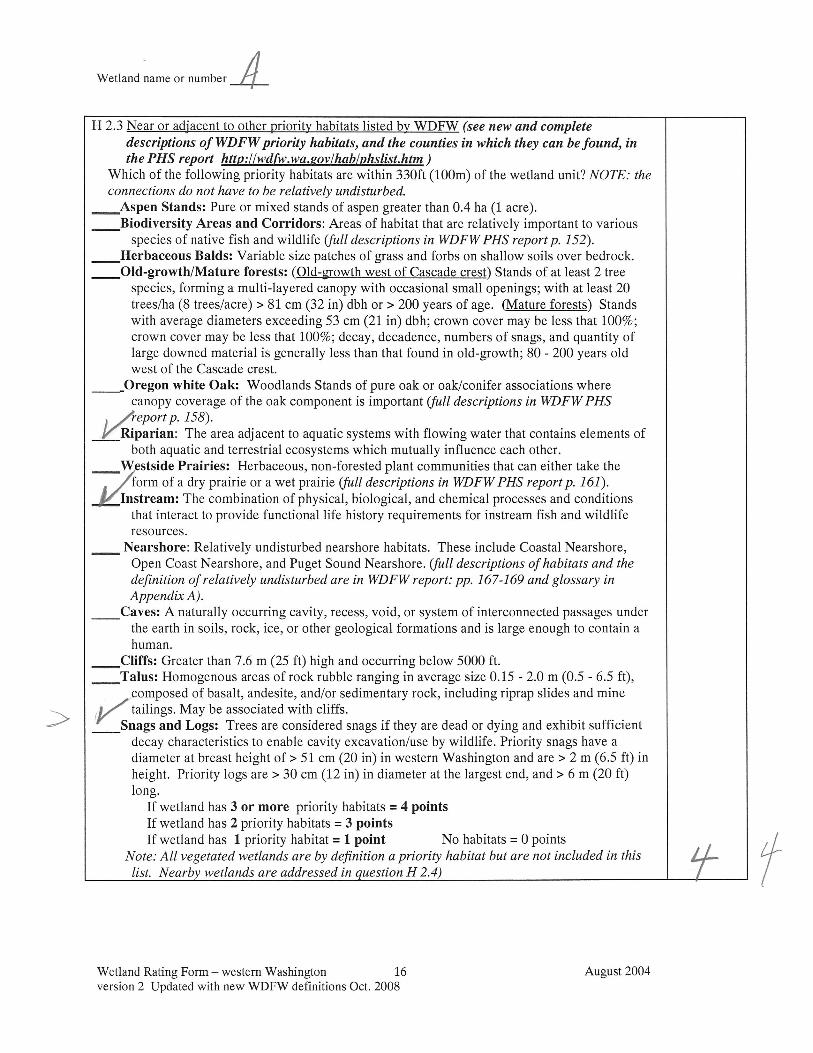
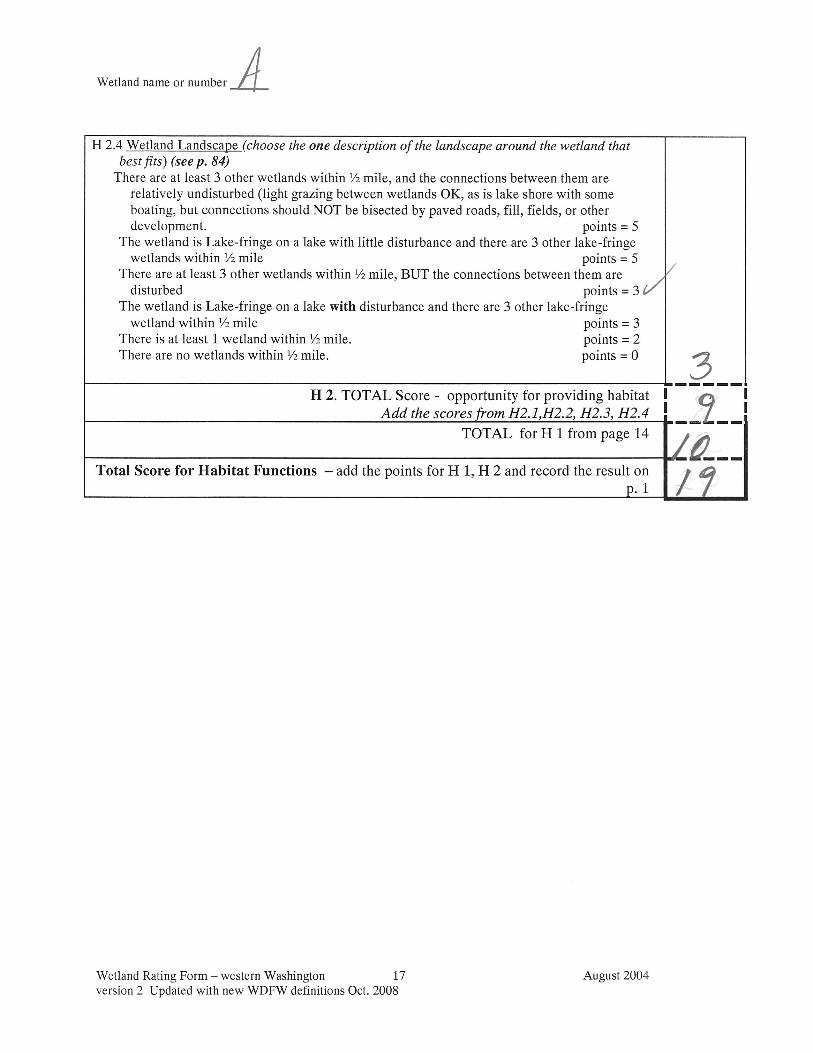
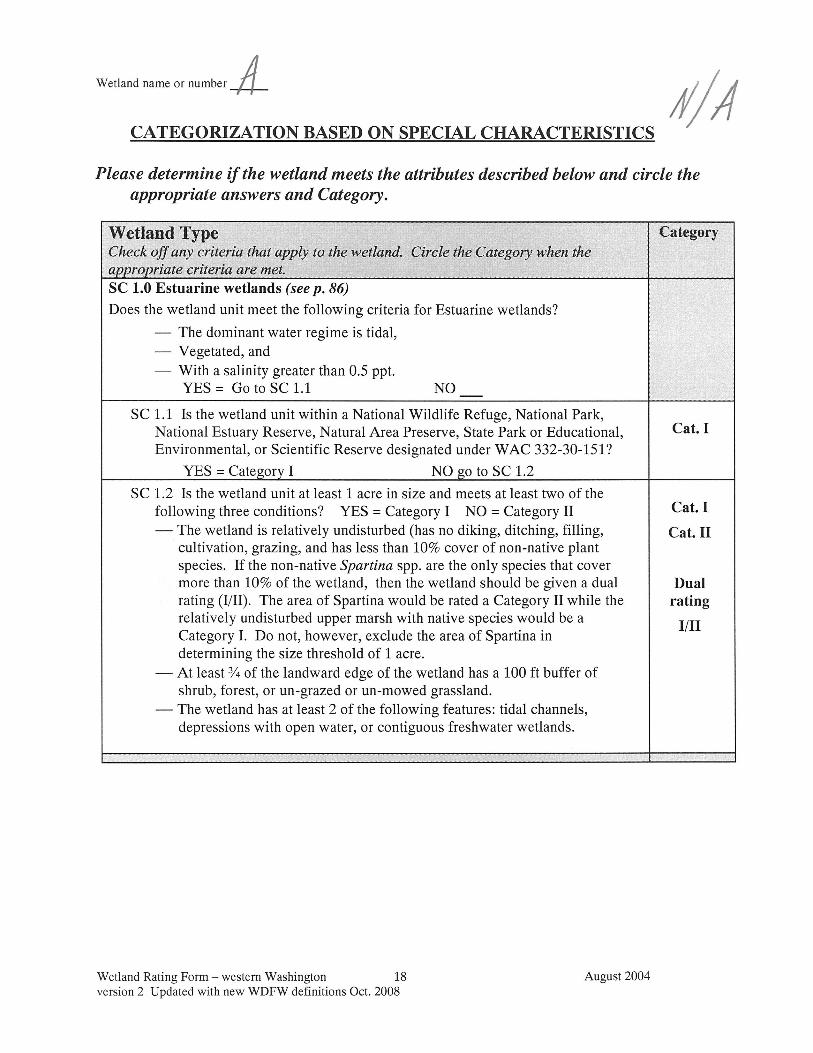
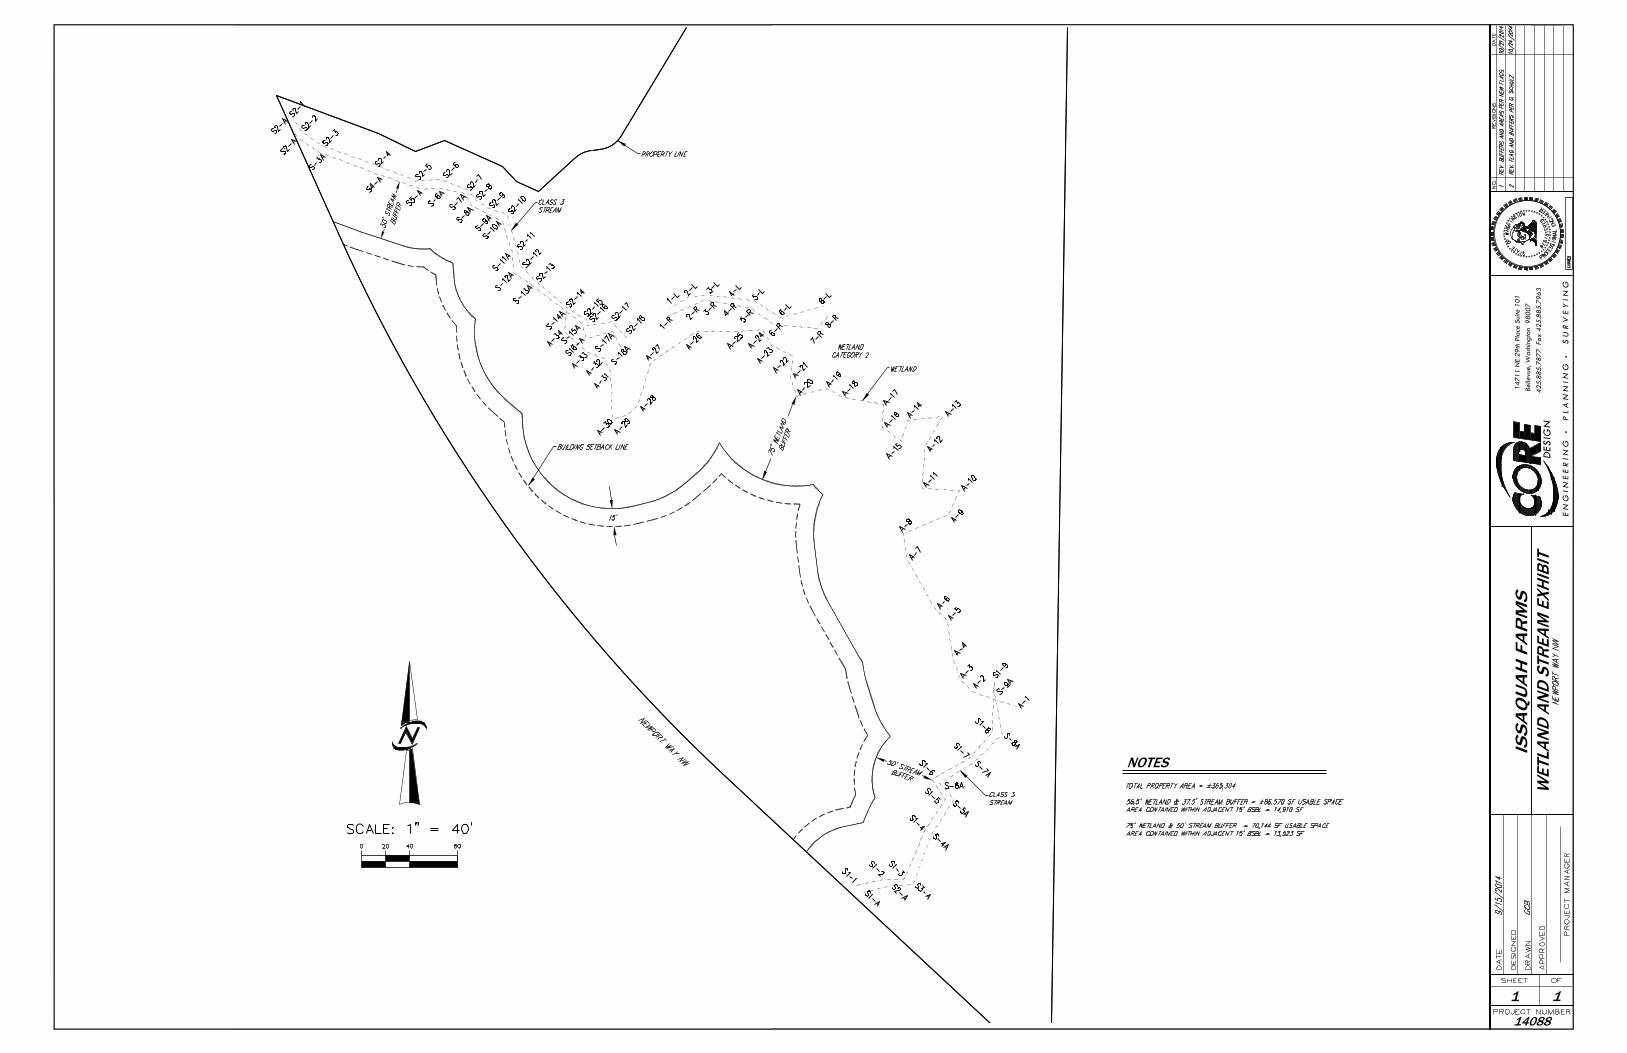
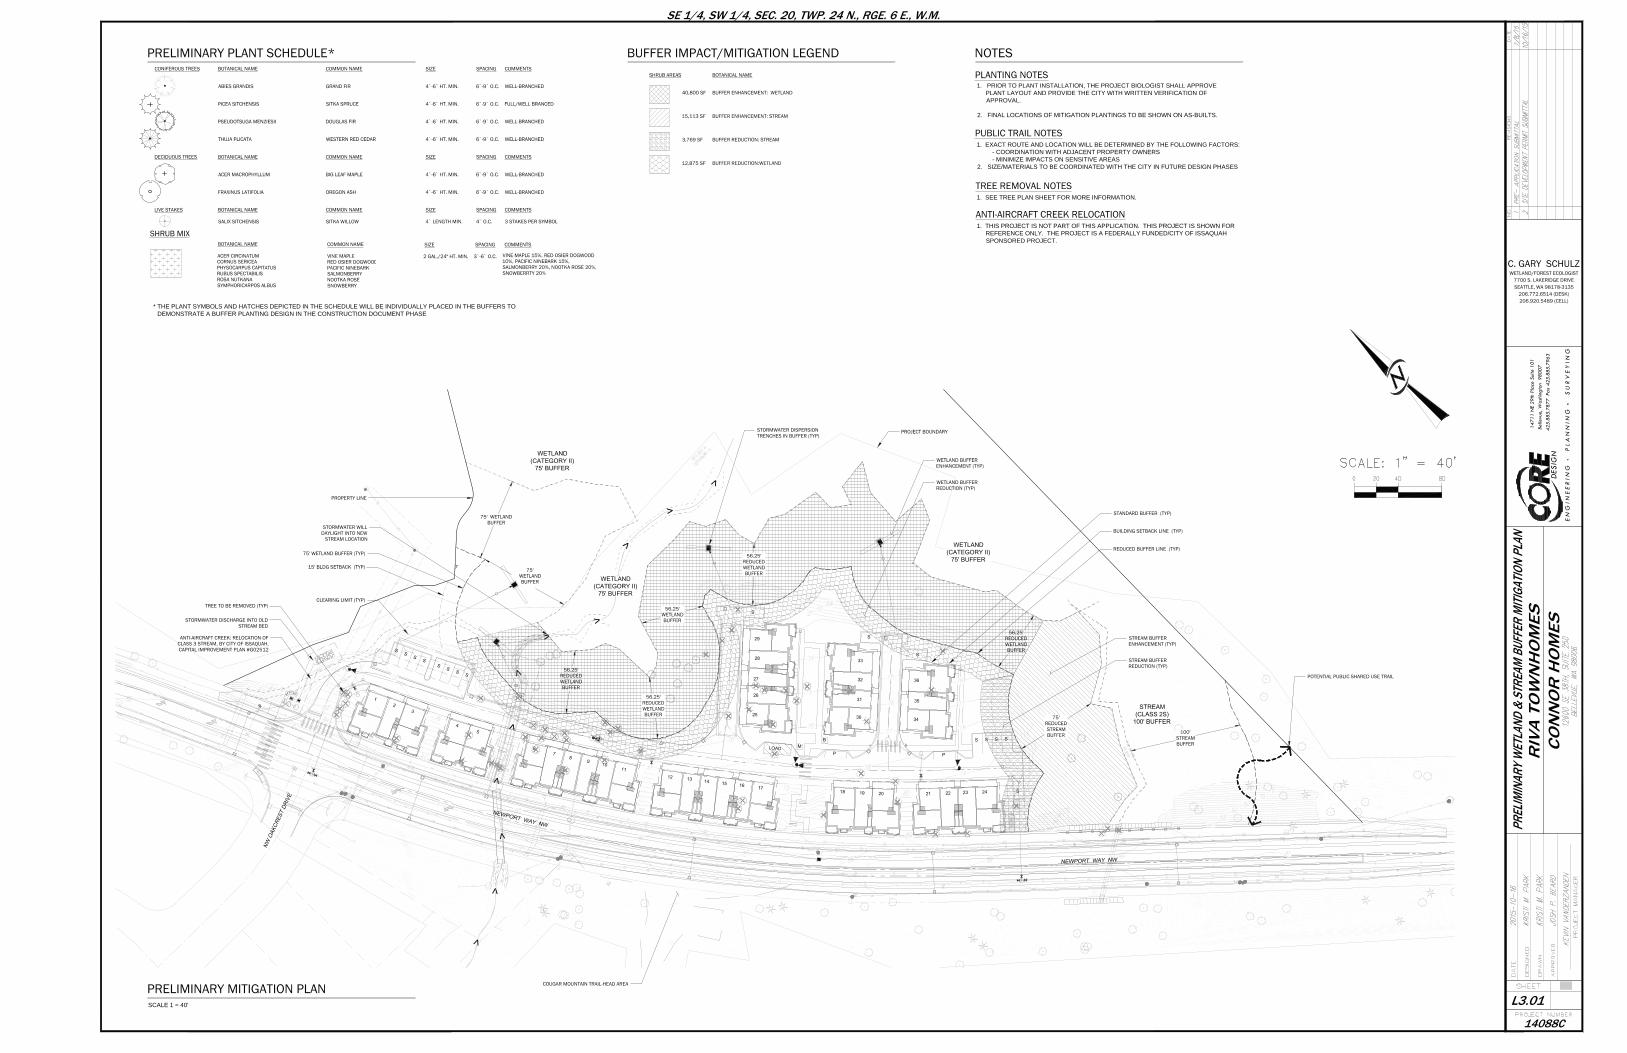
PRELIMINARY MITIGATION PLANSCALE 1 = 40'
PRELIMINARY PLANT SCHEDULE* BUFFER IMPACT/MITIGATION LEGEND NOTES
1. PRIOR TO PLANT INSTALLATION, THE PROJECT BIOLOGIST SHALL APPROVEPLANT LAYOUT AND PROVIDE THE CITY WITH WRITTEN VERIFICATION OFAPPROVAL.
2. FINAL LOCATIONS OF MITIGATION PLANTINGS TO BE SHOWN ON AS-BUILTS.
PROPERTY LINE
75' WETLAND BUFFER (TYP)
CLEARING LIMIT (TYP)
STORMWATER DISCHARGE INTO OLDSTREAM BED
STORMWATER WILLDAYLIGHT INTO NEW
STREAM LOCATION
STORMWATER DISPERSIONTRENCHES IN BUFFER (TYP)
15' BLDG SETBACK (TYP)
POTENTIAL PUBLIC SHARED USE TRAIL
COUGAR MOUNTAIN TRAIL-HEAD AREA
PLANTING NOTES
PUBLIC TRAIL NOTES1. EXACT ROUTE AND LOCATION WILL BE DETERMINED BY THE FOLLOWING FACTORS:
- COORDINATION WITH ADJACENT PROPERTY OWNERS - MINIMIZE IMPACTS ON SENSITIVE AREAS
2. SIZE/MATERIALS TO BE COORDINATED WITH THE CITY IN FUTURE DESIGN PHASES
ANTI-AIRCRAFT CREEK: RELOCATION OFCLASS 3 STREAM, BY CITY OF ISSAQUAH,CAPITAL IMPROVEMENT PLAN #G02512
TREE TO BE REMOVED (TYP)
TREE REMOVAL NOTES1. SEE TREE PLAN SHEET FOR MORE INFORMATION.
PROJECT BOUNDARY
WETLAND BUFFERENHANCEMENT (TYP)
WETLAND BUFFERREDUCTION (TYP)
STREAM BUFFERENHANCEMENT (TYP)
STREAM BUFFERREDUCTION (TYP)
* THE PLANT SYMBOLS AND HATCHES DEPICTED IN THE SCHEDULE WILL BE INDIVIDUALLY PLACED IN THE BUFFERS TODEMONSTRATE A BUFFER PLANTING DESIGN IN THE CONSTRUCTION DOCUMENT PHASE
C. GARY SCHULZWETLAND/FOREST ECOLOGIST
7700 S. LAKERIDGE DRIVESEATTLE, WA 98178-3135
206.772.6514 (DESK)206.920.5489 (CELL)
STANDARD BUFFER (TYP)
BUILDING SETBACK LINE (TYP)
REDUCED BUFFER LINE (TYP)
ANTI-AIRCRAFT CREEK RELOCATION1. THIS PROJECT IS NOT PART OF THIS APPLICATION. THIS PROJECT IS SHOWN FOR
REFERENCE ONLY. THE PROJECT IS A FEDERALLY FUNDED/CITY OF ISSAQUAHSPONSORED PROJECT.