Embed Size (px)
Citation preview
Journal of Mechanical Science and Technology 22 (2008) 1163~1173
www.springerlink.com/content/1738-494x
Journal of
Mechanical Science and Technology
Wet bar detection by using water absorption detector
Hee Soo Kim1,*, Yong Chae Bae1 and Chang Doo Kee2 1Korea Electric Power Research Institute, Power Generation Lab., Mechanical Maintenance Service Technology Group
2Chonnam National Univ. Mechanical Engineering
(Manuscript Received August 6, 2007; Revised November 9, 2007; Accepted April 3, 2008)
--------------------------------------------------------------------------------------------------------------------------------------------------------------------------------------------------------------------------------------------------------
Abstract Water leaks in water-cooled generator stator windings can generate serious accidents such as insulation breakdown
and result in unexpected sudden outages. Thus, it is important to diagnose their water absorption for effective operation of the power plant. Especially, since the capacitance values that are measured for diagnosis are very small so special diagnosis methods like stochastic theory are needed. KEPRI developed a more advanced water absorption detector and diagnosis technology for it. They were applied to a real system and the results of the water absorption test for stator windings agree with the water leak test.
Keywords: Generator stator windings; Wet bar diagnosis; Stochastic methods; Water absorption test; Leak test --------------------------------------------------------------------------------------------------------------------------------------------------------------------------------------------------------------------------------------------------------
1. Introduction
Due to coolant water leakage during operation, an unexpected outage such as insulation breakdown can occur in the generator stator winding which causes serious damages and much costs and time are needed to repair them. Therefore, a very effective mainte-nance method is needed to diagnose the condition of water absorption of winding insulator in view of pro-active maintenance [1-3].
The accuracy of a general LCR meter is too low to measure the capacitance of a winding insulator be-cause the measurable range of capacitance is very low in the generator stator winding bars. Also, there is a disadvantage that measurement error is very high due to sensor types.
General Electric (GE) measured the capacitance of winding insulators and diagnosed the possibility of wet bars by the capacitance mapping method. GE recommended the stator windings should be replaced within 1 year for the bars which exceed the criterion.
The capacitance mapping test equipment of GE has
several disadvantages. First, it has no a zero setting function so the capacitance value swings up and down around 0 [pF]. Second, as the force which is applied on the sensor is changed, the capacitance value of stator windings is varied. Third, there is no analysis function so the diagnosis results are not dis-played while testing.
The water absorption test equipment was devel-oped in order to evaluate the integrity of water-cooled generator stator windings, and it has been applied to them since 1998. As based on it, a more advanced Gen-SWAD I was developed in 2006 and Gen-SWAD I solved the conventional shortcomings per-fectly.
It is truly difficult to test and diagnose the condition of an insulator because of the structure of stator wind-ings and complexity of the insulator. Actually, the capacitance value between copper and insulator is very low; for example, the capacitance value has an order of 1211 1010 −− − [F]. It is therefore easy to make a serious mistake if you simply decide the wet bar to compare the amplitude of 12105 −× [pF] with
12109 −× [pF]. In order to get to the heart of these errors, in diagnosing the wet bars, a stochastic diag-nosis method such as normal distribution is used [4, 5].
*Corresponding author. Tel.: +82 42 865 5312, Fax.: +82 42 865 5499 E-mail address: [email protected] DOI 10.1007/s12206-008-0404-y
1164 H. S. Kim et al. / Journal of Mechanical Science and Technology 22 (2008) 1163~1173
The diagnosis methods which are proposed in this paper are similar to the capacitance mapping method but have some different characteristics. The capaci-tance diagram method can display the distribution of capacitance of each bar, while other stochastic diag-nosis methods such as normal probability plot and box plot can diagnose the wet bar among many bars. As well, the new developed diagnosis methods are applied to analyze the wet bars for 500MW generator stator windings.
2. Development of water absorption detector
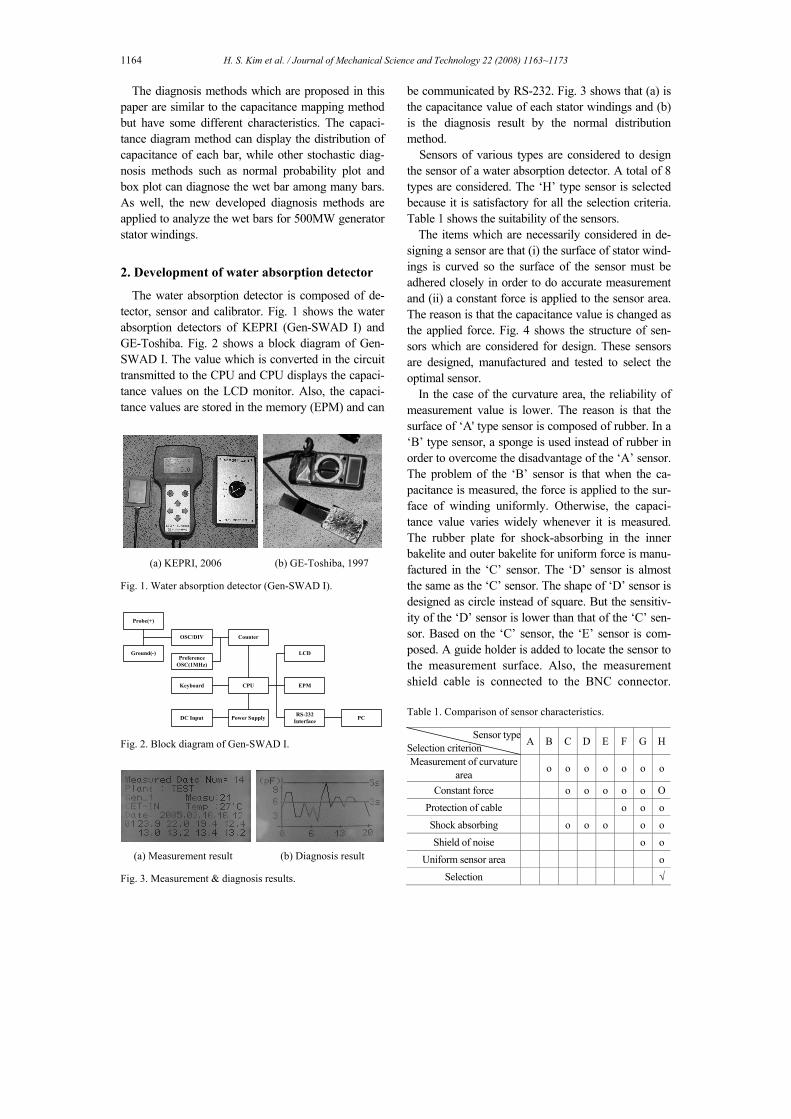
The water absorption detector is composed of de-tector, sensor and calibrator. Fig. 1 shows the water absorption detectors of KEPRI (Gen-SWAD I) and GE-Toshiba. Fig. 2 shows a block diagram of Gen- SWAD I. The value which is converted in the circuit transmitted to the CPU and CPU displays the capaci-tance values on the LCD monitor. Also, the capaci-tance values are stored in the memory (EPM) and can
(a) KEPRI, 2006 (b) GE-Toshiba, 1997 Fig. 1. Water absorption detector (Gen-SWAD I).
Probe(+)
Ground(-)
Keyboard
PreferenceOSC(1MHz)
LCD
CounterOSC/DIV
RS-232Interface
CPU
DC Input Power Supply
EPM
PC
Fig. 2. Block diagram of Gen-SWAD I.
(a) Measurement result (b) Diagnosis result Fig. 3. Measurement & diagnosis results.
be communicated by RS-232. Fig. 3 shows that (a) is the capacitance value of each stator windings and (b) is the diagnosis result by the normal distribution method.
Sensors of various types are considered to design the sensor of a water absorption detector. A total of 8 types are considered. The ‘H’ type sensor is selected because it is satisfactory for all the selection criteria. Table 1 shows the suitability of the sensors.
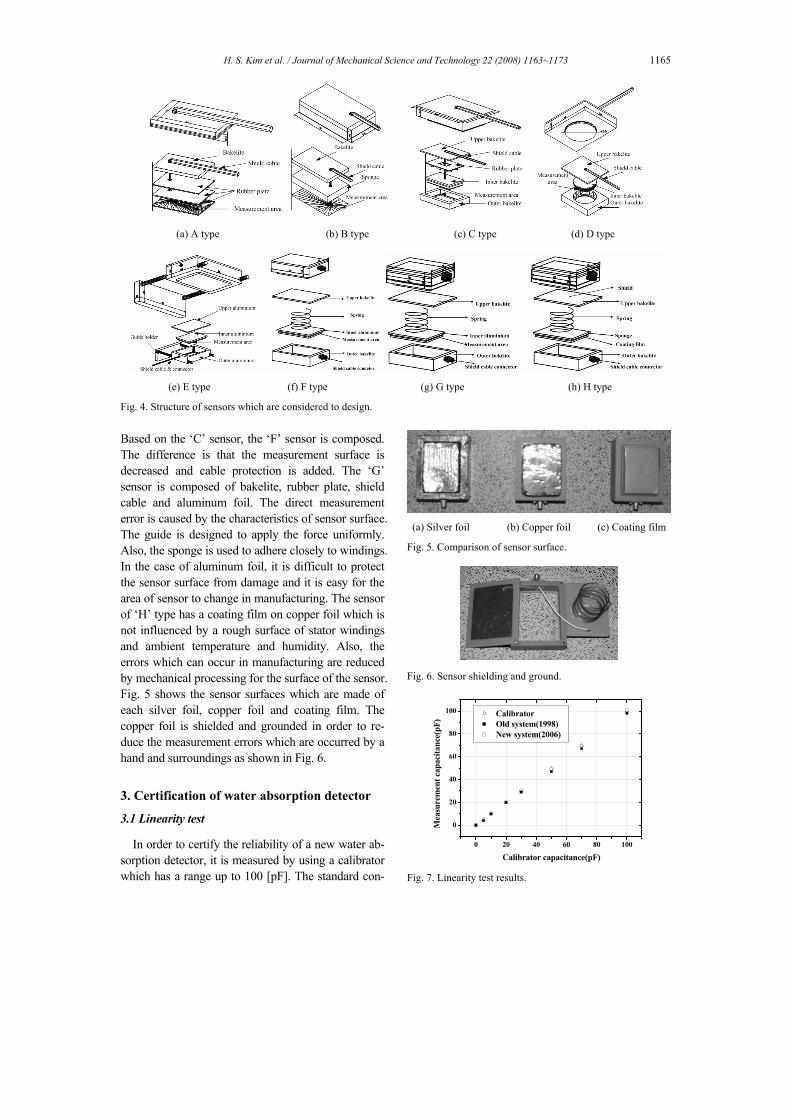
The items which are necessarily considered in de-signing a sensor are that (i) the surface of stator wind-ings is curved so the surface of the sensor must be adhered closely in order to do accurate measurement and (ii) a constant force is applied to the sensor area. The reason is that the capacitance value is changed as the applied force. Fig. 4 shows the structure of sen-sors which are considered for design. These sensors are designed, manufactured and tested to select the optimal sensor.
In the case of the curvature area, the reliability of measurement value is lower. The reason is that the surface of ‘A' type sensor is composed of rubber. In a ‘B’ type sensor, a sponge is used instead of rubber in order to overcome the disadvantage of the ‘A’ sensor. The problem of the ‘B’ sensor is that when the ca-pacitance is measured, the force is applied to the sur-face of winding uniformly. Otherwise, the capaci-tance value varies widely whenever it is measured. The rubber plate for shock-absorbing in the inner bakelite and outer bakelite for uniform force is manu-factured in the ‘C’ sensor. The ‘D’ sensor is almost the same as the ‘C’ sensor. The shape of ‘D’ sensor is designed as circle instead of square. But the sensitiv-ity of the ‘D’ sensor is lower than that of the ‘C’ sen-sor. Based on the ‘C’ sensor, the ‘E’ sensor is com-posed. A guide holder is added to locate the sensor to the measurement surface. Also, the measurement shield cable is connected to the BNC connector.
Table 1. Comparison of sensor characteristics.
Sensor typeSelection criterion A B C D E F G H
Measurement of curvature area o o o o o o o
Constant force o o o o o OProtection of cable o o oShock absorbing o o o o oShield of noise o o
Uniform sensor area oSelection √
H. S. Kim et al. / Journal of Mechanical Science and Technology 22 (2008) 1163~1173 1165
Based on the ‘C’ sensor, the ‘F’ sensor is composed. The difference is that the measurement surface is decreased and cable protection is added. The ‘G’ sensor is composed of bakelite, rubber plate, shield cable and aluminum foil. The direct measurement error is caused by the characteristics of sensor surface. The guide is designed to apply the force uniformly. Also, the sponge is used to adhere closely to windings. In the case of aluminum foil, it is difficult to protect the sensor surface from damage and it is easy for the area of sensor to change in manufacturing. The sensor of ‘H’ type has a coating film on copper foil which is not influenced by a rough surface of stator windings and ambient temperature and humidity. Also, the errors which can occur in manufacturing are reduced by mechanical processing for the surface of the sensor. Fig. 5 shows the sensor surfaces which are made of each silver foil, copper foil and coating film. The copper foil is shielded and grounded in order to re-duce the measurement errors which are occurred by a hand and surroundings as shown in Fig. 6.
3. Certification of water absorption detector
3.1 Linearity test
In order to certify the reliability of a new water ab-sorption detector, it is measured by using a calibrator which has a range up to 100 [pF]. The standard con-
(a) Silver foil (b) Copper foil (c) Coating film Fig. 5. Comparison of sensor surface.
Fig. 6. Sensor shielding and ground.
0 20 40 60 80 100
0
20
40
60
80
100
Mea
sure
men
t cap
acita
nce(
pF)
Calibrator capacitance(pF)
Calibrator Old system(1998) New system(2006)
Fig. 7. Linearity test results.
(a) A type (b) B type (c) C type (d) D type
(e) E type (f) F type (g) G type (h) H type Fig. 4. Structure of sensors which are considered to design.
1166 H. S. Kim et al. / Journal of Mechanical Science and Technology 22 (2008) 1163~1173
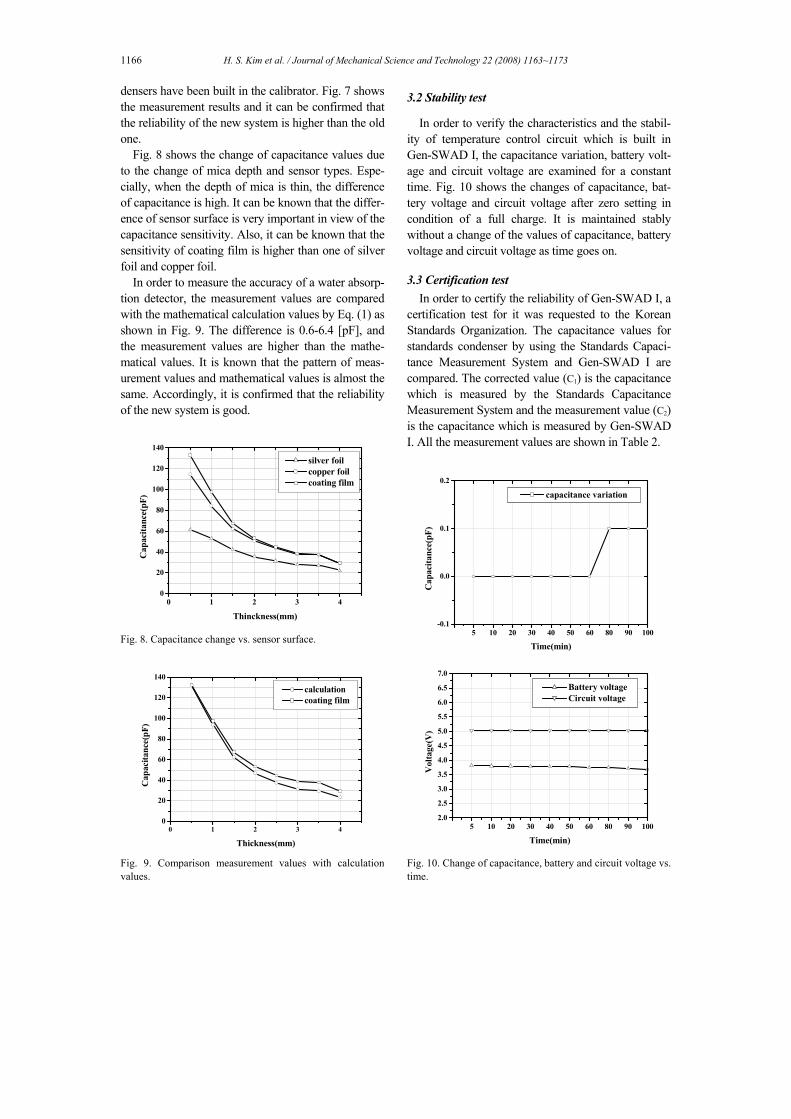
densers have been built in the calibrator. Fig. 7 shows the measurement results and it can be confirmed that the reliability of the new system is higher than the old one.
Fig. 8 shows the change of capacitance values due to the change of mica depth and sensor types. Espe-cially, when the depth of mica is thin, the difference of capacitance is high. It can be known that the differ-ence of sensor surface is very important in view of the capacitance sensitivity. Also, it can be known that the sensitivity of coating film is higher than one of silver foil and copper foil.
In order to measure the accuracy of a water absorp-tion detector, the measurement values are compared with the mathematical calculation values by Eq. (1) as shown in Fig. 9. The difference is 0.6-6.4 [pF], and the measurement values are higher than the mathe-matical values. It is known that the pattern of meas-urement values and mathematical values is almost the same. Accordingly, it is confirmed that the reliability of the new system is good.
0 1 2 3 40
20
40
60
80
100
120
140
Cap
acita
nce(
pF)
Thinckness(mm)
silver foil copper foil coating film
Fig. 8. Capacitance change vs. sensor surface.
0 1 2 3 40
20
40
60
80
100
120
140
Cap
acita
nce(
pF)
Thickness(mm)
calculation coating film
Fig. 9. Comparison measurement values with calculation values.
3.2 Stability test
In order to verify the characteristics and the stabil-ity of temperature control circuit which is built in Gen-SWAD I, the capacitance variation, battery volt-age and circuit voltage are examined for a constant time. Fig. 10 shows the changes of capacitance, bat-tery voltage and circuit voltage after zero setting in condition of a full charge. It is maintained stably without a change of the values of capacitance, battery voltage and circuit voltage as time goes on.
3.3 Certification test
In order to certify the reliability of Gen-SWAD I, a certification test for it was requested to the Korean Standards Organization. The capacitance values for standards condenser by using the Standards Capaci-tance Measurement System and Gen-SWAD I are compared. The corrected value (C1) is the capacitance which is measured by the Standards Capacitance Measurement System and the measurement value (C2) is the capacitance which is measured by Gen-SWAD I. All the measurement values are shown in Table 2.
5 10 20 30 40 50 60 80 90 100-0.1
0.0
0.1
0.2
Cap
acita
nce(
pF)
Time(min)
capacitance variation
5 10 20 30 40 50 60 80 90 1002.0
2.5
3.0
3.5
4.0
4.5
5.0
5.5
6.0
6.5
7.0
Vol
tage
(V)
Time(min)
Battery voltage Circuit voltage
Fig. 10. Change of capacitance, battery and circuit voltage vs. time.
H. S. Kim et al. / Journal of Mechanical Science and Technology 22 (2008) 1163~1173 1167
Table 2. Certification results of Gen-SWAD I.
Corrector (pF)
Setting Measured Corrected C1
Measure- ment C2
(pF)
Error (%)
0 6.47 0 0.0 0.0
5 11.45 4.98 5.0 0.4
10 16.67 10.19 10.2 0.1
20 26.94 20.47 20.5 0.15
30 36.82 30.35 30.3 -0.17
50 55.18 48.71 48.6 -0.23
70 75.69 69.22 69.0 -0.32
100 107.24 100.77 99.9 -0.87
100)(
(%)2
12 ×−
=C
CCError
4. Procedure & measurement for water absorption test [6]
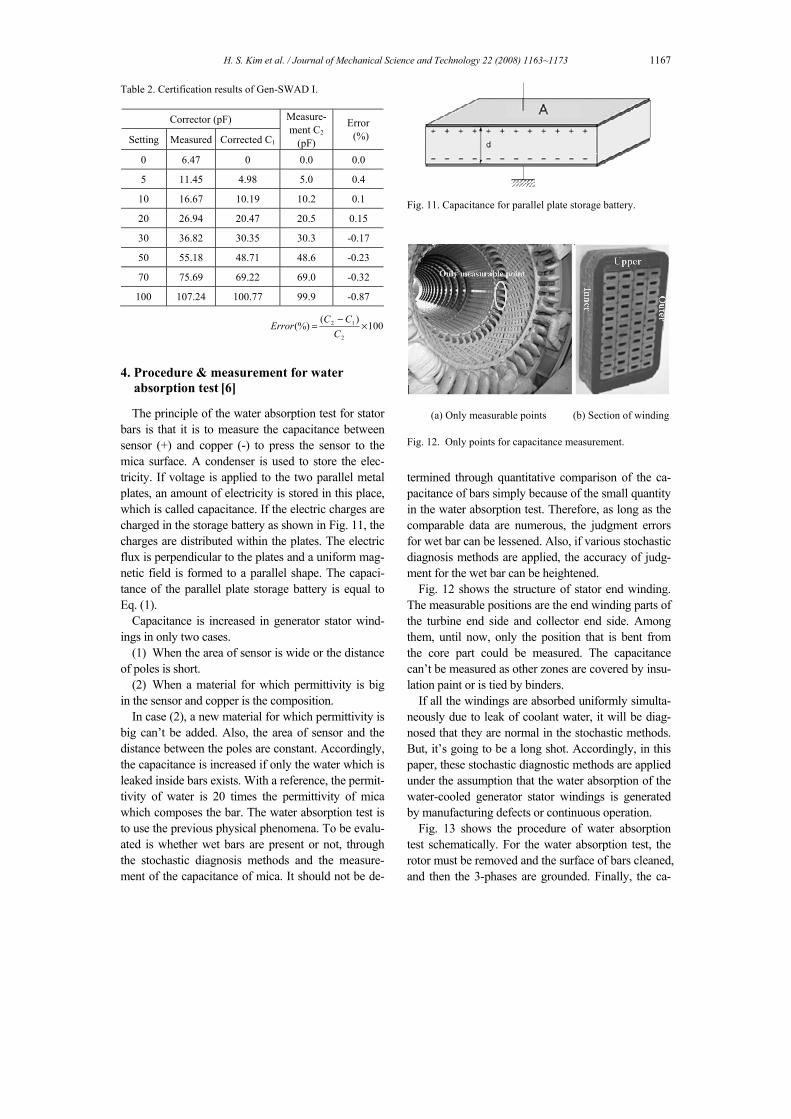
The principle of the water absorption test for stator bars is that it is to measure the capacitance between sensor (+) and copper (-) to press the sensor to the mica surface. A condenser is used to store the elec-tricity. If voltage is applied to the two parallel metal plates, an amount of electricity is stored in this place, which is called capacitance. If the electric charges are charged in the storage battery as shown in Fig. 11, the charges are distributed within the plates. The electric flux is perpendicular to the plates and a uniform mag-netic field is formed to a parallel shape. The capaci-tance of the parallel plate storage battery is equal to Eq. (1).
Capacitance is increased in generator stator wind-ings in only two cases.
(1) When the area of sensor is wide or the distance of poles is short.
(2) When a material for which permittivity is big in the sensor and copper is the composition.
In case (2), a new material for which permittivity is big can’t be added. Also, the area of sensor and the distance between the poles are constant. Accordingly, the capacitance is increased if only the water which is leaked inside bars exists. With a reference, the permit-tivity of water is 20 times the permittivity of mica which composes the bar. The water absorption test is to use the previous physical phenomena. To be evalu-ated is whether wet bars are present or not, through the stochastic diagnosis methods and the measure-ment of the capacitance of mica. It should not be de-
Fig. 11. Capacitance for parallel plate storage battery.
(a) Only measurable points (b) Section of winding Fig. 12. Only points for capacitance measurement.
termined through quantitative comparison of the ca-pacitance of bars simply because of the small quantity in the water absorption test. Therefore, as long as the comparable data are numerous, the judgment errors for wet bar can be lessened. Also, if various stochastic diagnosis methods are applied, the accuracy of judg-ment for the wet bar can be heightened.
Fig. 12 shows the structure of stator end winding. The measurable positions are the end winding parts of the turbine end side and collector end side. Among them, until now, only the position that is bent from the core part could be measured. The capacitance can’t be measured as other zones are covered by insu-lation paint or is tied by binders.
If all the windings are absorbed uniformly simulta-neously due to leak of coolant water, it will be diag-nosed that they are normal in the stochastic methods. But, it’s going to be a long shot. Accordingly, in this paper, these stochastic diagnostic methods are applied under the assumption that the water absorption of the water-cooled generator stator windings is generated by manufacturing defects or continuous operation.
Fig. 13 shows the procedure of water absorption test schematically. For the water absorption test, the rotor must be removed and the surface of bars cleaned, and then the 3-phases are grounded. Finally, the ca-
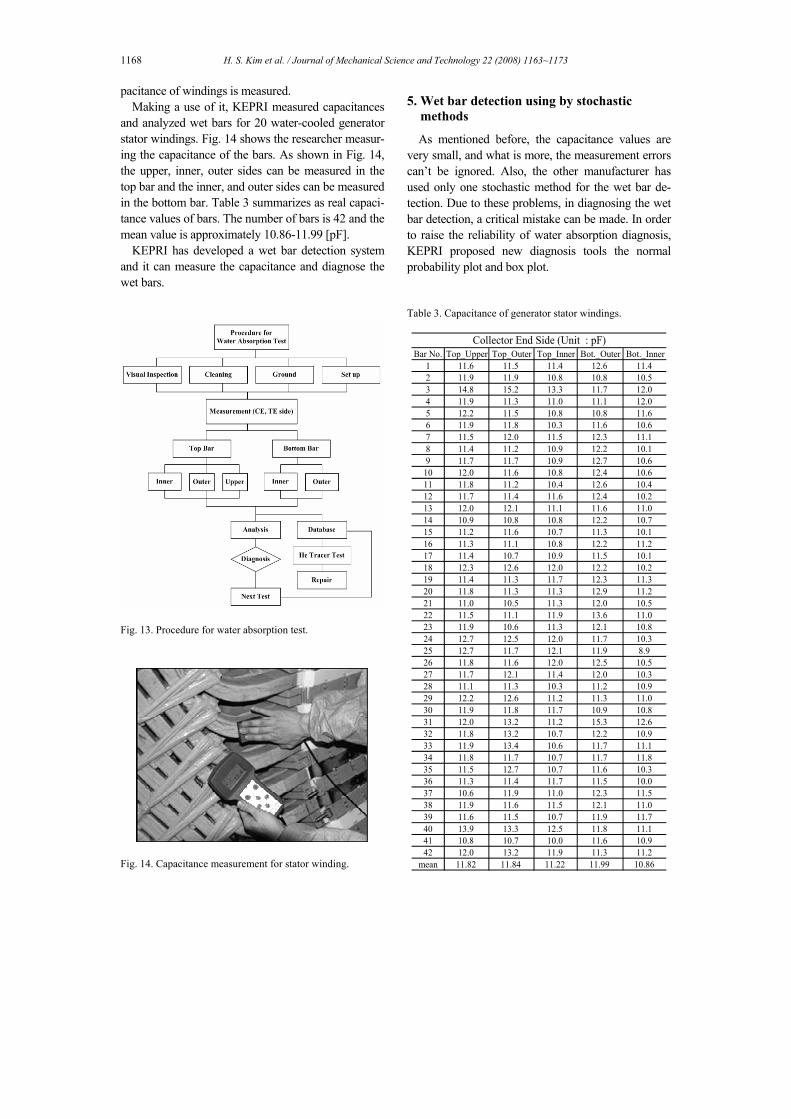
1168 H. S. Kim et al. / Journal of Mechanical Science and Technology 22 (2008) 1163~1173
pacitance of windings is measured. Making a use of it, KEPRI measured capacitances
and analyzed wet bars for 20 water-cooled generator stator windings. Fig. 14 shows the researcher measur-ing the capacitance of the bars. As shown in Fig. 14, the upper, inner, outer sides can be measured in the top bar and the inner, and outer sides can be measured in the bottom bar. Table 3 summarizes as real capaci-tance values of bars. The number of bars is 42 and the mean value is approximately 10.86-11.99 [pF].
KEPRI has developed a wet bar detection system and it can measure the capacitance and diagnose the wet bars.
Fig. 13. Procedure for water absorption test.
Fig. 14. Capacitance measurement for stator winding.
5. Wet bar detection using by stochastic
methods
As mentioned before, the capacitance values are very small, and what is more, the measurement errors can’t be ignored. Also, the other manufacturer has used only one stochastic method for the wet bar de-tection. Due to these problems, in diagnosing the wet bar detection, a critical mistake can be made. In order to raise the reliability of water absorption diagnosis, KEPRI proposed new diagnosis tools the normal probability plot and box plot.
Table 3. Capacitance of generator stator windings.
Bar No. Top_Upper Top_Outer Top_Inner Bot._Outer Bot._Inner1 11.6 11.5 11.4 12.6 11.42 11.9 11.9 10.8 10.8 10.53 14.8 15.2 13.3 11.7 12.04 11.9 11.3 11.0 11.1 12.05 12.2 11.5 10.8 10.8 11.66 11.9 11.8 10.3 11.6 10.67 11.5 12.0 11.5 12.3 11.18 11.4 11.2 10.9 12.2 10.19 11.7 11.7 10.9 12.7 10.6
10 12.0 11.6 10.8 12.4 10.611 11.8 11.2 10.4 12.6 10.412 11.7 11.4 11.6 12.4 10.213 12.0 12.1 11.1 11.6 11.014 10.9 10.8 10.8 12.2 10.715 11.2 11.6 10.7 11.3 10.116 11.3 11.1 10.8 12.2 11.217 11.4 10.7 10.9 11.5 10.118 12.3 12.6 12.0 12.2 10.219 11.4 11.3 11.7 12.3 11.320 11.8 11.3 11.3 12.9 11.221 11.0 10.5 11.3 12.0 10.522 11.5 11.1 11.9 13.6 11.023 11.9 10.6 11.3 12.1 10.824 12.7 12.5 12.0 11.7 10.325 12.7 11.7 12.1 11.9 8.926 11.8 11.6 12.0 12.5 10.527 11.7 12.1 11.4 12.0 10.328 11.1 11.3 10.3 11.2 10.929 12.2 12.6 11.2 11.3 11.030 11.9 11.8 11.7 10.9 10.831 12.0 13.2 11.2 15.3 12.632 11.8 13.2 10.7 12.2 10.933 11.9 13.4 10.6 11.7 11.134 11.8 11.7 10.7 11.7 11.835 11.5 12.7 10.7 11.6 10.336 11.3 11.4 11.7 11.5 10.037 10.6 11.9 11.0 12.3 11.538 11.9 11.6 11.5 12.1 11.039 11.6 11.5 10.7 11.9 11.740 13.9 13.3 12.5 11.8 11.141 10.8 10.7 10.0 11.6 10.942 12.0 13.2 11.9 11.3 11.2
mean 11.82 11.84 11.22 11.99 10.86
Collector End Side (Unit : pF)
H. S. Kim et al. / Journal of Mechanical Science and Technology 22 (2008) 1163~1173 1169
5.1 Normal distribution method [7, 8]
The normal distribution is widely used due to its simplicity and wide applicability. This distribution is the basis for many statistical methods.
The mean value is defined as the sum of n samples divided by the number of samples and the mean value is equal to Eq. (2), the variance is equal to Eq. (3) and the normal distribution function is defined as Eq. (4).
∑==
n
1jjmean x
n1X (2)
∑ −=σ=
n
1j
2meanj
2 )xx(n1 (3)
⎟⎟
⎠
⎞
⎜⎜
⎝
⎛⎥⎦
⎤⎢⎣
⎡σµ−−
πσ=
2x21exp
21)x(f ⟨∞−∞⟨x (4)
In Eq. (4), the cumulative distribution function of the normal distribution is given by Eq. (5) and the probability in the normal distribution is equal to Eq. (6).
dxexp2
1)x(Fx 2)x(
21
∫πσ
=∞−
σµ−−
(5)
( ) dxx21exp
21bxaP
b
a
2
∫⎥⎥⎦
⎤
⎢⎢⎣
⎡⎟⎠
⎞⎜⎝
⎛σµ−−
πσ=≤⟨ (6)
%74.99)3X3(P%44.95)2X2(P
%26.68)X(P
=σ+µ≤⟨σ−µ=σ+µ≤⟨σ−µ
=σ+µ≤⟨σ−µ
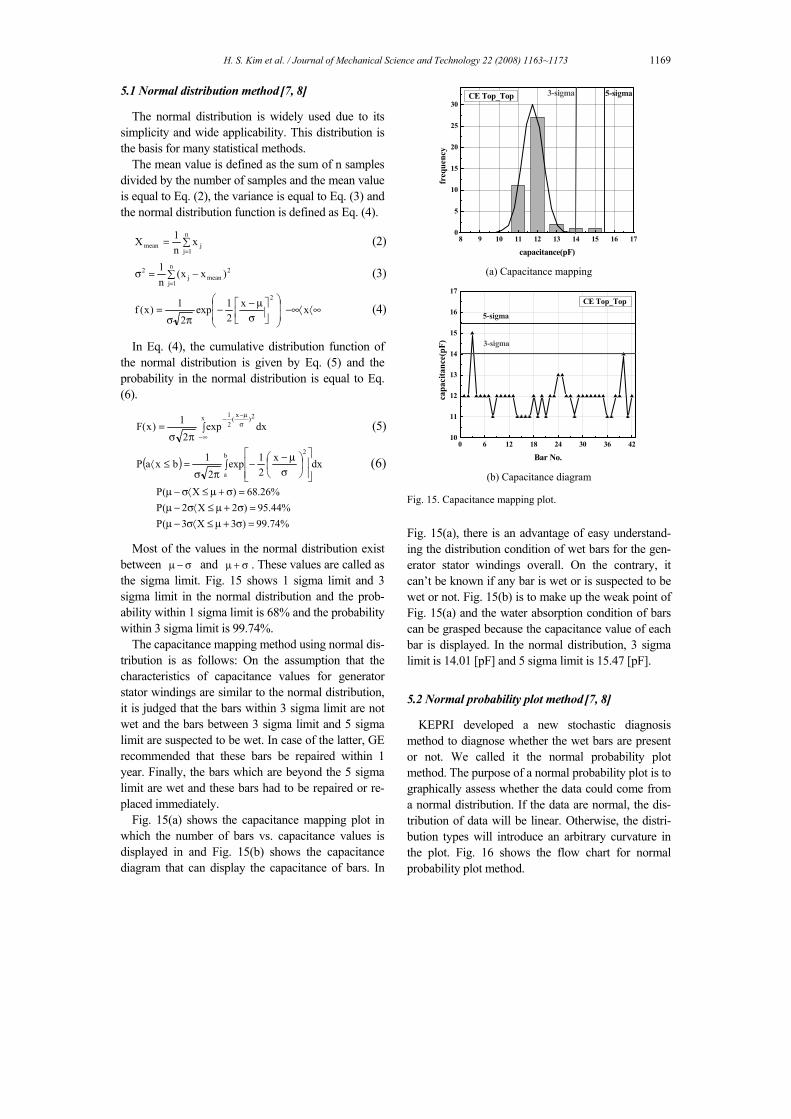
Most of the values in the normal distribution exist between σ−µ and σ+µ . These values are called as the sigma limit. Fig. 15 shows 1 sigma limit and 3 sigma limit in the normal distribution and the prob-ability within 1 sigma limit is 68% and the probability within 3 sigma limit is 99.74%.
The capacitance mapping method using normal dis-tribution is as follows: On the assumption that the characteristics of capacitance values for generator stator windings are similar to the normal distribution, it is judged that the bars within 3 sigma limit are not wet and the bars between 3 sigma limit and 5 sigma limit are suspected to be wet. In case of the latter, GE recommended that these bars be repaired within 1 year. Finally, the bars which are beyond the 5 sigma limit are wet and these bars had to be repaired or re-placed immediately.
Fig. 15(a) shows the capacitance mapping plot in which the number of bars vs. capacitance values is displayed in and Fig. 15(b) shows the capacitance diagram that can display the capacitance of bars. In
8 9 10 11 12 13 14 15 16 170
5
10
15
20
25
30CE Top_Top 5-sigma3-sigma
freq
uenc
y
capacitance(pF) (a) Capacitance mapping
0 6 12 18 24 30 36 4210
11
12
13
14
15
16
17
3-sigma
5-sigma
capa
cita
nce(
pF)
Bar No.
CE Top_Top
(b) Capacitance diagram Fig. 15. Capacitance mapping plot.
Fig. 15(a), there is an advantage of easy understand-ing the distribution condition of wet bars for the gen-erator stator windings overall. On the contrary, it can’t be known if any bar is wet or is suspected to be wet or not. Fig. 15(b) is to make up the weak point of Fig. 15(a) and the water absorption condition of bars can be grasped because the capacitance value of each bar is displayed. In the normal distribution, 3 sigma limit is 14.01 [pF] and 5 sigma limit is 15.47 [pF].
5.2 Normal probability plot method [7, 8]
KEPRI developed a new stochastic diagnosis method to diagnose whether the wet bars are present or not. We called it the normal probability plot method. The purpose of a normal probability plot is to graphically assess whether the data could come from a normal distribution. If the data are normal, the dis-tribution of data will be linear. Otherwise, the distri-bution types will introduce an arbitrary curvature in the plot. Fig. 16 shows the flow chart for normal probability plot method.
1170 H. S. Kim et al. / Journal of Mechanical Science and Technology 22 (2008) 1163~1173
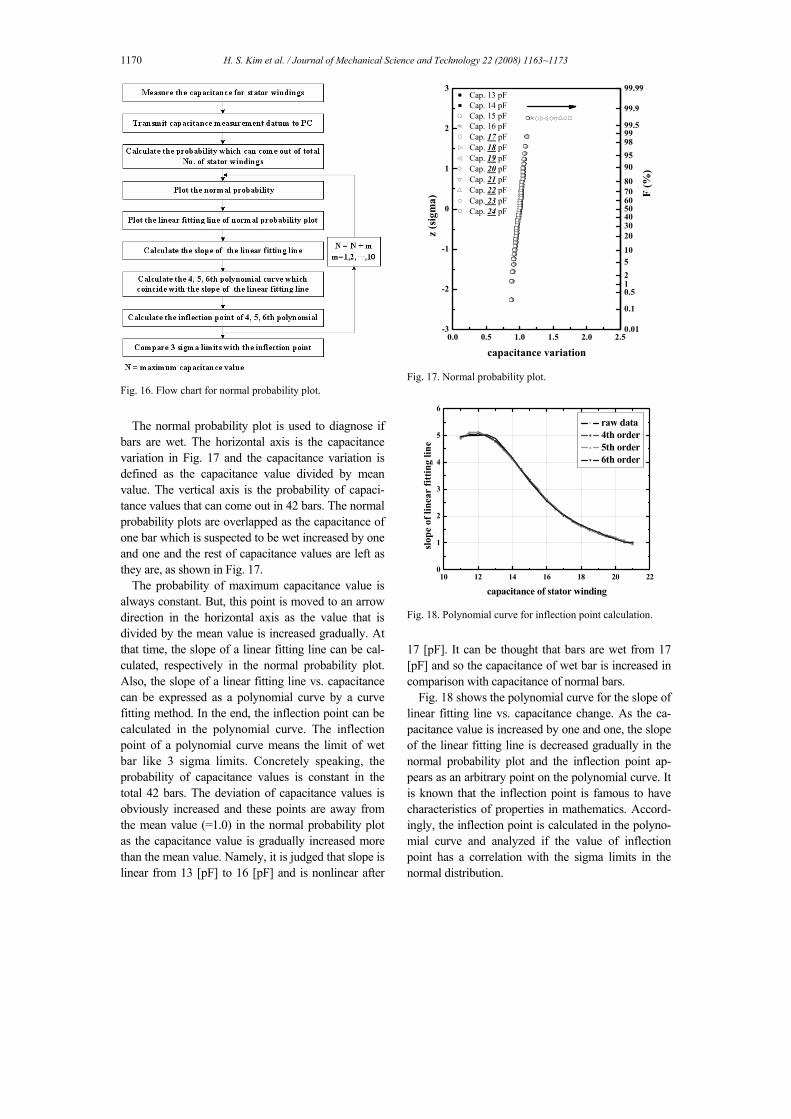
Fig. 16. Flow chart for normal probability plot.
The normal probability plot is used to diagnose if
bars are wet. The horizontal axis is the capacitance variation in Fig. 17 and the capacitance variation is defined as the capacitance value divided by mean value. The vertical axis is the probability of capaci-tance values that can come out in 42 bars. The normal probability plots are overlapped as the capacitance of one bar which is suspected to be wet increased by one and one and the rest of capacitance values are left as they are, as shown in Fig. 17.
The probability of maximum capacitance value is always constant. But, this point is moved to an arrow direction in the horizontal axis as the value that is divided by the mean value is increased gradually. At that time, the slope of a linear fitting line can be cal-culated, respectively in the normal probability plot. Also, the slope of a linear fitting line vs. capacitance can be expressed as a polynomial curve by a curve fitting method. In the end, the inflection point can be calculated in the polynomial curve. The inflection point of a polynomial curve means the limit of wet bar like 3 sigma limits. Concretely speaking, the probability of capacitance values is constant in the total 42 bars. The deviation of capacitance values is obviously increased and these points are away from the mean value (=1.0) in the normal probability plot as the capacitance value is gradually increased more than the mean value. Namely, it is judged that slope is linear from 13 [pF] to 16 [pF] and is nonlinear after
0.0 0.5 1.0 1.5 2.0 2.5-3
-2
-1
0
1
2
3
0.01
0.1
0.512510
20304050607080
9095989999.5
99.9
99.99
F (%
)
Cap. 13 pFCap. 14 pFCap. 15 pFCap. 16 pFCap. 17 pFCap. 18 pFCap. 19 pFCap. 20 pFCap. 21 pFCap. 22 pFCap. 23 pFCap. 24 pF
z (s
igm
a)
capacitance variation Fig. 17. Normal probability plot.
10 12 14 16 18 20 220
1
2
3
4
5
6
slop
e of
line
ar fi
ttin
g lin
e
capacitance of stator winding
raw data 4th order 5th order 6th order
Fig. 18. Polynomial curve for inflection point calculation.
17 [pF]. It can be thought that bars are wet from 17 [pF] and so the capacitance of wet bar is increased in comparison with capacitance of normal bars.
Fig. 18 shows the polynomial curve for the slope of linear fitting line vs. capacitance change. As the ca-pacitance value is increased by one and one, the slope of the linear fitting line is decreased gradually in the normal probability plot and the inflection point ap-pears as an arbitrary point on the polynomial curve. It is known that the inflection point is famous to have characteristics of properties in mathematics. Accord-ingly, the inflection point is calculated in the polyno-mial curve and analyzed if the value of inflection point has a correlation with the sigma limits in the normal distribution.
H. S. Kim et al. / Journal of Mechanical Science and Technology 22 (2008) 1163~1173 1171
The 4th, 5th, 6th order polynomial curve and the in-flection points are calculated by MATLAB. The in-flection point values for 4th, 5th, 6th order polynomial curves are 14.64 [pF], 14.67 [pF], and 14.68 [pF] respectively. Among these inflection point values, the one of 4th order is different from other values. The inflection point value is not much different in com-parison with the 3 sigma limits (=14.01 [pF]) in nor-mal distribution. Accordingly, it is confirmed that the newly developed method of using the normal prob-ability plot can be applied for a wet bar detection.
5.3 Box plot method [7]
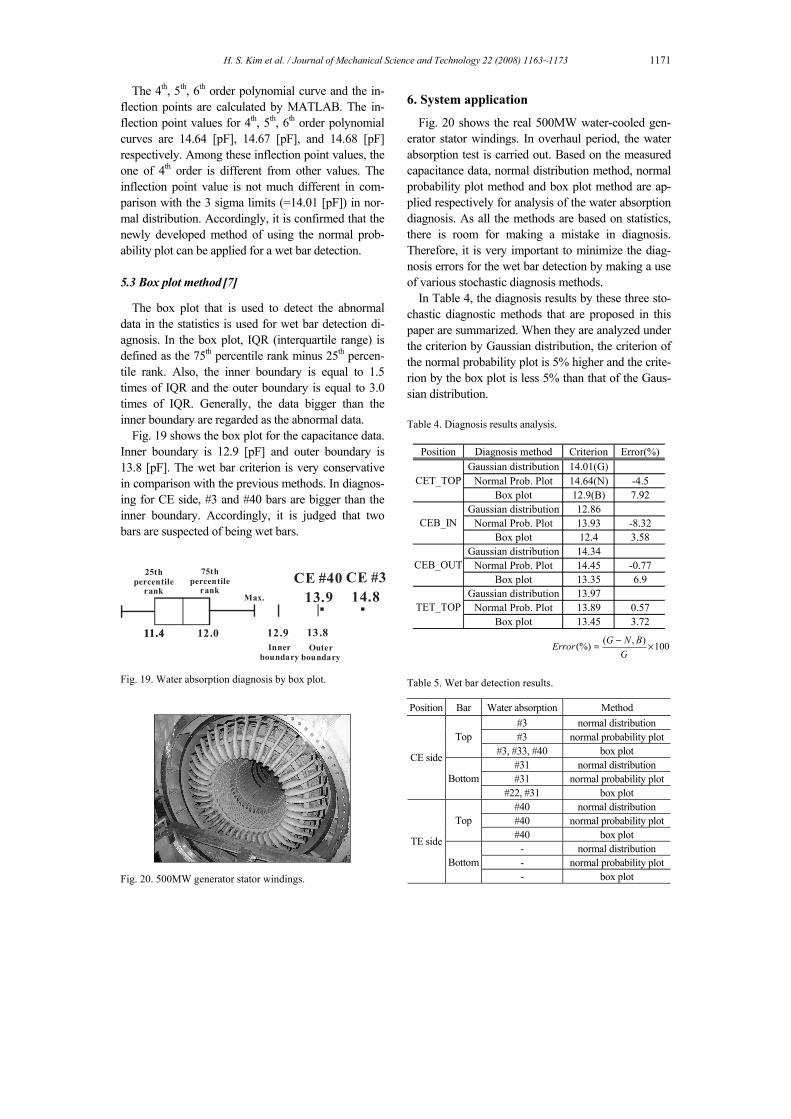
The box plot that is used to detect the abnormal data in the statistics is used for wet bar detection di-agnosis. In the box plot, IQR (interquartile range) is defined as the 75th percentile rank minus 25th percen-tile rank. Also, the inner boundary is equal to 1.5 times of IQR and the outer boundary is equal to 3.0 times of IQR. Generally, the data bigger than the inner boundary are regarded as the abnormal data.
Fig. 19 shows the box plot for the capacitance data. Inner boundary is 12.9 [pF] and outer boundary is 13.8 [pF]. The wet bar criterion is very conservative in comparison with the previous methods. In diagnos-ing for CE side, #3 and #40 bars are bigger than the inner boundary. Accordingly, it is judged that two bars are suspected of being wet bars.
13.9
25thpercentile
rankCE #40
14.8CE #375th
percentilerank
11.4 12.011.4 13.812.9Inner
boundaryOuter
boundary
Max.
Fig. 19. Water absorption diagnosis by box plot.
Fig. 20. 500MW generator stator windings.
6. System application
Fig. 20 shows the real 500MW water-cooled gen-erator stator windings. In overhaul period, the water absorption test is carried out. Based on the measured capacitance data, normal distribution method, normal probability plot method and box plot method are ap-plied respectively for analysis of the water absorption diagnosis. As all the methods are based on statistics, there is room for making a mistake in diagnosis. Therefore, it is very important to minimize the diag-nosis errors for the wet bar detection by making a use of various stochastic diagnosis methods.
In Table 4, the diagnosis results by these three sto-chastic diagnostic methods that are proposed in this paper are summarized. When they are analyzed under the criterion by Gaussian distribution, the criterion of the normal probability plot is 5% higher and the crite-rion by the box plot is less 5% than that of the Gaus-sian distribution.
Table 4. Diagnosis results analysis.
Position Diagnosis method Criterion Error(%)Gaussian distribution 14.01(G)
Normal Prob. Plot 14.64(N) -4.5Box plot 12.9(B) 7.92
Gaussian distribution 12.86Normal Prob. Plot 13.93 -8.32
Box plot 12.4 3.58Gaussian distribution 14.34
Normal Prob. Plot 14.45 -0.77Box plot 13.35 6.9
Gaussian distribution 13.97Normal Prob. Plot 13.89 0.57
Box plot 13.45 3.72
CET_TOP
CEB_IN
CEB_OUT
TET_TOP
100),((%) ×−=G
BNGError
Table 5. Wet bar detection results. Position Bar Water absorption Method
#3 normal distribution #3 normal probability plotTop
#3, #33, #40 box plot #31 normal distribution #31 normal probability plot
CE side
Bottom#22, #31 box plot
#40 normal distribution #40 normal probability plotTop#40 box plot
- normal distribution - normal probability plot
TE side
Bottom- box plot
1172 H. S. Kim et al. / Journal of Mechanical Science and Technology 22 (2008) 1163~1173
(a) CE_TOP_TOP
(b) TE_TOP_TOP
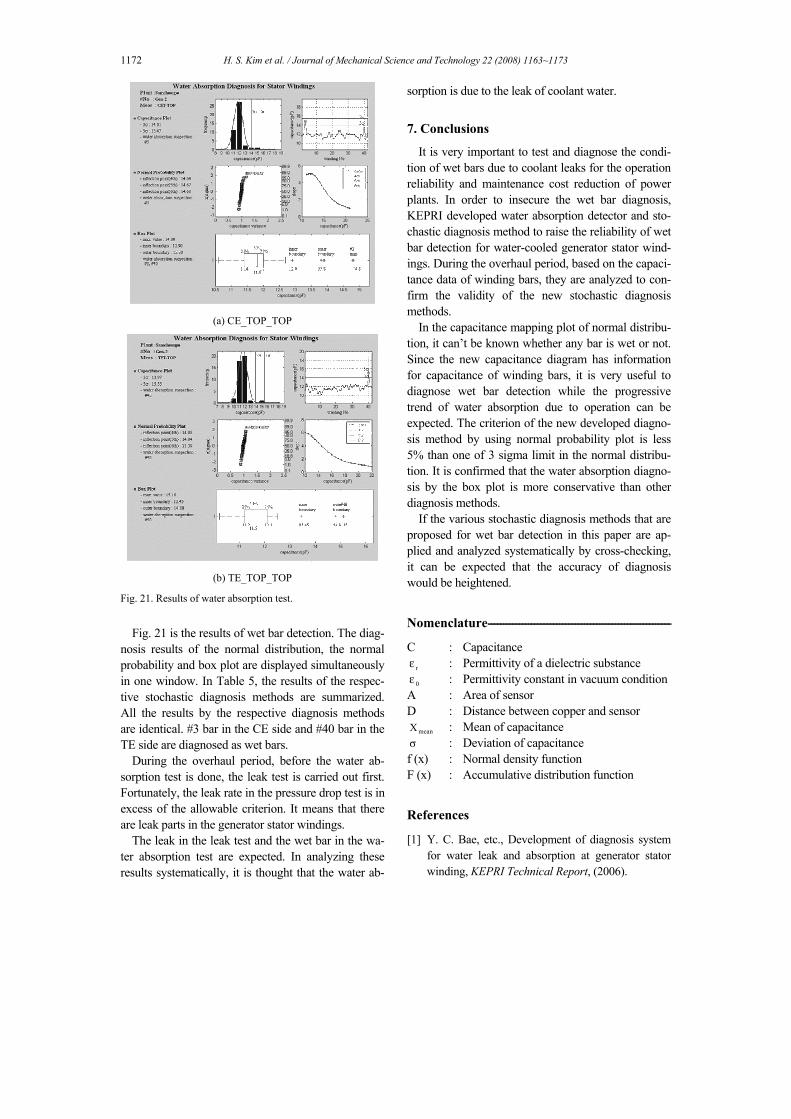
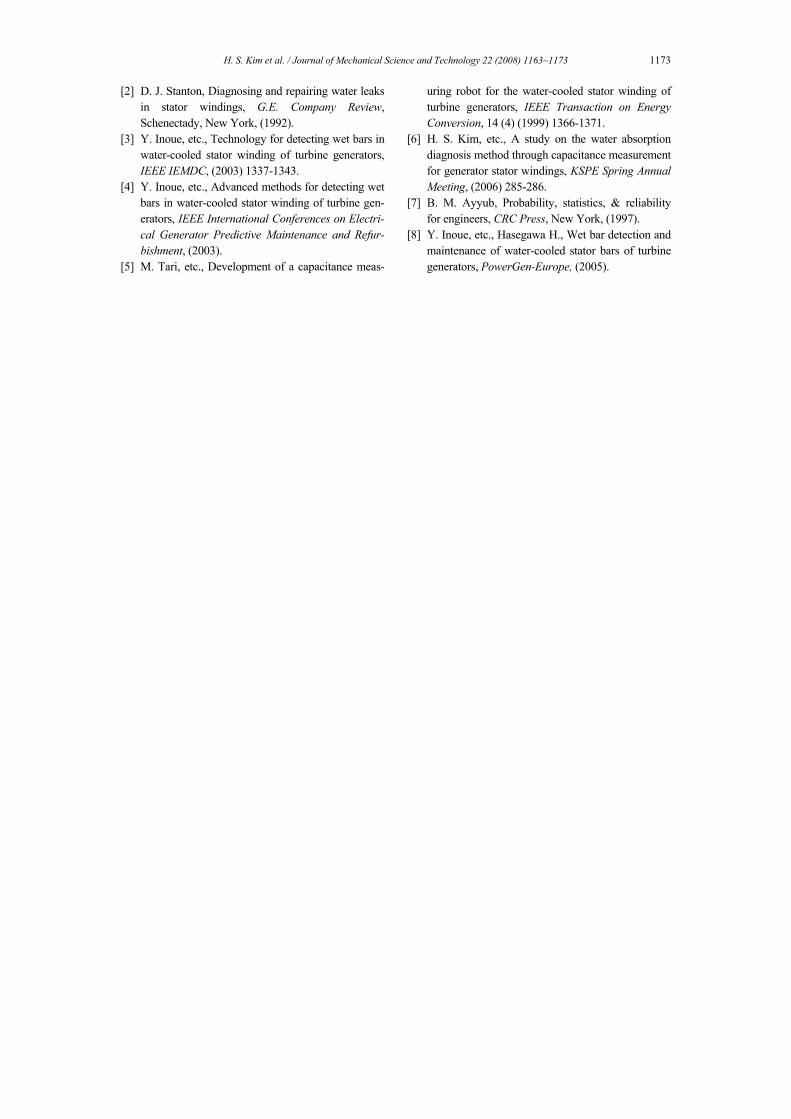
Fig. 21. Results of water absorption test.
Fig. 21 is the results of wet bar detection. The diag-
nosis results of the normal distribution, the normal probability and box plot are displayed simultaneously in one window. In Table 5, the results of the respec-tive stochastic diagnosis methods are summarized. All the results by the respective diagnosis methods are identical. #3 bar in the CE side and #40 bar in the TE side are diagnosed as wet bars.
During the overhaul period, before the water ab-sorption test is done, the leak test is carried out first. Fortunately, the leak rate in the pressure drop test is in excess of the allowable criterion. It means that there are leak parts in the generator stator windings.
The leak in the leak test and the wet bar in the wa-ter absorption test are expected. In analyzing these results systematically, it is thought that the water ab-
sorption is due to the leak of coolant water.
7. Conclusions
It is very important to test and diagnose the condi-tion of wet bars due to coolant leaks for the operation reliability and maintenance cost reduction of power plants. In order to insecure the wet bar diagnosis, KEPRI developed water absorption detector and sto-chastic diagnosis method to raise the reliability of wet bar detection for water-cooled generator stator wind-ings. During the overhaul period, based on the capaci-tance data of winding bars, they are analyzed to con-firm the validity of the new stochastic diagnosis methods.
In the capacitance mapping plot of normal distribu-tion, it can’t be known whether any bar is wet or not. Since the new capacitance diagram has information for capacitance of winding bars, it is very useful to diagnose wet bar detection while the progressive trend of water absorption due to operation can be expected. The criterion of the new developed diagno-sis method by using normal probability plot is less 5% than one of 3 sigma limit in the normal distribu-tion. It is confirmed that the water absorption diagno-sis by the box plot is more conservative than other diagnosis methods.
If the various stochastic diagnosis methods that are proposed for wet bar detection in this paper are ap-plied and analyzed systematically by cross-checking, it can be expected that the accuracy of diagnosis would be heightened.
Nomenclature-----------------------------------------------------------
C : Capacitance rε : Permittivity of a dielectric substance 0ε : Permittivity constant in vacuum condition
A : Area of sensor D : Distance between copper and sensor
meanX : Mean of capacitance σ : Deviation of capacitance f (x) : Normal density function F (x) : Accumulative distribution function
References
[1] Y. C. Bae, etc., Development of diagnosis system for water leak and absorption at generator stator winding, KEPRI Technical Report, (2006).
H. S. Kim et al. / Journal of Mechanical Science and Technology 22 (2008) 1163~1173 1173
[2] D. J. Stanton, Diagnosing and repairing water leaks in stator windings, G.E. Company Review, Schenectady, New York, (1992).
[3] Y. Inoue, etc., Technology for detecting wet bars in water-cooled stator winding of turbine generators, IEEE IEMDC, (2003) 1337-1343.
[4] Y. Inoue, etc., Advanced methods for detecting wet bars in water-cooled stator winding of turbine gen-erators, IEEE International Conferences on Electri-cal Generator Predictive Maintenance and Refur-bishment, (2003).
[5] M. Tari, etc., Development of a capacitance meas-
uring robot for the water-cooled stator winding of turbine generators, IEEE Transaction on Energy Conversion, 14 (4) (1999) 1366-1371.
[6] H. S. Kim, etc., A study on the water absorption diagnosis method through capacitance measurement for generator stator windings, KSPE Spring Annual Meeting, (2006) 285-286.
[7] B. M. Ayyub, Probability, statistics, & reliability for engineers, CRC Press, New York, (1997).
[8] Y. Inoue, etc., Hasegawa H., Wet bar detection and maintenance of water-cooled stator bars of turbine generators, PowerGen-Europe, (2005).