Embed Size (px)
Citation preview
1
Basic Principles of
Atomic Absorption and
Atomic Emission
Spectroscopy
2
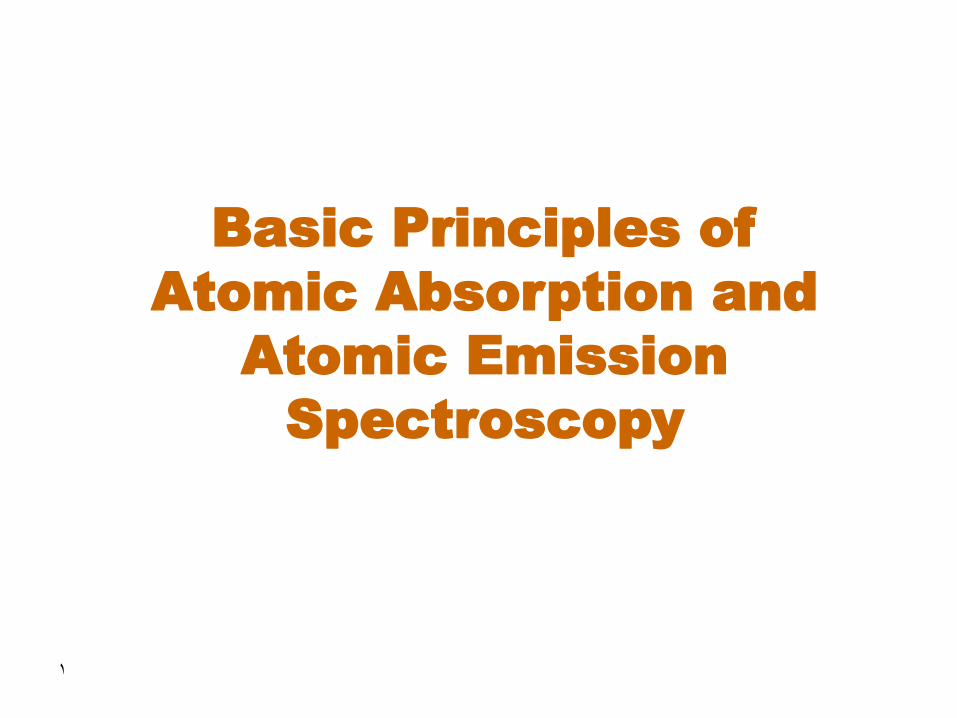
Source Wavelength Selector
Sample
Detector Signal Processor
Readout
P
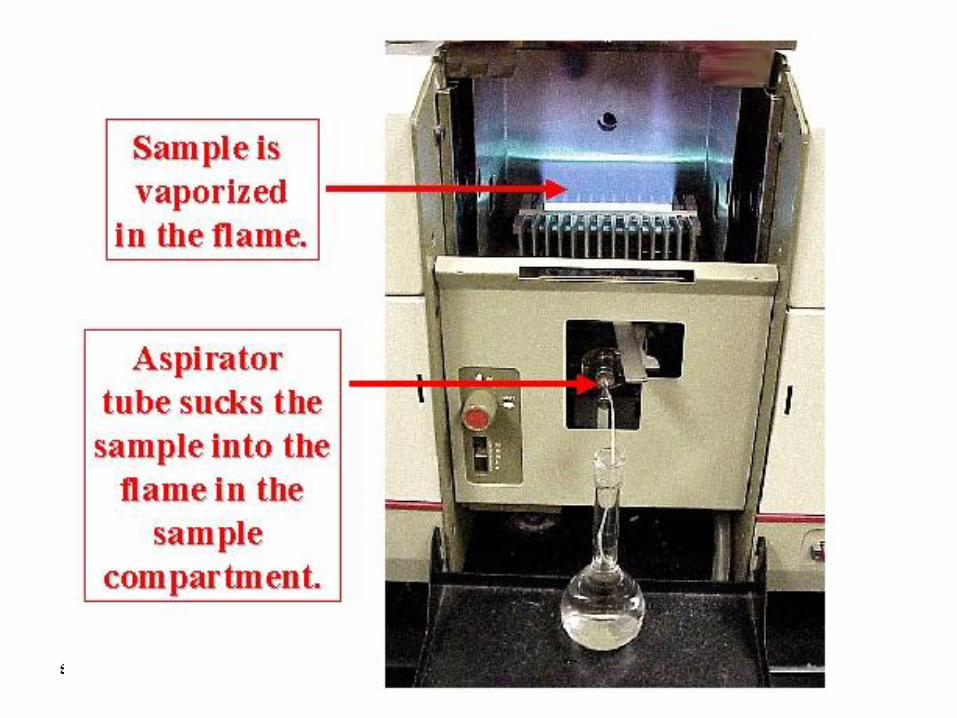
Flame Atomic Emission Spectrometer
3
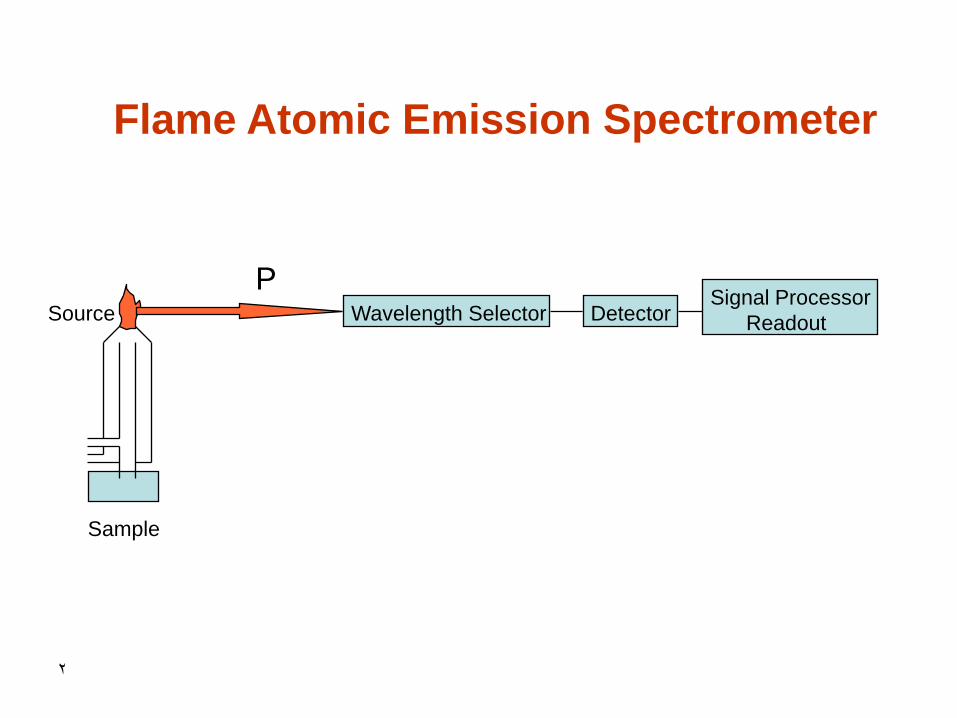
Flame Atomic Emission Spectrometer
4
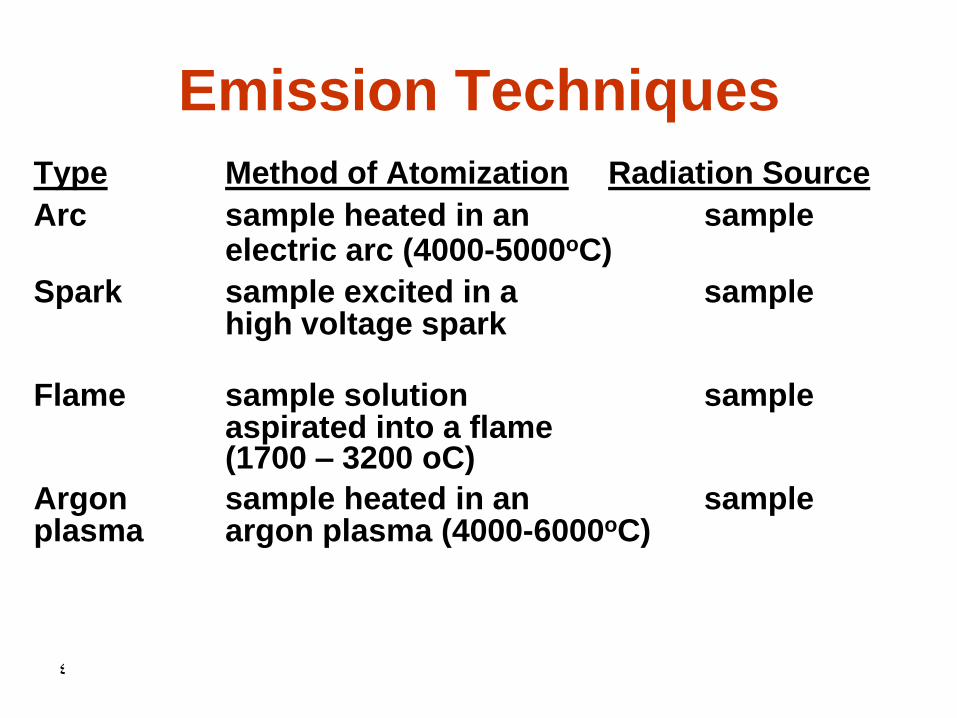
Emission Techniques
Type Method of Atomization Radiation Source
Arc sample heated in an sample electric arc (4000-5000oC)
Spark sample excited in a sample high voltage spark
Flame sample solution sample aspirated into a flame (1700 – 3200 oC)
Argon sample heated in an sample plasma argon plasma (4000-6000oC)
5
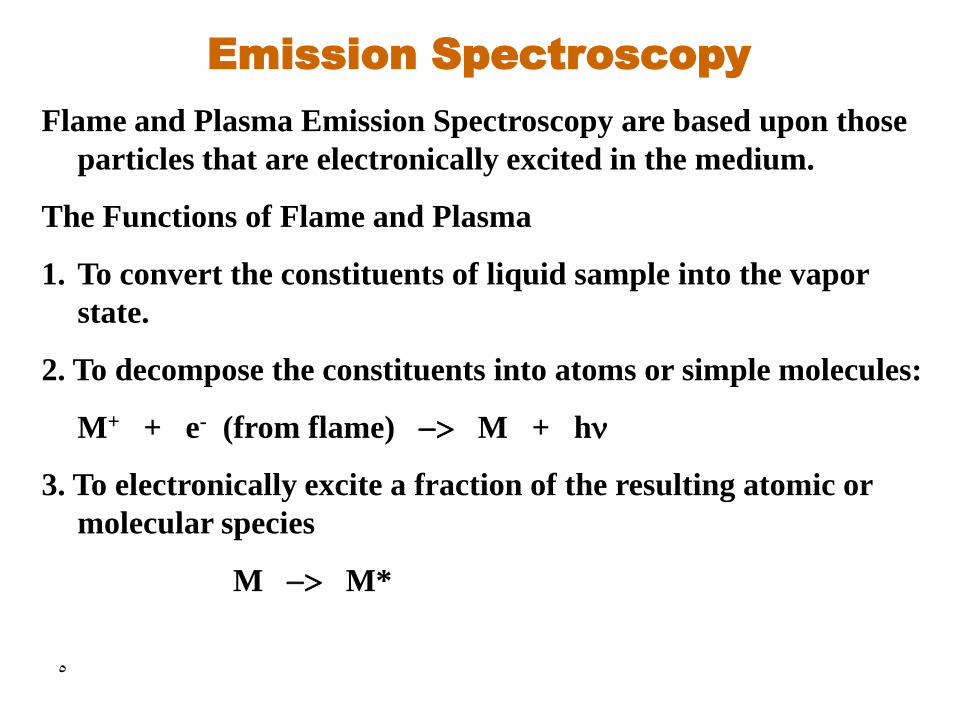
Flame and Plasma Emission Spectroscopy are based upon those
particles that are electronically excited in the medium.
The Functions of Flame and Plasma
1. To convert the constituents of liquid sample into the vapor
state.
2. To decompose the constituents into atoms or simple molecules:
M+ + e- (from flame) -> M + hn
3. To electronically excite a fraction of the resulting atomic or
molecular species
M -> M*
Emission Spectroscopy
6
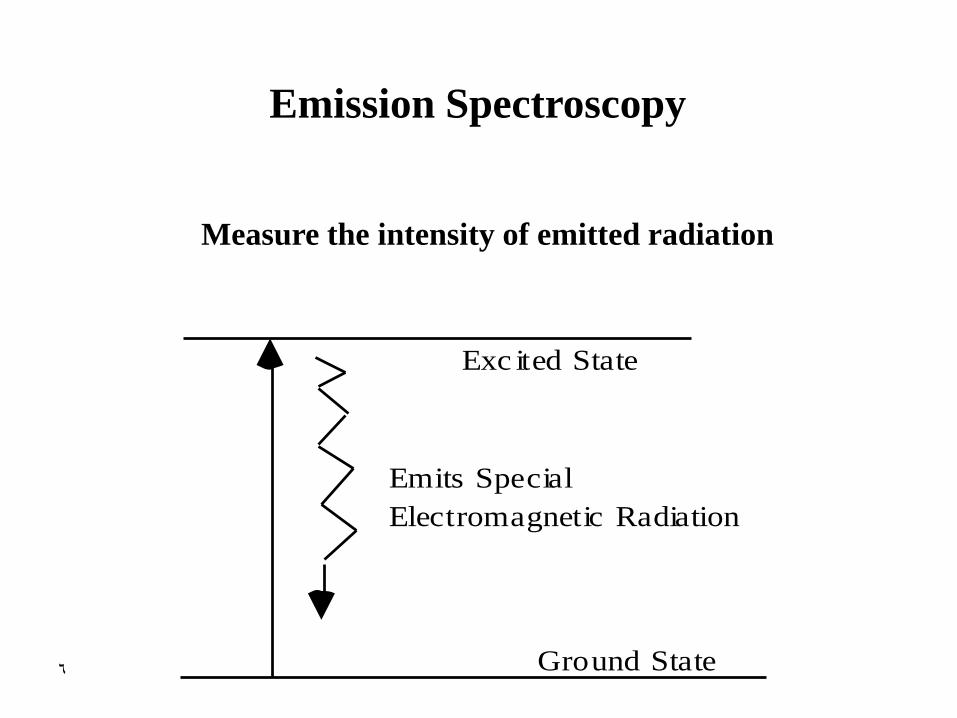
Measure the intensity of emitted radiation
Emission Spectroscopy
Ground State
Exc ited State
Emits Special
Electromagnetic Radiation
7
8
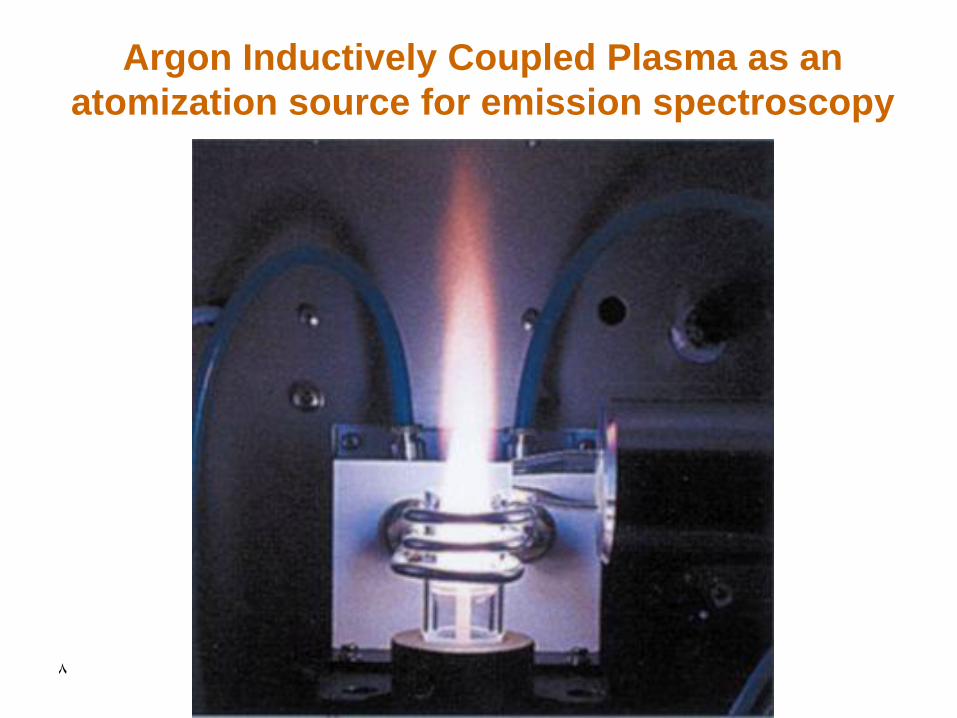
Argon Inductively Coupled Plasma as an
atomization source for emission spectroscopy
9

10
• Flame techniques are limited to alkali (Li, Na, K, Cs,
Rb) and some alkaline earth metals (Ca and Mg)
• More energetic sources are used for
– more elements specially transition elements
– simultaneous multielement analysis since spectra
od dozen of elements can be recorded
simultaneously
– Interelement interference is eliminated
– Liquids and solids
Why plasma source or other high
energetic sources?
11
Advantages and disadvantages of
emission spectrometry
Advantages
• rapid
• Multielement (limited for alkali and some alkaline earth metals
• ICP-AES has become the technique of choice for metals analysis.
Disadvantages
• initial cost of ICP instrumentation
• continuing cost of operation (Ar required)
12
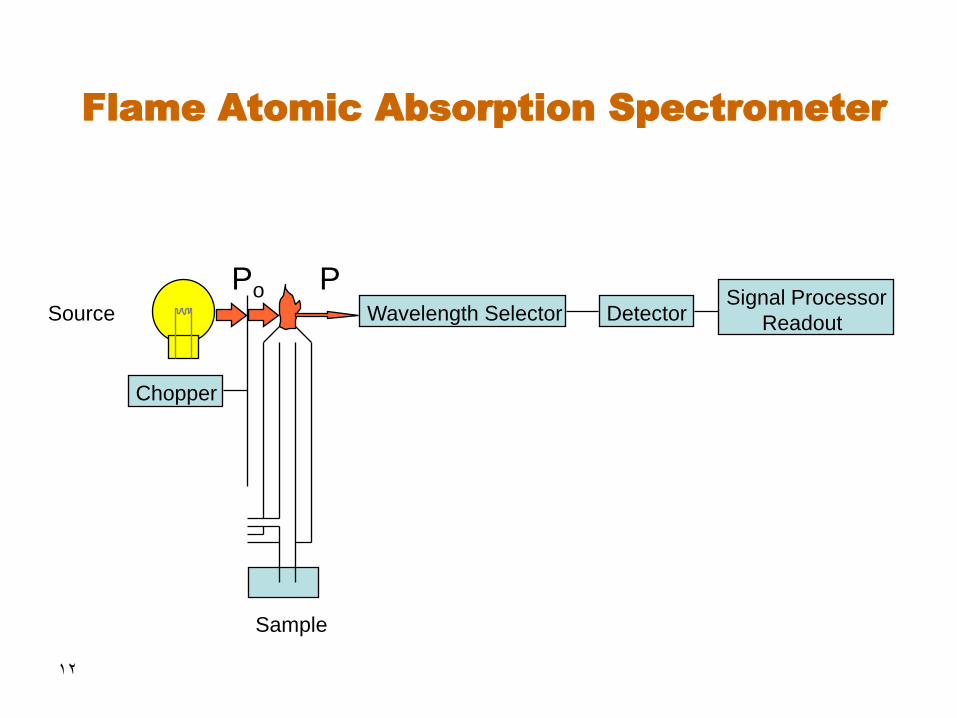
Flame Atomic Absorption Spectrometer
Source Wavelength Selector
Sample
Detector Signal Processor
Readout
P Po
Chopper
13
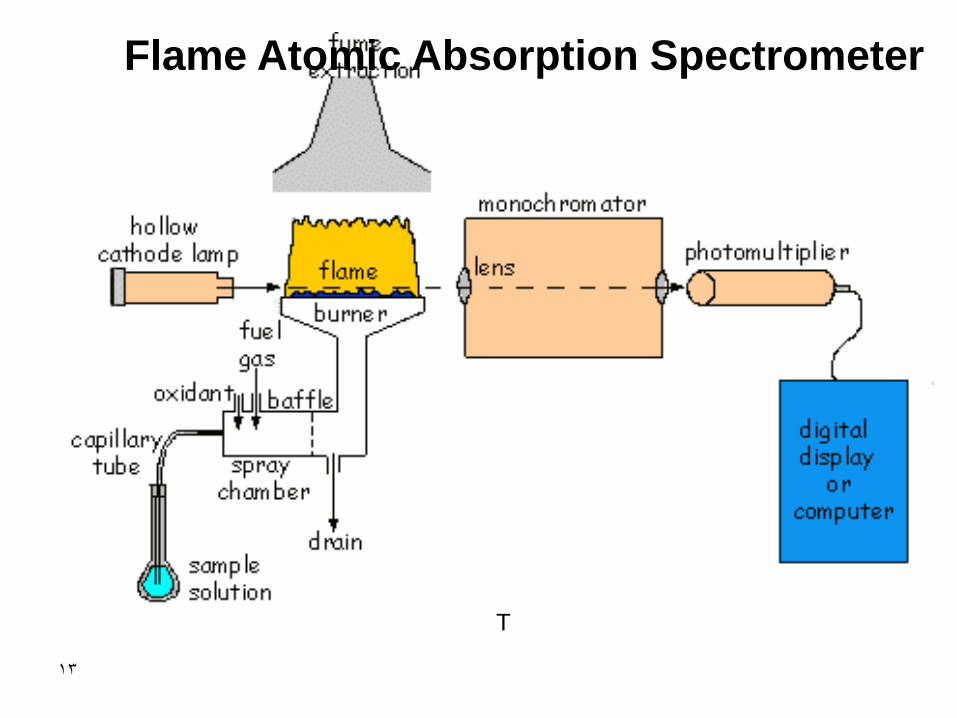
Flame Atomic Absorption Spectrometer
T
14
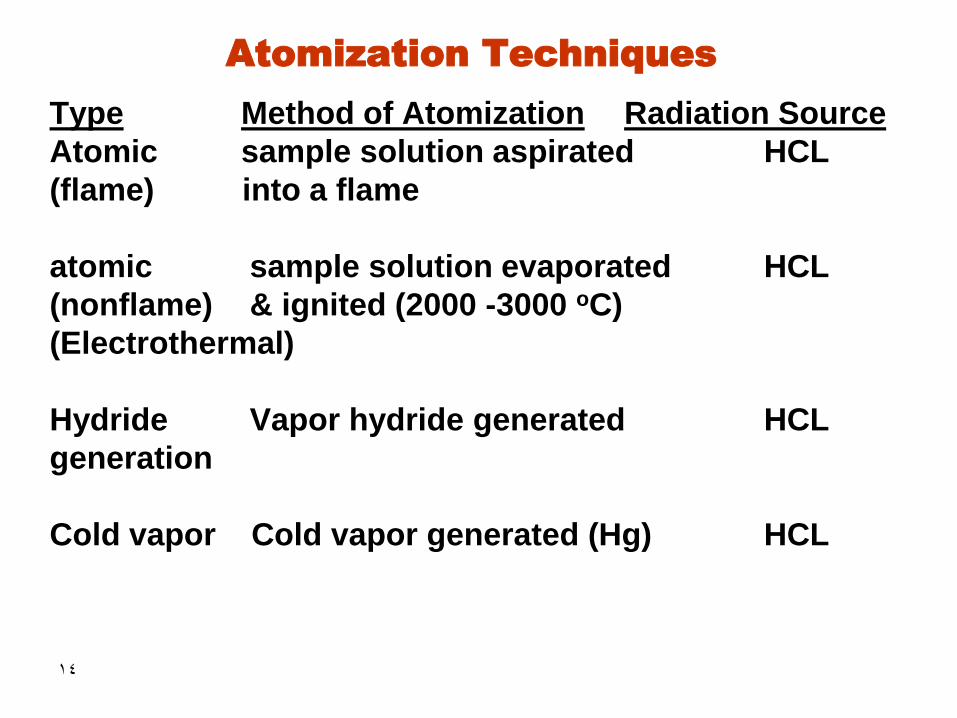
Atomization Techniques Type Method of Atomization Radiation Source
Atomic sample solution aspirated HCL
(flame) into a flame
atomic sample solution evaporated HCL
(nonflame) & ignited (2000 -3000 oC)
(Electrothermal)
Hydride Vapor hydride generated HCL
generation
Cold vapor Cold vapor generated (Hg) HCL
15
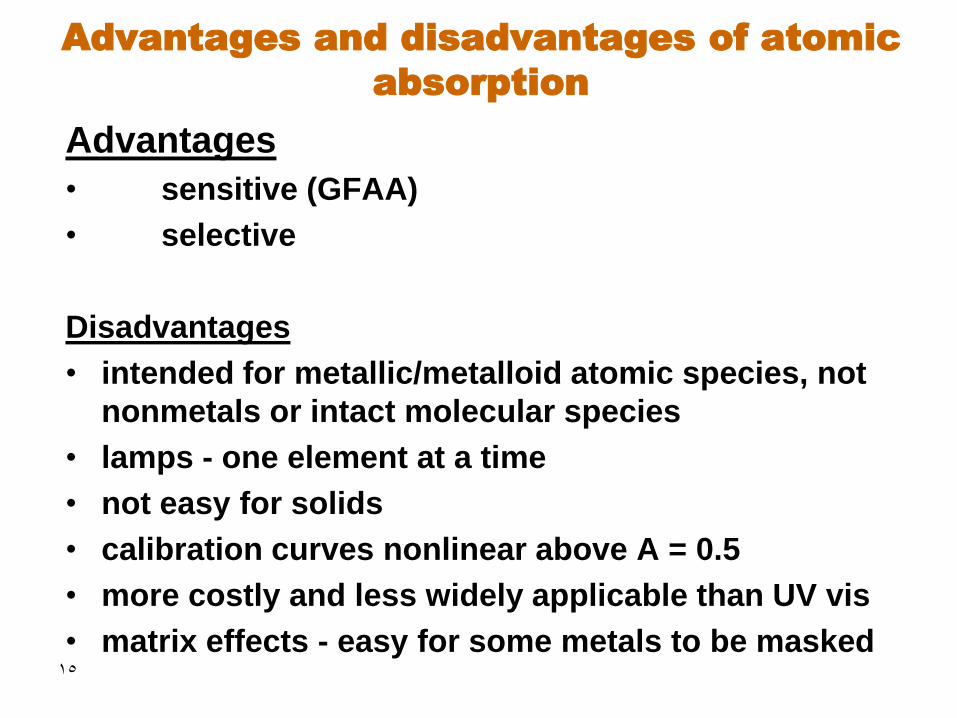
Advantages and disadvantages of atomic
absorption
Advantages
• sensitive (GFAA)
• selective
Disadvantages
• intended for metallic/metalloid atomic species, not
nonmetals or intact molecular species
• lamps - one element at a time
• not easy for solids
• calibration curves nonlinear above A = 0.5
• more costly and less widely applicable than UV vis
• matrix effects - easy for some metals to be masked
16
17
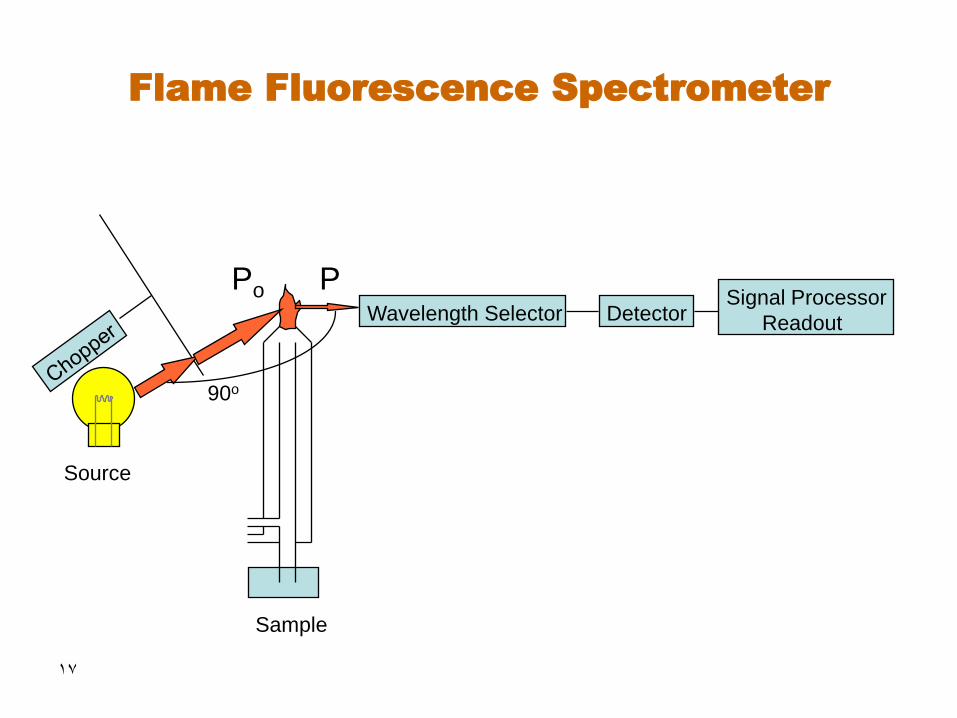
Flame Fluorescence Spectrometer
Source
Wavelength Selector
Sample
Detector Signal Processor
Readout
P Po
90o

18
Fluorescence Techniques
Type Method of Atomization Radiation Source
atomic sample soln. aspirated sample
(flame) into a flame
atomic sample soln. evaporated sample
(nonflame) & ignited
x-ray none required sample
fluoresence
19
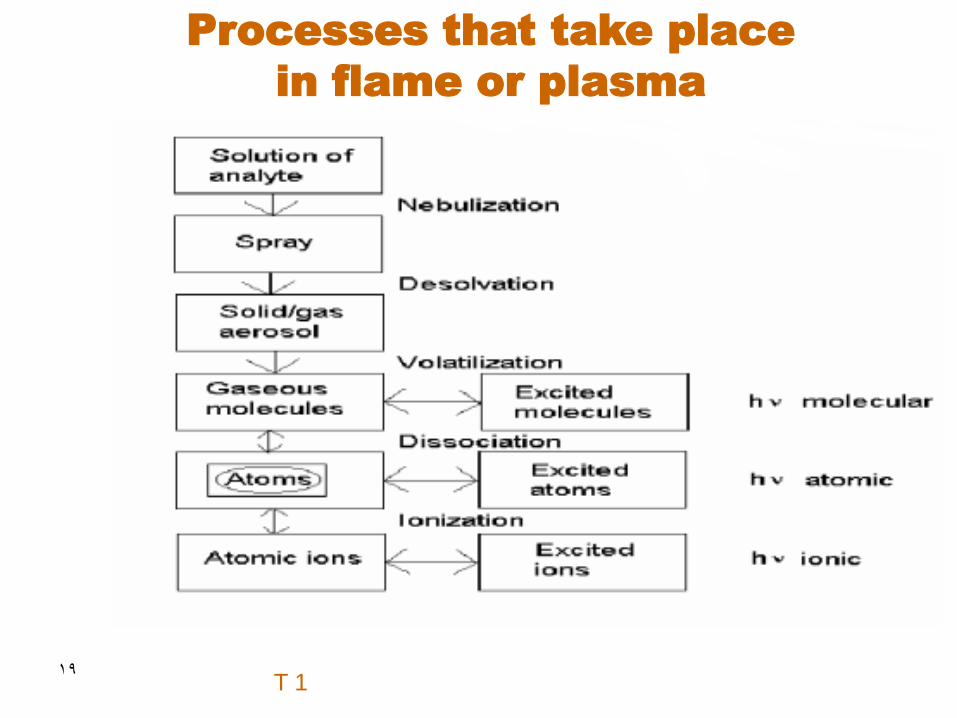
Processes that take place
in flame or plasma
T 1
20
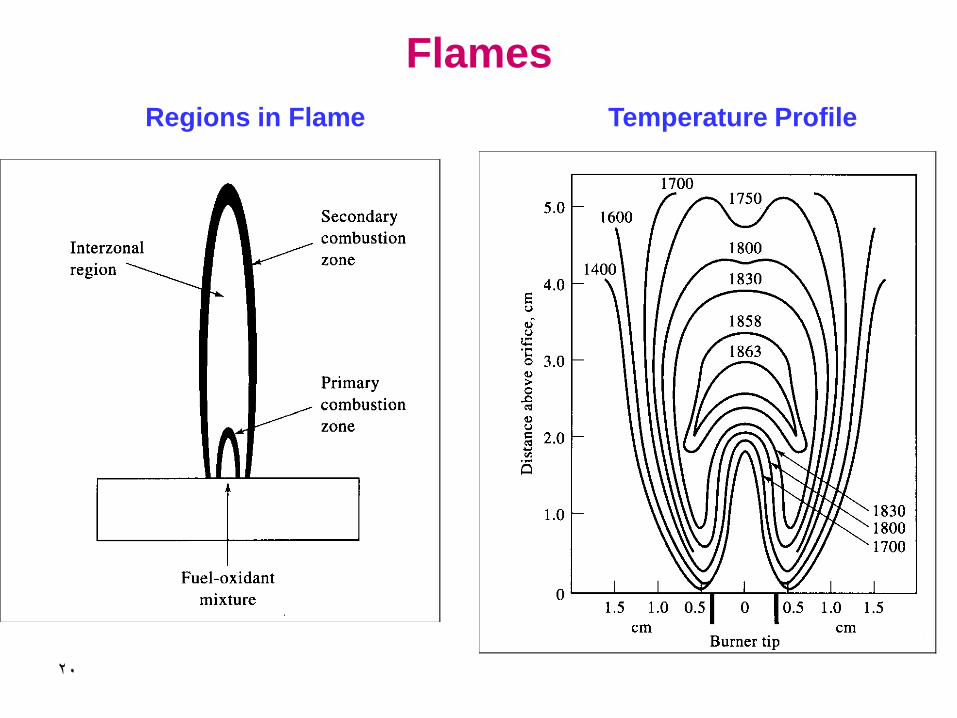
Flames
Regions in Flame Temperature Profile
21
22
23

24
25

26
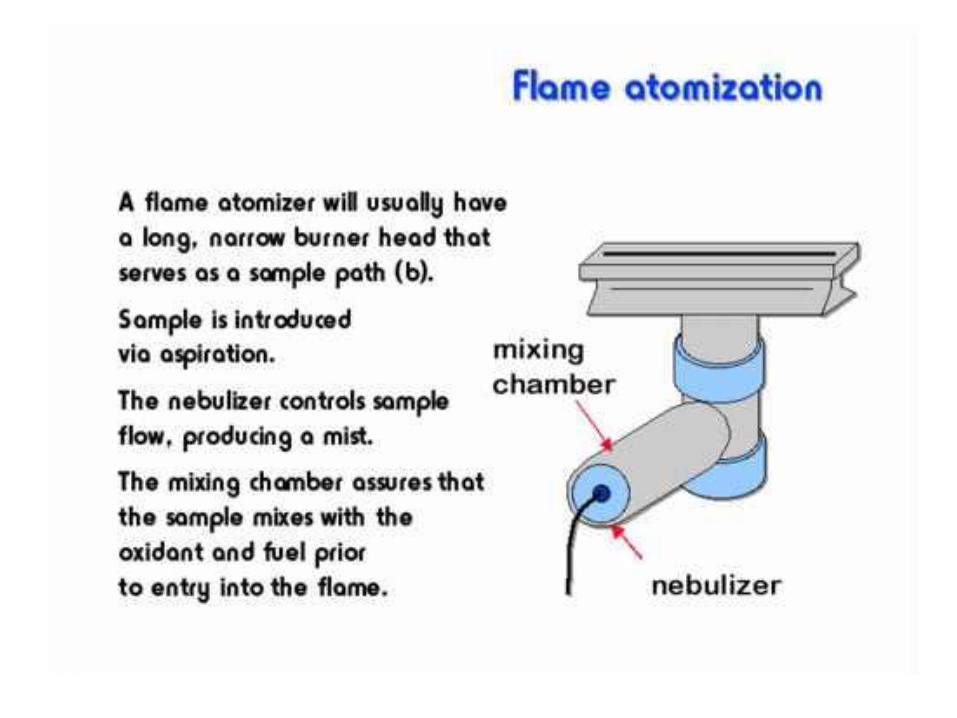
27
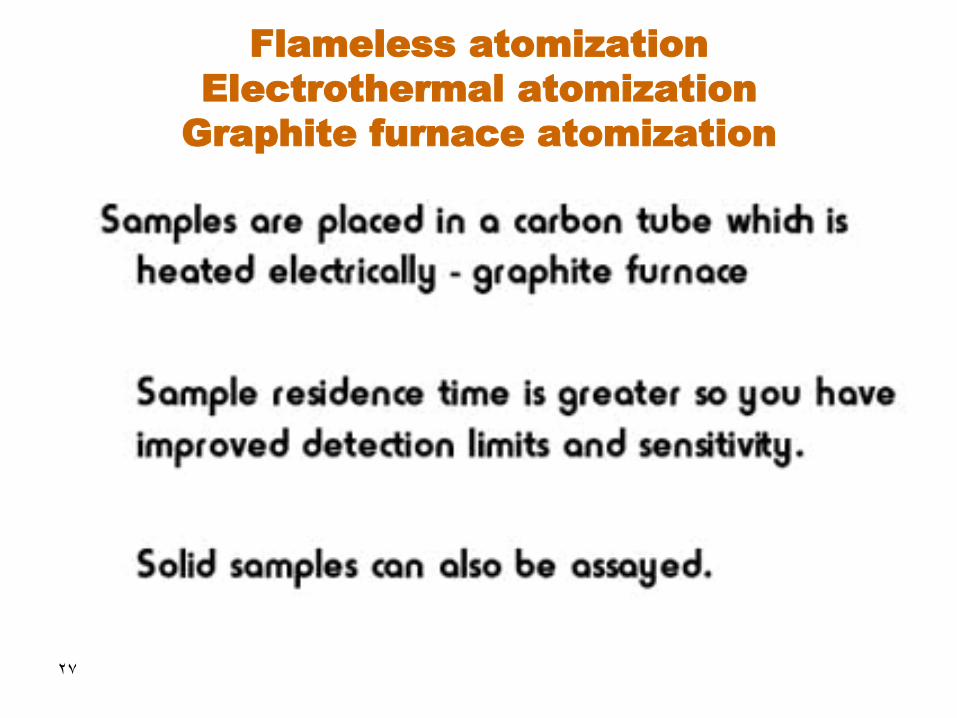
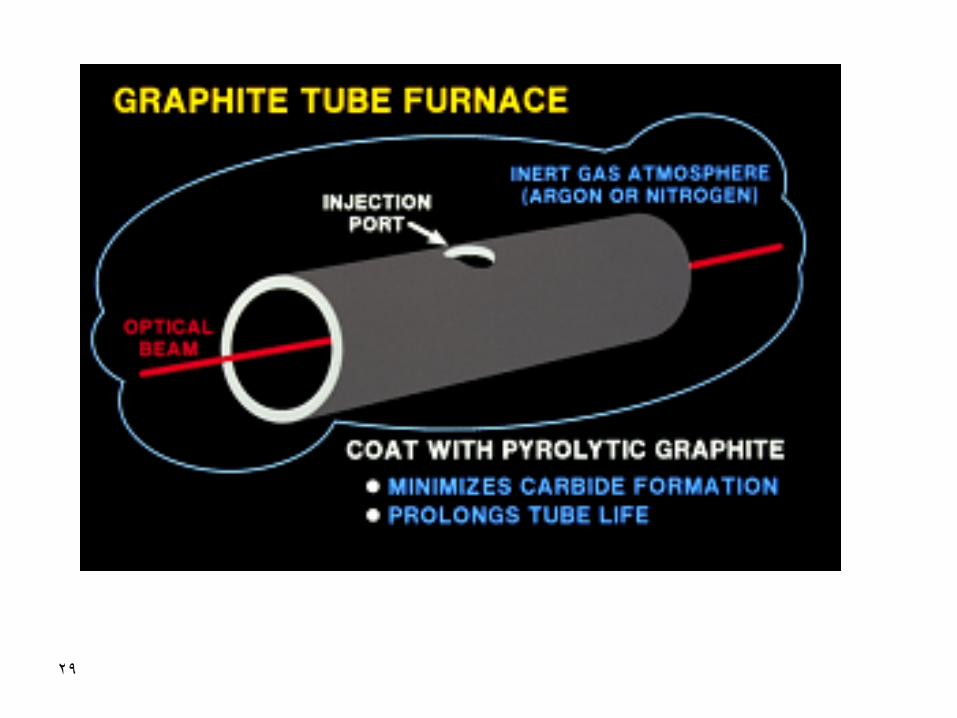
Flameless atomization
Electrothermal atomization
Graphite furnace atomization

28
29

30
31
Why do we use a temperature program in
flameless AA?
32
Why do we use an inert gas with
Flameless atomization?
33
Light source used for AA
• What light source do we use with AA?
• Would it be a continuous light source or a
line light source?
• A line light source is used for AA

34
T 2
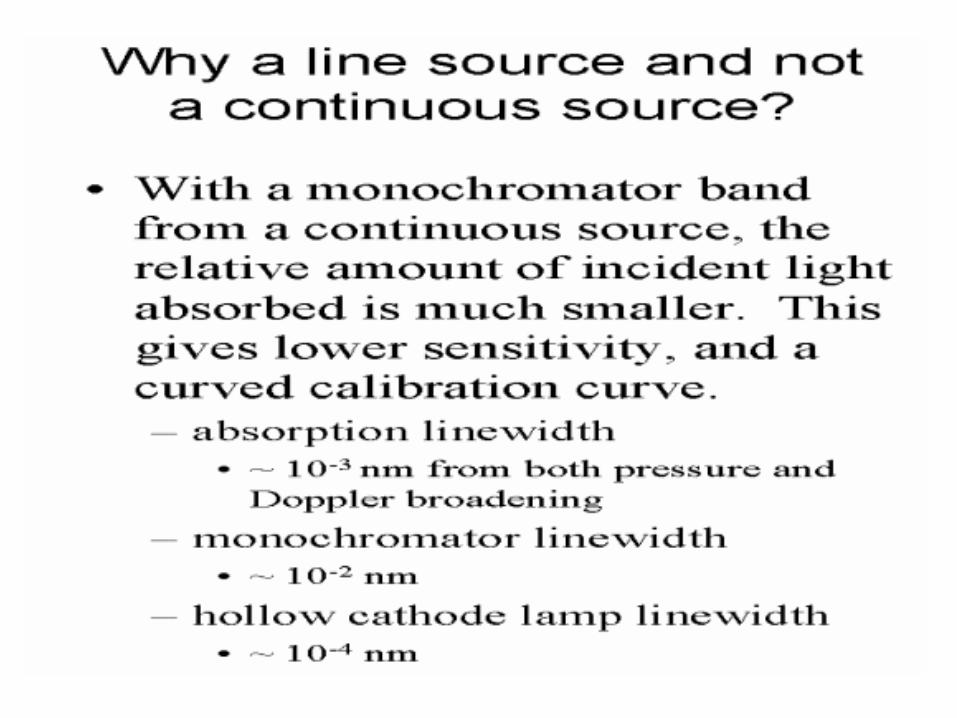
35
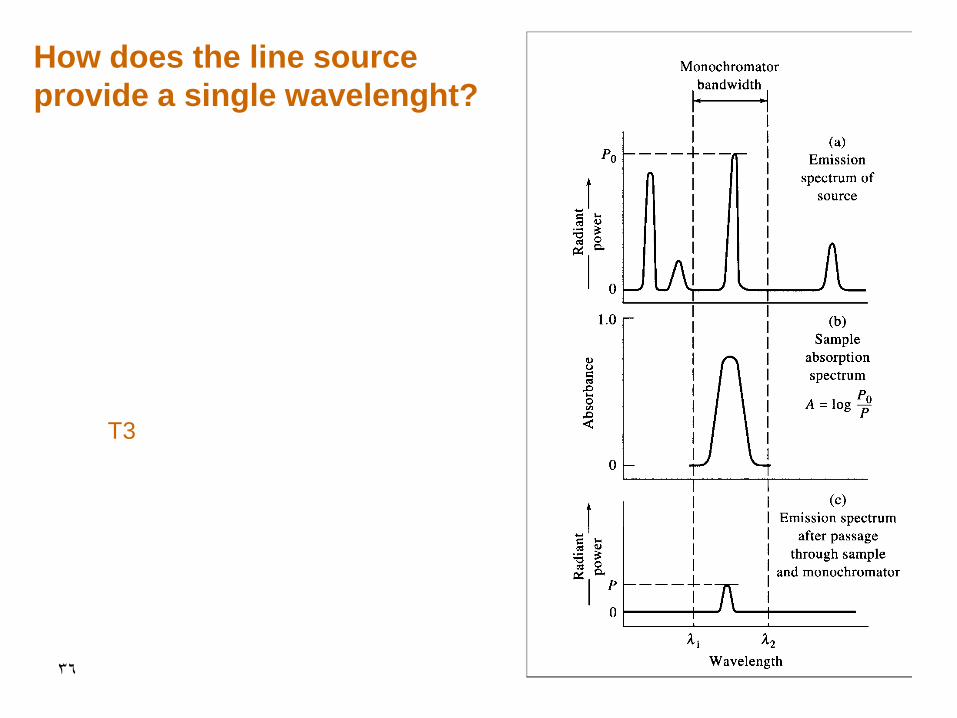
36
How does the line source
provide a single wavelenght?
T3

37

38

39
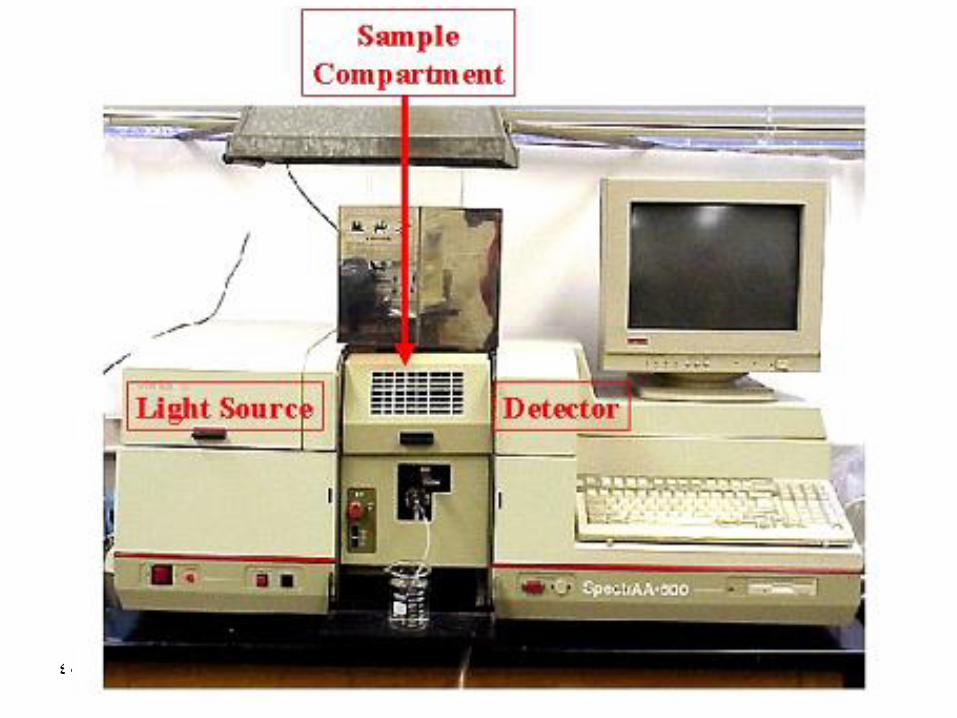
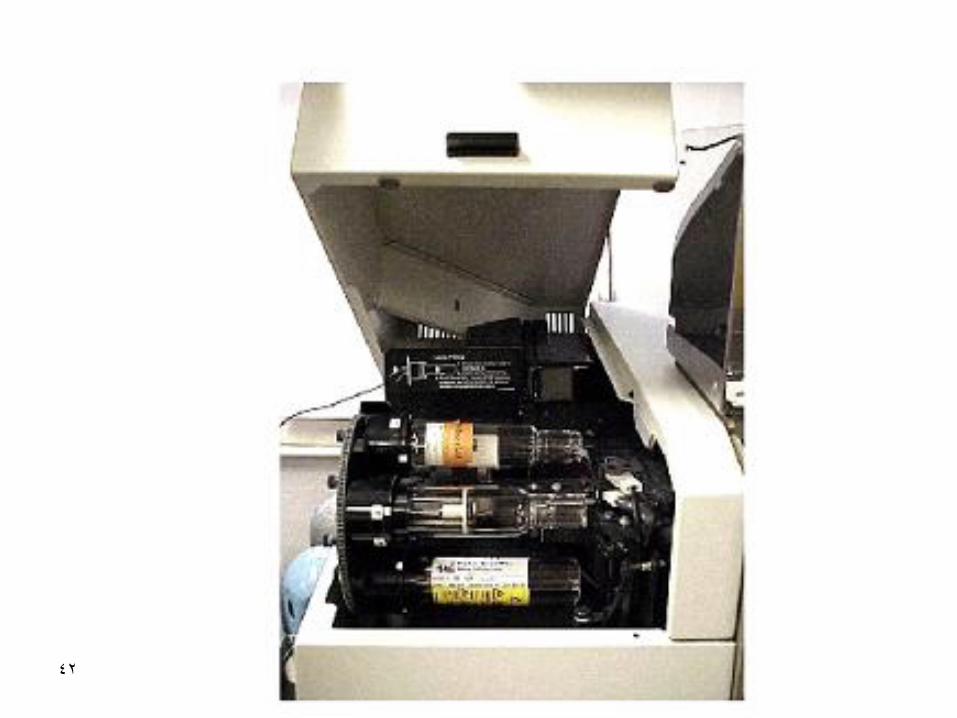
AA spectrophotometer
40

41
42
43
44
• Flame Emission -> it measures the radiation emitted by the
excited atoms that is related to concentration.
• Atomic Absorption -> it measures the radiation absorbed by the
unexcited atoms that are determined.
•Atomic absorption depends only upon the number of unexcited
atoms, the absorption intensity is not directly affected by the
temperature of the flame.
•The flame emission intensity in contrast, being dependent upon
the number of excited atoms, is greatly influenced by
temperature variations.
Relationship Between Atomic Absorption and
Flame Emission Spectroscopy
45
Measured signal and analytical concentration
1. Atomic Emission
Signal = Intensity of emission = KNf = K’Na =K’’C
Nf = number of free atoms in flame
Na = number of absorbing atoms in flame
C = concentration of analyte in the sample
K, K` and K’’ depend upon:
• Rate of aspiration (nebulizer)
• Efficiency of aspiration (evaporation efficiency)
– Flow rate of solution
– Solution concentration
– Flow rate of unburnt gas into flame
• Efficiency of atomization (effect of chemical environment). This depends upon
– Droplet size
– Sample flow rate
– Refractory oxide formation
– Ratio of fuel/oxygen in flame
• Temperature effect (choice of flame temperature)
46
2. Atomic absorption
Signal = I absorbed = Absorbance = A = k l C
• For the measurement to be reliable k must
be constant; k should not change when a
change in matrix or flame type takes place.
• K depends upon same factors as those
for the atomic emission spectroscopy

47
Background and
Background Correction
48
• Definition
• Sources of Background
• Background correction:
– Blank correction method
– Two-line correction method
– Continuous source correction method
– Zeeman effect correction method

49
What is a background?
• It is the signal observed when the element sought is
absent
• The light at a specific wavelength (Analyte wavelength) is
attenuated by the effect of flame components or matrix
components in the sample
• Thus measured absorbance and analyte concentrations are
too high
• If problem from flame, blank aspiration will correct for it
• It is more serious at short wavelengths (< 430 nm) and with
graphite furnace

50
Sources of Background in atomic
absorption
1. Absorption by flame itself (Serious at
below 220 nm; e.g., As, Se, Zn )
• Water blank can compensate for this flame
absorption
• In flame absorption, background
interference is insignificant at > 230 nm
51
2. Absorption by concomitant molecular species originating from the matrix like NaX or solvents containing X (halogen) like CCl4.
• Halides absorb at < 300 nm
3. Scattering of radiation from the particulate material in the flame
• Particulate material: Unevaporated droplets; unevaporated refractory salt particles
• Scattering is more serious at short • 2 and 3 are most common with electrothermal atomizer
52
Specific Applications Require
background correction
1. Graphite furnace
2. Flame determination of low concentrations of an element in the presence of high concentrations of dissolved salts
3. Flame analysis where sample matrix may show molecular
absorption at of the resonance line
4. Flame determination of an element at where flame absorption is high
53
Background correction methods
1. Using a blank
• Measure the absorbance of the metal
resonance line by both flame & blank
(flame system)
• Measure the absorbance of the metal
resonance line by sample and flame system
(flame + blank)
• A is the difference
54
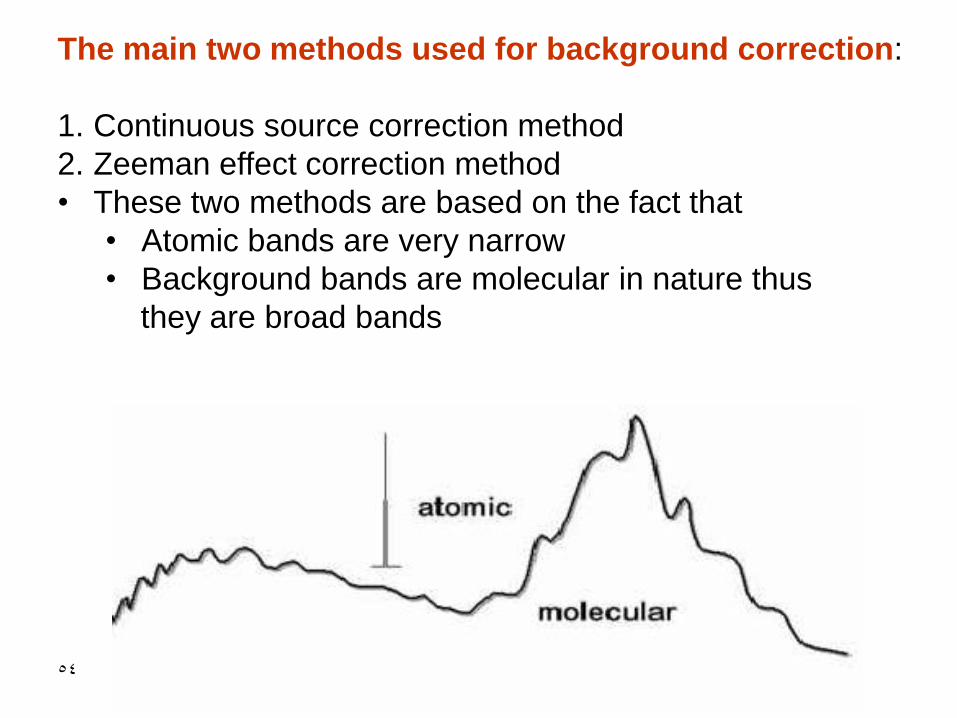
The main two methods used for background correction:
1. Continuous source correction method
2. Zeeman effect correction method
• These two methods are based on the fact that
• Atomic bands are very narrow
• Background bands are molecular in nature thus
they are broad bands
55
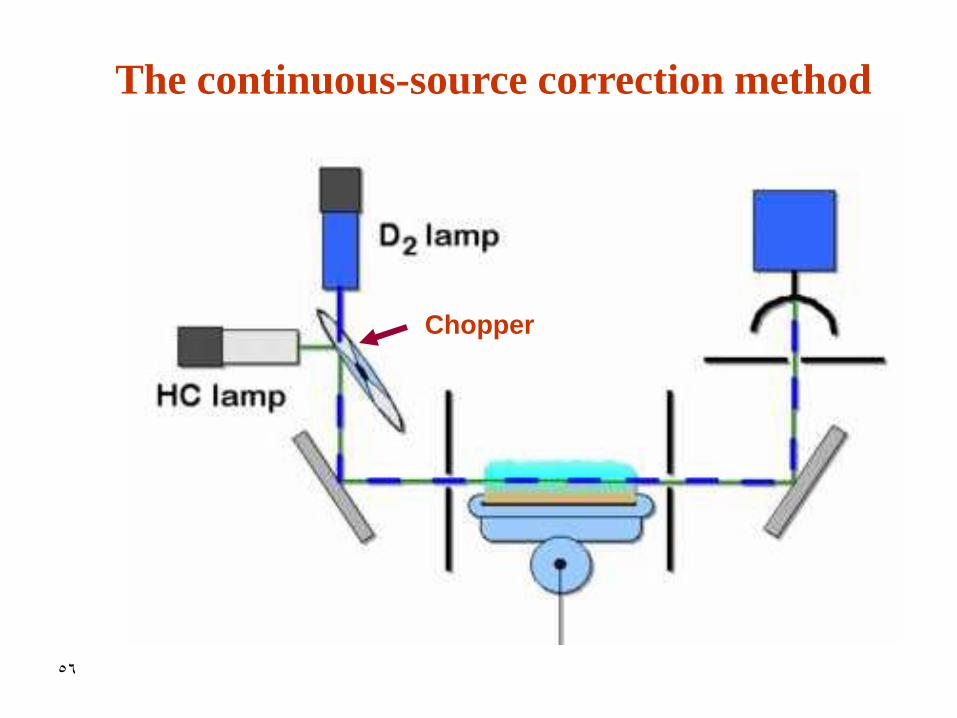
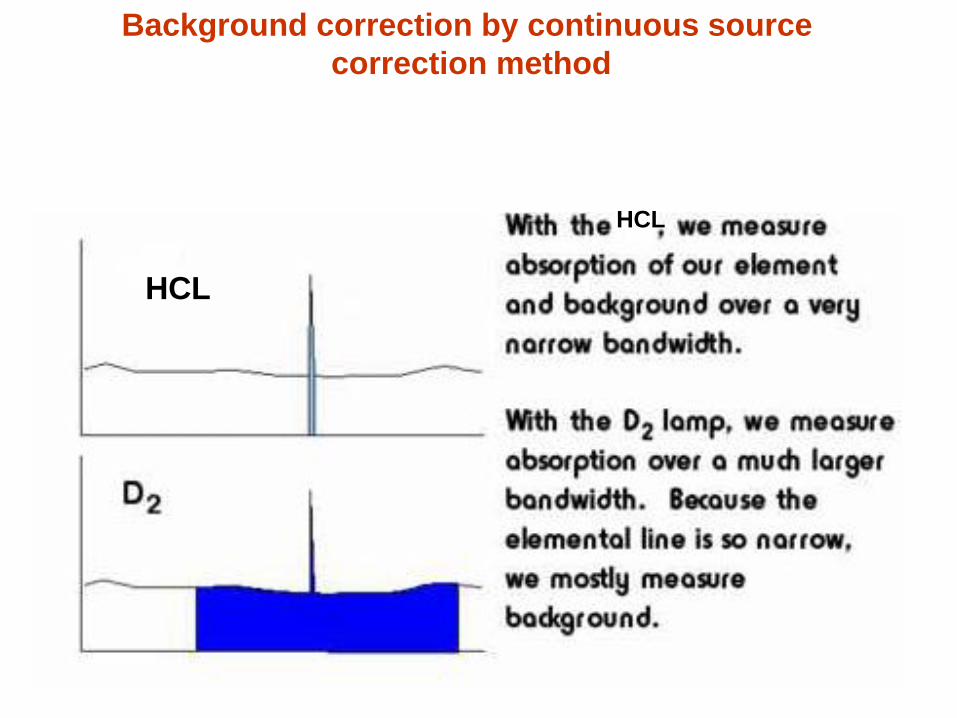
2. The continuous-source correction
method
• This method is an available option with most instruments
• Deuterium lamp is used in conjunction with the HCL lamp
• The two lamps are observed by detector alternatively in time
• Background usually absorb radiation from D2 lamp and HCL
• Absorption of the analyte from D2 lamp is negligible
• The lamps may be pulsed at different frequencies, thus the signal processing electronics can distinguish and process separate absorption signals
• Thus
Acorrected = A HCL - AD2
56
The continuous-source correction method
Chopper
57
58
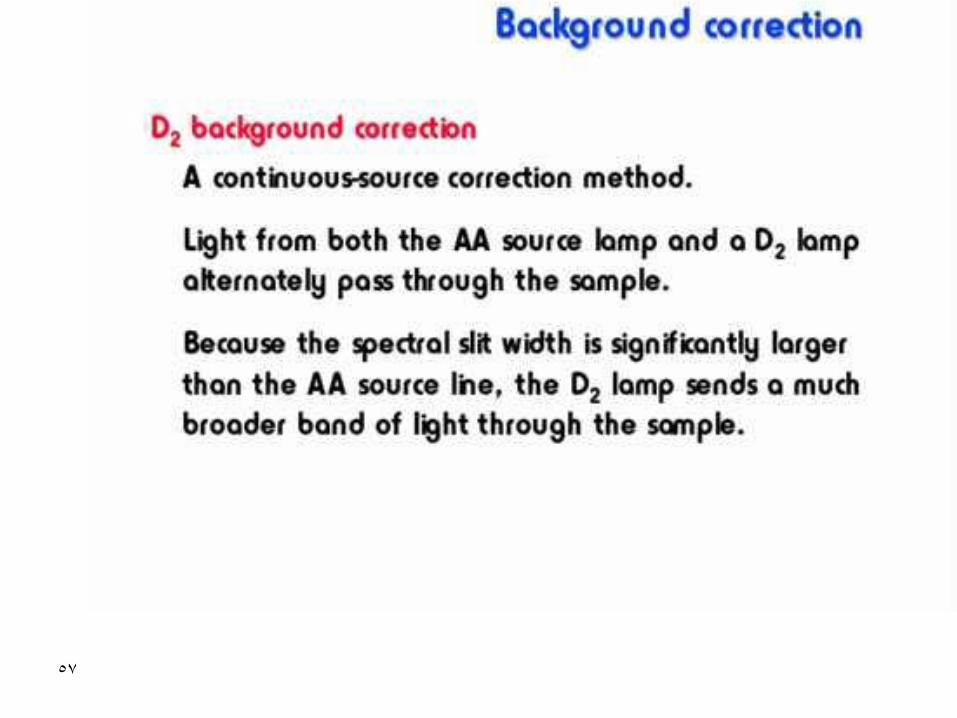
Background correction by continuous source
correction method
HCL HCL
HCL

59
60
Disadvantages of the continuous source
correction method
• Correction may degrade detection limit. The current of HCL is reduced to match the D2 lamp
• The correction may be in error if the background s (sample and standards) are not the same
• Alignment of the two sources to pass through the same area of atomizer is tedious
• Beam splitter reduces the intensity of radiation which may affect the limit of detection
• Additional light source and electronics are needed
61
Zeeman effect correction method
62
Zeeman effect correction method
63
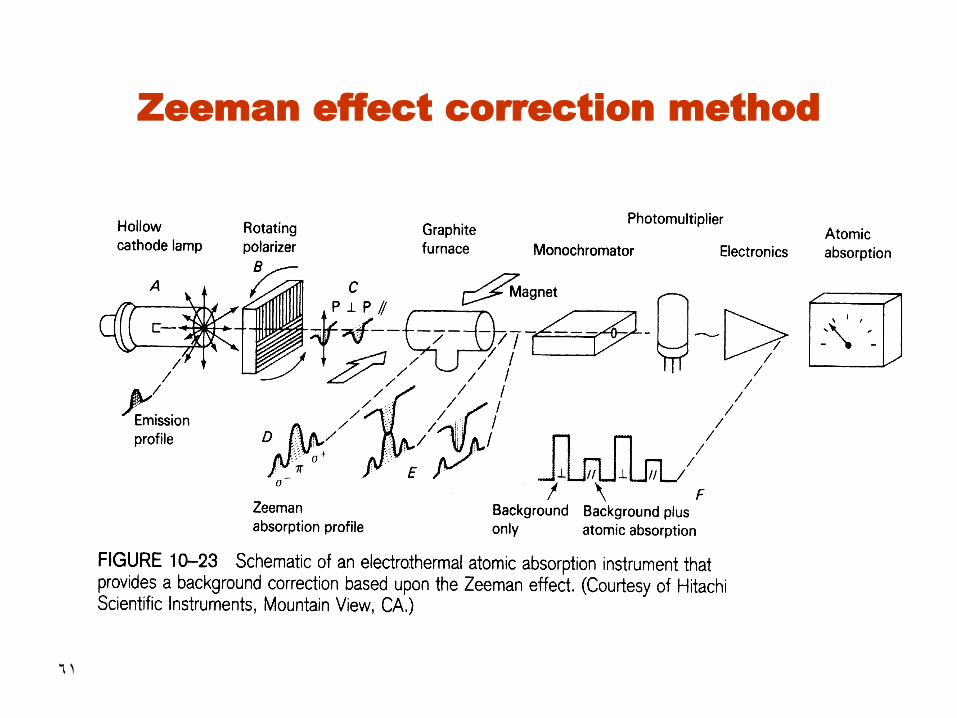
• Under the magnetic field, atomic spectral line (emitted or absorbed) splits into three or more polarized components
• Two components will be displaced at equal wavelength intervals higher and lower than the original line.
• The original line is polarized in plane parallel to the magnetic field and the other lines are polarized perpendicular to the magnetic field
• The original line is absorbed by both background and analyte. However, the other lines are absorbed by background only
• The signal corresponding to the analyte is the difference
64
Advantages of Zeeman method
• Only a single lamp is required
• Problems of alignment of two beams is eliminated
• It provides more accurate correction for background than other methods because the background absorbance is measured at or very near the wavelength that the analyte absorbance is measured
65
Disadvantages of Zeeman method
• The implementation is rather complex and expensive
• The original and the split bands may overlap causing an increase in the background signal
• This causes a curvature in the calibration curve
• The instrument is bulky because of the magnet
• Spectral lines for some elements may undergo more complex splitting. Thus sensitivity will be reduced (It gave good results for 44 elements)
• It is more difficult to engineer with flames
66
Source self reversal
background correction method
• It is based on self-reversal of the HCL spectral lines
at high current
• At high current, many free atoms are generated
causing an increase in the number of unexcited
atoms that absorb the center of the emitted line
causing the self reversal
• Specially good for correcting for high molecular
absorption for that by phosphate on Se and As
• A total is measure

67
• Hollow cathode lamps normally operate at currents of 3-15 mA.
• If the applied power is raised to several hundred mA, they exhibit a phenomenon called self-reversal.
• This giant pulse of current changes the nature of the analyte absorption line so it will only measure the background absorbance.
• Atotal is measured during the low current period. Abackground is measured during the high current period
• The low current (6-20 mA) is pulsed at 100-500 mA
Corrected signal = Signal before the pulse
–Signal After the pulse
68
Advantages of Smith-Hieftje technique
• Only a single source is used
• It offers all the advantages of other methods at low cost
• It does not lose radiation like in Zeeman but this mehtod with the Zeeman one are less sensitive than the D2 one
• Drawbacks – less sensitivity
– lamp life decreased
69
Background in atomic emission
• Sources
1. Emission from flame
2. Emission from the sample matrix
70
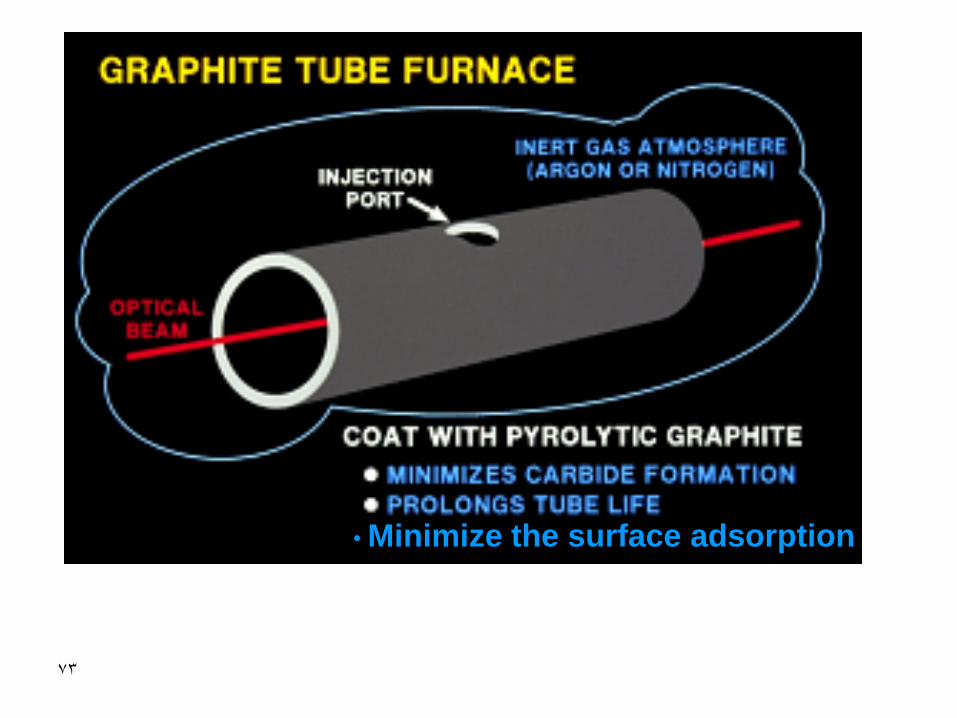
Electrothermal Atomizer
(Graphite Furnace)
• Main components
• Atomization steps
• Interferences and matrix modification
71
Graphite Furnace Atomic Absorption
Spectrometry, GFAAS
A technique to minimize dilution during atomization of the analyte prior to its determination with atomic absorption spectrometry
A technique with more interferences than the more reliable flame atomization
A technique with high sensitivity and very good detectability but not so good throughput and precision

72
Advantages of GFAS
• Increase in the residence time thus more sensitivity will be obtained
• Possibility of analyzing samples of various matrices
• Analyzing small size samples even on the microliter scale
• Avoiding the formation of refractory oxides that cause serious interference sourcse
73
• Minimize the surface adsorption

74
Why do we use an inert gas with GFAAS?
75
Atomization Process
76
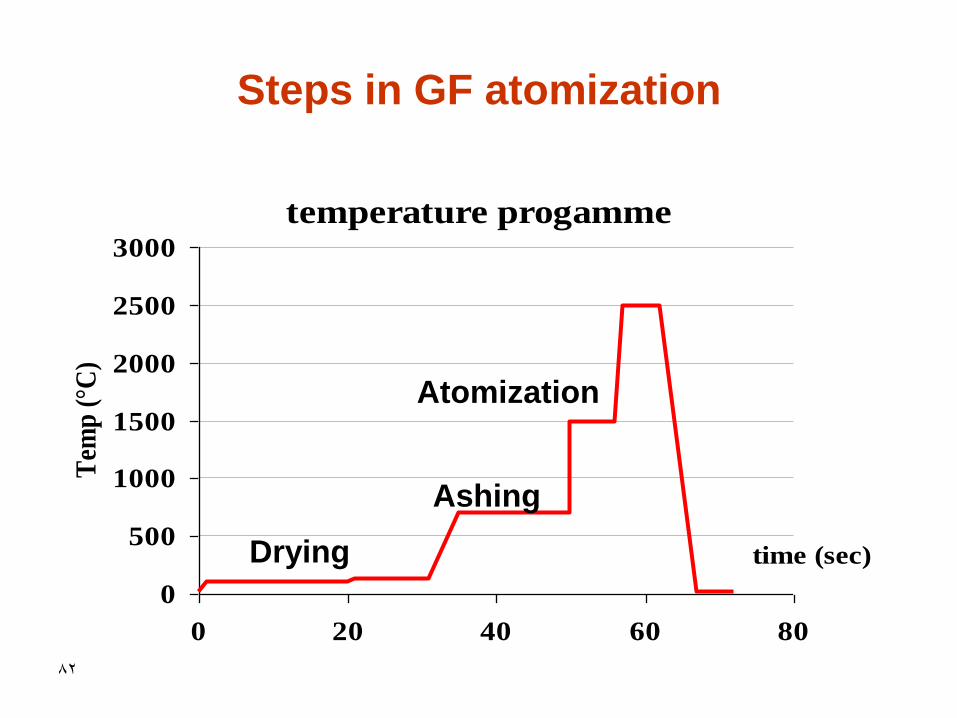
• The steps of a GF atomization
• 5-100µl sample
– drying
– ashing
– atomization
– burnout
– cool
Steps in graphite furnace atomization
77
Steps in GF atomization
• The sample introduction
– The sample is injected, usually
between 10-30µl but sometimes the
range could be extended to 100µl.
– The solution is preferably made up of
dilute nitric acid as matrix
– sometimes solid samples are
introduced
78
• The drying step
– to volatilize the sample solvent
– use some degrees above the solvents
boiling point (for water use 110°C) and
about the same time in seconds as the
injected volume in µl
– check that the solvent only volatilizes
and not boil, otherwise bad
reproducibility may occur
79
• Ashing of the sample
– Maybe the most important step
– Remove sample matrix without losing the
analyte
– Highly dependent on both the analyte and
sample matrix
– Conditions for every new sample type
should be optimized
– Inorganic matrix more difficult, because
higher temperatures are needed
80
• The atomization step
– This step is to vaporize and atomize the
analyte
– the vaporization pressure of the analyte
dominate the supply of analyte atoms
inside the tube
– The convection of expanding gas and
diffusion dominate the transport of
analytes out of the tube
– rapid heating is necessary for good
sensitivity
81
• The burnout step
– it is used for taking away parts of the sample not completely volatilized during atomization
– temperatures in the range 2700-3000°C is most often used
– if vaporization of the sample is achieved, completely, the sensitivity will slowly decrease and the imprecision increase
• Cooling step
– its purpose is to cool down the furnace before next sample is added
82
Steps in GF atomization
temperature progamme
0
500
1000
1500
2000
2500
3000
0 20 40 60 80
time (sec)
Tem
p (
°C)
Drying
Ashing
Atomization
83
Interferences with graphite furnace
and its control
• In the early days this technique was
accepted as a highly interference
technique
• Later, new instrumental and analytical
procedures were developed which
avoided the conditions found to be the
source of interference problems
84
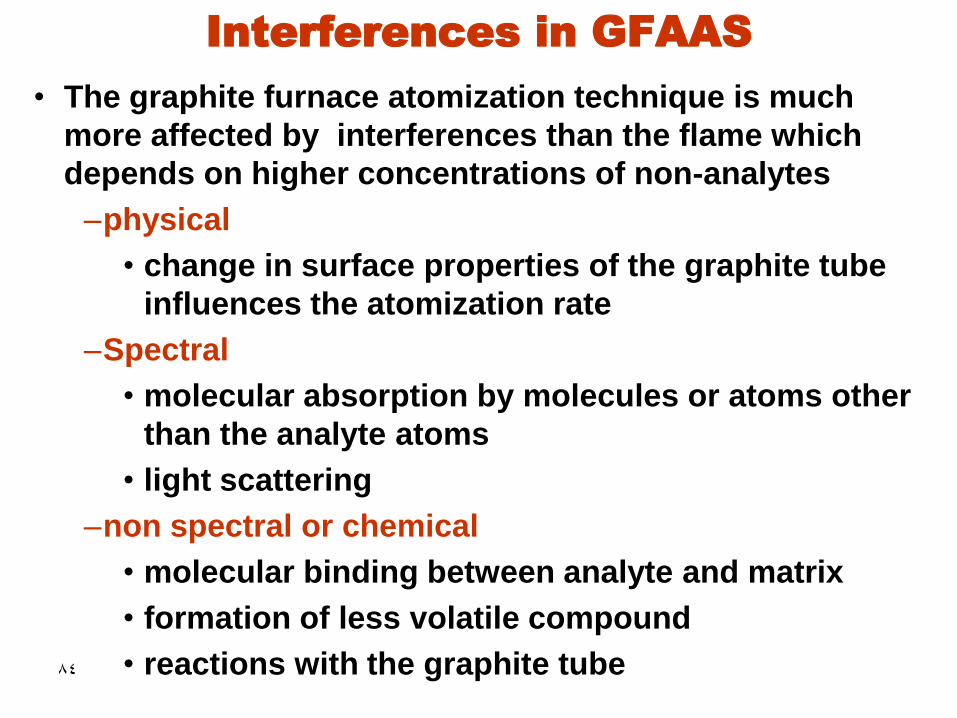
Interferences in GFAAS
• The graphite furnace atomization technique is much
more affected by interferences than the flame which
depends on higher concentrations of non-analytes
–physical
• change in surface properties of the graphite tube
influences the atomization rate
–Spectral
• molecular absorption by molecules or atoms other
than the analyte atoms
• light scattering
–non spectral or chemical
• molecular binding between analyte and matrix
• formation of less volatile compound
• reactions with the graphite tube

85
Interference removal
Spectral interferences
• Emission interference
• Non-analyte absorption and scattering

86
1. Emission interference
• Radiation emitted by the hot graphite tube or
platform that covers a wide range of
waqvelengths (250-800 nm)
• Following elements will be obscured:
– Zn 213.9 nm; might be ok
– Cr 357.9 nm
– Ca 422.7 nm
– Ba 553.7 nm mostly affected
• This effect is eliminated by removing the
graphite tube wall or platform from the view
of the detector. This is achieved by ine of the
following arrangements:
87
• Setting a narrow monochromator slit
• Furnace alignment
• Cleaning graphite tube and windows to
prevent light scattering
• Atomization temperature should not be
higher than required
88
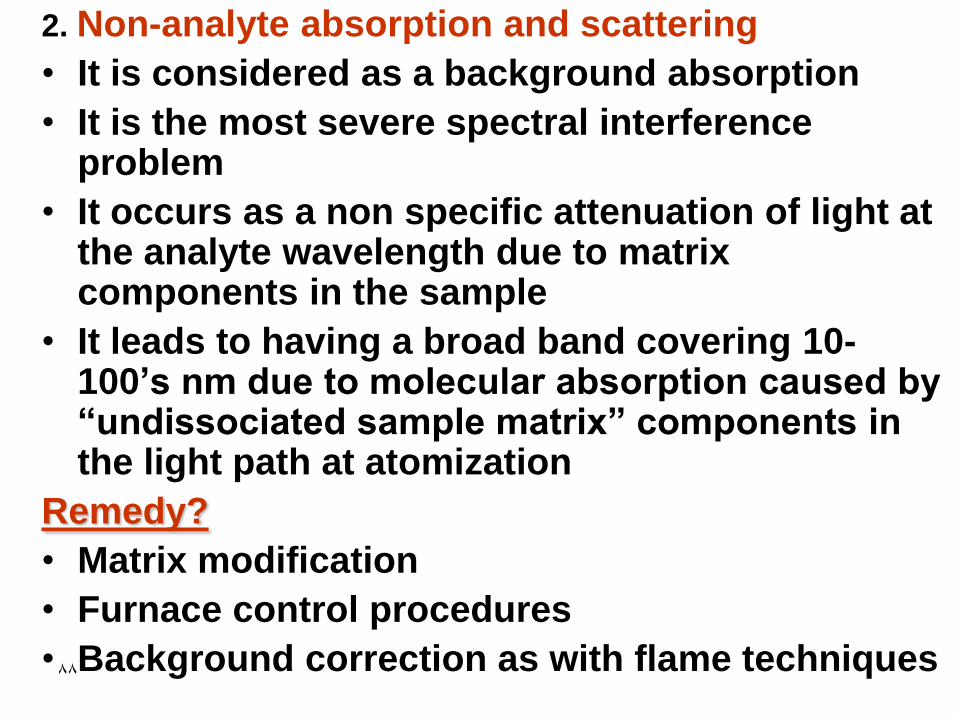
2. Non-analyte absorption and scattering
• It is considered as a background absorption
• It is the most severe spectral interference problem
• It occurs as a non specific attenuation of light at the analyte wavelength due to matrix components in the sample
• It leads to having a broad band covering 10-100’s nm due to molecular absorption caused by “undissociated sample matrix” components in the light path at atomization
Remedy?
• Matrix modification
• Furnace control procedures
• Background correction as with flame techniques
89
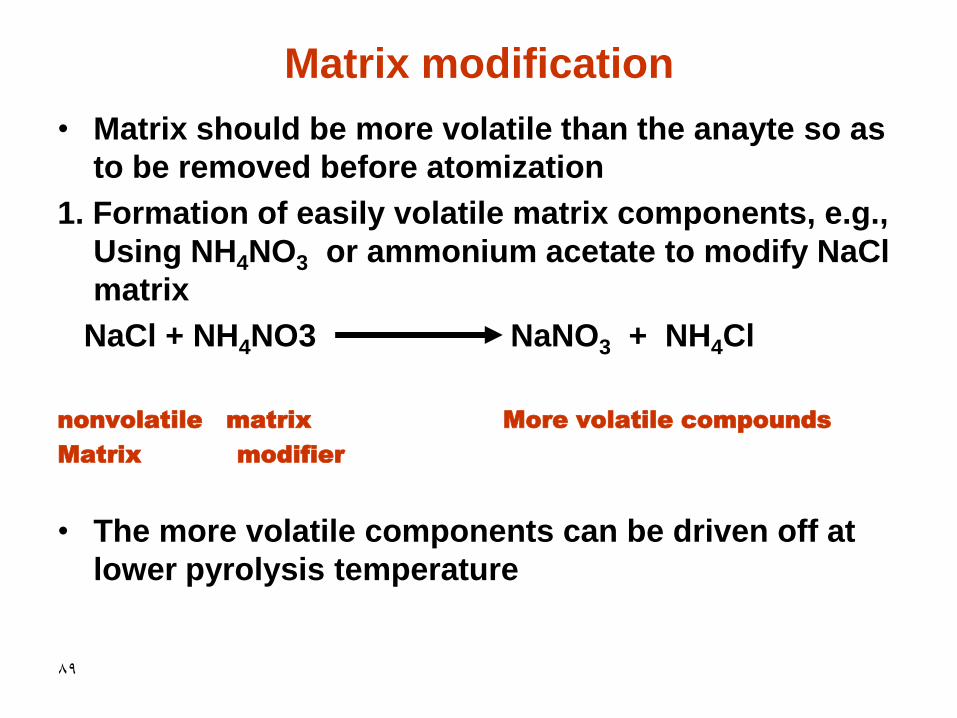
Matrix modification
• Matrix should be more volatile than the anayte so as
to be removed before atomization
1. Formation of easily volatile matrix components, e.g.,
Using NH4NO3 or ammonium acetate to modify NaCl
matrix
NaCl + NH4NO3 NaNO3 + NH4Cl
nonvolatile matrix More volatile compounds
Matrix modifier
• The more volatile components can be driven off at
lower pyrolysis temperature
90
2. Converting the analyte element into a less
volatile (if it is too volatile) component using
a modifier e.g., Ni (NO3)2 for Se
determination.
• Se is a highly volatile component
• With the modifier Se form nickel selenide.
Thus, Se can be heated up to 900 oC without
loss. Consequently the matrix would be
removed without affecting Se.
91
3. Varying the sample volume
• Can be done if concentration allows
• Reduce the sample size by injecting smaller
samples, thus the mass of background producing
matrix components will be reduced.
4. Spectral background correction
• A continuous background correction is not very
efficient specially for complex matrices. Matrix
modification is a must.
• Zeeman background correction is very efficient for
complex matrices

92
Chemical Interference
• It occurs when other components of the sample
matrix inhibit the formation of free analyte atoms
Mo + Xo MX
Free analyte atoms Different matrix component

93
Interference Removal
1. Ashing with the optimal temperature
–matrix modification (mentioned above)
• Delay of anayte release to furnace allows time for a
constant furnace temperature
• thermal stabilization of analyte (to hold the analyte
on the graphite surface to a higher temperature)
and vaporization of interference during the ashing
step
– Thus, volatility of interfering matrix compound
is increased
• On the other hand volatility of interfering
compound is decreased and selective vaporization
during the atomization step
takes place
94
2. Use of pyrolytically coated Tubes and Platforms
•Ordinary graphite has a porous surface thus it forms
with the analyte a carbide that is nonvolatie
•The tubes are more or less always fabricated from
pyrolytic carbon or covered with a pyrolytic carbon layer.
It’s a more inert form of the graphite. It is more dense
surface and less absorption
•Tubes could sometimes be coated with tungsten or
tantalum for prolonged lifetime or other special
applications
•The platform technique is used to vaporize the analyte
into a more uniform and higher temperature than the
release from the wall. The analyte vaporizes after the
tube wall and gas phase reach a steady state
95
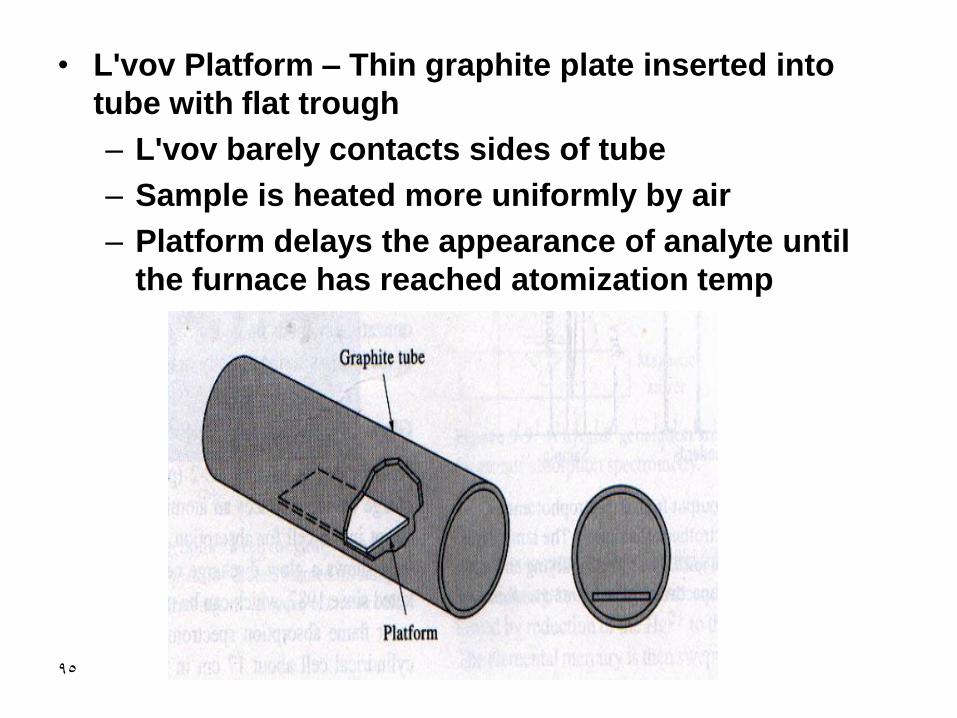
• L'vov Platform – Thin graphite plate inserted into
tube with flat trough
– L'vov barely contacts sides of tube
– Sample is heated more uniformly by air
– Platform delays the appearance of analyte until
the furnace has reached atomization temp
96
Functions of the platform
• It resists tndency for sample to saok into surface before or during drying
• It tolerates high acid concnetration
• It gives bigger signal and less background – It is heated gradually by radiation from walls
– When atomization step is reached the temperature of the sample and furnace environment will be similar
– No chance for sudden cooling and recombination forming molecular species inhibiting atomization
I
97
Disadvantages of Graphite Furnace
• Prone to interferences, poor precision
• Must take Step to control Precision:
1. Autosamplers vs. Manual Injection - more precise
2. Duplicate analyses for all samples (repeat if poor agreement)
3. Standard addition method - making standards up in sample
4. Background correction for Molecular Absorption) 1. D2 2. Zeeman Background Correction 3. Matrix Modifiers to control atomization
98
INDUCTIVELY COUPLED
PLASMA
• Main components of the instrument
• Performance of ICP
• ICP-mass spectrometry
• interferences

99
•
• The device which produces the ICP is commonly
referred to as the ICP torch. It consists of two to four
Argon flows depending on the manufacturer:
• Nebulizer gas (inner Argon flow), at about
1 L/min, carries the analyte aerosol
• Sheath gas for producing a laminar flow to
improve low excitation energy elements eg group
I & II elements
• Auxiliary gas (if present), lifts the plasma above
the injector tube, used when measuring organics
• Plasma gas, at about 12-16 L/min, sets the
plasma conditions, e.g., excitation temperature
Introduction

100
Sample Introduction
• An ICP-AES instrument consists of a sample
delivery system, an IC plasma to generate the signal,
one or more optical spectrometers to measure the
signal, and a computer for controlling the analysis.
• The most common sample delivery system consists
of a peristaltic pump and capillary tube to deliver a
constant flow of analyte liquid into a nebulizer.
101
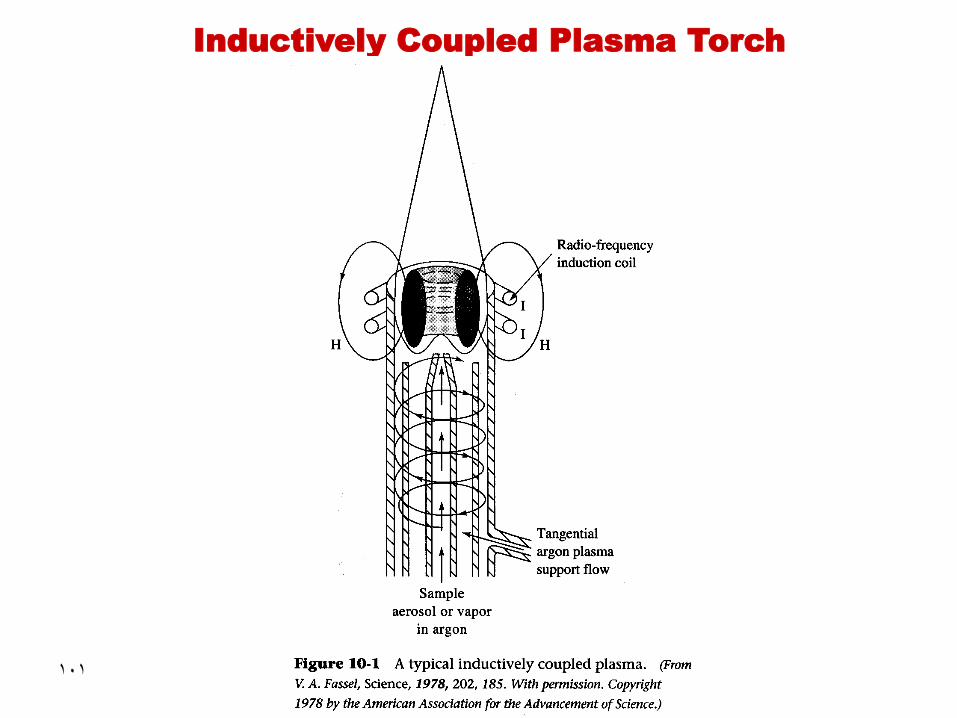
Inductively Coupled Plasma Torch

102
How does plasma generate?
• RF induction coil powered by RF generator
will generate a fluctuating magnetic field
around the coil
• Ionization of Ar is initiated by a spark
• Ar+ and e- will interact with the magnetic field
thus they will be forced to move in annular
paths
• Omic heating is the result of their resistance
to the forced movement in limited area
103
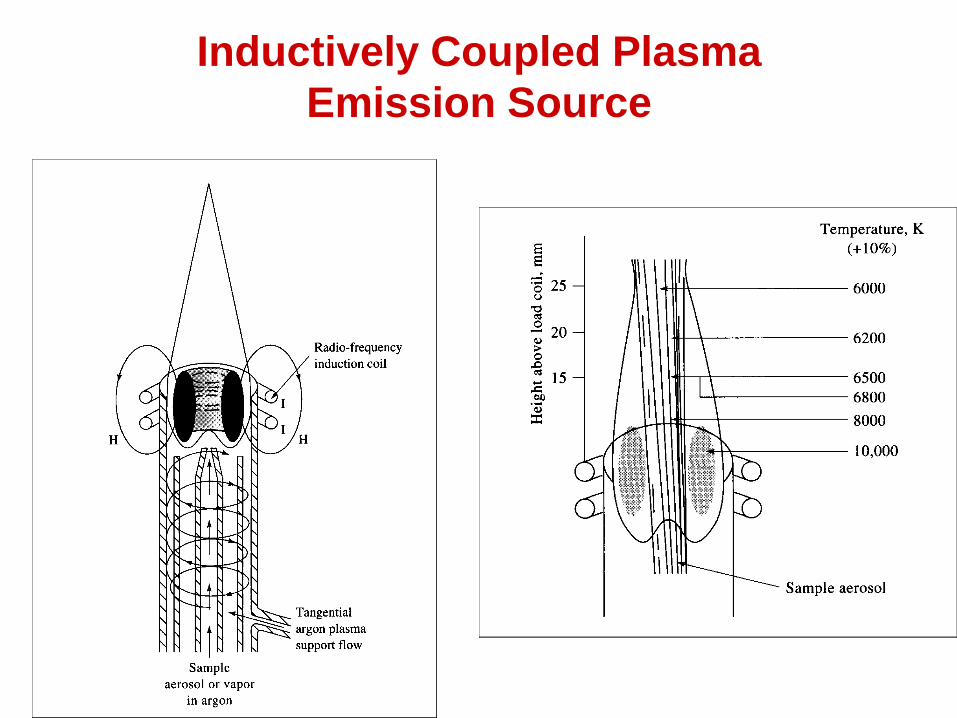
Inductively Coupled Plasma
Emission Source

104
Inductively Coupled Plasma
Emission Source and Supply

105
106
107
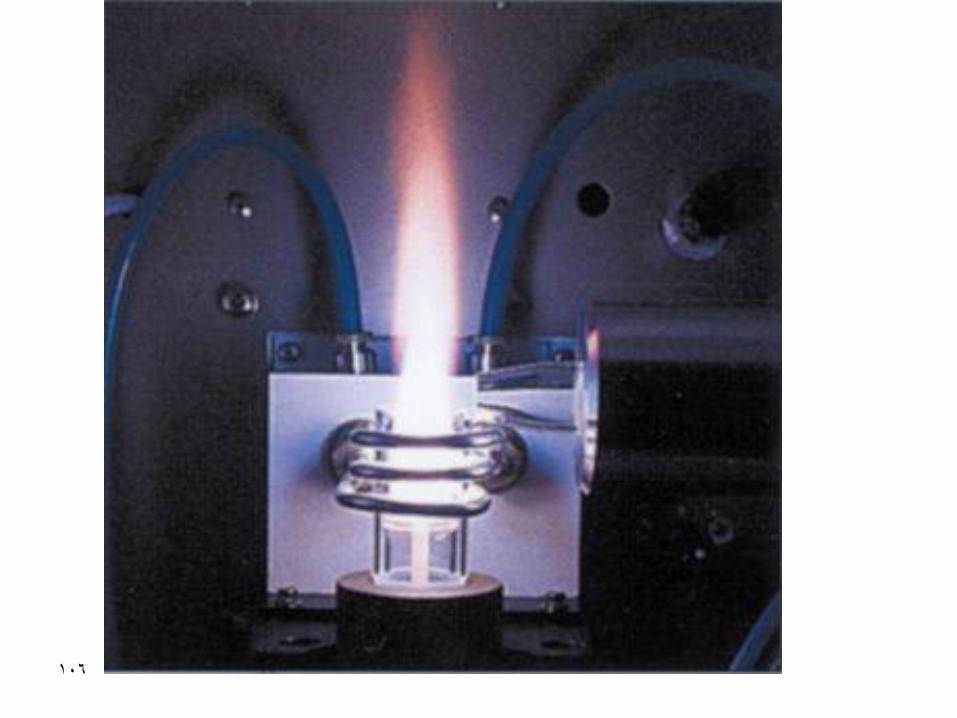
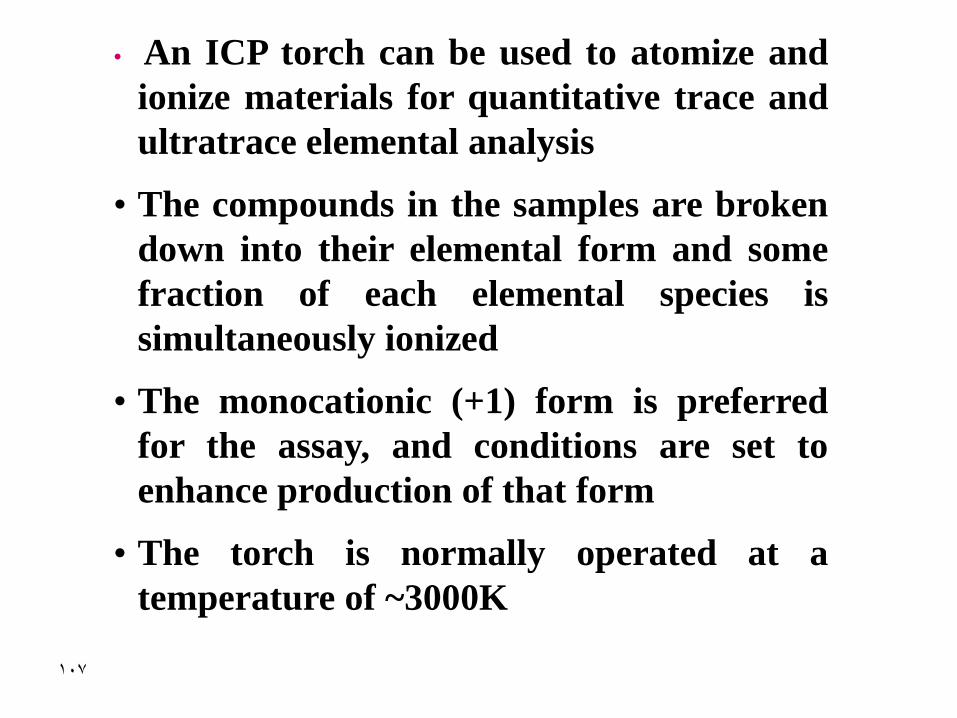
• An ICP torch can be used to atomize and
ionize materials for quantitative trace and
ultratrace elemental analysis
• The compounds in the samples are broken
down into their elemental form and some
fraction of each elemental species is
simultaneously ionized
• The monocationic (+1) form is preferred
for the assay, and conditions are set to
enhance production of that form
• The torch is normally operated at a
temperature of ~3000K

108
Schematic diagram of a typical ICP-OES instrument

109
Schematic diagram showing the different
regions in the IC Plasma
110
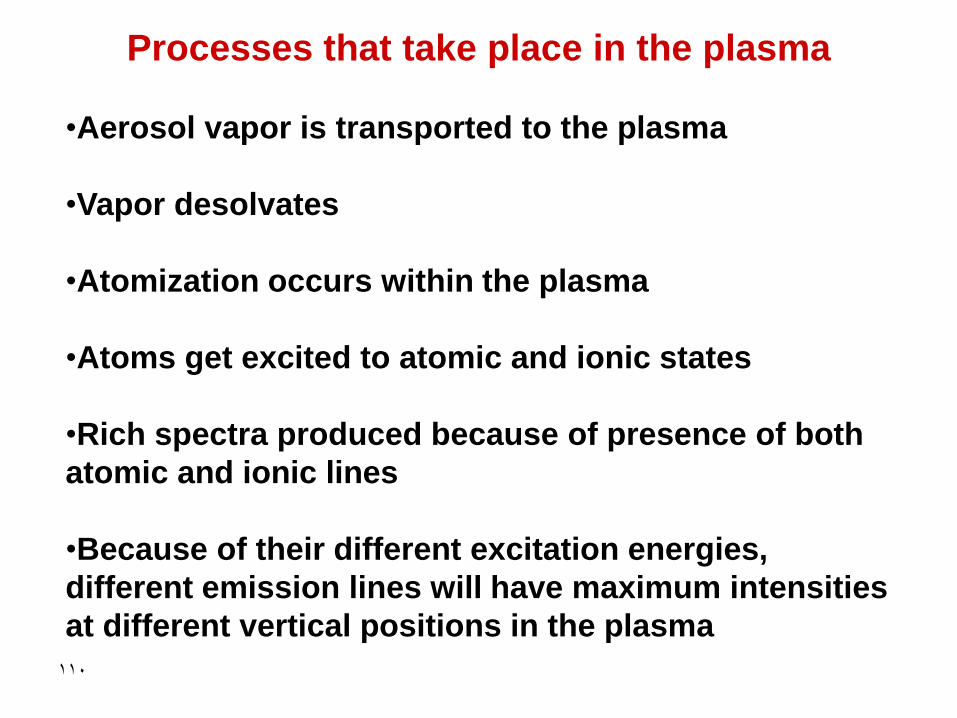
Processes that take place in the plasma
•Aerosol vapor is transported to the plasma
•Vapor desolvates
•Atomization occurs within the plasma
•Atoms get excited to atomic and ionic states
•Rich spectra produced because of presence of both
atomic and ionic lines
•Because of their different excitation energies,
different emission lines will have maximum intensities
at different vertical positions in the plasma

111
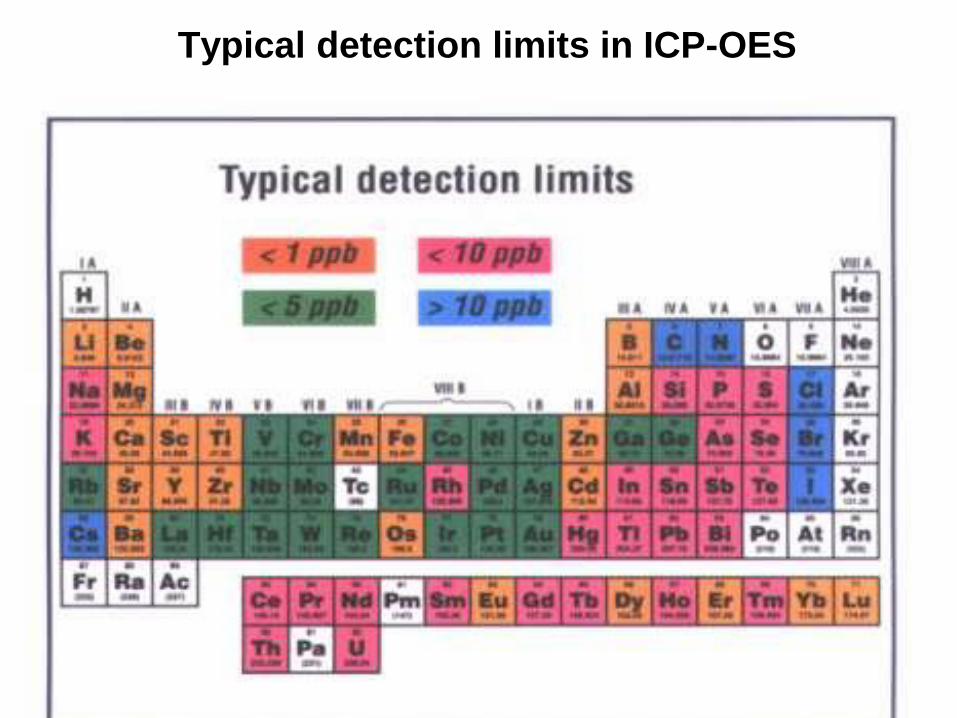
Typical detection limits in ICP-OES

112
113
Typical detection limits in ICP-OES
114
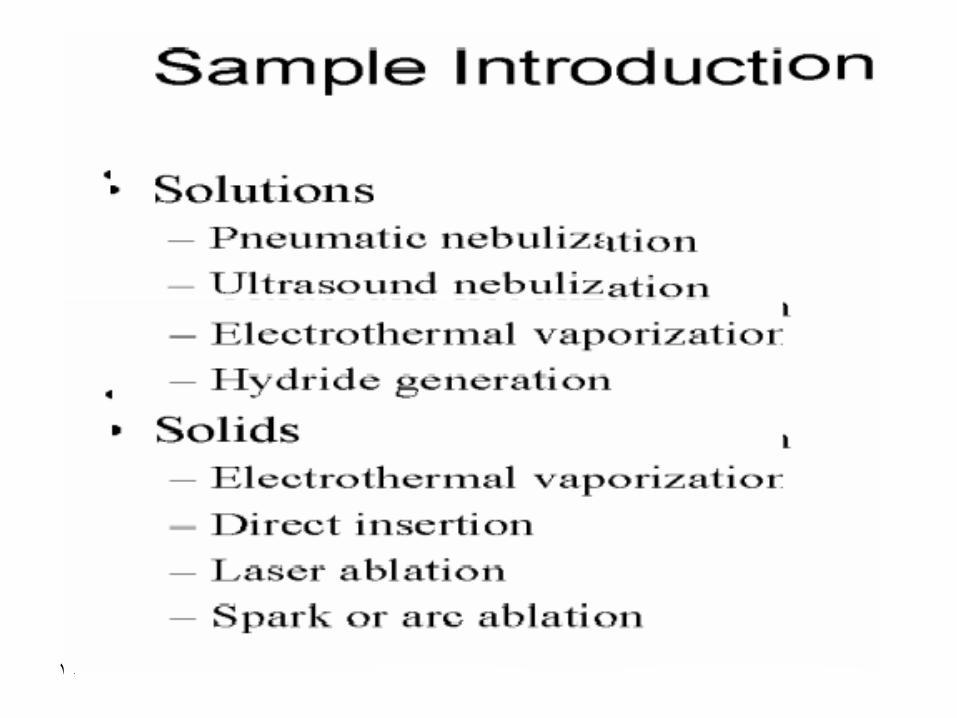
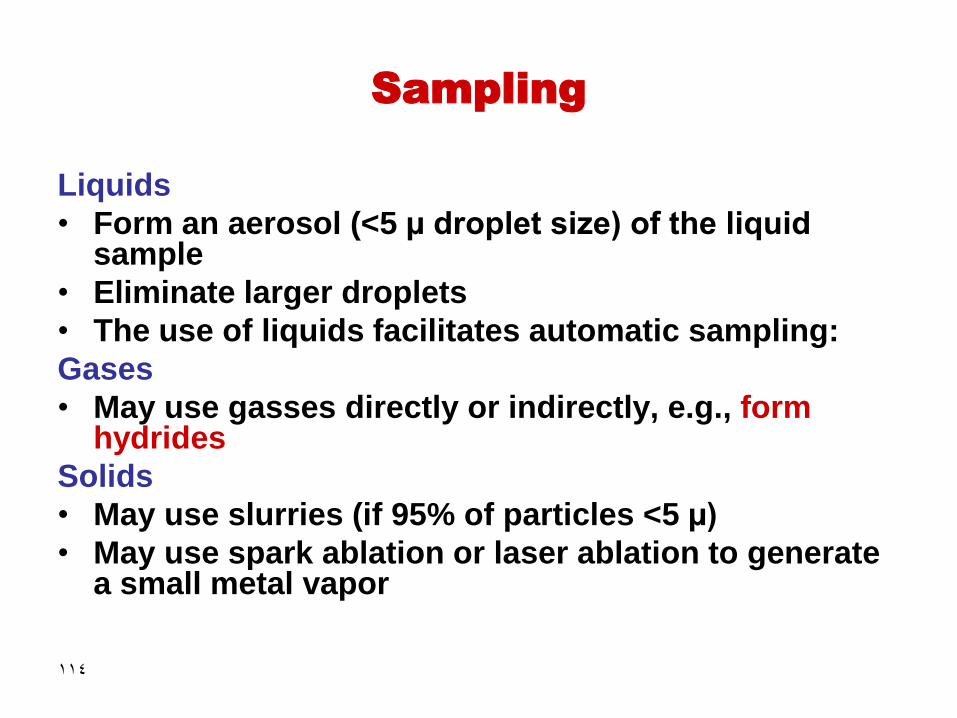
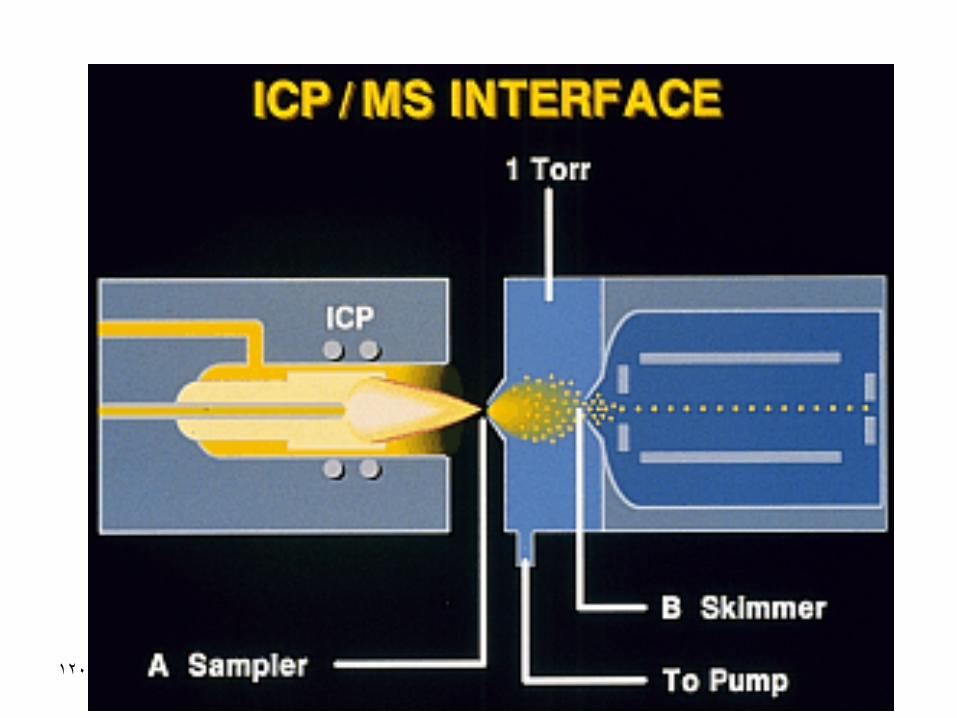
Sampling
Liquids
• Form an aerosol (<5 µ droplet size) of the liquid sample
• Eliminate larger droplets
• The use of liquids facilitates automatic sampling:
Gases
• May use gasses directly or indirectly, e.g., form hydrides
Solids
• May use slurries (if 95% of particles <5 µ)
• May use spark ablation or laser ablation to generate a small metal vapor
115
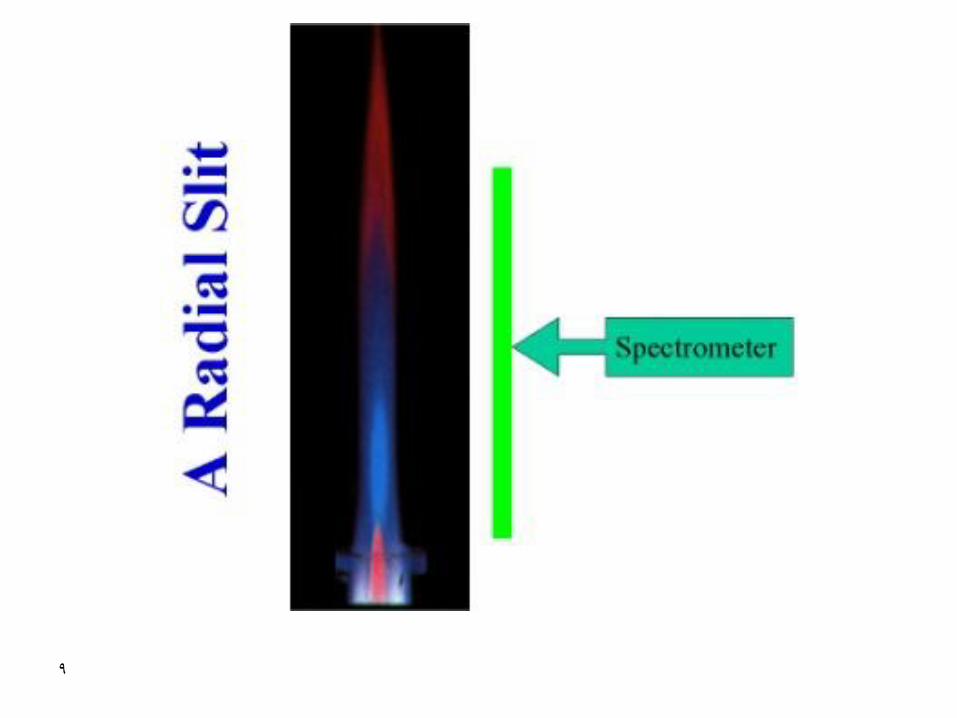
Viewing position
• The plasma generated in an ICP can be viewed
by the spectrometer, side-on or end-on.
• These viewing positions are called radial and
axial viewing, respectively.
• Each has advantages and disadvantages, so
each tends to be used for different applications:
radial viewing for normal analysis and complex
materials, axial viewing for low detection limits
in simpler materials.

116
117
Advantages of Radial View
• Should collect signal from the entire normal analytical zone – no torch adjustment for different elements
– fewer matrix effects and interferences, especially in organics
– less stray light
– better detection limits in difficult matrices, especially in alkalis and organics
– can run any matrix
– less maintenance of the torch
– torches last longer especially with dissolved salts
– lower consumption of argon
118
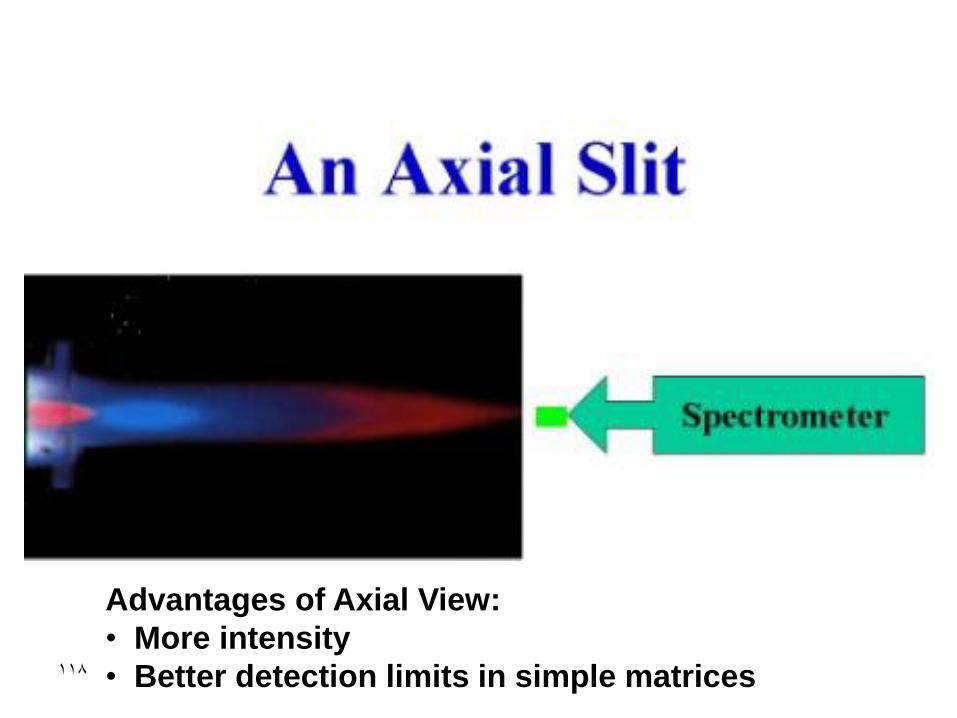
Advantages of Axial View:
• More intensity
• Better detection limits in simple matrices
119
RF-Generator • ICP's generally require an RF power of 1-2 kW maximum output
to maintain the plasma.
• High efficiency required - especially for organics (not less than 1.5 Kw)
Frequency • Fixed versus Free Running
– Fixed: Crystal controlled, eg at 40 MHz
– Free running: floats eg at 40 MHz ± 2 MHz
• 40 MHz versus 27 MHz
– Because of the skin-effect in RF plasmas, higher frequency gives a thinner plasma with a wider dynamic range (less self-absorption), with lower backgrounds and fewer interferences.
120
121
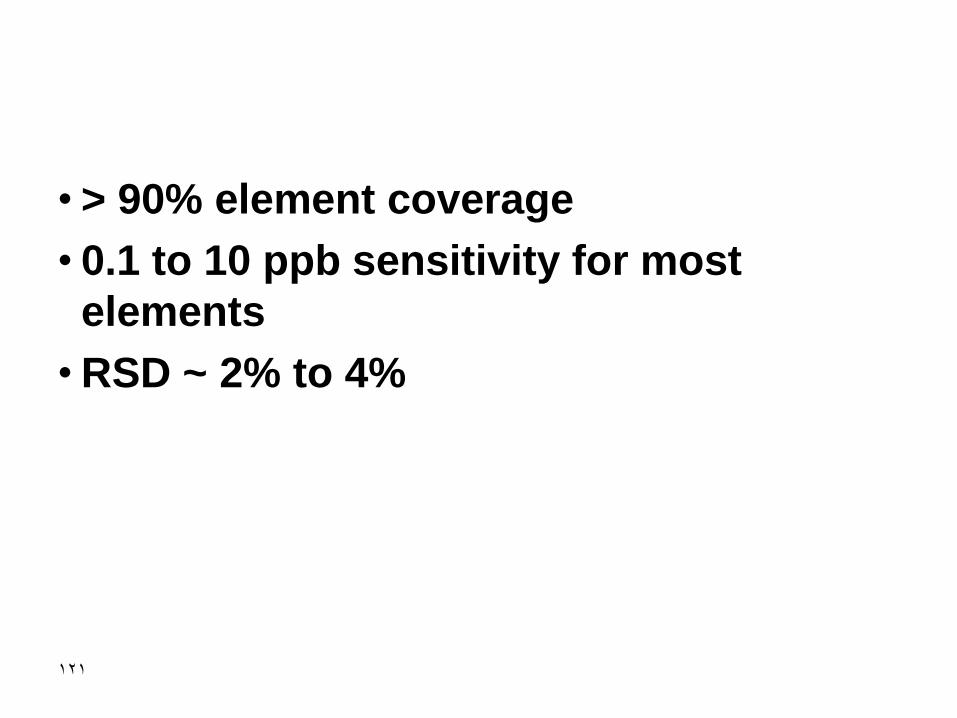
• > 90% element coverage
• 0.1 to 10 ppb sensitivity for most
elements
• RSD ~ 2% to 4%
122
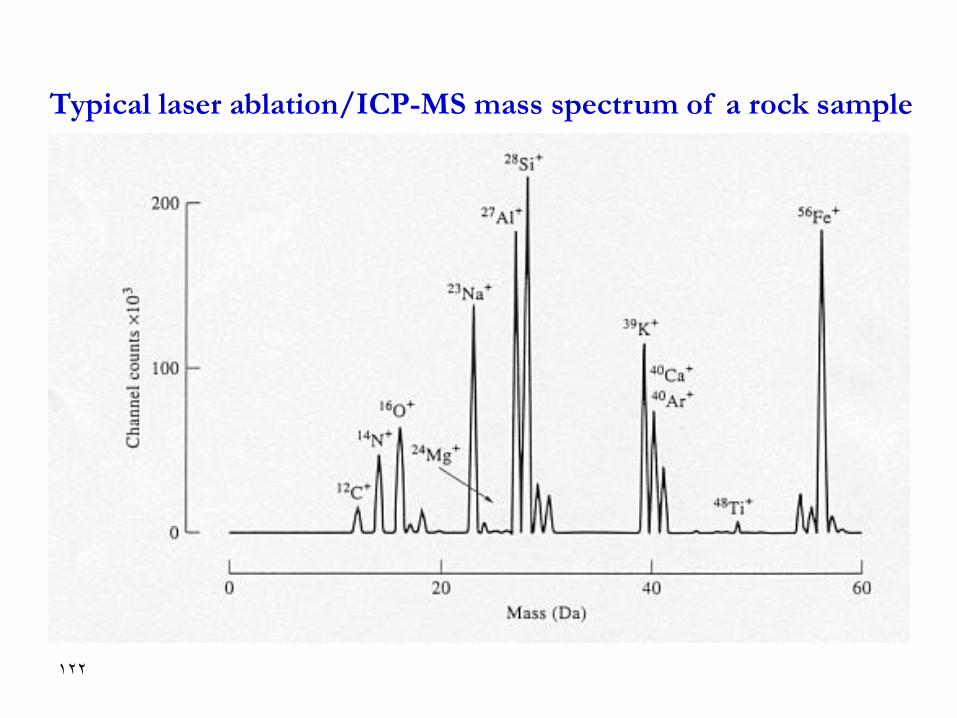
Typical laser ablation/ICP-MS mass spectrum of a rock sample
123
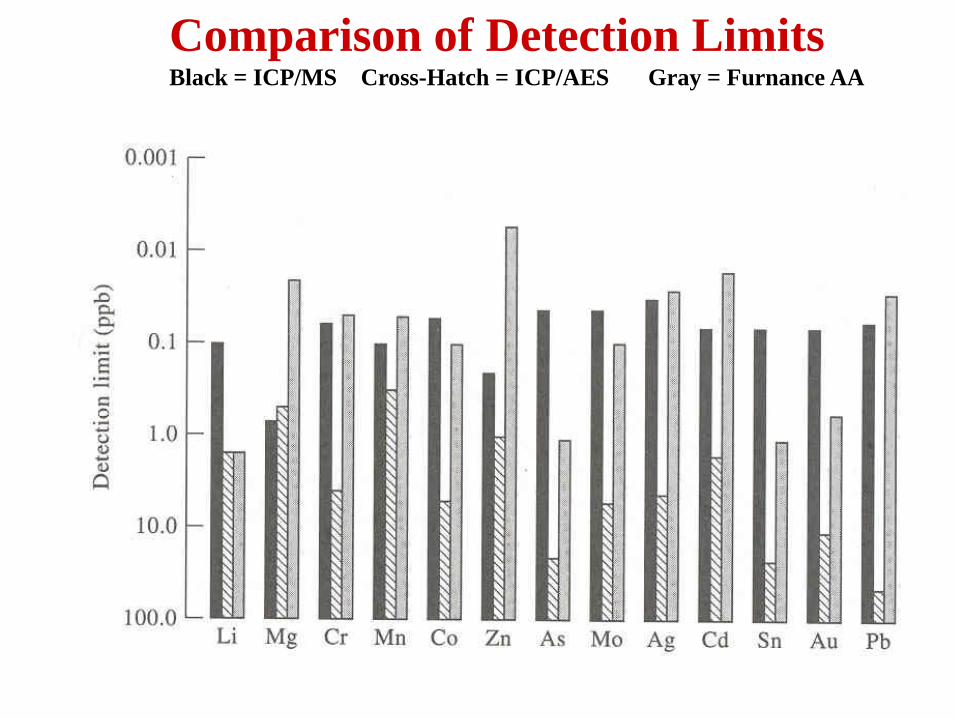
Comparison of Detection Limits Black = ICP/MS Cross-Hatch = ICP/AES Gray = Furnance AA
124
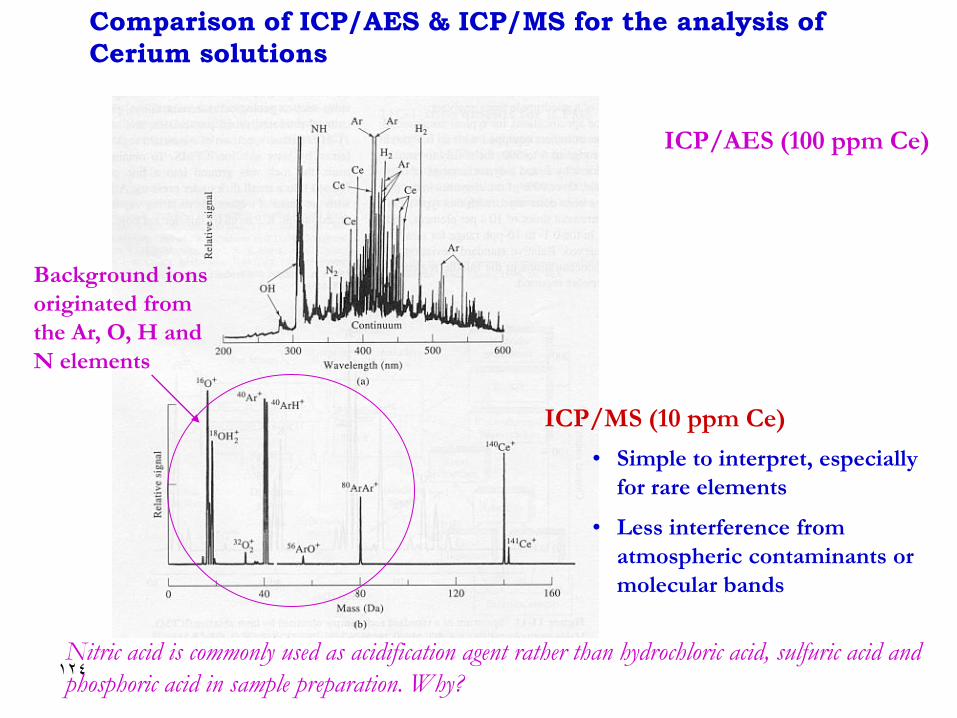
Comparison of ICP/AES & ICP/MS for the analysis of
Cerium solutions
ICP/AES (100 ppm Ce)
ICP/MS (10 ppm Ce)
• Simple to interpret, especially
for rare elements
• Less interference from
atmospheric contaminants or
molecular bands
Background ions
originated from
the Ar, O, H and
N elements
Nitric acid is commonly used as acidification agent rather than hydrochloric acid, sulfuric acid and
phosphoric acid in sample preparation. Why?

125
• Formation of monocationic ions, doubly-charged ions
and stable metal oxides ions in the torch depends on
the identity of the element and several experimental
conditions, such as the plasma r.f. power and the
nebulizer gas flow rate.
• Spectroscopic interference:
1. Isobaric Interference
- isotopes of different elements (or isobaric interference) e.g. 87Rb+ and 87Sr+; 40Ar+ and 40Ca+; 58Ni+ and 58Fe+
Limitations for ICP/MS Quantitation

126
– Polyatomic Ion Interference
• interactions between species in the plasma and species in the matrix or atmosphere, e.g. molecular ions from the acids of digestion
• e.g. ClO+ and 51V+
Which element(s) does not have isobaric interference caused by the presence of other elements?
127
• Matrix effect:
(a)Limited tolerance for salt concentration
(< 1% is acceptable but < 0.1% is preferred!)
– The deposition of salts leads to a decrease in the aperture diameter, so the sensitivity worsens and the signal gradually decreases as a function of time
(b)Organic solvents tend to quench the plasma
torch
128
Approaches to reduce the occurrence of
polyatomic interferences
• Adjust the plasma conditions to minimize the formation of
polyatomic species
e.g. use 5-10% N2 in Ar, the axial temperature of the plasma increases by ~ 1000 K and the electron density increases by 30%. A marked reduction of MO+ ions
• Minimizing the amount of water vapor introduced into the
plasma in order to limit the signal intensity of oxygen-
containing species
e.g. reduce the spray chamber temperature(?)
• Use He instead of Ar as plasma gas to avoid interference from
polyatomic ions containing argon
• Use electrothermal volatilization for sample introduction
• Use high resolution ICP/MS
129
Approaches to correct for or overcome
matrix effect • Dilution
• Matrix matching
• Use of internal standards
– Addition of a known and preferably an equal concentration of an internal standard to all samples (& standards). The analytical signal is taken as the ratio of the signals for the analyte elements in the sample (& standards) and the signal for the internal standard
• Standard addition
– A known amount of the element(s) of interest is added to the sample and hence suffers the same matrix effect as the analyte