Embed Size (px)
Citation preview
Wet and dry African dust episodes over eastern Spain
M. Escudero,1,2 S. Castillo,1 X. Querol,1 A. Avila,2 M. Alarcon,3 M. M. Viana,1
A. Alastuey,1 E. Cuevas,4 and S. Rodrıguez1
Received 3 March 2004; revised 10 May 2004; accepted 23 June 2004; published 26 April 2005.
[1] The impact of the African dust on levels of atmospheric suspended particulate matter(SPM) and on wet deposition was evaluated in eastern Iberia for the period 1996–2002.An effort was made to compile both the SPM and wet episodes. To this end, the timeseries of levels of TSP and PM10 in Levantine air quality monitoring stations wereevaluated and complemented with the computation of back trajectories, satellite images,and meteorological analysis. Wet deposition frequency was obtained from weeklycollected precipitation data at a rural background station in which the African chemicalsignature was identified (mainly pH and Ca2+ concentrations). A number of Africandust episodes (112) were identified (16 episodes per year). In 93 out of the112 (13 episodes per year) the African dust influence caused high SPM levels. In 49 outof 112 (7 episodes per year), wet deposition was detected, and the chemistry wasinfluenced by dust. There is a clear seasonal trend with higher frequency of dust outbreaksin May-August, with second modes in March and October. Wet events followed a differentpattern, with a marked maximum in May. Except for one event, December was devoidof African air mass intrusions. On the basis of seasonal meteorological patterns affectingthe Iberian Peninsula, an interpretation of the meteorological scenarios causing Africandust transport over Iberia was carried out. Four scenarios were identified with a clearseasonal trend. The impact of the different dust outbreak scenarios on the levels ofPM10 recorded at a rural site (Monagrega, Teruel, Spain) in the period 1996–2002 wasalso evaluated.
Citation: Escudero, M., S. Castillo, X. Querol, A. Avila, M. Alarcon, M. M. Viana, A. Alastuey, E. Cuevas, and S. Rodrıguez (2005),
Wet and dry African dust episodes over eastern Spain, J. Geophys. Res., 110, D18S08, doi:10.1029/2004JD004731.
1. Introduction
[2] Mineral dust may influence the atmospheric radiationbalance through scattering and absorption processes[Tegen et al., 1997; Haywood and Boucher, 2000;Harrison et al., 2001; Sokolik et al., 2001; Arimoto, 2001;Intergovernmental Panel on Climate Change, 2001]. Cloudnucleation may also be highly influenced by mineral dust[Levin et al., 1996].[3] In addition to its effects on climate, mineral dust
may have an important incidence on levels of suspendedparticulate matter (SPM) recorded in air quality monitoringnetworks. This is especially relevant in southern Europe[Querol et al., 1998, 2004; Rodrıguez et al., 2001] and insome Atlantic islands [Prospero and Ness, 1986; Coude-Gaussen et al., 1987; Savoie et al., 1987; Bergametti et
al., 1989a; Savoie et al., 1992; Prospero et al., 1995;Chiapello et al., 1995; Arimoto et al., 1997; Caquineau etal., 1998; Viana et al., 2002]. Furthermore, the mineraldust deposition largely influences deposition fluxes ofmetal nutrients in southern Europe [Ganor and Mamane,1982; Sequeira, 1982; Loye-Pilot et al., 1986; Samara etal., 1992; Camarero and Catalan, 1993; Roda et al., 1993;Guerzoni et al., 1995; Avila, 1996; Alastuey et al., 1999;Avila and Alarcon, 1999; Avila and Roda, 2002] and oceanregions [Falkowski et al., 1998; Fung et al., 2000;Arimoto, 2001].[4] North African dust is injected into the atmosphere
through resuspension processes at the source areas, and it isthen transported at different altitudes (from sea level up to4–6 km). On the basis of a recent evaluation of mineral dustsources from northern Africa [Prospero et al., 2002], it canbe concluded that the maximum dust transport occurs insummer when large quantities of dust are carried acrossthe Mediterranean basin to Europe and the Middle East[Bergametti et al., 1989b; Dayan et al., 1991; Dulac et al.,1992; Chester et al., 1993; Molinaroli et al., 1993;Guerzoni et al., 1997; Moulin et al., 1997; Avila et al.,1997, 1998; Avila and Alarcon, 1999; Moulin et al., 1998;Querol et al., 1998; Rodrıguez et al., 2001; Ryall et al.,2002] and across the Atlantic ocean to the Caribbean[Prospero and Nees, 1986; Coude-Gaussen et al., 1987;
JOURNAL OF GEOPHYSICAL RESEARCH, VOL. 110, D18S08, doi:10.1029/2004JD004731, 2005
1Institute of Earth Sciences ‘‘Jaume Almera,’’ Consejo Superior deInvestigaciones Cientıficas, Barcelona, Spain.
2Centre for Ecological Research and Forestry Applications, Autono-mous University of Barcelona, Barcelona, Spain.
3Department of Physics and Nuclear Engineering, Polytechnic Uni-versity of Catalonia, Barcelona, Spain.
4Izana Atmospheric Observatory, Instituto Nacional de Meteorologia,Santa Cruz de Tenerife, Spain.
Copyright 2005 by the American Geophysical Union.0148-0227/05/2004JD004731
D18S08 1 of 15
Bergametti et al., 1989a, 1989b; Prospero et al., 1995], thesoutheastern United States [Perry et al., 1997; Prospero,1999], and the midlatitude western North Atlantic[Arimoto et al., 1995]. In winter, there is also considerabletransport when large quantities of dust are carried towardSouth America [Prospero and Carlson, 1981; Swap et al.,1992] and sporadically to western Europe [Querol et al.,2002].[5] The low precipitation in the Mediterranean basin
favors the long residence time of PM in the atmospherewith the consequent impact on air quality. Furthermore, aturban sites, from 25 to 60% exceedances of the PM10 dailylimit value established by the 1999/30/CE European direc-tive (50 mg PM10/m3) in Spain have been attributed to dustoutbreaks [Querol et al., 2004]. Although many studieshave dealt independently with African episodes influencingbulk deposition and levels of ambient SPM in Spain (seereferences above), to our knowledge, none of them haveconsidered wet deposition and suspended particulate matterto investigate such dust outbreaks over Spain.[6] Given that most African events accompanied by rain
episodes lead to a decrease in the levels of SPM, studies ononly SPM levels would not detect the occurrence of such‘‘wet episodes.’’ By contrast, in the case of weekly sam-plings of wet deposition, ‘‘dry events’’ may result in thedeposition of African dust, which could be attributed to asubsequent or prior rain episode. On the basis of theinformation from time series of both chemistry of wetdeposition and daily levels of SPM, an accurate study ofthe occurrence of these African events affecting easternIberia is carried out. This study seeks to carry out astatistical and a meteorological analysis of the occurrenceand seasonal distribution of African dust outbreaks over theeastern Iberian Peninsula for the period 1996–2002.
2. Methodology
2.1. High SPM Events
[7] In order to study the impact of African dust outbreakson ambient SPM levels, 1996–2002 time series of levels ofTSP and PM10 (total suspended particles, and suspended
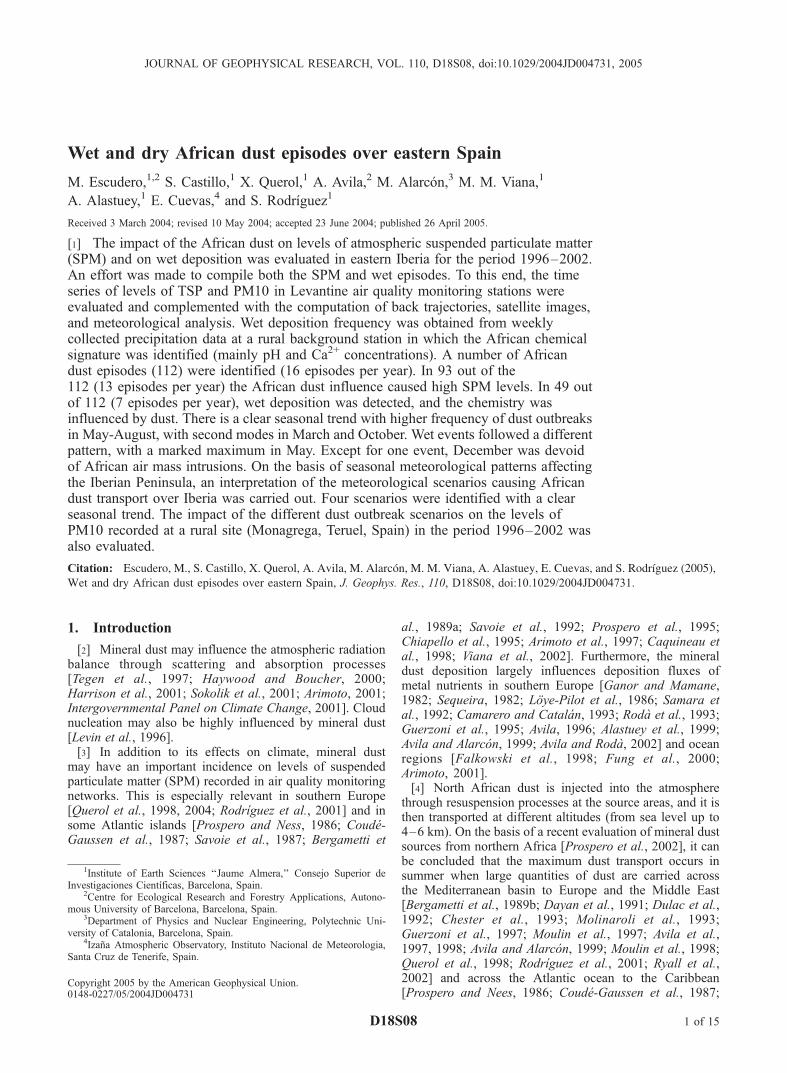
particles <10 mm, respectively) from 18 air quality moni-toring stations from the eastern Iberian Peninsula (from theAutonomous Governments of Catalonia and Valencia, andone station belonging to ENDESA) were selected. Selectioncriteria were based on data availability, geographical loca-tion, pollution level, and type of emission sources influenc-ing the monitoring stations. TSP and PM10 time series werethen intercorrelated, showing that nine of them exhibitedparallel trends for the selected period. Consequently, ninestations (Monagrega, Morella, Coratxar, Hospitalet, Igua-lada, Sagrera, Fornells, Penyeta, and Onda, Figure 1) werefinally chosen for this study. The Monagrega rural stationwas chosen to represent regional background levels becauseof its location (rural area in the Calanda desert in thesemiarid Ebro basin), far from the direct influence ofanthropogenic emissions.[8] TSP measurements were carried out by the Beta
attenuation method (FAG and Dasibi instruments) at allsites, with the exception of Monagrega where measure-ments of PM10 were performed with TEOM (oscillatingmicrobalance method) instrumentation. PM10 real-timeTEOM measurements were validated by means of acomparison with DIGITEL DH-80 gravimetric equipmentfor 143 measurement days. A relation of TEOM = 1.01 �DIGITEL with R2 = 0.85 was found for spring, summerand autumn, whereas for winter the relation was TEOM =0.68 � DIGITEL with R2 = 0.57. This results in anunderestimation of PM10 mass in winter of 32% due to theloss of species (such as NH4NO3 and specific semivolatileorganic compounds) due to the difference of temperaturebetween ambient conditions and the heated inlet (50�C toprevent water condensation). However, for African eventsthis loss of material is not expected to be relevant becauseof the major mineral composition of PM10 in these events.[9] After identifying a number of simultaneously
recorded concentration peaks in the TSP and PM10 timeseries, the possible attribution to an African dust episodeand the transport mechanisms which generate it wereinvestigated by means of the evaluation of Total OzoneMapping Spectrometer ((TOMS) NASA aerosol index maps[Herman et al., 1997]; SKIRON and Navy Aerosol Anal-ysis and Prediction System (NAAPs) aerosol maps providedby the University of Athens [Kallos et al., 1997] and theNaval Research Laboratory (http://www.nrlmry.navy.mil/aerosol/), respectively; meteorological charts by NationalCenters for Environmental Prediction (NCEP) ClimateDiagnostics Center (http://www.cdc.noaa.gov/Composites/Hour/) and the NOAA Air Resources Laboratory (http://www.arl.noaa.gov/ready/amet.html); and satellite imagerysupplied by NASA Sea-viewing Wide Field-of-view Sensor(SeaWIFS) [McClain et al., 1998]. Moreover, back trajec-tories were calculated daily with the HYSPLIT model[Draxler and Rolph, 2003] in order to interpret the differentsource regions of the air masses reaching the study area. Tothis end, 5-day isentropic back trajectories at three differentaltitudes (1500, 3000, and 4500 masl) were obtained foreach day of the study period.
2.2. Wet Deposition Events
[10] Data on the chemical composition of bulk deposi-tion were used to identify wet African episodes. To thisend, sampling was carried out at La Castanya (Montseny,
Figure 1. Location of the stations measuring levels ofatmospheric suspended particles (SPM), and the Montseny(La Castanya and Santa Marıa de Palautordera) for wetdeposition sampling.
D18S08 ESCUDERO ET AL.: AFRICAN DUST EPISODES OVER EASTERN SPAIN
2 of 15
D18S08
Barcelona, 41�460N, 02�210E, 700 m above sea level (masl))from January 1996 to the end of September 2000 and at anearby station at the base of the Montseny Mountains (SantaMaria de Palautordera, 41�410N, 02�270E, 200 masl, 7 kmfrom La Castanya in a southern direction) from October2000 to December 2002. Precipitation for analysis wascollected on a weekly basis in an open bulk depositioncollector (placed 1.5 m above the ground) which consistedof a 19-cm diameter-polyethylene funnel connected byTygon tubing to a 10-L polyethylene bottle. A clean nylonsieve was placed in the neck of the funnel to prevent samplecontamination from insects or particle debris. The bottleswere lined with a dark cover to avoid light-induced alter-ations of collected water. In each sampling, the collector wasretrieved and replaced by one cleaned in the laboratory(washed with deionized distilled water). After sampling, therainwater was taken to the laboratory where conductivity,
pH, and alkalinity were measured in unfiltered samples.Then, samples were filtered through 0.45-mm pore sizeMillipore filters and deep frozen for further analyses ofthe major ions (Na+, K+, Ca2+, Mg2+, NH4
+, SO42�, NO3
� andCl�). The pH was measured with an Orion pH meter withpH electrodes for low ionic strength solutions. Alkalinitywas measured by Gran titration. Concentrations of basecations in the filtered rainwater were determined by atomicabsorption spectrometry (AAS). Soluble anions were deter-mined by ion chromatography and ammonium by flowinjection analysis and gas diffusion. The quality of datawas verified by two methods: (1) a cation–anion balanceand (2) the comparison of the measured electric conductivitywith the conductivity calculated from the concentration ofall ions and their specific conductivity.[11] African wet episodes were defined as rainfall events
that gave a reddish brownish color to the rainwater filters.
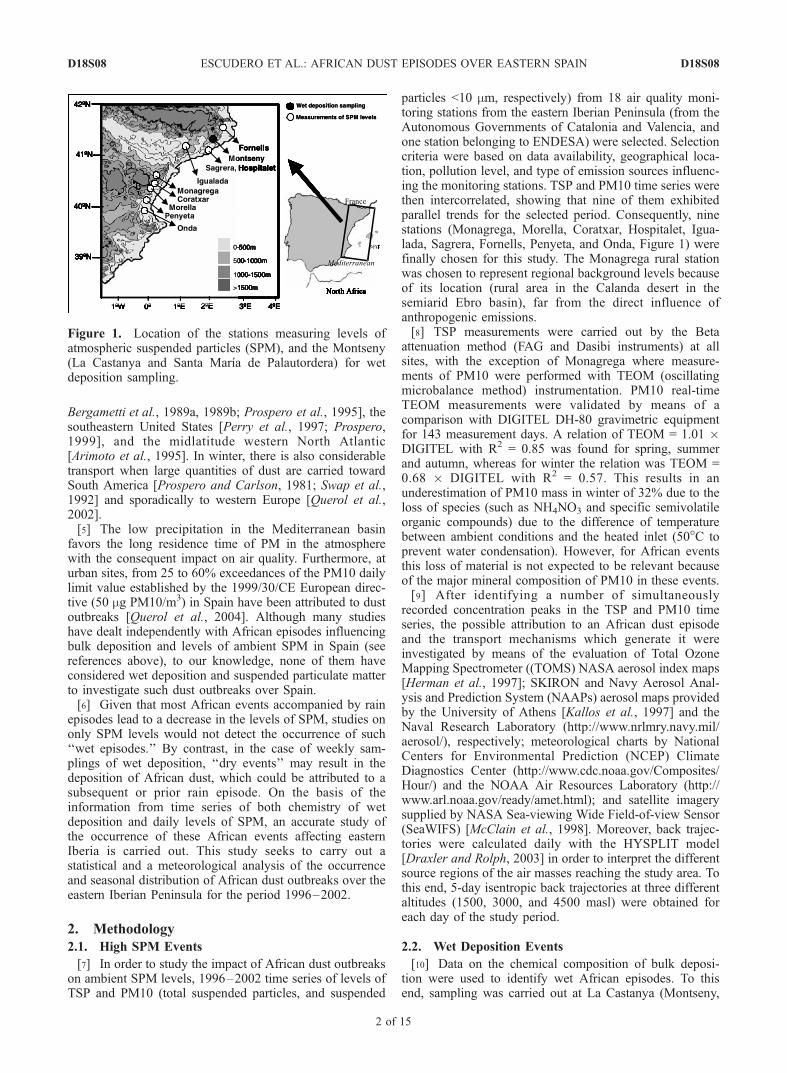
Figure 2. Occurrence of African dust outbreaks over eastern Iberian Peninsula for 1996–2002.Episodes occurring simultaneously with precipitation are highlighted.
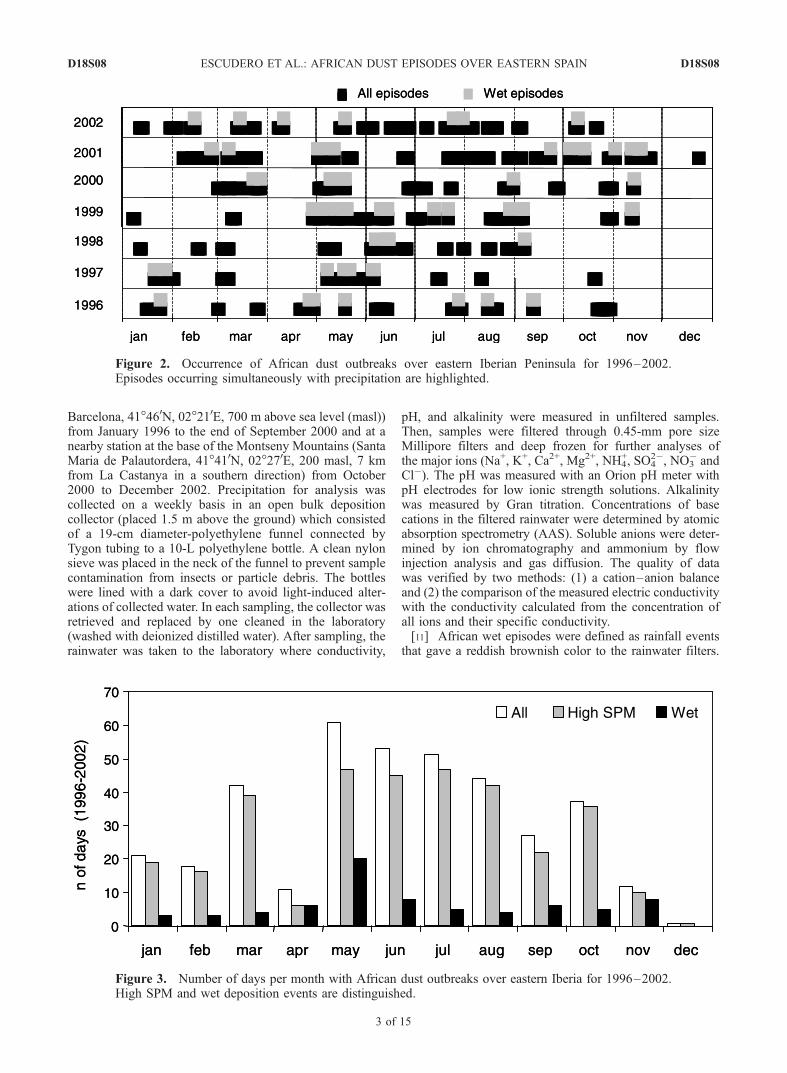
Figure 3. Number of days per month with African dust outbreaks over eastern Iberia for 1996–2002.High SPM and wet deposition events are distinguished.
D18S08 ESCUDERO ET AL.: AFRICAN DUST EPISODES OVER EASTERN SPAIN
3 of 15
D18S08
These events are known as red rains for this reason. Thechemistry of these episodes is characterized by very highpH and high concentration of Ca+2 [Avila and Alarcon,2003]. The African episodes had pH > 6 and [Ca+2] >80 meq/L. The identification of African events was con-firmed by means of back trajectory analysis using the aboveprocedure. Given that the sampling was carried out on aweekly basis, the identification of the exact dates of theAfrican rain episode was obtained from the precipitationrecords of the La Castanya station and from the Santa Marıade Palautordera (the latter belonging to the meteorologicalservice of Catalonia, Meteocat).[12] Once the time series of wet deposition and high SPM
events influenced by African episodes were obtained, thesewere combined to create a time series of dust outbreaks. Themeteorological scenarios causing these episodes, the dura-tion, the seasonal trends, and the levels of SPM recorded inregional background sites were then investigated.[13] In addition to the above procedure, a determination
of the meteorological scenarios causing the African dustoutbreaks over Spain was carried out. To this end, each dustevent was studied using three parameters: (1) geopotentialheight for 850, (2) geopotential height for 700 hPa, and(3) mean sea level pressure (MSLP). The data files wereobtained from the NOAA Air Research Laboratory. TheAfrican dust outbreaks occurred under certain synopticscenarios. Following the classification of events, geopoten-tial height and MSLP data were averaged and plotted usingthe data of the first day of each dust episode. Thus anaverage map was obtained for each scenario.
3. Results and Discussion
[14] Results from back trajectory analysis showed that forthe period 1996–2002 in eastern Iberia, around 53% of thedays were influenced by Atlantic advective flows, relativelylow percentages when compared with northwestern Iberia(86% of the days [Querol et al., 2004]). However, in 15% ofthe days the African air masses reached the eastern regionsand only 5% the northwestern regions. Another importantdifference is the high annual percentage of atmosphericregional recirculation episodes [Millan et al., 1997] andEuropean (including Mediterranean) transport episodes in
the eastern regions (12 and 20%, respectively) when com-pared with the northwestern areas (<1 and 9% of the days,respectively).
3.1. Occurrence of African Episodes
[15] During the period 1996–2002, 112 African dustepisodes were identified accounting for a total of 378 days,with a mean duration of 3.3 days per episode. This representsa mean of 16 episodes per year and that 15% of the days theAfrican dust reached eastern Iberia. The mean monthlyoccurrence for the study period is 4.5 days per month.[16] In 93 out of the 112 episodes (330 days, with a mean
of 3.6 days per episode) an impact on levels of SPM in theair quality monitoring stations was detected. This representsa mean of 13.3 episodes per year and that in 13% of thedays the African dust influenced the levels of SPM ineastern Iberia. The mean monthly occurrence for the studyperiod is 3.9 days per month.[17] In 49 out of 112 episodes (72 days, with a mean of
1.4 days per episode) wet deposition occurred simulta-neously with African events. This represents a mean of7 episodes per year (3% of the days). The mean monthlyoccurrence for the study period is 0.8 days per month. Itshould be pointed out that the total number of episodesdiffers from the addition of SPM and wet episodes sincesome of the episodes included days during which SPMlevels were influenced by dust outbreaks and, simulta-neously, wet dust deposition.[18] The highest number of episodes was recorded in 2001
(26) and the lowest in 1997 and 1998 (12). The number ofevents with influence on SPM events reached its maximumin 2001 (26) and its minimum in 1999 (11). As regards thewet events, the maximum amount of episodes was recordedin 1999 (11) and the minimum in 1998 (3).[19] The highest number of days with African episode
was recorded in 2001 (77 days), the lowest number of dayswas recorded in 1997 (32). The number of high SPM eventsreached to its maximum in 2001 (75) and to its minimum in1997 (26). The number of days with wet African event wasmaximum in 1999 (19) and minimum in 1998 (4). Further-more, in the last two years of the record a higher number ofepisodes and days were recorded. This can be due toincreasing dust emission in the source areas or to a more
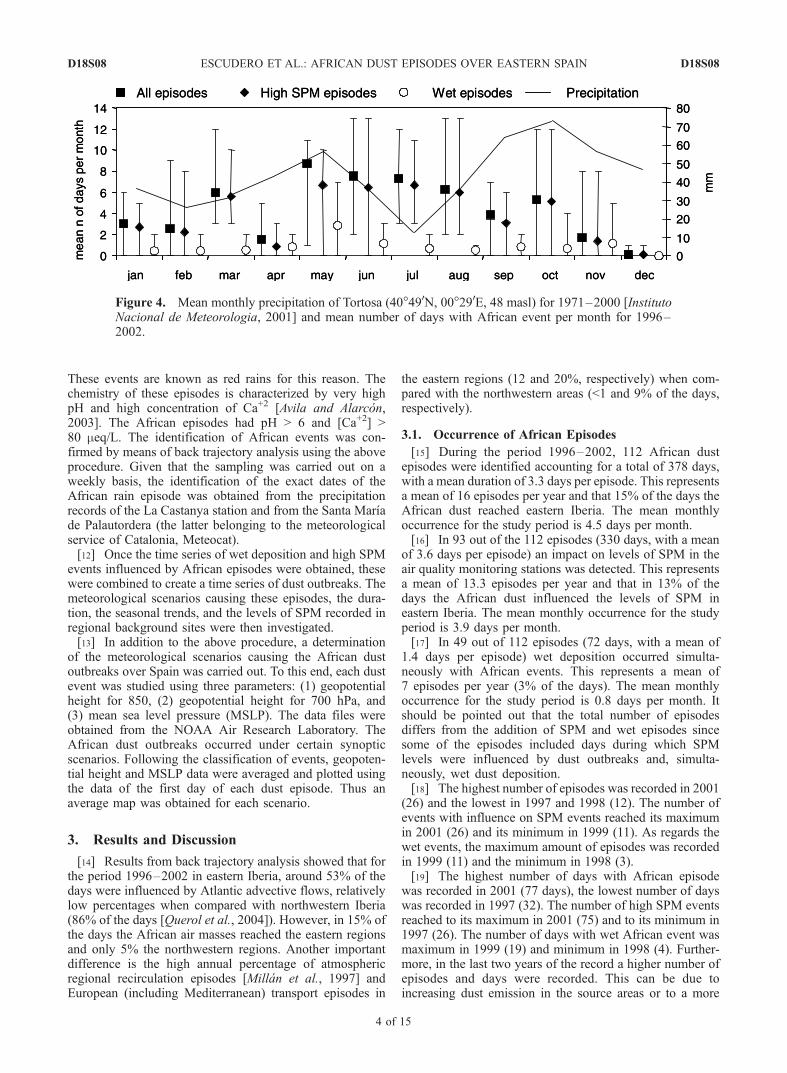
Figure 4. Mean monthly precipitation of Tortosa (40�490N, 00�290E, 48 masl) for 1971–2000 [InstitutoNacional de Meteorologia, 2001] and mean number of days with African event per month for 1996–2002.
D18S08 ESCUDERO ET AL.: AFRICAN DUST EPISODES OVER EASTERN SPAIN
4 of 15
D18S08
frequent occurrence of transport situations. However, thenumber of tools that were available for the detection of dustepisodes was superior in the last years than in the first yearsof the period 1996–2002, this allowed the detection of moredust events. This can be reflected in the number of episodesrecorded for this study.[20] The monthly distribution of African episodes is
characterized by three modes with a clear prevalence of theperiod May to August (Figures 2–4). In particular, the periodMay-August has the highest mean number of days per month(from 6.3 to 8.7 days), followed by March and October (with6.0 and 5.3 days per month, respectively), whereas thelowest monthly occurrences are recorded for December,November, and April (with 0.2, 1.7, and 1.6 days per month).It is noticeable that in March, May, June, July, and August,dust events are always present, while in December only onedust invasion day was recorded in the whole study period(1996–2002). The above seasonal pattern of the Africanepisodes is clearly dominated by the SPM (nonwet) episodesgiven that the same trend described is shown. Wet eventsonly showed relatively higher monthly frequency in May(with 2.9 days per month).
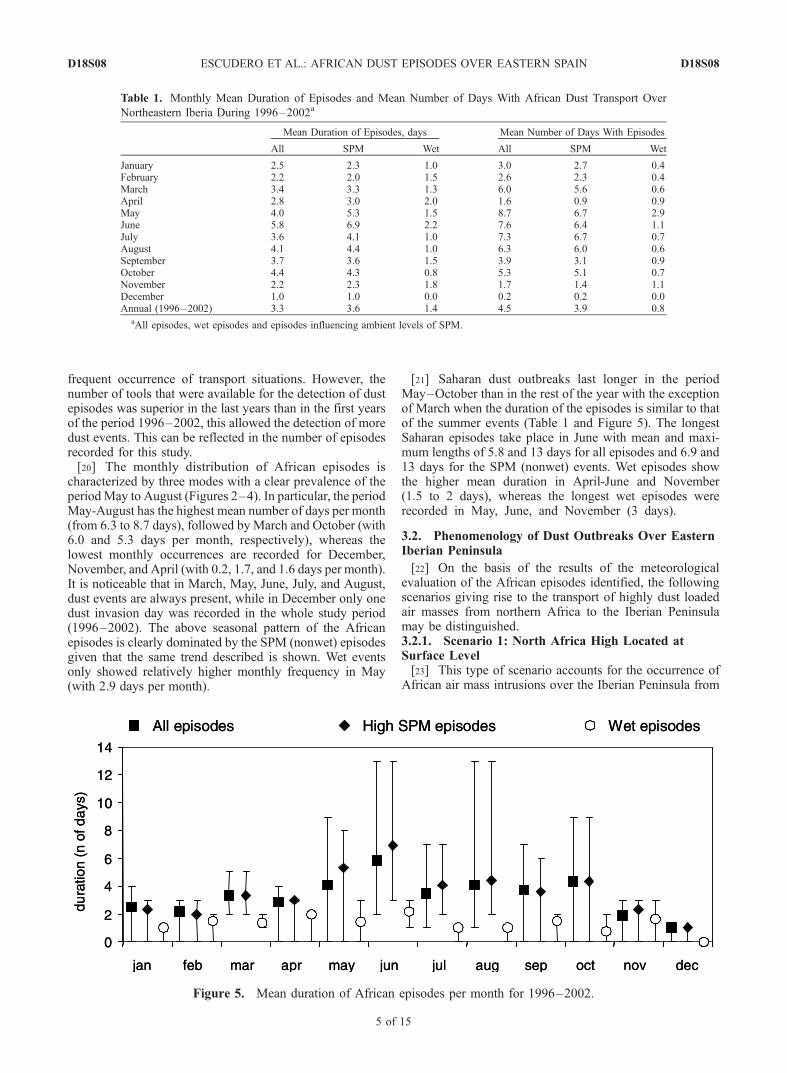
[21] Saharan dust outbreaks last longer in the periodMay–October than in the rest of the year with the exceptionof March when the duration of the episodes is similar to thatof the summer events (Table 1 and Figure 5). The longestSaharan episodes take place in June with mean and maxi-mum lengths of 5.8 and 13 days for all episodes and 6.9 and13 days for the SPM (nonwet) events. Wet episodes showthe higher mean duration in April-June and November(1.5 to 2 days), whereas the longest wet episodes wererecorded in May, June, and November (3 days).
3.2. Phenomenology of Dust Outbreaks Over EasternIberian Peninsula
[22] On the basis of the results of the meteorologicalevaluation of the African episodes identified, the followingscenarios giving rise to the transport of highly dust loadedair masses from northern Africa to the Iberian Peninsulamay be distinguished.3.2.1. Scenario 1: North Africa High Located atSurface Level[23] This type of scenario accounts for the occurrence of
African air mass intrusions over the Iberian Peninsula from
Table 1. Monthly Mean Duration of Episodes and Mean Number of Days With African Dust Transport Over
Northeastern Iberia During 1996–2002a
Mean Duration of Episodes, days Mean Number of Days With Episodes
All SPM Wet All SPM Wet
January 2.5 2.3 1.0 3.0 2.7 0.4February 2.2 2.0 1.5 2.6 2.3 0.4March 3.4 3.3 1.3 6.0 5.6 0.6April 2.8 3.0 2.0 1.6 0.9 0.9May 4.0 5.3 1.5 8.7 6.7 2.9June 5.8 6.9 2.2 7.6 6.4 1.1July 3.6 4.1 1.0 7.3 6.7 0.7August 4.1 4.4 1.0 6.3 6.0 0.6September 3.7 3.6 1.5 3.9 3.1 0.9October 4.4 4.3 0.8 5.3 5.1 0.7November 2.2 2.3 1.8 1.7 1.4 1.1December 1.0 1.0 0.0 0.2 0.2 0.0Annual (1996–2002) 3.3 3.6 1.4 4.5 3.9 0.8
aAll episodes, wet episodes and episodes influencing ambient levels of SPM.
Figure 5. Mean duration of African episodes per month for 1996–2002.
D18S08 ESCUDERO ET AL.: AFRICAN DUST EPISODES OVER EASTERN SPAIN
5 of 15
D18S08
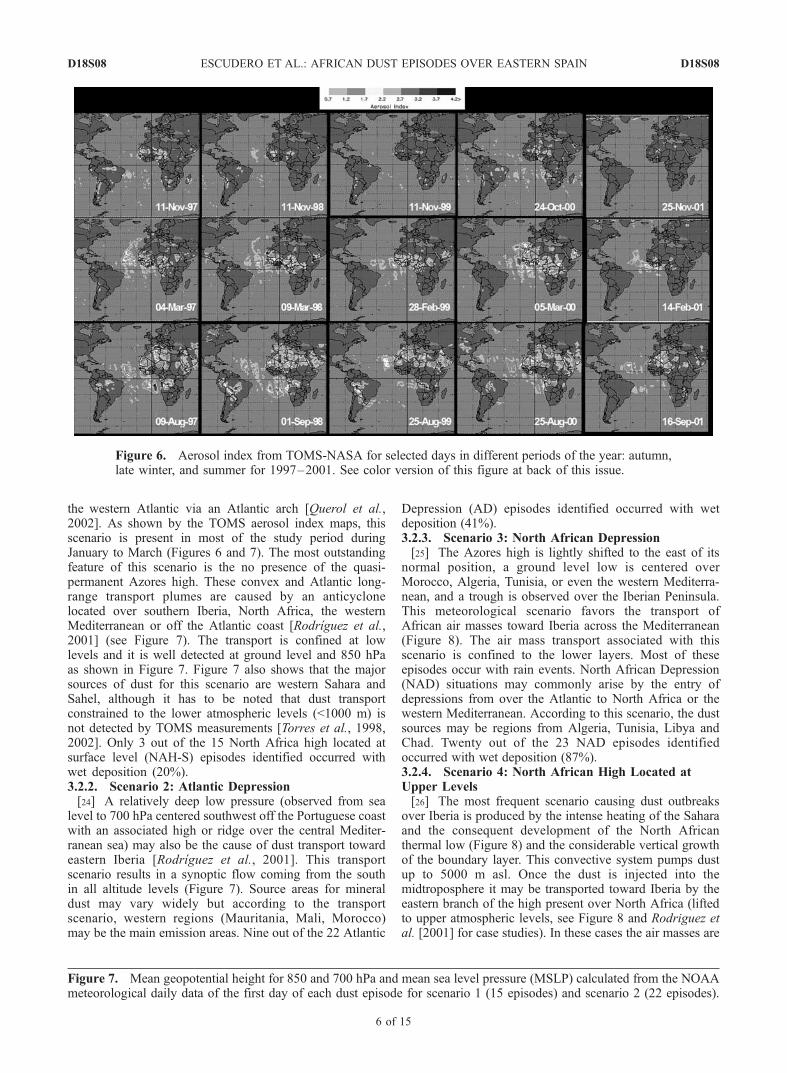
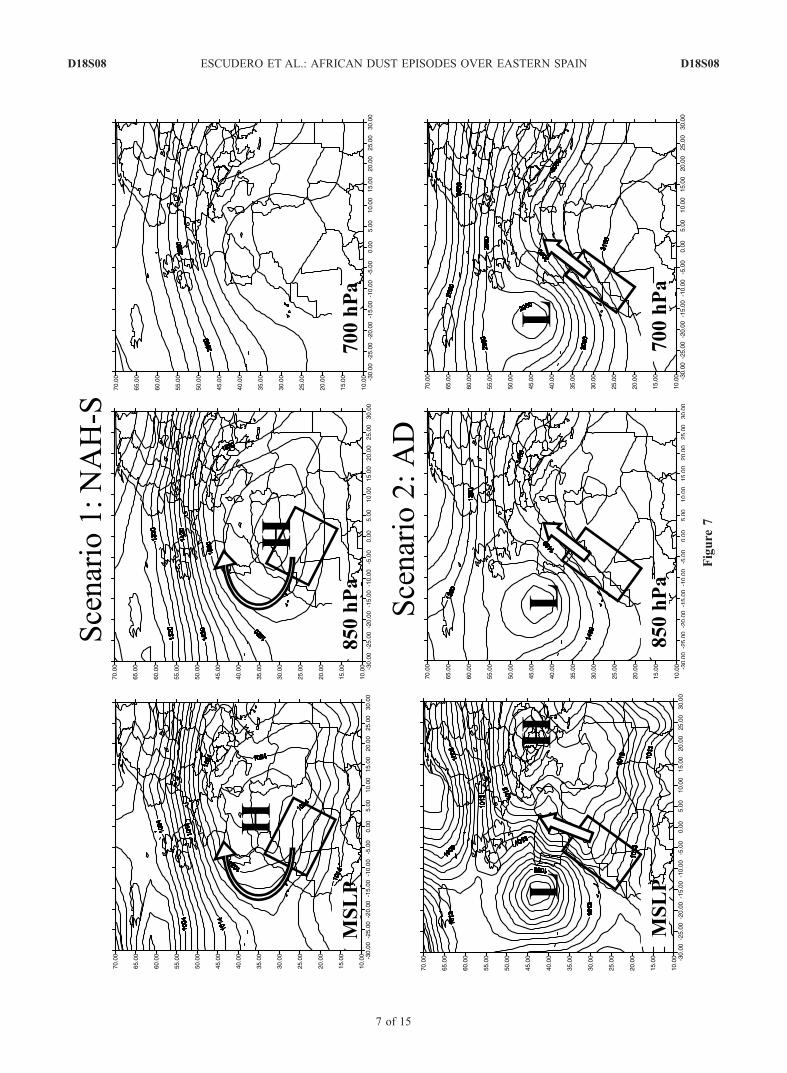
the western Atlantic via an Atlantic arch [Querol et al.,2002]. As shown by the TOMS aerosol index maps, thisscenario is present in most of the study period duringJanuary to March (Figures 6 and 7). The most outstandingfeature of this scenario is the no presence of the quasi-permanent Azores high. These convex and Atlantic long-range transport plumes are caused by an anticyclonelocated over southern Iberia, North Africa, the westernMediterranean or off the Atlantic coast [Rodrıguez et al.,2001] (see Figure 7). The transport is confined at lowlevels and it is well detected at ground level and 850 hPaas shown in Figure 7. Figure 7 also shows that the majorsources of dust for this scenario are western Sahara andSahel, although it has to be noted that dust transportconstrained to the lower atmospheric levels (<1000 m) isnot detected by TOMS measurements [Torres et al., 1998,2002]. Only 3 out of the 15 North Africa high located atsurface level (NAH-S) episodes identified occurred withwet deposition (20%).3.2.2. Scenario 2: Atlantic Depression[24] A relatively deep low pressure (observed from sea
level to 700 hPa centered southwest off the Portuguese coastwith an associated high or ridge over the central Mediter-ranean sea) may also be the cause of dust transport towardeastern Iberia [Rodrıguez et al., 2001]. This transportscenario results in a synoptic flow coming from the southin all altitude levels (Figure 7). Source areas for mineraldust may vary widely but according to the transportscenario, western regions (Mauritania, Mali, Morocco)may be the main emission areas. Nine out of the 22 Atlantic
Depression (AD) episodes identified occurred with wetdeposition (41%).3.2.3. Scenario 3: North African Depression[25] The Azores high is lightly shifted to the east of its
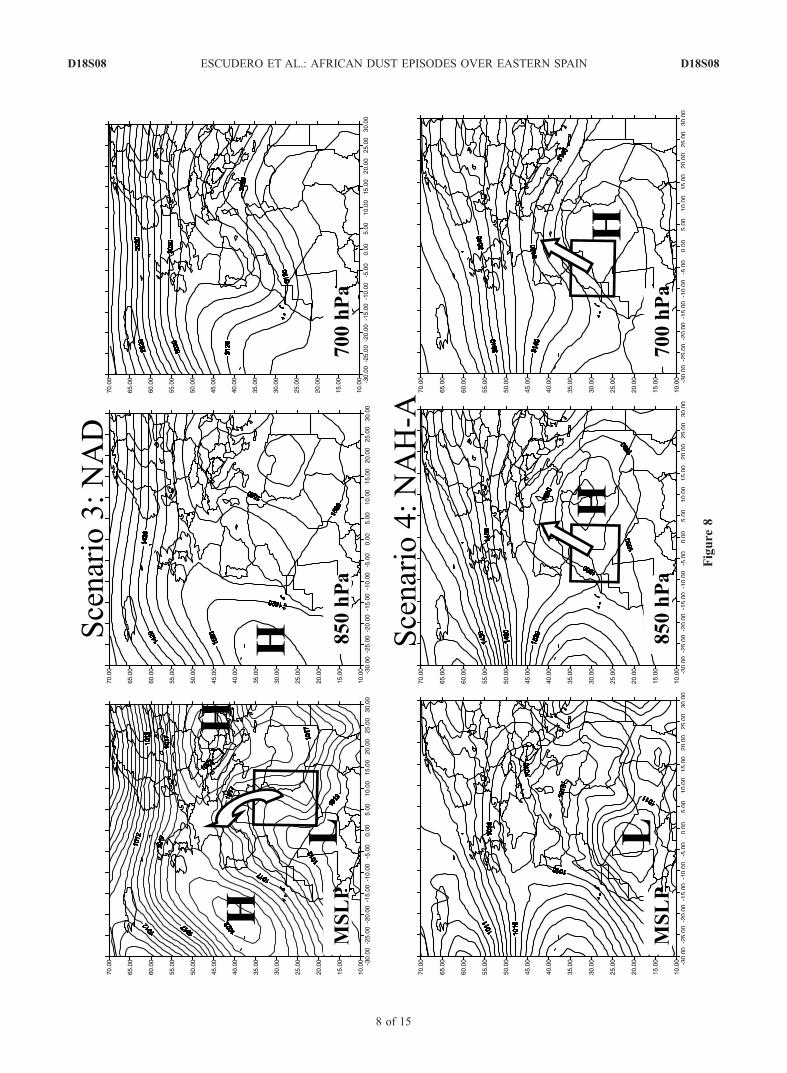
normal position, a ground level low is centered overMorocco, Algeria, Tunisia, or even the western Mediterra-nean, and a trough is observed over the Iberian Peninsula.This meteorological scenario favors the transport ofAfrican air masses toward Iberia across the Mediterranean(Figure 8). The air mass transport associated with thisscenario is confined to the lower layers. Most of theseepisodes occur with rain events. North African Depression(NAD) situations may commonly arise by the entry ofdepressions from over the Atlantic to North Africa or thewestern Mediterranean. According to this scenario, the dustsources may be regions from Algeria, Tunisia, Libya andChad. Twenty out of the 23 NAD episodes identifiedoccurred with wet deposition (87%).3.2.4. Scenario 4: North African High Located atUpper Levels[26] The most frequent scenario causing dust outbreaks
over Iberia is produced by the intense heating of the Saharaand the consequent development of the North Africanthermal low (Figure 8) and the considerable vertical growthof the boundary layer. This convective system pumps dustup to 5000 m asl. Once the dust is injected into themidtroposphere it may be transported toward Iberia by theeastern branch of the high present over North Africa (liftedto upper atmospheric levels, see Figure 8 and Rodriguez etal. [2001] for case studies). In these cases the air masses are
Figure 6. Aerosol index from TOMS-NASA for selected days in different periods of the year: autumn,late winter, and summer for 1997–2001. See color version of this figure at back of this issue.
Figure 7. Mean geopotential height for 850 and 700 hPa and mean sea level pressure (MSLP) calculated from the NOAAmeteorological daily data of the first day of each dust episode for scenario 1 (15 episodes) and scenario 2 (22 episodes).
D18S08 ESCUDERO ET AL.: AFRICAN DUST EPISODES OVER EASTERN SPAIN
6 of 15
D18S08
Figure
7
D18S08 ESCUDERO ET AL.: AFRICAN DUST EPISODES OVER EASTERN SPAIN
7 of 15
D18S08
Figure
8
D18S08 ESCUDERO ET AL.: AFRICAN DUST EPISODES OVER EASTERN SPAIN
8 of 15
D18S08
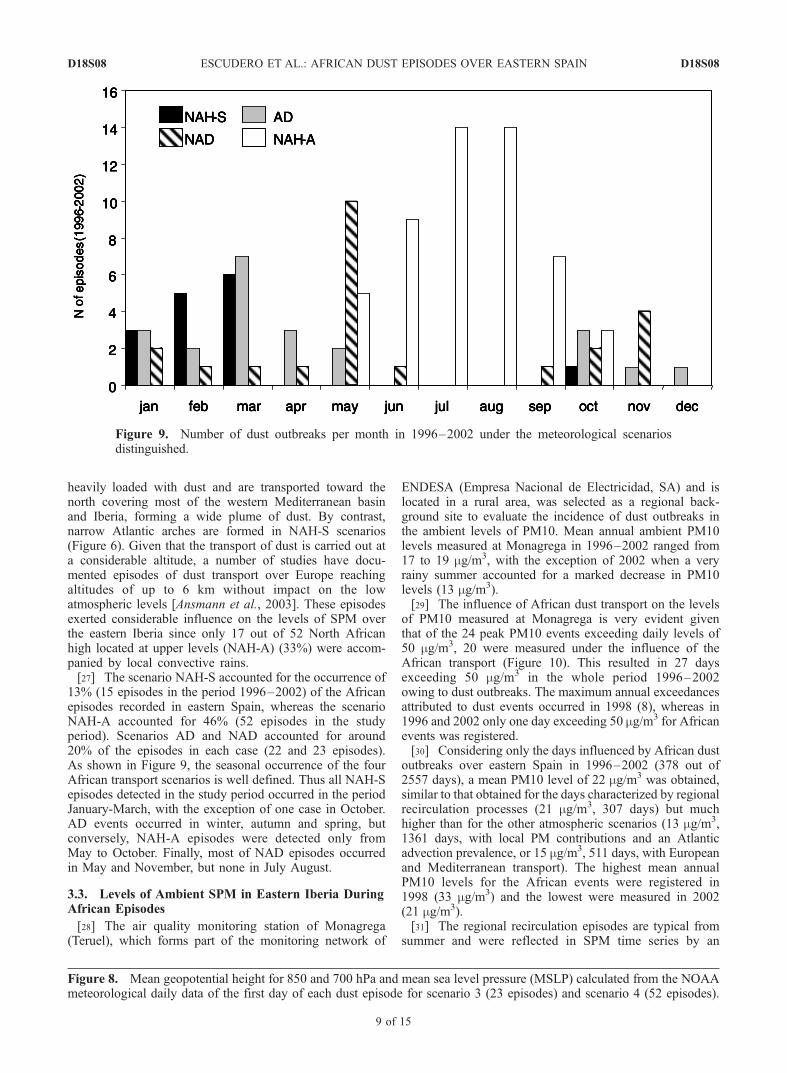
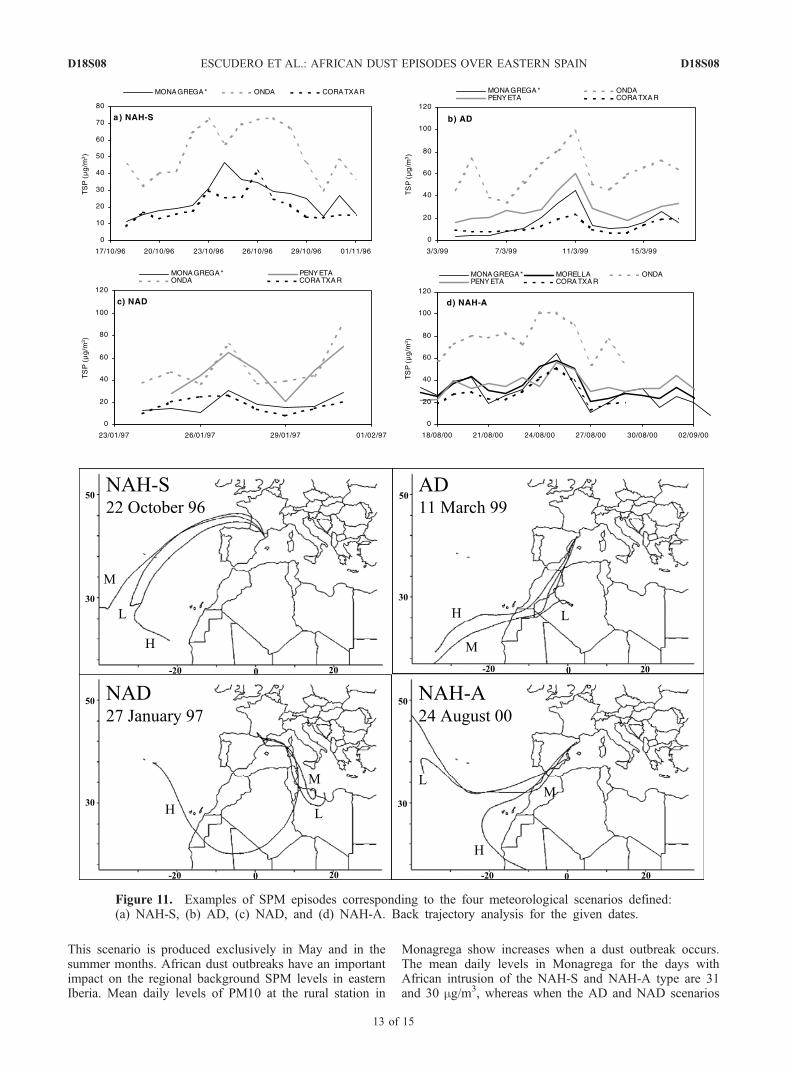
heavily loaded with dust and are transported toward thenorth covering most of the western Mediterranean basinand Iberia, forming a wide plume of dust. By contrast,narrow Atlantic arches are formed in NAH-S scenarios(Figure 6). Given that the transport of dust is carried out ata considerable altitude, a number of studies have docu-mented episodes of dust transport over Europe reachingaltitudes of up to 6 km without impact on the lowatmospheric levels [Ansmann et al., 2003]. These episodesexerted considerable influence on the levels of SPM overthe eastern Iberia since only 17 out of 52 North Africanhigh located at upper levels (NAH-A) (33%) were accom-panied by local convective rains.[27] The scenario NAH-S accounted for the occurrence of
13% (15 episodes in the period 1996–2002) of the Africanepisodes recorded in eastern Spain, whereas the scenarioNAH-A accounted for 46% (52 episodes in the studyperiod). Scenarios AD and NAD accounted for around20% of the episodes in each case (22 and 23 episodes).As shown in Figure 9, the seasonal occurrence of the fourAfrican transport scenarios is well defined. Thus all NAH-Sepisodes detected in the study period occurred in the periodJanuary-March, with the exception of one case in October.AD events occurred in winter, autumn and spring, butconversely, NAH-A episodes were detected only fromMay to October. Finally, most of NAD episodes occurredin May and November, but none in July August.
3.3. Levels of Ambient SPM in Eastern Iberia DuringAfrican Episodes
[28] The air quality monitoring station of Monagrega(Teruel), which forms part of the monitoring network of
ENDESA (Empresa Nacional de Electricidad, SA) and islocated in a rural area, was selected as a regional back-ground site to evaluate the incidence of dust outbreaks inthe ambient levels of PM10. Mean annual ambient PM10levels measured at Monagrega in 1996–2002 ranged from17 to 19 mg/m3, with the exception of 2002 when a veryrainy summer accounted for a marked decrease in PM10levels (13 mg/m3).[29] The influence of African dust transport on the levels
of PM10 measured at Monagrega is very evident giventhat of the 24 peak PM10 events exceeding daily levels of50 mg/m3, 20 were measured under the influence of theAfrican transport (Figure 10). This resulted in 27 daysexceeding 50 mg/m3 in the whole period 1996–2002owing to dust outbreaks. The maximum annual exceedancesattributed to dust events occurred in 1998 (8), whereas in1996 and 2002 only one day exceeding 50 mg/m3 for Africanevents was registered.[30] Considering only the days influenced by African dust
outbreaks over eastern Spain in 1996–2002 (378 out of2557 days), a mean PM10 level of 22 mg/m3 was obtained,similar to that obtained for the days characterized by regionalrecirculation processes (21 mg/m3, 307 days) but muchhigher than for the other atmospheric scenarios (13 mg/m3,1361 days, with local PM contributions and an Atlanticadvection prevalence, or 15 mg/m3, 511 days, with Europeanand Mediterranean transport). The highest mean annualPM10 levels for the African events were registered in1998 (33 mg/m3) and the lowest were measured in 2002(21 mg/m3).[31] The regional recirculation episodes are typical from
summer and were reflected in SPM time series by an
Figure 8. Mean geopotential height for 850 and 700 hPa and mean sea level pressure (MSLP) calculated from the NOAAmeteorological daily data of the first day of each dust episode for scenario 3 (23 episodes) and scenario 4 (52 episodes).
Figure 9. Number of dust outbreaks per month in 1996–2002 under the meteorological scenariosdistinguished.
D18S08 ESCUDERO ET AL.: AFRICAN DUST EPISODES OVER EASTERN SPAIN
9 of 15
D18S08
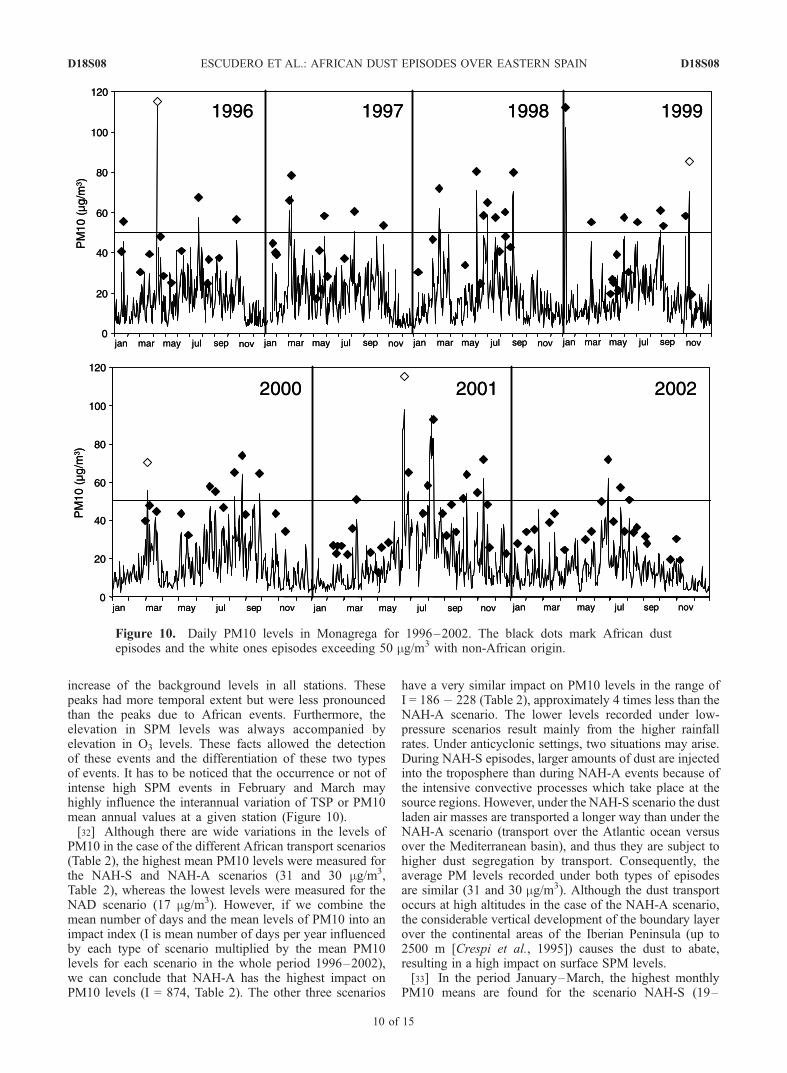
increase of the background levels in all stations. Thesepeaks had more temporal extent but were less pronouncedthan the peaks due to African events. Furthermore, theelevation in SPM levels was always accompanied byelevation in O3 levels. These facts allowed the detectionof these events and the differentiation of these two typesof events. It has to be noticed that the occurrence or not ofintense high SPM events in February and March mayhighly influence the interannual variation of TSP or PM10mean annual values at a given station (Figure 10).[32] Although there are wide variations in the levels of
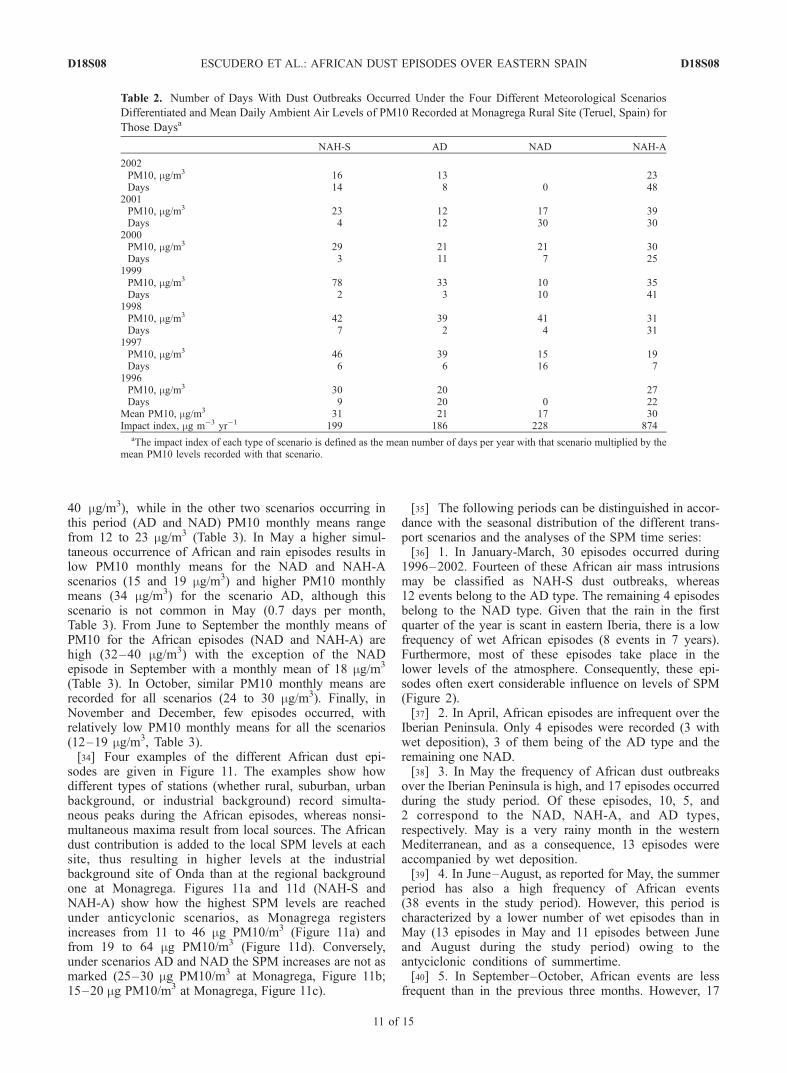
PM10 in the case of the different African transport scenarios(Table 2), the highest mean PM10 levels were measured forthe NAH-S and NAH-A scenarios (31 and 30 mg/m3,Table 2), whereas the lowest levels were measured for theNAD scenario (17 mg/m3). However, if we combine themean number of days and the mean levels of PM10 into animpact index (I is mean number of days per year influencedby each type of scenario multiplied by the mean PM10levels for each scenario in the whole period 1996–2002),we can conclude that NAH-A has the highest impact onPM10 levels (I = 874, Table 2). The other three scenarios
have a very similar impact on PM10 levels in the range ofI = 186 � 228 (Table 2), approximately 4 times less than theNAH-A scenario. The lower levels recorded under low-pressure scenarios result mainly from the higher rainfallrates. Under anticyclonic settings, two situations may arise.During NAH-S episodes, larger amounts of dust are injectedinto the troposphere than during NAH-A events because ofthe intensive convective processes which take place at thesource regions. However, under the NAH-S scenario the dustladen air masses are transported a longer way than under theNAH-A scenario (transport over the Atlantic ocean versusover the Mediterranean basin), and thus they are subject tohigher dust segregation by transport. Consequently, theaverage PM levels recorded under both types of episodesare similar (31 and 30 mg/m3). Although the dust transportoccurs at high altitudes in the case of the NAH-A scenario,the considerable vertical development of the boundary layerover the continental areas of the Iberian Peninsula (up to2500 m [Crespi et al., 1995]) causes the dust to abate,resulting in a high impact on surface SPM levels.[33] In the period January–March, the highest monthly
PM10 means are found for the scenario NAH-S (19–
Figure 10. Daily PM10 levels in Monagrega for 1996–2002. The black dots mark African dustepisodes and the white ones episodes exceeding 50 mg/m3 with non-African origin.
D18S08 ESCUDERO ET AL.: AFRICAN DUST EPISODES OVER EASTERN SPAIN
10 of 15
D18S08
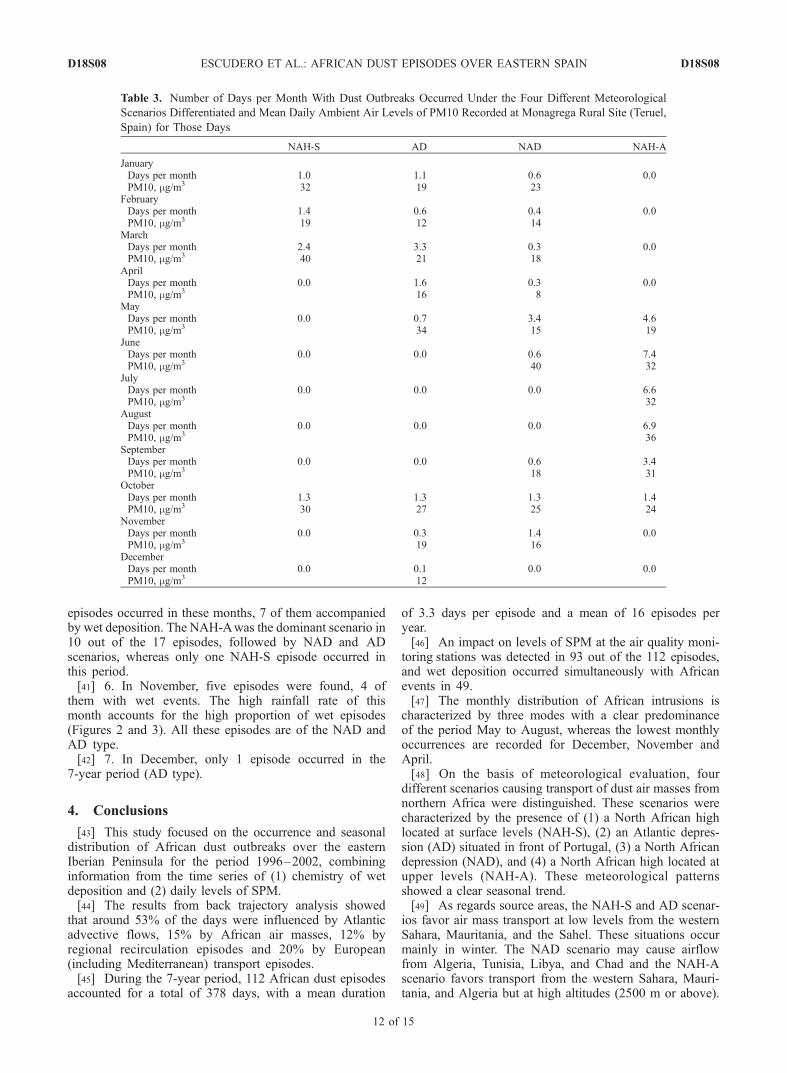
40 mg/m3), while in the other two scenarios occurring inthis period (AD and NAD) PM10 monthly means rangefrom 12 to 23 mg/m3 (Table 3). In May a higher simul-taneous occurrence of African and rain episodes results inlow PM10 monthly means for the NAD and NAH-Ascenarios (15 and 19 mg/m3) and higher PM10 monthlymeans (34 mg/m3) for the scenario AD, although thisscenario is not common in May (0.7 days per month,Table 3). From June to September the monthly means ofPM10 for the African episodes (NAD and NAH-A) arehigh (32–40 mg/m3) with the exception of the NADepisode in September with a monthly mean of 18 mg/m3
(Table 3). In October, similar PM10 monthly means arerecorded for all scenarios (24 to 30 mg/m3). Finally, inNovember and December, few episodes occurred, withrelatively low PM10 monthly means for all the scenarios(12–19 mg/m3, Table 3).[34] Four examples of the different African dust epi-
sodes are given in Figure 11. The examples show howdifferent types of stations (whether rural, suburban, urbanbackground, or industrial background) record simulta-neous peaks during the African episodes, whereas nonsi-multaneous maxima result from local sources. The Africandust contribution is added to the local SPM levels at eachsite, thus resulting in higher levels at the industrialbackground site of Onda than at the regional backgroundone at Monagrega. Figures 11a and 11d (NAH-S andNAH-A) show how the highest SPM levels are reachedunder anticyclonic scenarios, as Monagrega registersincreases from 11 to 46 mg PM10/m3 (Figure 11a) andfrom 19 to 64 mg PM10/m3 (Figure 11d). Conversely,under scenarios AD and NAD the SPM increases are not asmarked (25–30 mg PM10/m3 at Monagrega, Figure 11b;15–20 mg PM10/m3 at Monagrega, Figure 11c).
[35] The following periods can be distinguished in accor-dance with the seasonal distribution of the different trans-port scenarios and the analyses of the SPM time series:[36] 1. In January-March, 30 episodes occurred during
1996–2002. Fourteen of these African air mass intrusionsmay be classified as NAH-S dust outbreaks, whereas12 events belong to the AD type. The remaining 4 episodesbelong to the NAD type. Given that the rain in the firstquarter of the year is scant in eastern Iberia, there is a lowfrequency of wet African episodes (8 events in 7 years).Furthermore, most of these episodes take place in thelower levels of the atmosphere. Consequently, these epi-sodes often exert considerable influence on levels of SPM(Figure 2).[37] 2. In April, African episodes are infrequent over the
Iberian Peninsula. Only 4 episodes were recorded (3 withwet deposition), 3 of them being of the AD type and theremaining one NAD.[38] 3. In May the frequency of African dust outbreaks
over the Iberian Peninsula is high, and 17 episodes occurredduring the study period. Of these episodes, 10, 5, and2 correspond to the NAD, NAH-A, and AD types,respectively. May is a very rainy month in the westernMediterranean, and as a consequence, 13 episodes wereaccompanied by wet deposition.[39] 4. In June–August, as reported for May, the summer
period has also a high frequency of African events(38 events in the study period). However, this period ischaracterized by a lower number of wet episodes than inMay (13 episodes in May and 11 episodes between Juneand August during the study period) owing to theantyciclonic conditions of summertime.[40] 5. In September–October, African events are less
frequent than in the previous three months. However, 17
Table 2. Number of Days With Dust Outbreaks Occurred Under the Four Different Meteorological Scenarios
Differentiated and Mean Daily Ambient Air Levels of PM10 Recorded at Monagrega Rural Site (Teruel, Spain) for
Those Daysa
NAH-S AD NAD NAH-A
2002PM10, mg/m3 16 13 23Days 14 8 0 48
2001PM10, mg/m3 23 12 17 39Days 4 12 30 30
2000PM10, mg/m3 29 21 21 30Days 3 11 7 25
1999PM10, mg/m3 78 33 10 35Days 2 3 10 41
1998PM10, mg/m3 42 39 41 31Days 7 2 4 31
1997PM10, mg/m3 46 39 15 19Days 6 6 16 7
1996PM10, mg/m3 30 20 27Days 9 20 0 22
Mean PM10, mg/m3 31 21 17 30Impact index, mg m�3 yr�1 199 186 228 874
aThe impact index of each type of scenario is defined as the mean number of days per year with that scenario multiplied by themean PM10 levels recorded with that scenario.
D18S08 ESCUDERO ET AL.: AFRICAN DUST EPISODES OVER EASTERN SPAIN
11 of 15
D18S08
episodes occurred in these months, 7 of them accompaniedby wet deposition. The NAH-Awas the dominant scenario in10 out of the 17 episodes, followed by NAD and ADscenarios, whereas only one NAH-S episode occurred inthis period.[41] 6. In November, five episodes were found, 4 of
them with wet events. The high rainfall rate of thismonth accounts for the high proportion of wet episodes(Figures 2 and 3). All these episodes are of the NAD andAD type.[42] 7. In December, only 1 episode occurred in the
7-year period (AD type).
4. Conclusions
[43] This study focused on the occurrence and seasonaldistribution of African dust outbreaks over the easternIberian Peninsula for the period 1996–2002, combininginformation from the time series of (1) chemistry of wetdeposition and (2) daily levels of SPM.[44] The results from back trajectory analysis showed
that around 53% of the days were influenced by Atlanticadvective flows, 15% by African air masses, 12% byregional recirculation episodes and 20% by European(including Mediterranean) transport episodes.[45] During the 7-year period, 112 African dust episodes
accounted for a total of 378 days, with a mean duration
of 3.3 days per episode and a mean of 16 episodes peryear.[46] An impact on levels of SPM at the air quality moni-
toring stations was detected in 93 out of the 112 episodes,and wet deposition occurred simultaneously with Africanevents in 49.[47] The monthly distribution of African intrusions is
characterized by three modes with a clear predominanceof the period May to August, whereas the lowest monthlyoccurrences are recorded for December, November andApril.[48] On the basis of meteorological evaluation, four
different scenarios causing transport of dust air masses fromnorthern Africa were distinguished. These scenarios werecharacterized by the presence of (1) a North African highlocated at surface levels (NAH-S), (2) an Atlantic depres-sion (AD) situated in front of Portugal, (3) a North Africandepression (NAD), and (4) a North African high located atupper levels (NAH-A). These meteorological patternsshowed a clear seasonal trend.[49] As regards source areas, the NAH-S and AD scenar-
ios favor air mass transport at low levels from the westernSahara, Mauritania, and the Sahel. These situations occurmainly in winter. The NAD scenario may cause airflowfrom Algeria, Tunisia, Libya, and Chad and the NAH-Ascenario favors transport from the western Sahara, Mauri-tania, and Algeria but at high altitudes (2500 m or above).
Table 3. Number of Days per Month With Dust Outbreaks Occurred Under the Four Different Meteorological
Scenarios Differentiated and Mean Daily Ambient Air Levels of PM10 Recorded at Monagrega Rural Site (Teruel,
Spain) for Those Days
NAH-S AD NAD NAH-A
JanuaryDays per month 1.0 1.1 0.6 0.0PM10, mg/m3 32 19 23
FebruaryDays per month 1.4 0.6 0.4 0.0PM10, mg/m3 19 12 14
MarchDays per month 2.4 3.3 0.3 0.0PM10, mg/m3 40 21 18
AprilDays per month 0.0 1.6 0.3 0.0PM10, mg/m3 16 8
MayDays per month 0.0 0.7 3.4 4.6PM10, mg/m3 34 15 19
JuneDays per month 0.0 0.0 0.6 7.4PM10, mg/m3 40 32
JulyDays per month 0.0 0.0 0.0 6.6PM10, mg/m3 32
AugustDays per month 0.0 0.0 0.0 6.9PM10, mg/m3 36
SeptemberDays per month 0.0 0.0 0.6 3.4PM10, mg/m3 18 31
OctoberDays per month 1.3 1.3 1.3 1.4PM10, mg/m3 30 27 25 24
NovemberDays per month 0.0 0.3 1.4 0.0PM10, mg/m3 19 16
DecemberDays per month 0.0 0.1 0.0 0.0PM10, mg/m3 12
D18S08 ESCUDERO ET AL.: AFRICAN DUST EPISODES OVER EASTERN SPAIN
12 of 15
D18S08
This scenario is produced exclusively in May and in thesummer months. African dust outbreaks have an importantimpact on the regional background SPM levels in easternIberia. Mean daily levels of PM10 at the rural station in
Monagrega show increases when a dust outbreak occurs.The mean daily levels in Monagrega for the days withAfrican intrusion of the NAH-S and NAH-A type are 31and 30 mg/m3, whereas when the AD and NAD scenarios
Figure 11. Examples of SPM episodes corresponding to the four meteorological scenarios defined:(a) NAH-S, (b) AD, (c) NAD, and (d) NAH-A. Back trajectory analysis for the given dates.
D18S08 ESCUDERO ET AL.: AFRICAN DUST EPISODES OVER EASTERN SPAIN
13 of 15
D18S08
are produced, the daily means are lower (21 and 17 mg/m3
respectively). Nevertheless, taking into account the numberof days during which each scenario is produced, the impacton PM10 levels in Monagrega was studied. The impact ofthe NAH-A scenario (mainly occurring in summer) provedto be approximately 4 times greater than that of the otherthree scenarios.
[50] Acknowledgments. This study was financed by the SpanishMinistries of the Environment and Science of Technology, projectREN2001-0659. The authors would like express their gratitude to theAtmospheric Modeling and Weather Forecasting Group in the Universityof Athens for the SKIRON model outputs; to the NASA Goddard SpaceFlight Center, NOAA Air Resources Laboratory (ARL), Naval ResearchLaboratory; and to SeaWIFS Project (NASA) for the provision of theTOMS-AI maps, the HYSPLIT transport and dispersion model, the NAAPsaerosol maps, and the satellite imagery, respectively. Meteorological chartswere provided by the NOAA CIRES Climate Diagnostics Center, Boulder,Colorado, and the NCEP Climate Diagnostics Center. The authors alsoacknowledge ENDESA, the Autonomous Governments of Valencia andCatalunya for providing the data from the air quality networks and forsupporting this study and Meteocat for supplying daily rainfall data fromSanta Marıa de Palautordera.
ReferencesAlastuey, A., X. Querol, A. Chaves, C. R. Ruiz, A. Carratala, and A. Lopez-Soler (1999), Bulk deposition in a rural area located around a large coal-fired power station, Northeast Spain, Environ. Pollut., 106(3), 359–367.
Ansmann, A., D. Muller, I. Mattis, and U. Wandinger (2003), Raman-lidarprofiling of dust optical properties at UV and visible wavelengths, paperpresented at 2nd Workshop on Mineral Dust, Lab. Inter-Univ. des Syst.Atmos., Paris.
Arimoto, R. (2001), Eolian dust and climate: Relationships to sources,tropospheric chemistry, transport and deposition, Earth Sci. Rev., 54,29–42.
Arimoto, R., R. A. Duce, B. J. Ray, W. G. Ellis Jr., J. D. Cullen, and J. T.Merrill (1995), Trace elements in the atmosphere over the North Atlantic,J. Geophys. Res., 100, 1199–1214.
Arimoto, R., B. J. Ray, N. F. Lewis, U. Tomza, and R. A. Duce (1997),Mass-particle size distributions of atmospheric dust and the dry deposi-tion of dust to the remote ocean, J. Geophys. Res., 102, 15,867–15,874.
Avila, A. (1996), Time trends in the precipitation chemistry at a mountainsite in northeastern Spain for the period 1983–1994, Atmos. Environ., 30,1363–1373.
Avila, A., and M. Alarcon (1999), Relationship between precipitationchemistry and meteorological situations at rural site in NE Spain, Atmos.Environ., 33, 1663–1677.
Avila, A., and M. Alarcon (2003), Precipitation chemistry at a ruralMediterranean site: Between anthropogenic pollution and natural emis-sions, J. Geophys. Res., 108(D9), 4278, doi:10.1029/2002JD002565.
Avila, A., and F. Roda (2002), Assessing decadal changes in rainwateralkalinity at a rural Mediterranean site in the Montseny Mountains (NESpain), Atmos. Environ., 36, 2881–2890.
Avila, A., I. Queralt, and M. Alarcon (1997), Mineralogical composition ofAfrican dust delivered by red rains over northeastern Spain, J. Geophys.Res., 102, 21,977–21,996.
Avila, A., M. Alarcon, and I. Queralt (1998), The chemical composition ofdust transported in red rains-its contribution to the biogeochemical cycleof a Holm Oak forest in Catalonia (Spain), Atmos. Environ., 32, 179–191.
Bergametti, G., A. L. Dutot, P. Buat-Menard, R. Losno, and E. Remoudaki(1989a), Seasonal variability of the elemental composition of atmosphericaerosol particles over the NW Mediterranean, Tellus, Ser. B, 41, 353–361.
Bergametti, G., L. Gomes, G. Coude-Gaussen, P. Rognon, and M. N. L.Coustumer (1989b), African dust observed over Canary Islands: Sourceregions identification and transport pattern for some summer situation,J. Geophys. Res., 94, 14,855–14,864.
Camarero, L., and J. Catalan (1993), Chemistry of bulk precipitation inthe central and eastern Pyrenees, northeast Spain, Atmos. Environ., 27,83–94.
Caquineau, S., A. Gaudichet, L. Gomes, M. C. Magonthier, and B. Chatenet(1998), Saharan dust: Clay ratio as a relevant tracer to assess the origin ofsoil delivered aerosols, Geophys. Res. Lett., 25, 983–986.
Chester, R., M. Nimmo, M. Alarcon, C. Saydam, K. J. T. Murphy, G. S.Sanders, and P. Corcoran (1993), Defining the chemical character of
aerosols from the atmosphere in the Mediterranean sea and surroundingregions, Oceanol. Acta, 16, 231–246.
Chiapello, I., G. Bergametti, L. Gomes, and B. Chatenet (1995), An addi-tional low layer transport of Sahelian and Saharan dust over the north-eastern tropical Atlantic, Geophys. Res. Lett., 22, 3191–3194.
Coude-Gaussen, G., P. Rognon, G. Bergametti, L. Gomes, B. Strauss, J. M.Gros, and M. N. L. Coustumer (1987), Saharan dust over FuerteventuraIsland (Canaries): Chemical and mineralogical characteristics, air masstrajectories, and probable sources, J. Geophys. Res., 92, 9711–9753.
Crespi, S. N., B. Artınano, and H. Cabal (1995), Synoptic classification ofthe mixed-layer evolution, J. Appl. Methods, 34, 1666–1676.
Dayan, U., J. Hefter, and J. Miller (1991), Dust intrusion into the Medi-terranean basin, J. Appl. Meteorol., 30, 1185–1199.
Draxler, R. R., and G. D. Rolph (2003), HYSPLIT (HYbrid Single-ParticleLagrangian Integrated Trajectory) model access via NOAA ARLREADY Website, NOAA Air Resources Laboratory, Silver Spring,Md. (available at http://www.arl.noaa.gov/ready/hysplit4.html)
Dulac, F., D. Tanre, G. Bergametti, P. B.-U. Menard, M. Desbois, andD. Sutton (1992), Assessment of the African airborne dust mass overthe western Mediterranean using Meteosat data, J. Geophys. Res., 97,2489–2506.
Falkowski, P. G., R. T. Barber, and V. Smetacek (1998), Biogeochemicalcontrols and feedbacks on ocean primary production, Science, 281, 200–206.
Fung, I., S. Meyn, I. Tegen, S. C. Doney, J. John, and J. K. B. Bishop(2000), Iron supply and demand in the upper ocean, Global Biogeochem.Cycles, 14, 281–296.
Ganor, E., and Y. Mamane (1982), Transport of Saharan dust across theeastern Mediterranean, Atmos. Environ., 16, 581–587.
Guerzoni, S., A. Cristini, R. Caboi, O. Le Bolloch, I. Marras, andL. Rundeddu (1995), Ionic composition of rainwater and atmosphericaerosols in Sardinia, southern Mediterranean, Water Air Soil Pollut., 85,2077–2082.
Guerzoni, S., E. Molinaroli, and R. Chester (1997), Saharan dust inputsto the Western Mediterranean sea: Depositional patterns, geochemistryand sedimentological implications, Deep Sea Res., Part II, 44(3–4),631–654.
Harrison, S. P., K. E. Kohfeld, C. Roelandt, and T. Claquin (2001), The roleof dust in climate changes today, at the Last Glacial Maximum and in thefuture, Earth Sci. Rev., 54, 43–80.
Haywood, J., and O. Boucher (2000), Estimates of the direct and indirectradiative forcing due to tropospheric aerosols, Rev. Geophys., 38, 513–543.
Herman, J. R., P. K. Bhartia, O. Torres, O. Hsu, C. Seftor, and E. Celarier(1997), Global distribution of UV-absorbing aerosols from Nimbus7/TOMS data, J. Geophys. Res., 102, 16,911–16,922.
Instituto Nacional de Meteorologia (INM) (2001), Guıa resumida del climaen Espana 1971–2000, 257 pp., Minist. de Medio Ambiente, Madrid,Spain.
Intergovernmental Panel on Climate Change (2001), Climate Change 2001:The Scientific Basis, Cambridge Univ. Press, New York.
Kallos, G., V. Kotroni, and K. Lagouvardos (1997), The regional weatherforecasting system SKIRON: An overview, in Symposium on RegionalWeather Prediction on Parallel Computer Environments, pp. 109–122,Univ. of Athens, Athens, Greece.
Levin, Z., E. Ganor, and V. Gladstein (1996), The effects of desert particlescoated with sulfate on rain formation in the eastern Mediterranean,J. Appl. Meteorol., 35, 1511–1523.
Loye-Pilot, M. D., J. M. Martin, and J. Morelli (1986), Influence of Saharandust on the rain acidity and the atmospheric input to the Mediterranean,Nature, 321, 427–428.
McClain, C. R., M. L. Cleave, G. C. Feldman, W. W. Gregg, S. B. Hooker,and N. Kuring (1998), Science quality SeaWiFS data for global biosphereresearch, Sea Technol., 39(9), 10–15.
Millan, M., R. Salvador, E. Mantilla, and G. Kallos (1997), Photo-oxidantdynamics in the Mediterranean basin in summer: Results from Europeanresearch projects, J. Geophys. Res., 102, 8811–8823.
Molinaroli, E., S. Guerzoni, and G. Rampazzo (1993), Contribution ofSaharan dust to the central Mediterranean basin, in Processes Controllingthe Composition of Clastic Sediments, edited by M. J. Johnsson andA. Basu, Spec. Pap. Geol. Soc. Am., 284, 303–312.
Moulin, C., C. E. Lambert, F. Dulac, and U. Dayan (1997), Control ofatmospheric export of dust from North Africa by the North AtlanticOscillation, Nature, 387, 691–694.
Moulin, C., et al. (1998), Satellite climatology of African dust transportin the Mediterranean atmosphere, J. Geophys. Res., 103, 13,137–13,144.
Perry, K. D., T. A. Cahill, R. A. Eldred, D. D. Dutcher, and T. E. Gill(1997), Long-range transport of North African dust to the eastern UnitedStates, J. Geophys. Res., 102, 1225–1238.
D18S08 ESCUDERO ET AL.: AFRICAN DUST EPISODES OVER EASTERN SPAIN
14 of 15
D18S08
Prospero, J. M. (1999), Long range transport of mineral dust in the globalatmosphere: Impact of African dust on the environment of the south-eastern United States, Proc. Natl. Acad. Sci. U.S.A., 96, 3396–3403.
Prospero, J. M., and T. N. Carlson (1981), Saharan air outbreaks over thetropical North Atlantic, Pure Appl. Geophys., 119, 667–691.
Prospero, J. M., and R. T. Nees (1986), Impact of the North African droughtand El Nino on mineral dust in Barbados trade winds, Nature, 320, 735–738.
Prospero, J. M., R. Schmitt, E. Cuevas, D. L. Savoie, W. C. Graustein,K. K. Turekian, A. Volz-Thomas, A. Dıaz, S. J. Oltmans, and H. Levy II(1995), Temporal variability of summer-time ozone and aerosols in thefree troposphere over the eastern North Atlantic, Geophys. Res. Lett., 22,2925–2928.
Prospero, J. M., P. Ginoux, O. Torres, S. E. Nicholson, and T. E. Gill(2002), Environmental characterization of global sources of atmosphericsoil dust identified with the NIMBUS 7 Total Ozone Mapping Spectrom-eter (TOMS) absorbing aerosol product, Rev. Geophys., 40(1), 1002,doi:10.1029/2000RG000095.
Querol, X., A. Alastuey, J. A. Puicercus, E. Mantilla, J. V. Miro, A. Lopez-Soler, F. Plana, and B. Artınano (1998), Seasonal evolution of suspendedparticles around a large coal-fired power station: Particle levels andsources, Atmos. Environ., 32, 1963–1978.
Querol, X., et al. (2002), Interpretacion de series temporales (1996–2000)de niveles de partıculas en suspension en Espana, Ministerio de MedioAmbiente, Madrid.
Querol, X., et al. (2004), Levels of PM in rural, urban and industrial sites inSpain, Sci. Total Environ., 334–335, 359–376.
Roda, F., J. Bellot, A. Avila, A. Escarre, J. Pinol, and J. Terradas (1993),Saharan dust and the atmospheric inputs of elements and alkalinity toMediterranean ecosystems, Water Air Soil Pollut., 66, 277–288.
Rodrıguez, S., X. Querol, A. Alastuey, G. Kallos, and O. Kakaliagou(2001), Saharan dust contributions to PM10 and TSP levels in southernand E. Spain, Atmos. Environ., 35, 2433–2447.
Ryall, D. B., R. G. Derwent, A. J. Manning, A. L. Redington, J. Corden,W. Millington, P. G. Simmonds, S. O’Doherty, N. Carslaw, and G. W.Fuller (2002), The origin of high particulate concentrations over theUnited Kingdom, March 2000, Atmos. Environ., 36, 1363–1378.
Samara, C., R. Tsitouridou, and C. Balafoutis (1992), Chemical composi-tion of rain in Thessaloniki, Greece, in relation to meteorological condi-tions, Atmos. Environ., 26, 359–367.
Savoie, D. L., J. M. Prospero, and R. T. Ness (1987), Nitrate, non-sea-sulfateand mineral aerosol over the northwestern Indian Ocean, J. Geophys.Res., 92, 933–942.
Savoie, D. L., J. M. Prospero, S. J. Oltmans, W. C. Graustein, K. K.Turekian, J. T. Merrill, and H. Levy (1992), Sources of nitrate and ozonein the marine boundary-layer of the tropical North-Atlantic, J. Geophys.Res., 97, 11,575–11,589.
Sequeira, R. (1982), Acid rain: An assessment based on acid-base consid-erations, J. Air Pollut. Control Assoc., 32(3), 241–245.
Sokolik, I. N., D. M. Winker, G. Bergametti, D. A. Gillette, G. Carmichael,Y. Kaufman, L. Gomes, L. Schuetz, and J. E. Penner (2001), Introductionto special section: Outstanding problems in quantifying the radiativeimpacts of mineral dust, J. Geophys. Res., 106, 18,015–18,028.
Swap, R., M. Garstang, S. Greco, R. Talbot, and P. Kallberg (1992), Saharandust in the Amazon basin, Tellus, 44, 133–149.
Tegen, I., P. Hollrig, M. Chin, I. Fung, D. Jacob, and J. Penner (1997),Contribution of different aerosol species to the global aerosol extinctionoptical thickness: Estimates from model results, J. Geophys. Res., 102,23,895–23,916.
Torres, O., P. K. Bhartia, J. R. Herman, Z. Ahmad, and J. Gleason (1998),Derivation of aerosol properties from satellite measurements of backscat-tered ultraviolet radiation: Theoretical basis, J. Geophys. Res., 103,17,099–17,110.
Torres, O., P. K. Bhartia, J. R. Herman, A. Sinyuk, P. Ginoux, andB. Holben (2002), A long-term record of aerosol optical depth fromTOMS observations and comparison to AERONET measurements,J. Atmos. Sci., 59, 389–413.
Viana, M., X. Querol, A. Alastuey, E. Cuevas, and S. Rodrıguez (2002),Influence of African dust on the levels of atmospheric particulatesin the Canary Islands air quality network, Atmos. Environ., 36,5861–5875.
�����������������������M. Alarcon, Department of Physics and Nuclear Engineering, Poly-
technic University of Catalonia, Av. V. Balaguer s/n, E-08800, Vilanova iLa Geltru (Barcelona), Spain.A. Alastuey, S. Castillo, X. Querol, S. Rodrıguez, and M. M. Viana,
Institute of Earth Sciences ‘‘Jaume Almera,’’ CSIC, C/Luis Sole i Sabarıss/n, E-08028, Barcelona, Spain.A. Avila and M. Escudero, Centre for Ecological Research and Forestry
Applications (CREAF), Building C, Autonomous University of Barcelona,E-08193, Bellaterra (Barcelona), Spain. ([email protected])E. Cuevas, Izana Atmospheric Observatory, INM, C/La Marina, 20,
6a Planta, E-38001, Santa Cruz de Tenerife, Spain.
D18S08 ESCUDERO ET AL.: AFRICAN DUST EPISODES OVER EASTERN SPAIN
15 of 15
D18S08
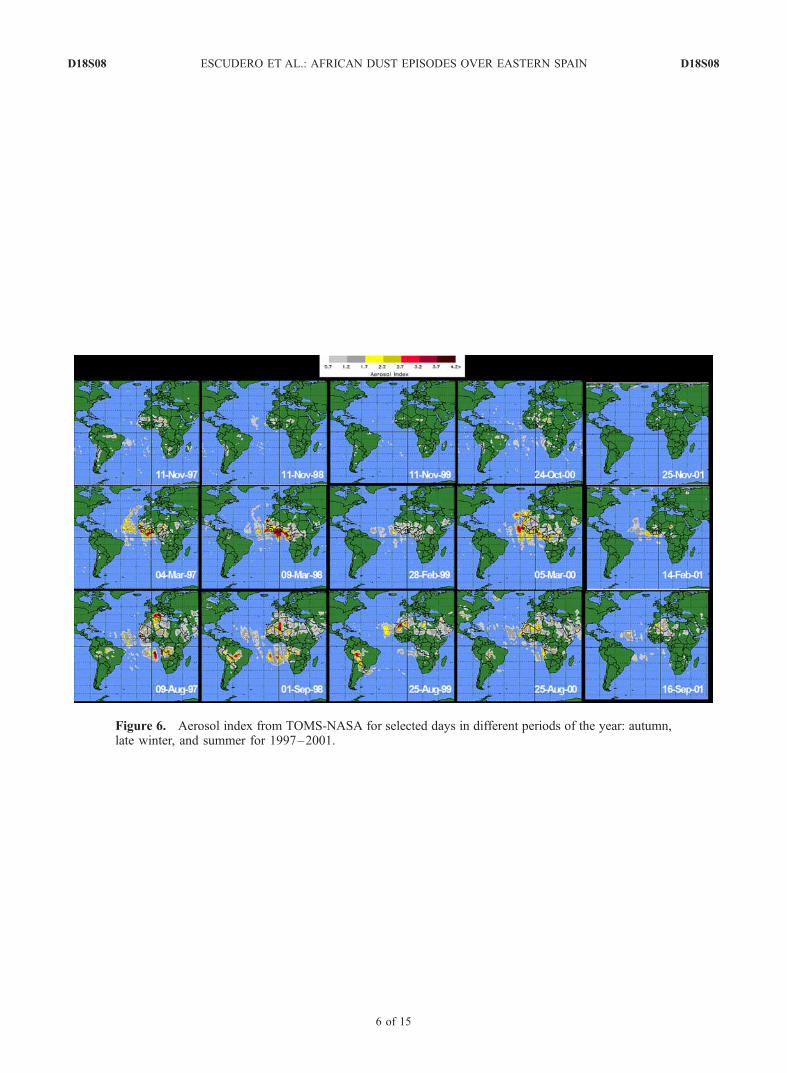
Figure 6. Aerosol index from TOMS-NASA for selected days in different periods of the year: autumn,late winter, and summer for 1997–2001.
D18S08 ESCUDERO ET AL.: AFRICAN DUST EPISODES OVER EASTERN SPAIN D18S08
6 of 15