Embed Size (px)
Citation preview
SFBBO Snowy Plover Report 2014
1
Western Snowy Plover Monitoring in the San Francisco Bay
Annual Report 2014
Prepared By: Karine Tokatlian, Plover Program Director Josh Scullen, Landbird Program Director
Catherine Burns, Executive Director San Francisco Bay Bird Observatory 524 Valley Way, Milpitas, CA 95035
For:
Cheryl Strong, Wildlife Biologist Don Edwards San Francisco Bay National Wildlife Refuge
And John Krause, Wildlife Biologist
California Department of Fish and Wildlife
December 31, 2014
SFBBO Snowy Plover Report 2014
2
Contents
SUMMARY ....................................................................................................................................... 9 INTRODUCTION AND BACKGROUND ............................................................................................ 11 METHODS ...................................................................................................................................... 12
Study Area ................................................................................................................................. 12 Snowy Plover Surveys ............................................................................................................... 13 Nest Monitoring ........................................................................................................................ 14 Chick Color Banding .................................................................................................................. 15 IWS Reproductive Success Study .............................................................................................. 15 Oyster Shell Habitat Enhancements ......................................................................................... 16 Avian Predator Surveys ............................................................................................................. 17
RESULTS......................................................................................................................................... 17 Snowy Plover Surveys ............................................................................................................... 17
South Bay Overall. ................................................................................................................. 17 Refuge. .................................................................................................................................. 18 Eden Landing. ........................................................................................................................ 18
Nest Abundance and Success ................................................................................................... 18 South Bay Overall. ................................................................................................................. 18 Refuge. .................................................................................................................................. 18 Eden Landing. ........................................................................................................................ 19 Hayward Shoreline. ............................................................................................................... 19 Napa-Sonoma Marshes Wildlife Area. .................................................................................. 19 Montezuma Wetlands. ......................................................................................................... 19 Hamilton Wetland Restoration Area. ................................................................................... 20 Redwood City Cargill Evaporation Ponds. ............................................................................. 20
Chick Fledging Success .............................................................................................................. 20 IWS Reproductive Success Study .............................................................................................. 21 Oyster Shell Habitat Enhancements ......................................................................................... 21
Apparent Estimates. .............................................................................................................. 21 Nest Survival Models. ........................................................................................................... 22
Avian Predators ......................................................................................................................... 22 Refuge. .................................................................................................................................. 22 Mountain View. ..................................................................................................................... 22 Eden Landing. ........................................................................................................................ 22 Hayward Shoreline. ............................................................................................................... 23 Napa-Sonoma Marshes Wildlife Area. .................................................................................. 23
Mammalian Predators .............................................................................................................. 23 DISCUSSION ................................................................................................................................... 23
Snowy Plover Surveys ............................................................................................................... 23 Nest Abundance and Success ................................................................................................... 24
Additional Nesting Areas. ..................................................................................................... 27 Chick Fledging Success .............................................................................................................. 27
SFBBO Snowy Plover Report 2014
3
IWS Reproductive Success Study .............................................................................................. 28 Oyster Shell Habitat Enhancements ......................................................................................... 28
Apparent Estimates. .............................................................................................................. 28 Large Scale Enhancement Study. .......................................................................................... 28 Additional Considerations. .................................................................................................... 29
Avian Predators ......................................................................................................................... 29 Mammalian Predators .............................................................................................................. 31 Restoration and Snowy Plover Nesting .................................................................................... 31
RECOMMENDATIONS ................................................................................................................... 34 Research Recommendations .................................................................................................... 34 Monitoring Recommendations ................................................................................................. 34 Management Recommendations ............................................................................................. 35
ACKNOWLEDGEMENTS ................................................................................................................. 36 REFERENCES .................................................................................................................................. 36
SFBBO Snowy Plover Report 2014
4
LIST OF FIGURES Figure 1. The Don Edwards San Francisco Bay National Wildlife Refuge, CDFW’s Eden Landing Ecological Reserve, East Bay Regional Park District and Hayward Area Recreation and Park District lands in the South San Francisco Bay, California. ............................................................. 39
Figure 2. Snowy Plover nesting areas in the CDFW’s Napa-Sonoma Marshes Wildlife Area: the Wingo Unit, ponds 7/7a, and the nesting islands at the Green Island Unit (formerly called the Napa Plant Site), North San Francisco Bay, California. ................................................................. 40
Figure 3. Salt ponds located in the Refuge’s Warm Springs area, near Fremont, South San Francisco Bay, California. See Figure 1 for location of Warm Springs within South San Francisco Bay. ................................................................................................................................................ 41
Figure 4. Salt ponds in the Refuge’s Alviso Complex, at the southern end of the South San Francisco Bay, California. See Figure 1 for location of Alviso within South San Francisco Bay. .. 42
Figure 5. Salt ponds in the Refuge’s Ravenswood Complex, at the west end of the Dumbarton Bridge, South San Francisco Bay, California. See Figure 1 for location of Ravenswood within South San Francisco Bay. .............................................................................................................. 43
Figure 6. Salt ponds in the CDFW’s Eden Landing Ecological Reserve, near Hayward, South San Francisco Bay, California. See Figure 1 for location of Eden Landing Ecological Reserve within South San Francisco Bay. .............................................................................................................. 44
Figure 7a. Weekly counts of adult Snowy Plovers by week and area, San Francisco Bay, California, 2014. To facilitate interpretation, data are presented for all locations monitored. Note the high number of Snowy Plovers observed in late March and August are presumed to be migrating and not breeding in the San Francisco Bay. ................................................................. 46
Figure 7b. Weekly counts of adult Snowy Plovers by week and area, San Francisco Bay, California, 2014. To facilitate interpretation, data are presented for all locations monitored excluding Eden Landing. Note the high number of Snowy Plovers observed in late March and August are presumed to be migrating and not breeding in the San Francisco Bay. .................. 466
Figure 8. Areas (black outline) with documented Snowy Plover nesting activity during the 2014 breeding season, South San Francisco Bay, California.. ............................................................. 477
Figure 9. Annual apparent Snowy Plover nest fates in the South San Francisco Bay, California, 2008-2014. The number of nests monitored is indicated in parentheses beneath the year.... 488
Figure 10. The proportion of Snowy Plover nests found in each pond complex in the South San Francisco Bay, California, 2014. .................................................................................................. 499

SFBBO Snowy Plover Report 2014
5
Figure 11. The proportion of Snowy Plover nests found in each pond at Eden Landing Ecological Reserve in Hayward, California, 2014. Note that 52% of Eden Landing nests were found in ponds E12, E13 and E14. Construction activity began around these ponds in June 2014. ......... 49
Figure 12. The weekly number of initiated and active Snowy Plover nests in the South San Francisco Bay, California, 2014. .................................................................................................... 50
Figure 13. The number of Snowy Plover nests in each shell plot at Eden Landing Ecological Reserve, South San Francisco Bay, California, 2008-2014. Miniscule numbers were used to represent “0” nest values versus “null” values on each graph in order to signify years in which plots were not yet established. Shell plots considered to be in good condition are E14-1 and 3, E16B-1 and 3, E6B-1 and 4, and E8-1 and 3. Shell plots considered to be in poor condition are E14-2, E16B-2, E6B-2 and 3, and E8-2 and 4............................................................................... 511
Figure 14. Average number of Snowy Plover nests initiated by pond in South San Francisco Bay, California from 2009-2014. Data are shown as mean + 1SD. The purpose of this figure is to illustrate which ponds have supported Snowy Plover nesting activity in recent years, and of these, which ponds are included in Phase 1 restoration plans of the South Bay Salt Pond Restoration Project. White bars denote ponds that have been (or will be) returned to tidal influence, gray bars denote ponds that are (or will be) managed for multiple species (at higher water levels) and the amount of habitat available to Snowy Plovers will be reduced, black bars denote ponds that will not be directly affected by Phase 1 actions, and black dashes denote the maximum number of nests at each pond across all years. Note that “NCM” = New Chicago Marsh, “Hayward” = Hayward Least Tern Island, and “OBN” = Oliver Brothers North, Hayward; refer to Figs. 3-6 for other pond names and locations ............................................................... 522
Figure 15. Average number of Snowy Plover nests initiated by pond in the Alviso Complex, South San Francisco Bay, California from 2009-2014. The purpose of this figure is to illustrate which ponds have supported Snowy Plover nesting activity in recent years, and of these, which ponds are included in Phase 1 restoration plans of the South Bay Salt Pond Restoration Project. Diagonal lines denote ponds that have been returned to tidal influence, hatch lines denote ponds that are (or will be) managed for multiple species and the amount of habitat available to Snowy Plovers will be reduced, and solid colors denote ponds that will not be directly affected by Phase 1 actions. The gradient shading denotes the average number of plover nests on the pond. Note that Snowy Plovers did not start nesting on ponds A16 and A17 until they were drained for construction; they were not historically nesting ponds .......................................... 533
Figure 16. Average number of Snowy Plover nests initiated by pond in the Ravenswood Complex, South San Francisco Bay, California from 2009-2014. The purpose of this figure is to illustrate which ponds have supported Snowy Plover nesting activity in recent years, and of these, which ponds are included in Phase 1 restoration plans of the South Bay Salt Pond Restoration Project. Crossed hatch lines denote ponds that are managed for multiple species
SFBBO Snowy Plover Report 2014
6
and the amount of habitat available to Snowy Plovers will be reduced, and solid colors denote ponds that will not be directly affected by Phase 1 actions. The gradient shading denotes the average number of plover nests on the pond ............................................................................ 544
Figure 17. Average number of Snowy Plover nests initiated by pond in the Eden Landing Ecological Reserve, South San Francisco Bay, California from 2009-2014. The purpose of this figure is to illustrate which ponds have supported Snowy Plover nesting activity in recent years, and of these, which ponds are included in Phase 1 restoration plans of the South Bay Salt Pond Restoration Project. Diagonal lines denote ponds that have been returned to tidal influence, crossed hatch lines denote ponds that are managed for multiple species and the amount of habitat available to Snowy Plovers will be reduced, and solid colors denote ponds that will not be directly affected by Phase 1 actions. The gradient shading denotes the average number of plover nests on the pond ............................................................................................................ 555
Figure 18. The total number of Snowy Plover adults counted during the breeding window survey and the total number of Snowy Plover nests counted during the season in all regularly monitored Recovery Unit 3 (RU3) areas, San Francisco Bay, from 2006-2014. The double line indicates the South Bay Salt Pond Restoration Project management trigger of 100 breeding adults in RU3, established from 2006 baseline of 102 breeding birds………………………………………56 Figure 19. Weekly counts of adult Snowy plovers in the Whale’s Tail complex (ponds E12, E13 and E14) in Eden Landing Ecological Reserve, South San Francisco Bay, California, from 2012-2014. The purpose of this figure is to show the difference in adult use of the Whale’s Tail complex after its restoration to a highly managed salinity system; conversion was completed during the winter of 2013. ………………………………………………………………………………………………………57
SFBBO Snowy Plover Report 2014
7
LIST OF TABLES Table 1. Ponds surveyed weekly within the Don Edwards San Francisco Bay National Wildlife Refuge, South San Francisco Bay, California, 2014. ...................................................................... 58
Table 2. Ponds surveyed weekly within California Department of Fish and Wildlife’s Eden Landing Ecological Reserve, San Francisco Bay, California, 2014. ................................................ 58
Table 3. Additional areas surveyed in the San Francisco Bay, California, 2014. These areas were surveyed less often than our weekly surveys or were surveyed by biologists from different agencies. ....................................................................................................................................... 58
Table 4. Number of Western Snowy Plovers observed in Recovery Unit 3, (San Francisco Bay, California) sites during annual breeding window surveys in May 2005-2014. ............................ 58
Table 5. Snowy Plover nest fates by pond in the South San Francisco Bay, California, 2014.....59-60
Table 6. Snowy Plover apparent nest densities (nest/ha) by pond on Refuge property in the South San Francisco Bay, California, 2014. The nest densities should be viewed with caution since the area used to calculate the densities represent only a rough gauge of potentially available nesting habitat. .............................................................................................................. 61
Table 7. Snowy Plover apparent nest densities (nests/ha) by pond at Eden Landing Ecological Reserve in the South San Francisco Bay, California, 2014. The nest densities should be viewed with caution since the area used to calculate the densities represent only a rough gauge of potentially available nesting habitat. ........................................................................................... 62
Table 8. Apparent fledging success (all sites combined) of Snowy Plover chicks in the South San Francisco Bay, California, 2008-2014. Chicks were considered fledged if they survived to 31 days. N is the number of chicks banded. ..................................................................................... 62
Table 9. Apparent fledging success of Snowy Plover chicks by pond in the South San Francisco Bay, California, 2014. Chicks were considered fledged if they survived to 31 days. N is the number of individuals banded. ..................................................................................................... 63
Table 10. The number of nests in each shell plot at Eden Landing Ecological Reserve in the South San Francisco Bay, California, 2009-2014. Note: counts from past years may be slightly different due to updated data collection methods. The counts shown here are reliable. . ..................... 64
Table 11. Number of nests monitored, apparent nest fates, and apparent nest densities for control plots, shell plots, and other areas at Eden Landing Ecological Reserve in the South San Francisco Bay, California, 2009-2014. Other ELER areas include ponds E11, E16B, E15B, E14B,

SFBBO Snowy Plover Report 2014
8
E12, E13, E14, E6A, E6B, E8 and E6. Note: counts for previous years have been revised to reflect changes to “Other ELER” criteria. ................................................................................................. 65
Table 12. The average number of potential predators observed per survey at the Ravenswood Complex, South San Francisco Bay, California, March-August 2014. Data are presented at the pond scale. Only species with averages > 0 for at least one location are listed. ........................ 66
Table 13. The average number of potential predators observed per survey at the Alviso Complex, South San Francisco Bay, California, March-August 2014. Data are presented at the pond scale. Only species with averages > 0 for at least one location are listed.. ....................... 67
Table 14. The average number of potential predators observed per survey at ponds A2E, Crittenden Marsh East and Crittenden Marsh West, South San Francisco Bay, California, March-August 2014. Data are presented at the pond scale. Only species with averages > 0 for at least one location are listed.. ................................................................................................................ 67
Table 15. The average number of potential predators observed per survey at Warm Springs, South San Francisco Bay, California, March-August 2014. Data are presented at the pond scale. Only species with averages > 0 for at least one location are listed.............................................. 68
Table 16. The average number of potential predators observed per survey at Eden Landing Ecological Reserve, South San Francisco Bay, California, March-August 2014. Data are presented at the pond scale. Only species with averages > 0 for at least one location are listed.. .............. 69
Table 17. The average number of potential predators observed per survey at Hayward Shoreline sites (1-17), South San Francisco Bay, California, March-August 2014. Data are presented at the pond scale. Only species with averages > 0 for at least one location are listed.. ....................... 70
Table 18. The average number of potential predators observed per survey at Napa ponds 7/7A, North San Francisco Bay, California, March-August 2014. Data are presented at the pond scale. Only species with averages > 0 for at least one location are listed. …………………………………………71
SFBBO Snowy Plover Report 2014
9
SUMMARY The San Francisco Bay Bird Observatory (SFBBO), Don Edwards San Francisco Bay National Wildlife Refuge (Refuge), California Department of Fish and Wildlife (CDFW), Hayward Area Recreation and Park District (HARD), and East Bay Regional Park District (EBRPD) form the Western Snowy Plover (Charadrius nivosus nivosus) Recovery Unit 3. The goal of this collaboration is to survey managed ponds and other habitats for Western Snowy Plovers, track breeding success, and contribute to the management and recovery of this species in the San Francisco Bay. During the 2014 breeding season, we monitored Snowy Plover numbers, nesting and fledging success, use of experimental habitat enhancement sites, and potential predators. We also participated in the pilot year of a reproductive success study initiated by the Institute for Wildlife Studies (IWS). As part of the Pacific Coast breeding season window survey (May 18-24), we counted 178 adult Snowy Plovers in the San Francisco Bay. Over the course of the breeding season (March-September), we documented 228 plover nests in all of Recovery Unit 3. In the South Bay, we determined the fate of 215 and found that apparent nest success (defined as the percentage of nests that successfully hatched at least one egg out of the total nests monitored) was 50%. Remaining nests failed due to predation (44%), abandonment (4%), flooding (1%) and for unknown reasons (1%). We summarize 2014 nesting activity by pond complex or management unit below:
On Refuge property, we determined the fate of three nests in the Alviso Complex (ponds A9 and A13) and 41 nests in the Ravenswood Complex (ponds SF2, R1, R3 and R4). Apparent nest success was 67% and 61% in the Alviso and Ravenswood complexes, respectively. Fourteen nests were found in Crittenden Marsh (non-Refuge property) in Mountain View, yielding an apparent nest success of 86%. This was the first season that Mountain View ponds A2E and Crittenden Marsh were monitored for breeding Snowy Plovers. Also on Refuge property, we located 12 nests in the Warm Springs complex in Fremont. Apparent nest success was 50% in Warm Springs.
We found 66% of Snowy Plover nests in Recovery Unit 3 at CDFW’s Eden Landing Ecological Reserve (Eden Landing). We determined the fate of 141 nests and found that apparent nest success was 42%. Fifty four percent of nests were lost to predation in this location. One plover nest was found and hatched on the Oliver Brother’s North salt ponds at the Hayward Shoreline Interpretive Center. EBRPD reported three Snowy Plover nests on the California Least Tern (Sterna antillarum browni) island at Hayward Shoreline. Two of these nests hatched and the third was depredated (D. Riensche, pers. comm.).
SFBBO Snowy Plover Report 2014
10
CDFW biologists found and monitored 13 Snowy Plover nests at the Napa-Sonoma Marshes Wildlife Area in the North Bay, of which 8 hatched (K. Taylor, pers. comm.). Monitoring efforts at the Hamilton Wetlands Restoration site in Novato are unclear and may have performed by the United States Army Corps of Engineers (USACE; J. Wood, pers. comm.).
In 2014, SFBBO participated in the pilot year of a study initiated by the Institute for Wildlife Studies (IWS) which investigated alternative methods of calculating reproductive success. As part of this study, we banded 50 Snowy Plover chicks and 25 adults from nests that successfully hatched within predetermined study plots. Fifty two chicks were banded in all of RU3 during the 2014 season. From band re-sighting surveys, we determined that at least 13 of these 52 chicks survived to fledging (31 days post-hatching) as of December 30, 2014. Our apparent fledging success is 27%. During avian predator surveys, we counted California Gulls (Larus californicus) and unidentified gulls (Larus spp.; likely California gulls due to the time of year and locations) as the most numerous potential avian predators in plover nesting areas. Northern Harriers (Circus cyaneus), Red-tailed Hawks (Buteo jamaicensis), Peregrine Falcons (Falco peregrines), and corvids (Corvus spp., Common Ravens (Corvus corax) and American Crows (Corvus brachyrhynchos)) were among other commonly sighted predatory species. SFBBO and the Refuge began a pilot Snowy Plover habitat enhancement study in the winter of 2008 at Eden Landing. Enhancements consisted of oyster shells spread by hand at densities of 5-8 shells/m2 over fifteen 1-ha plots, and removal or modification of potential predator perches. This study indicated that oyster shell habitat enhancement increased plover nest abundance and nest success. With support from the findings from this pilot study, we began a large scale habitat enhancement project in September of 2014 at Eden Landing pond E14, where 55 pond acres were treated with oyster shells at the previously tested density. This large scale habitat enhancement will ideally increase the amount of camouflage and cover for nesting plovers, and increase nesting and fledging success. In future years, we recommend that the South Bay Salt Pond Restoration Project (the Project) carefully plan Phase II construction activities to avoid negatively impacting breeding Snowy Plovers. We propose that alternative breeding habitat be provided when construction activities impact Snowy Plover nesting ponds. We also recommend beginning construction activities before plover breeding season begins, and, if possible, discouraging plovers from using ponds where construction activities are taking place, as long as sufficient alternate habitat is available. As more areas are opened to tidal action or converted to ponds with islands, the Project and local land managers will need to take great care in maintaining enough Snowy Plover nesting habitat to preserve and increase the number of nesting plovers in the South Bay. With the completion of Phase I Project restoration in Eden Landing, we recommend that new or existing levee trails in close proximity to Snowy Plover nesting ponds be kept closed to the public during
SFBBO Snowy Plover Report 2014
11
the breeding season to minimize impacts from human disturbance. We also propose continued adaptive management and/or enhancement of Snowy Plover nesting sites. The Project and other restoration projects will affect Snowy Plovers in multiple ways, and managers and researchers should continue to study and monitor the plovers in the South Bay to reduce impacts in the future. INTRODUCTION AND BACKGROUND The Pacific Coast population of the Western Snowy Plover (Charadrius nivosus nivosus, Snowy Plover) breeds along or near tidal waters and is behaviorally distinct from the interior population (Funk 2006). Coastal-breeding Snowy Plovers have declined as a result of poor reproductive success, likely due to habitat loss, habitat alteration, human disturbance, and increasing predation pressure (Page et al. 1991, USFWS 2007). In response to this decline, the U.S. Fish and Wildlife Service listed the Pacific Coast Western Snowy Plover population as federally threatened in 1993 (USFWS 1993). Western Snowy Plover Recovery Unit 3 consists of the San Francisco Bay and includes Napa, Alameda, and Santa Clara counties, and the eastern portion of San Mateo County (USFWS 2007). Plovers in this Recovery Unit nest almost exclusively in dry salt panne habitat provided by former salt evaporation ponds. In 1992, the Don Edwards San Francisco Bay National Wildlife Refuge (Refuge) began surveying for Snowy Plovers on Refuge lands. The Refuge developed five goals for its Snowy Plover Recovery Program: 1) identify areas used by Snowy Plovers for foraging, roosting, and nesting, 2) estimate Snowy Plover numbers, including the number of breeding pairs, 3) determine nest success, 4) assess predation pressures on Snowy Plovers, and 5) protect Snowy Plover breeding areas from predators and other disturbances. The Refuge joined with the California Department of Fish and Wildlife (CDFW) in 2000 to survey for Snowy Plovers at Eden Landing Ecological Reserve (Eden Landing). The San Francisco Bay Bird Observatory (SFBBO) and the Refuge have been jointly monitoring plovers and determining nest fates since 2003. From 2003-2014, SFBBO conducted annual Western Snowy Plover monitoring and research in support of the goals set forth by the Refuge. Specifically, we: 1) identified areas used by Snowy Plovers through regular surveys of all potential nesting habitat from March through September, 2) participated in U.S. Fish and Wildlife Service-coordinated breeding and winter window counts to estimate Recovery Unit 3 numbers, 3) recorded nest fates, nest densities, and chick fledging rates through nest-monitoring and chick-banding, 4) identified potential predators of Snowy Plover nests and chicks through avian predator surveys, and 5) identified areas of potential disturbances from predators, trespass, construction activities and other human activities. In 2013, the Institute for Wildlife Studies (IWS) proposed a study to investigate an alternative method of measuring Snowy Plover reproductive success. This effort would more accurately assess plover recovery, specifically the recovery metric of number of fledged chicks per male.
SFBBO Snowy Plover Report 2014
12
Rather than relying on current methods which involve individually marking and resighting a large portion of the population, this proposed approach relies on statistically valid estimates of reproductive success based on marking and resighting a targeted sample of the population. All chicks from a brood and the associated adult male responsible for rearing the brood to fledge are included in the sample population. This new approach aims to alleviate many of the current pressures and concerns involved with high intensity color band marking and resighting methods which include limited band combinations, staffing and funding resources and field limitations. SFBBO participated in the pilot year of this study in the South Bay during the 2014 breeding season and will continue in 2015. Subsequent years of study will be conducted by additional organizations including Humboldt State University (HSU) and Point Blue Conservation Science (PBCS) at coastal breeding sites. The South Bay Salt Pond Restoration Project (the Project) plans to restore 15,100 acres of former salt evaporation ponds to tidal marsh and managed ponds. Despite the loss of potential Snowy Plover breeding habitat (dry salt ponds) expected overall through the Project’s actions, the Project has set a management target of maintaining 125 breeding pairs of Snowy Plovers within its footprint (USFWS and CDFW 2007). To aid in achieving this goal, SFBBO and the Refuge initiated a large-scale oyster shell habitat enhancement project, informed by the previous pilot studies from 2008-2014, on Eden Landing pond E14. Enhancements were made in September and October 2014 and will also include removing or modifying potential raptor perches from the surrounding ponds and levees. This area will be monitored during the 2015 nesting season. In this report, we summarize results from the 2014 breeding season, including data on Snowy Plover nest distribution and plover habitat use, nest (hatching) success, fledging success, habitat enhancement studies, and avian predator abundance and distribution. Although we report Snowy Plover numbers in the North Bay and at Hayward Regional Shoreline, this report focuses on Snowy Plover activity in the South San Francisco Bay, south of the San Mateo Bridge. METHODS
Study Area SFBBO and Refuge staff conducted Snowy Plover and predator surveys in the South San Francisco Bay (South Bay) ponds, which includes the area just north of the San Mateo Bridge (Highway 92) and extends to the extreme southern portion of the Bay (Figure 1). The South Bay contains the majority of the Snowy Plover habitat in the Bay Area. CDFW biologists surveyed and contributed nesting information this year at one site in the North San Francisco Bay (North Bay; Figure 2). Additionally, SFBBO volunteers monitored lower priority sites with potential Snowy Plover habitat in the South Bay. These surveys provide full coverage of all Snowy Plover breeding habitat in Western Snowy Plover Recovery Unit 3.

SFBBO Snowy Plover Report 2014
13
The Refuge includes approximately 30,000 acres of former salt ponds, tidal marsh, mudflats, and uplands in the South Bay (Figure 1). For this study, we divided the Refuge into six geographic locations: Warm Springs (Figure 3), Alviso, including Mountain View (Figure 4), Ravenswood (Figure 5), Coyote Hills, Dumbarton, and Mowry (Figure 1). Alviso pond A2E is owned and managed by the Refuge while Crittenden Marsh is owned and managed by the National Aeronautics and Space Administration, Ames Research Center (NASA). This area is collectively termed Mountain View for the purposes of this report. CDFW owns and manages Eden Landing (formerly known as Baumberg), which includes approximately 5,500 acres of former salt ponds, marsh, and tidal habitat (Figure 6). CDFW also owns and manages the Napa-Sonoma Marshes Wildlife Area, including ponds 7 and 7a, the Wingo Unit, and the Green Island Unit/Napa Plant Site (Table 2, Figure 2). Hayward Area Recreation and Park District (HARD) owns the land directly north of Highway 92, on the east side of the San Francisco Bay, which is co-managed by East Bay Regional Park District (EBRPD; Figure 1). This area includes potential Snowy Plover foraging and nesting habitat in the Oliver Brothers North and Frank’s Dump West ponds. EBRPD manages an island constructed for California Least Terns (Sternula antillarum brownii) within treatment ponds that is also used by nesting Snowy Plovers. Hamilton Wetlands Restoration site at the former Hamilton Army Airfield is located in Novato. This area has provided Snowy Plover foraging and nesting habitat on a dry area within the tidal restoration site. Nesting plovers were detected and anecdotally documented among breeding Least Terns within the Montezuma Wetlands Restoration Project footprint in Solano County, CA by contracted biologists. Snowy Plover nesting information is not officially reported for this year due to inconsistent survey methods. Snowy Plover Surveys Snowy Plovers in the San Francisco Bay nest predominantly on dry former salt evaporation ponds. To document areas used by Snowy Plovers and to estimate the number of Snowy Plovers in the South Bay, we identified ponds with potential nesting habitat and surveyed those ponds weekly. We surveyed other ponds with less suitable (i.e., ponds without dry salt panne) habitat monthly. From March 1 to August 31, 2014, SFBBO and agency biologists, interns, and volunteers surveyed the ponds by driving slowly on the levees or walking levees without vehicle access. We stopped approximately every 0.3 miles to scan for Snowy Plovers with spotting scopes. During each survey, we recorded the number and behavior of all Snowy Plovers present, identified the sex and age class of each individual using plumage characteristics (Page et al.
SFBBO Snowy Plover Report 2014
14
1991), and marked the approximate location of sightings on a geo-referenced map. We also recorded the color-band status, and combination if appropriate, of any banded plover sighted. In total, SFBBO and Refuge biologists and interns surveyed 15 Refuge ponds, 3 Mountain View ponds and marshes and 16 Eden Landing ponds weekly (Table 1, Table 2). Crittenden Marsh in Mountain View is owned by NASA Ames Research Center and we coordinated our weekly surveys with their NEPA compliance representatives and staff biologists. SFBBO plover volunteers surveyed the HARD ponds monthly. Rather than visit monthly, SFBBO volunteers scouted some areas of the Napa-Sonoma Marshes Wildlife Area (NSMWA) and some low-priority Eden Landing ponds, on occasion, to check for possible nesting activity during the season (Table 3). CDFW biologists increased their nest monitoring efforts at NSMWA in 2014 due to construction on pond 7/7A. SFBBO staff biologists also surveyed the Coyote Hills, Dumbarton, and Mowry salt pond complexes twice in the Spring quarter and once in the Summer quarter as part of SFBBO’s Cargill salt pond waterbird surveys (see Washburn et al. 2014 for methods); it is important to note that the Cargill survey methods are designed to document waterbird abundance and distribution rather than Snowy Plover nesting activity, so they may not adequately detect plover nests. However, very limited habitat is available in these areas. From May 18-24, we participated in the Pacific Coast Snowy Plover breeding window survey. This survey was coordinated by the U.S. Fish and Wildlife Service as part of an annual, regional effort to census all coastal-breeding plovers during the same week. In Recovery Unit 3, the survey covered Refuge, Eden Landing, NSMWA, and HARD ponds, and we used the same methods for sighting and counting plovers as described above. Nesting plovers were anecdotally documented among breeding Least Terns within the Montezuma Wetlands Restoration Project footprint in Solano County, however these numbers are not included in the 2014 breeding window survey due to inconsistent survey methods.
Nest Monitoring We located Snowy Plover nests by scanning for incubating females during weekly surveys. We then searched for nests on foot and recorded nest locations with a GPS unit (Garmin® GPS 60 or Garmin® eTrex Venture HC). Volunteers located nests visually during monthly surveys, marked the location of the nest on a map, and described nearby landmarks. Later, SFBBO or Refuge staff searched for the potential nests on foot; volunteers did not depart levees or established trails to search for nests on the ponds. We monitored nests weekly until we determined the fate of the nest. On each visit, we recorded whether the nest was still active (eggs present and adults incubating), and the number of eggs or chicks in the nest. We floated the eggs (Hays and LeCroy 1971) to estimate egg age. Snowy Plover nests are active for an average of 33 days, from initiation (the date the first egg was laid) to hatching (Warriner et al. 1986), and using the known egg age, we calculated the nest initiation date and predicted hatch date for all nests monitored. When
SFBBO Snowy Plover Report 2014
15
there were no longer eggs in the nest, we assigned each nest a fate based on evidence seen at the nest (Mabee 1997). Nest fates included: hatched, depredated, flooded, abandoned, unknown, or other. In addition, we recorded whether the nest was located in an oyster shell enhancement or control plot (see Oyster Shell Habitat Enhancements methods below), or IWS plot (see IWS Reproductive Success Study methods below). We defined a nest as successful if it hatched at least one egg. We calculated apparent nest success as the percentage of nests that successfully hatched at least one egg out of the total nests monitored. Additionally, we calculated apparent nest densities by dividing the number of nests found on a given pond by the total pond area in hectares. We note that the pond areas used should be viewed with caution since they represent only a rough gauge of potentially available nesting habitat. The amount of available habitat in the ponds changes throughout the season, depending on water management and evaporation. As a result, the actual nest density is very difficult to calculate. Chick Color Banding Beginning in 2008 and continuing through the 2014 breeding season, SFBBO and Refuge biologists banded Snowy Plover chicks to study their movements and to estimate fledging success rates for the South Bay. To band chicks, biologists checked nests daily, starting four days before the estimated hatch date when time allowed. Snowy Plover chicks are precocious. Therefore, we attempted to time our arrival at nests when chicks had just hatched but had not yet left the nest scrape. We banded each chick with a unique four-color combination, placing two bands on each lower leg of a chick. Each combination consisted of three darvic or acetal color bands and one silver U.S. Fish and Wildlife Service band wrapped in auto pin-striping tape to act as the fourth color in the combination. Darvic color bands are becoming increasingly unavailable; acetal bands are a useful replacement. We defined a fledged chick as one that survived to 31 days of age. At that point, chicks are considered to be capable of flight (Warriner et al. 1986). We calculated apparent fledging success as the percentage of fledged, banded chicks out of the total chicks banded. Since re-sighting banded chicks on salt panne habitat is extremely difficult, this method of estimating fledging success has limitations (see Discussion for further explanation). IWS Reproductive Success Study IWS recently initiated a study to measure the reproductive success of Snowy Plovers by banding and monitoring a sample of the breeding population, rather than using the traditional method of banding as many hatchlings as possible. In an effort to monitor a targeted sub-sample in the South Bay, SFBBO designed study plots in preselected ponds based on typical patterns in seasonal nest densities and nest locations. A total of five study plots, each measuring 500m by
SFBBO Snowy Plover Report 2014
16
200m, were surveyed every week for Snowy Plover adult, nest and chick activity. Two plots were established on Refuge ponds (RSF2 and R1) and three were established on CDFW ponds (E14, E6B and E8). Refuge plot RSF2 was abandoned in April due to high rates of nest depredation. All chicks and the associated adult male that hatched from nests within the remaining 4 study plots were banded. Plots were monitored weekly until four weeks after the last brood hatched from each plot (Tokatlian et al. 2014a). Adult males were caught at the nest site at sunrise using noose mats, typically a few days before the nest was predicted to hatch to maximize the successful use of limited band combinations and resources. If the adult was not banded by the time the eggs hatched, it was banded concurrently with the brood. We used the same chick banding approach as stated above. All chicks banded by SFBBO in 2014, with the exception of two chicks from one nest, were banded as part of the IWS reproductive success study. Oyster Shell Habitat Enhancements From 2008 to 2010 we placed oyster shell treatments on the ponds at Eden Landing using a randomized block design in order to evaluate the effects of oyster shell enhancements on breeding Snowy Plovers. Each block consisted of two plots placed on the pond bottom, a 1-ha oyster shell treatment plot (shells spread at 5-8 shells/m2) and a 1-ha control plot (no shells or other treatment). Shell plots and respective control plots were monitored from 2009 to 2014. Drake’s Bay Oyster Farm donated the oyster shells, and SFBBO staff, volunteers, and the California Conservation Corps spread the shells by hand. With support from the findings from our 2008-2014 pilot study, we began a large scale habitat enhancement project in September 2014 at Eden Landing pond E14, where 55 pond acres were treated with oyster shells at the previously tested density. Two distinct plots were treated within the pond – a western plot totaling 21 acres and an eastern plot totaling 34 acres. Channels and low lying areas of the pond bottom were avoided when spreading shells due to the potential of sediment deposition and weathering of shells if these areas are flooded for long periods of time. A 300 foot buffer was established between the northern E14 levee and plot boundaries for the same reason, as the northern borrow ditch is subject to flooding. The 300 foot buffer also avoids the encouragement of plover nesting within close proximity of the northern E14 levee, in the possible event that it’s open for public access. Apparent Estimates. We compared apparent nest success and apparent nest densities in shell plots, control plots, and all other Eden Landing nesting areas from 2009-2014 (Table 11). In order to establish more consistency, we modified the definition of “Other ELER” to include only ponds E11, E16B, E15B, E14B, E12, E13, E14, E6A, E6B, E8 and E6 and revised previous years’ estimates to reflect these changes. Nest Survival Models. To determine if the presence of Snowy Plover nests in shell plots influenced the fate of the nests, we used logistic exposure models to estimate daily nest
SFBBO Snowy Plover Report 2014
17
survival (Shaffer 2004) in R (R Development Core Team 2004) of all nests monitored in Eden Landing from 2009 through 2013. These analyses showed that rates of daily nest survival were consistently higher in the shell plots than outside the shell plots over the five year period. In light of these findings, which were consistent over the first five years of the study, we elected not to run logistic exposure models in 2014 assuming similar results. Avian Predator Surveys To identify avian predators in the area that might affect Snowy Plovers, SFBBO and Refuge biologists and interns conducted weekly predator surveys on the same ponds surveyed weekly for plovers (Tables 1-2). Likewise, volunteers conducted monthly avian predator surveys at ponds surveyed monthly for plovers. We defined avian predators as any species that could potentially prey on a Snowy Plover nest, chick, or adult. Species included Common Ravens (Corvus corax), American Crows (C. brachyrhynchos), Northern Harriers (Circus cyaneus), American Kestrels (Falco sparverius), Peregrine Falcons (F. peregrines), Merlins (F. columbarius), Red-tailed Hawks (Buteo jamaicensis), Cooper’s Hawks (Accipiter cooperii), White-tailed Kites (Elanus leucurus), Golden Eagles (Aquila chrysaetos), Great Blue Herons (Ardea herodias), Great Egrets (A. alba), Snowy Egrets (Egretta thula), Loggerhead Shrikes (Lanius ludovicianus), Barn Owls (Tyto alba) and Burrowing Owls (Athene cunicularia). While mammalian predators and their signs (e.g., tracks) were also recorded opportunistically, these surveys were not designed to detect mammals, particularly since many are nocturnal. We conducted avian predator surveys following plover surveys, so human disturbance may have affected detection rates of some species. Observers drove slowly on levees or walked levees without vehicle access, stopping every 0.3 miles to scan for predators. We recorded the number and species of any predators present as well as their behavior at the time of sighting. We marked their approximate locations on a map. In addition, we documented any predator nests in the area and attempted to determine the fate of those nests by observation from a distance. We calculated the average number of predators observed per survey at each pond by dividing the total number of individuals seen in each area by the number of surveys conducted. While most predators probably have a larger territory than a single pond (Strong et al. 2004b), we felt it meaningful to present indices of predator abundance at the pond scale since surveys were conducted at that level, as were inferences about plover breeding success. RESULTS Snowy Plover Surveys
South Bay Overall. During the 2014 Pacific Coast breeding season window survey (May 18-24), we counted 178 adult Snowy Plovers in the Bay (Table 4). We observed a mean of 212 birds per week from March 3 through August 25 in the entire South Bay. We consistently observed the greatest
SFBBO Snowy Plover Report 2014
18
numbers of Snowy Plovers at Eden Landing (Table 4, Figure 7). We documented Snowy Plover nesting activity at 22 South Bay ponds (Figure 9, Figure 10). Refuge. We documented a mean of 81 Snowy Plovers per week from March 3 through August 25 on Refuge property. We observed an average of 42 plovers per week in the Ravenswood complex (Figure 7b). We observed an average of 25 plovers per week in the Warm Springs complex and only 5 plovers per week in the Alviso complex. Pond A2E and Crittenden Marsh (East and West) were treated independently of Alviso for these calculations and yielded an average of 12 plovers per week. We did not survey the Dumbarton ponds in 2014 due to levee maintenance and associated inaccessibility. Eden Landing. We observed the most Snowy Plovers throughout the season at Eden Landing (Figure 7), with a mean of 131 birds observed per week from March 3 through August 25. This was higher than in 2013 when we observed a mean of 115 birds per week during the same time period. Ponds E14 and E8 supported large numbers of Snowy Plovers during the breeding season this year. In early August, we observed particularly large flocks (weekly counts of 200-325 birds, (Figure 7a). Many of these birds may have been staging (for migration) or early arrival wintering birds, since the average number of birds observed per week in these ponds, from early March through July was 118. Nest Abundance and Success
South Bay Overall. In 2014, we determined the fate of 215 Snowy Plover nests in the South Bay. Of these, 107 nests hatched (apparent nest success = 50%), 95 nests were depredated (44%), nine were abandoned (4%), two were flooded (1%) and two failed from unknown causes (1%, Table5, Figure 10). We found a greater number of nests in the South Bay in 2014 than in 2013 (175 nests) though slightly less than 2010 and 2011 (2010: 243 nests, 2011: 224 nests). The predation rate was higher in 2014 than in 2013 and is a likely explanation for higher nest numbers this year as a result of re-nesting attempts (Figure 10). High predation rates are consistent with findings from previous years, serving as the most significant cause of nest failure. Refuge. In 2014, SFBBO determined the fate of 70 Snowy Plover nests on Refuge property (Table 5). We determined the fate of 12 nests in the Warm Springs complex, six of which hatched (50%) and six were depredated (50%). We determined the fate of three nests in the Alviso Complex (in ponds A9 and A13, Table5). Out of these nests, two hatched (67%) and one was flooded (33%). Adjacent to Refuge property, fourteen nests were found in Crittenden Marsh (East and West) in Mountain View and twelve hatched (86%). We determined the fate of 41 nests in the Ravenswood Complex. Of these, 25 hatched (61%) and 10 were depredated (24%), four were

SFBBO Snowy Plover Report 2014
19
abandoned (10%) and two failed from unknown causes (5%). We found the most nests in the Ravenswood complex on pond R1 (16 nests; Table5). Zero nests were found in Alviso ponds A12, A16 and New Chicago Marsh; Mountain View pond A2E; and Ravenswood ponds R2 and R5; all of which were monitored regularly (Table 5). Eden Landing. We determined the fate of 141 Snowy Plover nests at Eden Landing. Of these, 59 hatched (42%), 76 were depredated (54%), five were abandoned (4%), and one was flooded (<1%, Table5). Pond E14 had the most nests (54 nests), followed by pond E8 (32 nests) and pond E13 (19 nests; Table5). The three ponds that comprise the Whale’s Tail system in Eden Landing (E12, E13 and E14) totaled 52% of the nests found in Eden Landing and 34% of the nests found in the South Bay in 2014, lower than in 2013 (82% and 59% respectively; Figure 11). Two of these three ponds (E12 and E13) were dry in 2013 to allow for large scale restoration construction and when completed, were flooded throughout the 2014 season. Fourteen of the nineteen nests in E13 were on the internal graveled levee and dredge berms, and experienced two distinct occasions of depredation. Restoration construction began in June 2014 at four isolated locations around the perimeter of the Whale’s Tail system, which also involved oyster shell delivery, and did not largely impact plover nesting in the area. We documented that the Eden Landing complex hosted 66% of all the nests found in RU3 (Figure 10). Zero nests were found in Eden Landing pond E11 which was intentionally managed for higher water levels in 2014 to provide foraging habitat (Table 5). Hayward Shoreline. EBRPD reported three Snowy Plover nests on the Least Tern Island at HARD. Two of these nests hatched (67%) and one was depredated (33%; D. Riensche, pers. comm.; Table5). SFBBO volunteers at Hayward Regional Shoreline also detected one nest on Oliver Brother’s North salt pond 16, which was subsequently monitored by SFBBO biologists. This nest successfully hatched. Napa-Sonoma Marshes Wildlife Area. CDFW biologists found and determined the fate of 13 nests in the Wingo Unit and pond 7/7A, 8 of which were successful (62%; K. Taylor, pers. comm.; Table5). Montezuma Wetlands. U.S. Geological Survey (USGS) biologists reported Snowy Plovers nesting in the Montezuma Wetlands in Solano County during a survey this year in May. Subsequent conversation with Montezuma Wetlands Project consultants indicated that Snowy Plovers have been seen nesting in previous years among endangered California Least Terns on dredged sediment substrate within the restoration project footprint. During the 2014 breeding season, incidental Snowy Plover nesting information was collected by contracted biologists during their structured Least Tern surveys. Anecdotal information shows a peak number of 13 Snowy Plover adults in four
SFBBO Snowy Plover Report 2014
20
different locations on May 27. Chicks were consistently seen on surveys and one fledgling was visually confirmed, however nest and fledgling success rates cannot be determined without more detailed monitoring. Hamilton Wetland Restoration Area. Monitoring efforts at the Hamilton Wetland Restoration site were unclear this year and may have been performed by USACE personnel. In previous years, Point Blue Conservation Science biologists monitored the area but are no longer involved (J. Wood, pers. comm). Redwood City Cargill Evaporation Ponds. Cargill representatives reported a sighting of one Snowy Plover adult with two chicks in May between active Redwood City evaporation ponds Bittern Pond 9 and Pickle Pond 7b (P. Mapelli, pers. comm). Nearby levee access was restricted while the brood remained. Breeding Chronology Overall, average apparent nest density in the South Bay (across all ponds with dry panne) was 0.14 nests per hectare. We documented the highest apparent nest density in pond E14 at 0.80 nests/ha, nearly twice as high as the next highest nest density in Eden Landing (pond E8 at 0.42 nests/ha; Table 7). The second highest apparent nest density in RU3 was in Crittenden Marsh East (CME) at 0.59 nests/ha (Table 6). CME produced several successful nests on available habitat and will continue to be monitored in future seasons. Other ponds that we surveyed did not support any known nests in 2014 (Table 5 and Table 6). While we recorded the highest number of nests initiated during the week of April 13 (23 nests), nest initiation levels fluctuated throughout April and May with another peak during the week of May 4 (22; Figure 12). Levels continued to fluctuate, though at a lower intensity, for the remainder of the season (Figure 13). The number of active nests peaked during the week of May 4 (77 nests), and again in June (55 nests), displaying the typical pattern of two nesting pulses throughout the season. By mid-July, the number of nests dropped off until the end of the season in late August (Figure 13).
Chick Fledging Success
In large part due to our involvement with the IWS reproductive success study, we banded 52 Snowy Plover chicks in 2014 and determined that at least 14 chicks fledged (27%, Table 8). Two chicks were banded in E13 and one was confirmed fledged (50%; Table 9). Apparent fledging success (all sites combined) was 36% in 2013 (N = 14 chicks), 50% in 2012 (N = 8 chicks), 14% in 2011 (N = 36 chicks), 41% in 2010 (N = 39 chicks), 25% in 2009 (N = 113 chicks), and 29% in 2008 (N = 83 chicks) (Table 8). One chick was banded in June at Ravenswood pond R1 and not seen again until confirmed fledged in December at the Santa Ynez River Mouth, Lompoc (J. Miller, pers. comm.). Given the small sample sizes and difficulty
SFBBO Snowy Plover Report 2014
21
in re-sighting banded chicks, these estimates are difficult to interpret and should be viewed with caution. IWS Reproductive Success Study
All chicks banded, with the exception of two chicks from one nest in pond E13, were banded as part of the IWS reproductive success study (Table 9). We also banded 25 adult Snowy Plovers to aid in our tracking of brood units. The highest apparent fledge success rate was documented in the E14 pond plot, where 11 chicks were banded and seven were confirmed fledged (64%; Table 9). Eleven chicks were banded in the E8 pond plot and one was confirmed fledged (9%). Nineteen chicks were banded in the R1 pond plot and five were confirmed fledged (26%). Six chicks were banded in the E6B pond plot and three chicks were banded in the RSF2 pond plot; zero were confirmed fledged from either pond (Table 9).
We reached our target sample size of six successfully hatched and banded broods per plot in three of the five plots (E14, E8 and R1). Resight surveys began at each study plot when the first hatched nest within that plot was successfully banded. Each plot was surveyed once a week throughout the season and until 30 days after the last nest hatched within that plot, with the exception of plot RSF2 which was abandoned in April due to high rates of nest predation (Tokatlian et al. 2014a).
Oyster Shell Habitat Enhancements
We established 15 1-ha shell plots at Eden Landing prior to the 2014 breeding season. We spread oyster shells over seven plots in the winter of 2008, five plots in the winter of 2009, and three plots in the winter of 2010. Three plots were located on E16B, four plots on E8, four plots on E6B, three plots on E14, and one plot on E6A. For each of these plots, we established a paired control plot at the same time. Due to differences in water management within these ponds, and changes in the substrate on the ponds bottoms, many of the oyster shells are now covered with a layer of sediment and may no longer be functioning as camouflage. In September and October of 2014, contracted restoration crews (Ducks Unlimited and RE Staite) spread two large scale oyster shell plots in E14. Piles of oyster shell were strategically stockpiled along the southern E14 levee during the breeding season and under SFBBO biologist supervision. When Snowy Plover nests and chicks would no longer be impacted in September, oyster shell spreading began (see Appendix A for methods). Apparent Estimates. From 2009-2014, we documented high apparent nest densities in the original 1-ha shell plots compared to control plots (Table 11). In 2014, we found a total of 32 nests in the shell plots and nine nests in the control plots (Table 10). Apparent nest densities were 2.13 nests/ha in the shell plots, 0.6 nests/ha in the control plots, and 0.14 nests/ha in all other areas of Eden
SFBBO Snowy Plover Report 2014
22
Landing combined (Table 11). In 2014 we redefined the “all other ELER” category to include consistently monitored plover nesting ponds (E11, E16B, E15B, E15B, E12, E13, E14, E6A, E6B, E8 and E6) for more accuracy when calculating apparent densities. Apparent nest densities, hatch and depredation rates from previous years were recalculated using these new parameters (Table 11). Apparent nest success (defined as the percentage of nests that successfully hatched at least one egg out of the total nests monitored) inside the plots was 44% while apparent nest success was 33% in control plots and 40% in all other areas of Eden Landing (Table 11). In 2014, apparent depredation rates were higher in control plots than in shell plots. Apparent depredation rates were also higher than apparent hatch success rates in all treatment types.
Nest Survival Models. Results from logistic exposure models which estimated daily nest survival from 2009 to 2013 have been consistent over the five year period. In light of these findings we did not run logistic exposure models in 2014.
Avian Predators
Refuge. We found that California Gulls and unidentified gulls (presumably mostly California Gulls given time of year and location) were the most abundant potential avian predators in all areas of the Refuge (Table 12, Table 13, Table 15). Raptors, corvids, and wading birds were also present in many areas. In Ravenswood, we observed groups of Great and Snowy Egrets foraging throughout the complex and sometimes noted Red-tailed Hawks perched on the PG&E towers and Northern Harriers hunting over the marsh (Table 12). In Alviso, many species were observed roosting and hunting including Common Ravens, Great Egrets, Snowy Egrets and Peregrine Falcons throughout much of the complex (Table 13). Gulls were often seen roosting in large flocks on the A16 nesting islands and extensively on the A9 levee in the established California gull breeding colony. At Warm Springs (ponds A22 and A23), we primarily observed Common Ravens and American Crows (Table 15), often perched on PG&E towers. Mountain View. Similar to the Refuge and Eden Landing ponds, the most abundant potential avian predators at pond A2E and Crittenden Marsh were California Gulls (Table 14). Red-tailed Hawks, and a Peregrine Falcon adult and juvenile were also seen hunting over the marsh nesting area. Eden Landing. The most abundant potential avian predators at Eden Landing were California Gulls and unidentified gulls (Table 16). We also observed Snowy Egrets and Great Egrets using many of the ponds at Eden Landing. In 2014, Great Blue Herons again nested on a former hunting blind in E6B, referred to as the “heron house”. In Eden Landing pond E9, a Peregrine Falcon nest was removed over the 2012/2013 winter season. Throughout the 2014 breeding season, we regularly observed multiple falcons

SFBBO Snowy Plover Report 2014
23
perched, actively hunting or consuming prey on ponds E12-14. We often found feather piles and fresh prey remains on the E14 pond bottom near active plover nests and broods. Hayward Shoreline. We observed low numbers of potential predators at Hayward Shoreline including California Gulls, Northern Harriers, Red-tailed Hawks and White-tailed Kites (Table 17). Napa-Sonoma Marshes Wildlife Area. We observed California Gulls, Common Ravens, Great Blue Herons, Northern Harriers, Red-tailed Hawks and Snowy Egrets at the Napa-Sonoma Marshes Wildlife Area (Table 18). Mammalian Predators We observed Gray Fox (Urocyon cinereoargenteus), Red Fox (Vulpes vulpes), skunks (Spilogale gracilis, Mephitis mephitis), raccoons (Procyon lotor), opossums (Didelphus virginiana), and domestic cats (Felis catus) around plover nesting ponds. In past years, biologists have seen cats jumping over the Eden Landing predator fence, north of E6A, into the Ecological Reserve. The feral cat feeding station present in some previous years did not appear to be active outside the Veasy Street gate during the 2014 breeding season. In the Mountain View area, a group of Google employees that run GCats Rescue are known to feed feral cats at numerous stations near sensitive bird habitat adjacent to Crittenden Marsh. Feral cats are known predators of birds (Dauphine and Cooper 2009). On several occasions we observed evidence of humans trespassing on the ponds that are closed to the public. We saw footprints and bicycle tracks on pond bottoms, which would have disturbed any Snowy Plovers in the area. DISCUSSION
Snowy Plover Surveys We counted 178 Snowy Plovers in the Bay during the May breeding window survey. This number was lower than the 2013, 2011 and 2010 counts, however it was higher than the 2012 numbers. Eden Landing continues to host the majority of the Bay Area’s Snowy Plovers. While the window survey methods provide an index of abundance and allow examination of trends across years and throughout the Pacific Coast, they fall short of providing an exact estimate of the number of breeding Snowy Plovers in the San Francisco Bay. Since few plovers in the South Bay are color-banded, and surveys of all areas take multiple days to complete under existing staffing/resource levels, more precise estimates of the number of Snowy Plovers nesting in Recovery Unit 3 are not currently available. We are currently investigating alternative mark-recapture studies involving additional banding effort and/or other, more intensive methods to provide this information in the future (see also Chick Fledging Success below).
SFBBO Snowy Plover Report 2014
24
Adult abundance has varied in Eden Landing ponds since 2012, particularly in ponds E12-14, as this habitat has continued to change (Figure 19). During 2013, all three ponds were dried and entirely exposed during the breeding season, providing significant roosting, foraging and nesting habitat, and were heavily used by Snowy Plovers. After construction, available habitat in ponds E12 and E13 decreased significantly and adult abundance per week decreased as well (Figure 19). Pre and post breeding season after conversion to shallow ponds, large, single flocks of Snowy Plovers (150 individuals in some cases) have been seen roosting on the new nesting islands and exposed foraging mounds. Though these ponds may now offer less breeding habitat for plovers during the breeding season, they may be provide valuable habitat for wintering plovers. We will continue monitoring plover use of restored ponds and advocate for adaptive management of Eden Landing ponds to support adult plovers. Nest Abundance and Success In 2014, we found 228 nests in our entire recovery unit, the same number of nests as 2011 and more nests than in all but one of the last five years (2009: 175 nests, 2010: 252 nests, 2011: 228 nests, 2012: 138 nests, and 2013: 176). However, we caution that apparent nest numbers alone can be difficult to interpret and may not be a reliable gauge of breeding performance, especially across years or study sites. For example, an increased number of nests could simply reflect a higher number of depredated nests; Snowy Plovers are known to re-nest up to six times in one season (Warriner et al. 1986), and we may have been finding numerous nesting attempts by the same individuals after predation events on previous nests. We currently lack estimates of re-nesting probability for Snowy Plovers in this Recovery Unit. Similarly, when unsuccessful nests are less likely to be found than successful nests, apparent nest numbers will be biased, just as estimates of apparent nest success and apparent nest densities will be, complicating interpretation. Small nest sample sizes in many areas and the reality that some nests probably go undetected each year further obfuscate matters. Apparent nest success estimates ranged widely by pond and pond complex. Many Snowy Plover nests were lost to predation in 2014 and in previous years of study; low nest success is believed to be a critical limiting factor for Snowy Plovers in the South Bay and elsewhere along the Pacific Coast (USFWS 2007, USFWS and CDFW 2007). In 2014, Snowy Plovers nested on ten Refuge ponds. We found 12 nests at Warm Springs and pond A22 experienced higher rates of depredation (72%) than pond A23 (20%). Although we did not locate any nests in 2012 in either of the Warm Springs ponds, nests in this complex in previous years have experienced heavy predation (2013 and 2011). These ponds are located between the Newby Island Landfill and the now closed Tri-Cities Landfill; large numbers of gulls and corvids fly between the landfills during the day and roost nearby. During the breeding season, approximately 9,808 adult California Gulls were counted in the nearby nesting colonies on Mowry ponds M1/M2, M3, and M4/M5, which are adjacent to Warm Springs (Figure 1; Tokatlian et al. 2014b). We also observed large flocks of corvids perched on PG&E towers and
SFBBO Snowy Plover Report 2014
25
foraging in the vernal pool grasslands to the northwest of the Snowy Plover nesting ponds, both this year and in previous years. In Alviso, we observed Snowy Plovers nesting on ponds A9 and A13 when suitable nesting habitat became available due to low water levels within the ponds. Zero nests were found in pond A16 this year, which was under construction for waterbird nesting islands in 2012 and hosted six nests (while still dry) in 2013. Water levels were kept high in New Chicago Marsh to provide habitat for endangered salt marsh harvest mice (Reithrodontomys raviventris); zero Snowy Plover nests were found here. Post 2014 breeding season, 157 plovers were seen roosting on the strip islands within pond A12 suggesting that though Alviso may not host many breeding plovers, it is an important roosting or wintering location. Ravenswood pond R1 hosted the most plover nests in the Ravenswood complex in 2014, with an 81% rate of hatch success. The same trend was seen during the previous two years (100% in 2013 and 92% in 2012) while the cumulative number of nests have been declining through the rest of the Ravenswood complex since 2010. Water level management throughout the Ravenswood complex (R1-5S) is severely limited due to aging water control structures and infrastructure, therefore Ravenswood ponds are heavily subject to seasonal weathering, often creating highly saline habitat (R3-5) during drought years. Control structures in R1-2 are more reliable, and similar to previous years, R1 water levels were raised with Bay intake during the winter for waterfowl habitat and then allowed to dry by seasonal evaporation over the spring months, creating significant Snowy Plover nesting habitat by late May-early June. Though available habitat in each Ravenswood pond varies by year and water level management in the complex is limited, the recent high rates of hatch success in pond R1 encourage as much thoughtful management of this pond as possible during the breeding season in order to support changing Snowy Plover use of the entire complex. For example, Phase 2 of the SBSPRP proposes to create tidal marsh habitat in R4 while improving water management in R3, effectively reducing Snowy Plover habitat in this area overall. Better management of R1 and R3 may help mitigate this loss. Delayed nest abandonment and failure was observed at one R1 nest in July. Based on egg floating techniques by Hays and LeCroy (1971), this nest was predicted to hatch on July 15. The hatching process began July 10 where a female was visually confirmed incubating and all three eggs were physically observed cracked. However, from July 18 – 24, no adult was confirmed incubating the nest (checked on seven occasions for extended periods of time) before physically checking the nest contents. During this time, the three eggs were documented in various stages of hatching and were exposed to cold and rainy weather conditions. Ultimately this nest was deemed abandoned on July 24 after visually monitoring the nest location for six hours with no sign of attending adult; one egg, one dead chick and one hatching chick were found at the nest site. The hatching chick was collected by SFBBO and immediately transported to C. Strong (USFWS) for transport to the Monterey Bay rehabilitation facility; however this chick died in transport. The dead chick and single dead egg found at the nest site were collected by SFBBO.
SFBBO Snowy Plover Report 2014
26
No adults were seen at the nest site for a few days. This nest may have been able to continue hatching even after it had been abandoned. In August 2013, Snowy Plovers were reported on the dry panne habitat in Crittenden Marsh in Mountain View. At this time we began to survey the area weekly until the completion of the 2013 breeding season and continued to monitor the area throughout the 2014 breeding season. In 2014, we observed 12 nests in Crittenden Marsh East, ten of which successfully hatched. As Crittenden Marsh West began to dry, we found two additional nests which both successfully hatched. Broods were consistently seen during surveys though avian predators were common and evidence of human trespass, including footprints and bicycle tire tracks, were commonly seen within nesting habitat. USFWS is coordinating with levee maintenance contractors for Google to install symbolic fencing and signage around the marsh perimeter to deter trespassing which was frequently seen during surveys this year. The northern Crittenden Marsh East levee is an important pedestrian and bicycle commuter link along the San Francisco Bay Trail but should be treated as a sensitive area during the breeding season and possibly closed during this time to prevent negative impacts to nesting Snowy Plovers. Crittenden Marsh may be an important area for plover nesting as the amount of available habitat in the South Bay decreases due to tidal marsh restoration and other activities. We will continue to monitor this site regularly in upcoming seasons. At Eden Landing, Snowy Plovers nested on ten ponds, with the majority of nesting occurring on ponds E14 and E8. In 2013, 82% of plover nests in Eden Landing were found in ponds E12, E13 and E14 and underwent extensive construction during the 2013 breeding season (Figure 17). All three ponds were dry due to construction, which exposed their pond bottoms entirely throughout the 2013 breeding season. In January 2014, ponds E12 and E13 were successfully converted to managed ponds of increasing salinity, with nesting islands and foraging mounds. Internal graveled levees, and berms and nesting islands created with dredge material provide the only exposed habitat, which has been a significantly reduced compared to previous seasons. While 19 nests were found in E13, 74% of them were found on the internal drivable gravel levee and smaller berms which were not necessarily intended for shorebird nesting. Three nests were found on nesting islands in E12 and E13. Likely in response to these restoration changes in ponds E12 and E13, plovers shifted nesting locations to nearby ponds E14 and E8 which accounts for increased nest numbers in these ponds compared to last year. Together, ponds E14 and E8 supported 62% of the nests found in Eden Landing in 2014, an increase from only 39% of the nests found in Eden Landing in 2013. Both ponds together supported 40% of the Snowy Plover nests found in the entire South Bay. Eden Landing ponds will likely continue to be essential breeding habitat for Snowy Plovers in the future, particularly ponds E14 and E8, and should be managed accordingly. Several ponds should be dried during the breeding season. These areas and nesting islands should be supported by removing vegetation, treating or removing large cracks in the ground and controlling for predators.
SFBBO Snowy Plover Report 2014
27
Final construction began at Eden Landing in June 2014 and was restricted to the drivable levees around ponds E12, E13 and E14. SFBBO was contracted by Ducks Unlimited to monitor for breeding plovers within construction areas during the nesting season, and potential impacts by oyster shell deliveries, through September 15. Construction activity was significantly reduced compared to activity during the 2013 season; no significant complications arose from construction activity. CDFW reported that there were 13 Snowy Plover nests this season in the Napa-Sonoma Marshes Wildlife Area. Pond restoration and construction activity required CDFW biologists to monitor pond 7/7A more intensely than previous seasons and the most plover nests were found in this area since 2009. This is the sixth year that the number and fate of nests were documented for the North Bay ponds. In 2010, CDFW completed habitat enhancements to the Wingo Unit and now manages it as a seasonal wetland (K. Taylor, pers. comm.). One nest was found at the Wingo Unit in 2014. Additional Nesting Areas. Snowy Plover breeding data in the Montezuma Wetlands Restoration Project footprint in Solano County was collected opportunistically by contracted biologists this year. SFBBO and the Refuge will continue to try and establish more consistent methods of Snowy Plover monitoring during future breeding seasons. Additional sightings of Snowy Plover broods were reported at Frank’s Dump West in Hayward by SFBBO volunteers, and pond E6C in Eden Landing by SFBBO staff during August and September surveys. We will monitor these areas during the 2015 season to account for any undetected breeding areas. Cargill representatives reported a sighting of one Snowy Plover adult with two chicks in May between active Redwood City evaporation ponds Bittern Pond 9 and Pickle Pond 7b. Chick Fledging Success Throughout the South Bay and largely in association with the IWS reproductive success study, we banded a total of 52 chicks. From band re-sighting, we determined that at least 14 chicks of the 52 banded survived to fledging. We believe that relying on banding and re-sighting plover chicks in the ponds has its limitations and that other methods should be considered in the future to estimate fledging success. The dry salt panne habitat used by plovers is characterized by uneven topography/substrate, which combined with heat waves and long scoping distances, creates very difficult conditions for effective band re-sighting. Considerable effort and planning are also needed to band plovers in the ponds. Chicks must be banded within a couple of hours of hatching (before they become mobile and depart the nest), requiring extremely precise nest age/egg flotation records and frequent nest visitation to accurately predict hatch dates. Use of radio telemetry to track adult males with broods may hold some promise for improving the accuracy of plover fledging success estimates in the San Francisco Bay, but it will also require considerable resources to
SFBBO Snowy Plover Report 2014
28
implement. Regardless of the method used, all must carefully balance the need for more intensive monitoring with the potential impacts caused by increased researcher disturbance to plovers. IWS Reproductive Success Study Beginning in 2014, in an effort led by the Institute for Wildlife Studies (Lead PI: Brian Hudgens), SFBBO conducted rigorous fieldwork which supported statistical analyses in order to test observational approaches to estimate chick survival and fledging success. As part of this study, in 2014 SFBBO banded broods hatched from Eden Landing Ecological Reserve ponds E14, E8 and E6B and the Refuge’s Ravenswood ponds R1 and RSF2. Fifty chicks and 25 associated adults were banded with field readable color bands. Information gathered on the survival of banded chicks will be used to evaluate how well a suite of observational survey methods alone perform in estimating chick survival, compared with more the labor intensive banding method. We will continue similar methods during 2015 with additional organizations including Humboldt State University (HSU) and Point Blue Conservation Science (PBCS) at coastal breeding sites. We hope that this study will provide a set of observational tools that can reliably be used to estimate chick fledging success, and in particular, in identifying techniques that are reliable in the San Francisco Bay Area. Oyster Shell Habitat Enhancements
Apparent Estimates. In 2014, as in previous years of study, we documented higher apparent nest densities in shell plots (2.13 nests/ha) compared to control plots (0.6 nests/ha). Apparent nest success was similar in shell plots (44%) and other areas of Eden Landing (40%) this season, though much lower than in 2013 (73% and 66%, respectively). The number of nests in the shell plots was much higher this year than in the previous two years (Figure 14). This fluctuation of nests in shell plots over the years may be influenced by a variety of factors, including but not limited to the brightness of the shells varying on the plots. Shells in some areas were completely covered in sediment if, for example, the pond was flooded over the winter (E14 plot 2; E16B plot 2; E6B plots 2 and 3; E8 plots 2 and 4;), while shells in other areas remained mostly white (E14 plots 1 and 3; E16B plots 1 and 3; E6B plots 1 and 4; E8 plots 1 and 3). Therefore, there may have been differences in the camouflage benefits provided by shells. Nesting locations in general may be attributed to habitat availability as a result of water level management and habitat conversion, as was seen this year in Eden Landing ponds E14 and E8. Large Scale Enhancement Study. Large scale oyster shell habitat enhancements at Eden Landing pond E14 have provided an exciting opportunity for further research and we have designed a comprehensive monitoring approach to document its effect on Snowy Plover breeding in 2015. Our small scale enhancement studies beginning in 2008 gave promising indication that oyster shells provide
SFBBO Snowy Plover Report 2014
29
beneficial cover for nesting plovers and suggest further breeding benefits on a larger scale. Understanding that some questions and uncertainties regarding oyster shell enhancement still remain, we advocate for an adaptive management approach through enhancement and research, adjusting this approach as needed. For example, concentrated nesting may lead to increased predation if predators learn to cue in on nests in shell plots as Page et al. (1983) found with Snowy Plovers at Mono Lake. Additionally, hatching success does not necessarily translate to overall plover population recovery and long-term habitat or nesting distribution effects have not been evaluated as a result of habitat enhancement. In order to measure these additional benefits and uncertainties, we have designed unique study methods for pond E14’s large shell plots and associated control plots in addition to our regular weekly surveys. These methods will measure the impact that large scale enhancement has on Snowy Plover nest success, fledgling success, brood movement and distribution throughout the pond, nest predation rates and patterns, invertebrate prey abundance and composition, and other soil quality factors. Additional Considerations. As the amount of available Snowy Plover nesting habitat around the Bay is reduced due to tidal marsh restoration, Snowy Plover nesting density will need to increase in order to maintain and/or increase the Snowy Plover breeding numbers within a smaller habitat footprint. Shell plots are one way to achieve the higher nest densities needed to reach the Recovery Unit goal of 500 breeding birds. Oyster shells are no longer available from Drake’s Bay Oyster Company, Marin County, after 2014 therefore it is essential to continue investigating the effectiveness of alternative materials used for habitat enhancement. Treating nesting areas with gravel, wood debris or bivalve shells may provide similar beneficial functions however; we may also need to develop additional strategies to support Snowy Plover recovery. Other possibilities under discussion are expanded predator management/deterrence programs, and improved water control at designated ponds to ensure that dry, open panne habitat is available for nesting, along with nearby wet areas for foraging. Avian Predators California Gulls continue to be the main predator of concern. They were the most abundant predatory species documented at most plover nesting areas in 2014. From 2009-2011, we captured evidence (using remote cameras) that California Gulls directly impact Snowy Plovers through nest predation (Demers and Robinson-Nilsen 2012). In fact, while many nest predators were recorded over the course of the study, California Gulls were the only predator filmed depredating Snowy Plover nests in all three years. California Gulls are well-known predators of other shorebird nests and chicks in the South Bay (Ackerman et al. 2006, Herring et al. 2011). They may also impact other waterbirds through displacement from preferred nesting areas (Strong et al. 2004a). The total number of California Gulls nesting in the South Bay was 53,024 breeding birds in 2014, similar to the 53,458 breeding birds recorded in 2013 (Tokatlian et al. 2014b, Tokatlian and
SFBBO Snowy Plover Report 2014
30
Donehower 2013). Three of the largest gull colonies (Alviso A9/A10/A14 colony, Mowry M4/M5 colony, and the Coyote Hills N3A/N4AB colony) are particularly close to Snowy Plover nesting areas. The former gull colony on pond A6 which previously hosted approximately 23,103 breeding adults (Tokatlian et al. 2010) was restored to tidal action in December 2010. These displaced gulls immediately moved to nearby new or existing colonies in Alviso and have been shown to negatively impact the fledgling success of nesting shorebirds in close proximity (Ackerman et al. 2014). There is growing concern among land managers and conservationists that gulls displaced as a result of ongoing restoration activities in the South Bay will directly colonize sensitive shorebird habitat or continue to significantly impact the nesting success of these sensitive species. From 2011 through 2014, SFBBO and Refuge biologists coordinated a non-lethal gull hazing program and successfully prevented gulls from nesting in areas identified as plover and Least Tern habitat (C. Strong, pers. comm.). This year, hazing methods also included the use of a high powered laser directed at roosting gulls flocks. Continued California Gull hazing and tracking is essential in order to prevent gulls from nesting in sensitive areas in future years. Peregrine Falcons were a significant concern in Eden Landing in 2014 and were consistently seen perched in and hunting over plover nesting areas. Whenever possible, biologists flushed falcons away from sensitive plover habitat and investigated prey remains for evidence of plover predation; none was found. Nesting plovers were visibly affected by Peregrine Falcon activity and on several occasions were seen crouched over nests or flushed entirely for more than several minutes. On one occasion in pond E14, a young plover chick was observed lethargic and almost entirely immobile after a perched Peregrine Falcon was flushed from the area after sunrise. The chick was likely exposed to early morning temperatures as the adult was responding to a predator presence. The attending adults brooded the chick for more than thirty minutes before it was able to move independently again. SFBBO biologists accompanied predator specialists from the United States Department of Agriculture (USDA) in June and attempted to haze the individual Peregrine Falcons without negatively impacting nesting plovers nearby. In an effort to proactively deter Peregrine Falcon activity during the sensitive plover breeding season, we plan to continue removing unnecessary perches and enhancing permanent fixtures with nixalite before the 2015 nesting season begins. Northern Harriers represent another predator of concern. As well as documenting the predation of Snowy Plover nests and chicks with nest cameras in 2009 and 2011, we frequently observed Northern Harriers hunting ponds with Snowy Plover nests. The restoration of marsh habitat in the future will increase potential Northern Harrier nesting habitat in the South Bay. An increase in the local Northern Harrier population may result in higher predation pressure on pond nesting waterbirds, including Snowy Plovers. We frequently observed both Red-tailed Hawks and Common Ravens perched in the transmission towers within ponds at all three Refuge complexes. These species should be discouraged from nesting in the towers, preferably before Snowy Plover nesting season starts.
SFBBO Snowy Plover Report 2014
31
The Refuge coordinated with Pacific Gas and Electric (PG&E) to remove nine Common Raven nests and one Red-tailed Hawk nests in towers over sensitive habitat in 2014 (Strong 2014). The Refuge will continue to coordinate the removal of nests from towers with PG&E annually. Mammalian Predators On several occasions, we saw fox (sp.) walking on dry pond bottoms in the ELER complex and predator specialists from the USDA controlled fox activity in ELER ponds, in addition to avian predators. Several fox individuals were captured from an active den in pond E13 and trapping efforts were temporarily suspended while a Snowy Plover nest remained active within 40 meters of the trap site. We also suspect that the two distinct nest depredation events along the E13 levee were likely a result of mammalian predation, likely fox. The levee offered a continuous accessible walking path to all nests depredated, and mammal tracks and buried shorebird egg remains were found in the loose levee gravel. This area is also within 150 meters of the known E13 fox den. Breeding snowy plovers in South San Francisco Bay experienced significant predation pressure by both avian and mammalian species which raised concerns of failing to meet our IWS study targets, as well as general RU3 plover success. After revisiting the option of using single nest exclosures to improve nest success, we ultimately decided against it because the execution of these units in salt pond habitat is cumbersome and ineffective, and the potential negative impacts were arguably too substantial (Tokatlian et al. 2014a). Single nest exclosures are most effective in protecting nests from corvid species, not necessarily raptors, and assume the potential of plover adult injury or death (Dave Lauten, pers. comms.). Securing exclosures in barren salt pond habitat results in conspicuous manipulation of the substrate (footprints and dig lines in mud) which do not weather away as they do on beach habitat. This would draw further attention from predators and risk adult plover loss (Caitlin Robinson-Nilsen, pers. comms.). Furthermore, exclosures assist rates of nest success but are ineffective in supporting chick survival or fledge success. Under resource constraints, we chose to focus on appropriate predator control for the remainder of the season and decided to take more control measures during the winter before the upcoming 2015 season. USDA predator specialists attempted to haze and trap the avian predators under plover biologist supervision, as well as trap mammalian predators (Tokatlian et al. 2014a). Restoration and Snowy Plover Nesting The majority of the South Bay’s Snowy Plover nesting habitat is located within the South Bay Salt Pond Restoration Project area. The Project aims to restore large areas of former salt ponds to a mix of wetland habitats, including managing former salt ponds as managed wildlife ponds. Some of the ponds that will remain managed wildlife ponds, such as SF2, E12-13, and A16, have had islands constructed on them to provide waterbird nesting, roosting, and shallow-water foraging habitat. One of the Project’s long-term goals is to support 250 breeding Snowy Plover adults within the Project area (USFWS and CDFW 2007).
SFBBO Snowy Plover Report 2014
32
As in past years, SFBBO provided plover monitoring services during construction conducted as part of the Project’s planned restoration activities. In 2014, SFBBO biologists monitored E12, E13 and E14 and communicated real-time locations of plover nests, broods, and adults to crews working in the area and to agency personnel. We have found that weekly meetings and daily, on-the-ground communications are essential in both minimizing the threat to nests and broods due to construction activities and in reducing impacts to contractor work schedules. For future restoration planning, we recommend that the Project work carefully to maintain enough nesting habitat to support the existing population of Snowy Plovers during construction activities. We strongly urge managers to provide nesting habitat in areas adjacent to those ponds being drained for construction to limit Snowy Plovers nesting in construction areas. While this will not stop Snowy Plovers from nesting in the dry construction ponds, it may reduce the number of nests in the construction ponds. Also, if Snowy Plover nesting ponds are to be flooded to exclude Snowy Plovers, managers should begin to drain other nearby ponds in January and February, long before Snowy Plover breeding season in order to provide nesting habitat. We suggest that construction activities on Snowy Plover nesting ponds start after the breeding season whenever possible and that actions be taken before the nesting season starts in order to deter Snowy Plovers from nesting on ponds where heavy equipment will be operating. Although not often feasible, this action would avoid much of the Snowy Plover and construction conflicts. In 2013, flying kites over the pond and placing shiny objects around on the pond bottom did not deter Snowy Plover nesting activity. Focusing the construction in a small footprint and keeping the human disturbance constant (throughout daylight hours/seven days a week) may help reduce the number of Snowy Plovers nesting in the area. This year, 34% of Snowy Plover nests in the South Bay were found within Eden Landing construction areas E12-14 and construction activity itself was limited to four independent locations along perimeter levees. This created significantly less impact compared to last year where 59% of the Snowy Plover nests in the South Bay were within the construction area, throughout ponds E12-14. Short term levee maintenance was also performed in Mountain View along the Crittenden Marsh East levee. SFBBO and USFWS provided safety buffer locations and monitoring support during these events. Though impacts were limited, we nevertheless approached construction monitoring with the same standards and guidelines as in previous years, establishing safety buffers and clearing all impacted areas before work began, including oyster shell deliveries, on a daily basis. In future years, we recommend focusing construction in small, localized footprints and outside of the breeding season to reduce potential impacts on Snowy Plover breeding. The largest impact that the Project will have on South Bay Snowy Plovers is the long-term reduction of nesting habitat as dry ponds are opened to tidal action or managed with higher water levels. We recommend converting ponds to tidal action slowly, and studying the impacts
SFBBO Snowy Plover Report 2014
33
to breeding Snowy Plovers. Many of the first ponds to be opened to tidal action or converted to ponds with islands have historically hosted large numbers of Snowy Plovers (A8, E12-13 and E8A; Figure 14, Figure 16, Figure 17 and Figure 18), and losing these nesting ponds may reduce the number of Snowy Plovers nesting in the San Francisco Bay Area, although this has not yet happened. Nest numbers increased in 2014 compared to previous years however this may be a result of renesting attempts in response to higher rates of predation, and the number of breeding adults has decreased compared to previous seasons (Figure 18). Snowy Plovers in the San Francisco Bay prefer to nest in dry ponds or on large, open salt panne areas located near foraging habitat. While we found seven nests on SF2 islands and one on A16 islands since their operation as managed ponds, it is unknown how many pairs the created islands in ponds A16, SF2 and E12-13 will support in the future. In 2011, the newly created islands on pond SF2 formed large cracks as the mud dried and two dead Snowy Plover chicks were found in these cracks on one island. Due to the nature of Bay mud sediments, we expect cracking to occur on such islands elsewhere. The new islands constructed in E12 and E13 were treated with gravel, shell and lime to prevent cracking and to enhance nesting habitat. Future island-building projects are planned to include plowing and sand or other toppings in order to limit the negative effects of cracking mud. The USFWS will be implementing a social attraction effort on islands in ponds RSF2 and A16 over the 2013/14 winter season involving decoys and audio equipment. This project targets Caspian Terns as part of long-standing mitigation effort, and now includes Snowy Plover and Forster’s Tern (decoys only) social attraction in order to maximize the ecological benefits on these breeding ponds. USFWS, USGS and SFBBO will be involved in monitoring the effects of this social attraction project in 2015. Another goal of the SBSPR Project is to increase public access in certain areas. Currently, most Snowy Plover nesting areas are closed to the public. Snowy Plovers in the South Bay are very sensitive to recreational disturbance and flush from their nests when walkers are at an average 164 m when approached directly, or 145.6 m when passed tangentially (Robinson 2008 and Trulio et al. 2012). Therefore, public access should be limited or prohibited on trails adjacent to Snowy Plover nesting ponds during the breeding season (March-August) and managers should consider strategies to close areas if Snowy Plovers nest on or close to the trails. Additionally, fencing or barriers that limit pedestrians and cyclists from entering sensitive nesting areas and reduce human disturbance should be installed. Managers should also consider low fencing such as is present at SF2 to keep Snowy Plover chicks off of trails and roads. Overall, larger tracts of land may need to be kept free of public access entirely, in order to accommodate sensitive species, such as Snowy Plovers.
SFBBO Snowy Plover Report 2014
34
RECOMMENDATIONS
Research Recommendations Future research involving Snowy Plovers and their nesting areas within the ponds should include projects that address the following topics:
1. Expanded banding and/or tracking via telemetry of chicks and adults to provide more reliable data on Snowy Plover survival rates. This is vital information to reaching the recovery goal of 500 birds in Recovery Unit 3.
2. Snowy Plover use of the ponds for foraging and roosting during the non-breeding season.
3. Impacts of California Gulls on nesting Snowy Plovers. 4. Potential impacts of human disturbance from recreational trail use at Eden Landing and
SF2 as well as other sites. 5. The effects of avian predator management on Snowy Plover breeding success. 6. Northern Harrier territory size and habitat use and impacts on nesting Snowy Plovers,
especially as tidal marsh nesting habitat increases for harriers. 7. Snowy Plover foraging habitat use (borrow ditches, open channel, muted tidal, shallow
pools, dry substrate) and invertebrate prey availability within the salt ponds. 8. Snowy Plover nesting habitat selection (use versus availability). 9. Nest success of Snowy Plovers on islands in managed ponds.
Monitoring Recommendations
1. The Recovery Unit 3 Snowy Plover monitoring program should continue. Monitoring numbers of breeding birds and reproductive performance is important to track progress towards recovery goals and the response of plovers to management actions, including the effects of salt pond restoration.
2. Recovery Unit 3 should identify other potential Snowy Plover breeding habitat in the San Francisco Bay area, outside of the South Bay Salt Pond Restoration Project area, that can be managed for plovers. Based on the number of nests found in the San Francisco Bay in recent years, nearly all are within the Project area. A goal of the Project is to support 250 breeding adults; therefore, in order to reach this target in the San Francisco Bay, additional habitat may need to be identified and managed for plovers, though we recognize that this will be no easy task.
3. Monthly surveys should continue to include scouting components to visit areas that are not usually used by Snowy Plovers, including Frank’s Dump locations in Hayward and pond E6C in Eden Landing. As the amount of salt pond habitat decreases, plovers may use historical or new areas for nesting within the South Bay.
4. SFBBO, along with the Refuge, should continue to coordinate monitoring efforts in lower priority sites where Snowy Plovers have been seen breeding throughout RU3.
5. SFBBO should continue to implement a comprehensive research study of large scale oyster shell habitat enhancement and its effects during future breeding seasons.
SFBBO Snowy Plover Report 2014
35
6. SFBBO, along with CDFW and the Refuge, should develop a Snowy Plover outreach program in areas that will be open to the public within the next few years. Actions should be taken now to educate the public on Snowy Plover conservation and disturbance issues.
a. Interpretive panels could be placed in areas open to the public to educate people on Snowy Plover habitat needs, and disturbance and conservation issues (such as the panel at pond SF2).
Management Recommendations
1. Refuge and CDFW management should continue to meet Snowy Plover habitat requirements by: a) providing areas of drying ponds with nearby high salinity foraging habitat and b) managing ponds in several areas around the South Bay for Snowy Plovers to reduce impacts from predation, flooding, or disease.
2. If construction activities are taking place on ponds where Snowy Plovers are nesting, or on levees in between nesting and foraging ponds, there should be a trained biologist onsite during working hours to minimize impacts to Snowy Plovers.
3. If construction takes place adjacent to or within a Snowy Plover nesting area, then weekly meetings should be coordinated with all parties involved so that everyone understands their roles and expectations in regards to minimizing impacts to listed species.
4. The South Bay Salt Pond Restoration Project should continue to explore ways to minimize or mitigate cracking on newly created islands to prevent loss of newly hatched chicks.
5. The predator management and gull hazing programs should continue in 2015 in the South Bay.
6. Managers should continue to explore using habitat enhancements (oyster shell or other) as a tool for Snowy Plover recovery, and spread them in areas that will not be flooded for long periods of the winter.
7. Water levels in pond A23 should be raised over the winter to prevent nesting and roosting by California Gulls.
8. Water levels should be kept higher or interior channels should be added to pond E16B to increase the amount of foraging habitat in this pond.
9. If the Ravenswood ponds R1 and R2 are to support more Snowy Plovers in the future, the ponds should be drained before the breeding season begins, to expose the panne habitat for nests. Also, in ponds R3 and R4 water levels in the borrow ditches should be higher in order to keep water in the interior channels. This may enhance foraging habitat, and potentially, the numbers of Snowy Plovers using the complex. More water control structures could be added to the entire Ravenswood pond system to improve water management.
10. Managers and biologists should continue to work with PG&E to remove predator nests from the towers. Tower design modifications should be researched to discourage ravens and Red-tailed Hawks from nesting in the towers near Snowy Plover habitat. Structures
SFBBO Snowy Plover Report 2014
36
should be removed or treated with a bird deterrent such as nixalite to discourage predator perching.
11. Law enforcement patrols should be increased in areas with Snowy Plover breeding habitat to minimize disturbance from humans. This will become progressively more important as additional areas are opened to the public as part of the Project.
12. All researchers who are out on the ponds during the nesting season should continue to coordinate with SFBBO and the Refuge to minimize disturbance to Snowy Plovers.
ACKNOWLEDGEMENTS In 2014, Western Snowy Plover monitoring was supported by the U.S. Fish and Wildlife Service, the California Department of Fish and Wildlife, and Ducks Unlimited. Past program support and in-kind contributions were provided by the California Coastal Conservancy, CDFW, H. T. Harvey and Associates, U.S. Geological Survey, Triton Marine, McMillen LLC , Santa Clara Valley Water District, Orange County Community Foundation, Oracle, and Drake’s Bay Oyster Farm. We are especially grateful to Cheryl Strong of the Don Edwards San Francisco Bay National Wildlife Refuge and John Krause of CDFW for logistical support at Eden Landing. We thank SFBBO biologist Ben Pearl, SFBBO interns Jessica Gonzalez and Emily Moffitt, and SFBBO support staff Natalie Washburn and Jason St. Pierre. We also thank our dedicated volunteers, Diane and Tom Bennett, Ann Graham, Bill and Tanya Hoppes, Richard Jeffers, Mike Mammoser, Cindy Margulis, Spike Marlow, Dolores Morrison, Brenda Senturia, John Robeson, Mike Rogers, and Jackie Vargo for conducting plover surveys. Karen Taylor of CDFW, David Riensche of EBRPD, Rachel Bonnefil of ACTA Environmental and Anne Wallace of EcoBridges Environmental Consulting, and Megan Elrod and Julian Wood of Point Blue Conservation Science for contributing information about plover nesting activity in Napa, Hayward Shoreline, Montezuma Wetlands Restoration area and Hamilton Wetland Restoration area, respectively. REFERENCES Ackerman, J. T., Herzog, M. P., Hartman, A. C., and Herring, G. 2014. Forster’s tern chick survival in response to a managed relocation of predatory California gulls. The Journal of Wildlife Management 78(5): 818-829. Ackerman, J. T., J. Y. Takekawa, C. Strong, N. Athearn, and A. Rex. 2006. California Gull distribution, abundance, and predation on waterbird eggs and chicks in South San Francisco Bay. Final report. U.S. Geological Survey, Western Ecological Research Center, Davis and Vallejo, CA. Dauphine, N. and R. Cooper. 2009. Impacts of Domestic Free Ranging Cats (Felis Catus) on Birds in the United States: A Review of Recent Research with Conservation and Management
SFBBO Snowy Plover Report 2014
37
Recommendations. Proceedings of the Fourth International Partners in Flight Conference: Tundra to Tropics. 205–21 Demers, S. A. and C. W. Robinson-Nilsen. 2012. Monitoring Western Snowy Plover nests with remote surveillance systems in the San Francisco Bay, California. Journal of Fish and Wildlife Management 3: 123-132. Funk, W., T. D. Mullins, and S. M. Haig. 2006. Conservation genetics of North American and Caribbean Snowy Plovers (Charadrius alexandrinus) - population genetic structure and delineation of subspecies. U.S. Fish and Wildlife Service. Catalog No: 1522. Hays, H. and M. LeCroy. 1971. Field criteria for determining incubation stage for the Common Tern. Wilson Bulletin 83: 425-429. Herring, G., J. T. Ackerman, J. Y. Takekawa, C. A. Eagles-Smith, and J. M. Eadie. 2011. Identifying nest predators of American Avocets (Recurvirostra americana) and Black-necked Stilts (Himantopus mexicanus) in San Francisco Bay, California. The Southwestern Naturalist 56:35-43. Mabee, T. J. 1997. Using eggshell fragments to determine nest fate of shorebirds. Wilson Bulletin 109: 307-313. Page, G. W., L. E. Stenzel, W. D. Shuford, and C. R. Bruce. 1991. Distribution of the Snowy Plover on its western North American breeding grounds. Journal of Field Ornithology 62: 245-255. Page, G. W., L. E. Stenzel, D. W. Winkler, and C. W. Swarth. 1983. Spacing out at Mono Lake: breeding success, nest density, and predation in the Snowy Plover. Auk 100: 13-24. Robinson, C. 2008. Western Snowy Plover use of managed salt ponds at Eden Landing, Hayward, CA. M.S. thesis. San Jose State University, San Jose, CA. Robinson-Nilsen, C. and J. Demers. 2012. California Gull breeding surveys and hazing project, 2011. Unpublished report. San Francisco Bay Bird Observatory, Milpitas, CA. Shaffer, T. L., 2004. A unified approach to analyzing nest success. Auk, 121: 526–540. Strong, C. 2014. Avian predator nest removal; Summer 2014. Unpublished report. Don Edwards San Francisco Bay National Wildlife Refuge, USFWS. Strong, C. M., L. B. Spear, T. P. Ryan, and R. E. Dakin. 2004a. Forster’s Tern, Caspian Tern, and California Gull colonies in the San Francisco Bay: habitat use, numbers, and trends, 1982-2003. Waterbirds 27: 411-423.

SFBBO Snowy Plover Report 2014
38
Strong, C. M., N. Wilson, and J. D. Albertson. 2004b. Western Snowy Plover numbers, nesting success and avian predator surveys in the San Francisco Bay, 2004. Unpublished report. San Francisco Bay Bird Observatory, Alviso, CA. Tokatlian, K., C. Robinson-Nilsen, and J. Demers. 2010. Colonial waterbird nesting summary for the South San Francisco Bay, 2010. Unpublished report. San Francisco Bay Bird Observatory, Milpitas, CA. Tokatlian, K., Scullen, J., Burns, C. 2014a. Alternative methods of measuring Snowy Plover reproductive success in the San Francisco Bay. Unpublished report. San Francisco Bay Bird Observatory, Alviso, CA. Tokatlian, K., Butler, K., Burns, C. 2014b. Citizen science-based colonial waterbird monitoring 2014 nesting summary. Unpublished report. San Francisco Bay Bird Observatory, Alviso, CA. Trulio, L., C. Robinson-Nilsen, J. Sokale and K. D. Lafferty. 2012. Report on Nesting Snowy Plover Response to New Trail Use in the South Bay Salt Pond Restoration Project. Unpublished report. U.S. Fish and Wildlife Service. 1993. Endangered and threatened wildlife and plants; determination of threatened status for the Pacific Coast population of the Western Snowy Plover, final rule. Federal Register 58: 12864-12874. U.S. Fish and Wildlife Service. 2007. Recovery plan for the Pacific Coast population of the Western Snowy Plover (Charadrius alexandrinus nivosus). In 2 volumes. Sacramento, CA. xiv + 751 pp. Western Snowy Plover (Charadrius alexandrinus nivosus) Pacific Coast population draft recovery plan. Portland, OR. xix + 630 pp. U. S. Fish and Wildlife Service and California Department of Fish and Game. 2007. South Bay Salt Pond Restoration Project final environmental impact statement/environmental impact report. Prepared by EDAW, Philip Williams and Associates, Ltd., H. T. Harvey & Associates, Brown and Caldwall, and Geomatrix. Available: http://www.southbayrestoration.org/EIR/downloads.html. Warriner, J. S., J. C. Warriner, G. W. Page, and L. E. Stenzel. 1986. Mating system and reproductive success of a small population of polygamous Snowy Plovers. Wilson Bulletin 98: 15-37. Washburn, N., Scullen, J., Burns, C. 2014. Salt pond waterbird surveys data summary September 2013 – August 2014. Unpublished report. San Francisco Bay Bird Observatory, Alviso, CA.
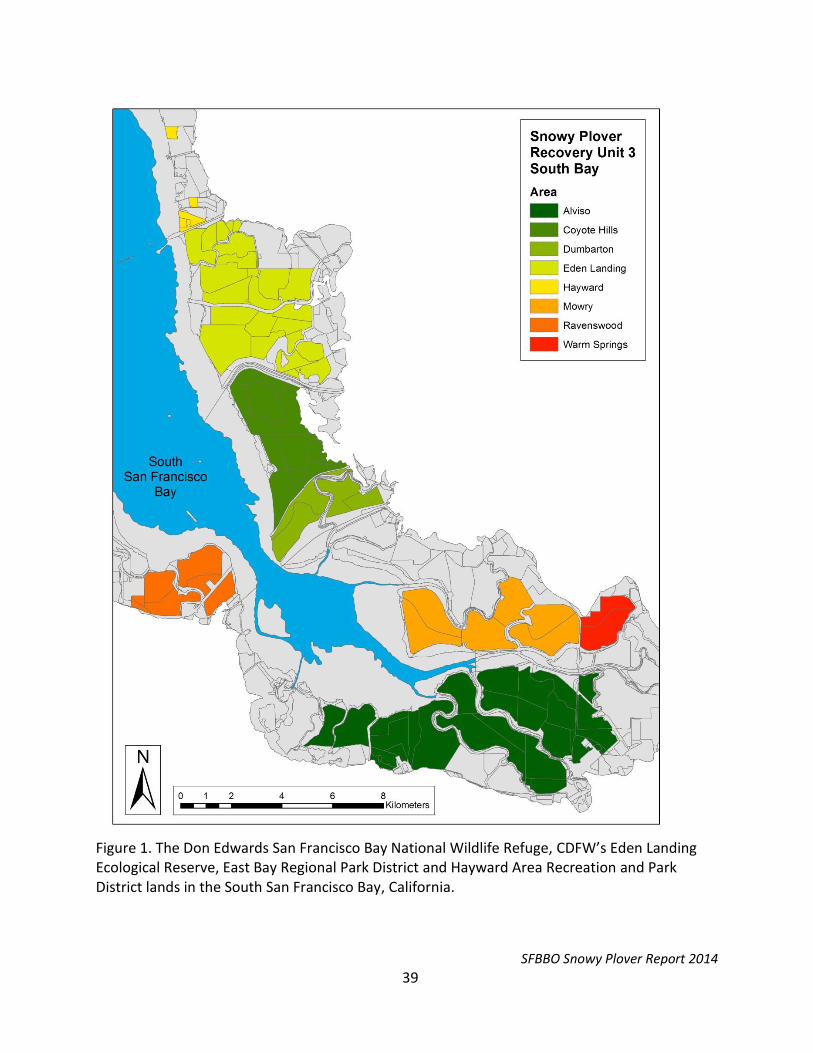
SFBBO Snowy Plover Report 2014
39
Figure 1. The Don Edwards San Francisco Bay National Wildlife Refuge, CDFW’s Eden Landing Ecological Reserve, East Bay Regional Park District and Hayward Area Recreation and Park District lands in the South San Francisco Bay, California.
Ponds 7/7a
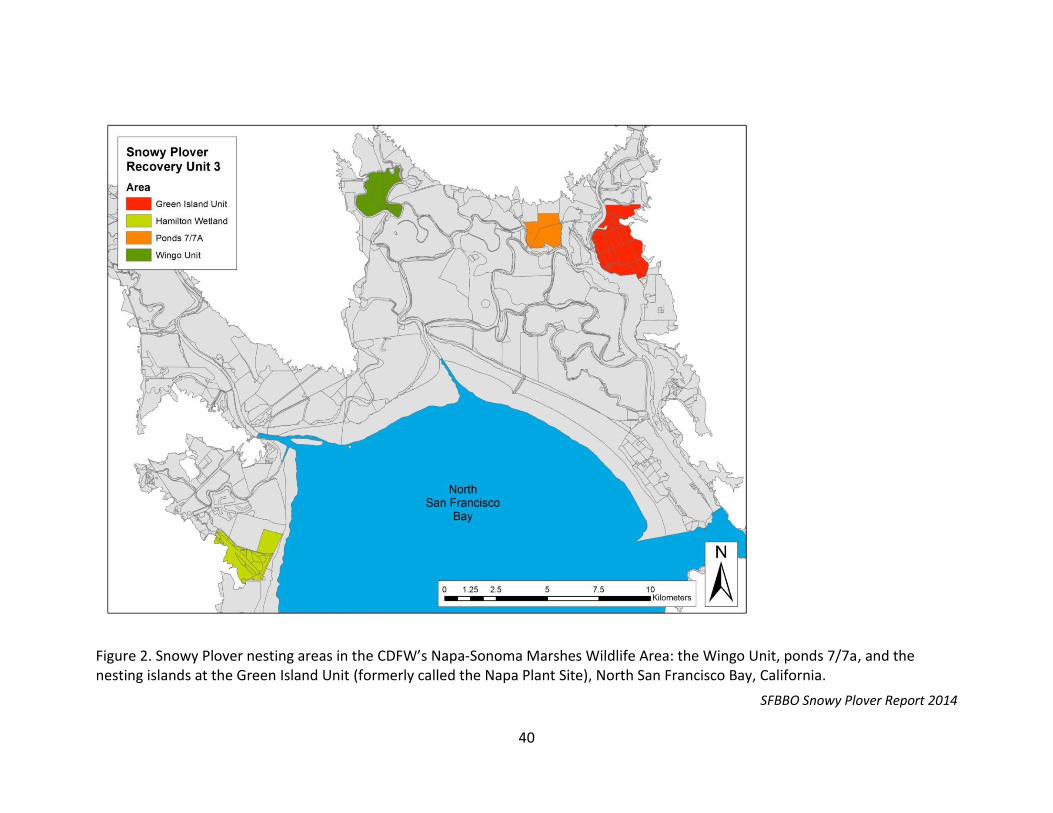
SFBBO Snowy Plover Report 2014
40
Figure 2. Snowy Plover nesting areas in the CDFW’s Napa-Sonoma Marshes Wildlife Area: the Wingo Unit, ponds 7/7a, and the nesting islands at the Green Island Unit (formerly called the Napa Plant Site), North San Francisco Bay, California.
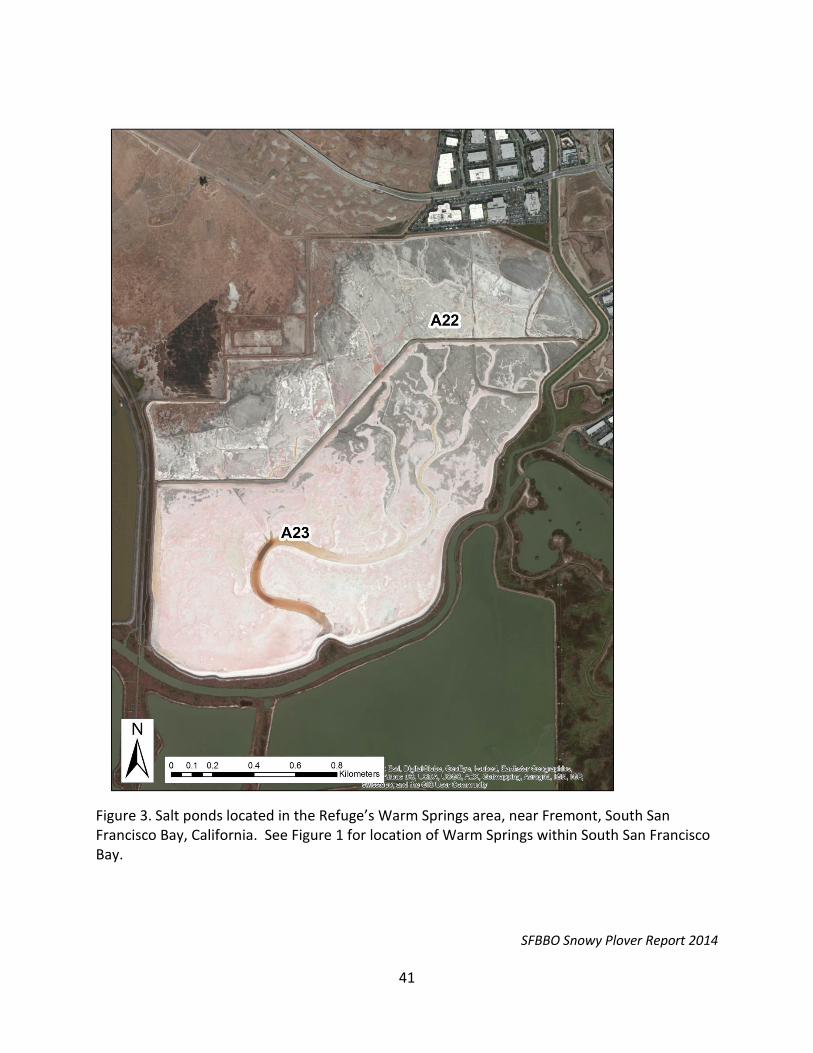
SFBBO Snowy Plover Report 2014
41
Figure 3. Salt ponds located in the Refuge’s Warm Springs area, near Fremont, South San Francisco Bay, California. See Figure 1 for location of Warm Springs within South San Francisco Bay.
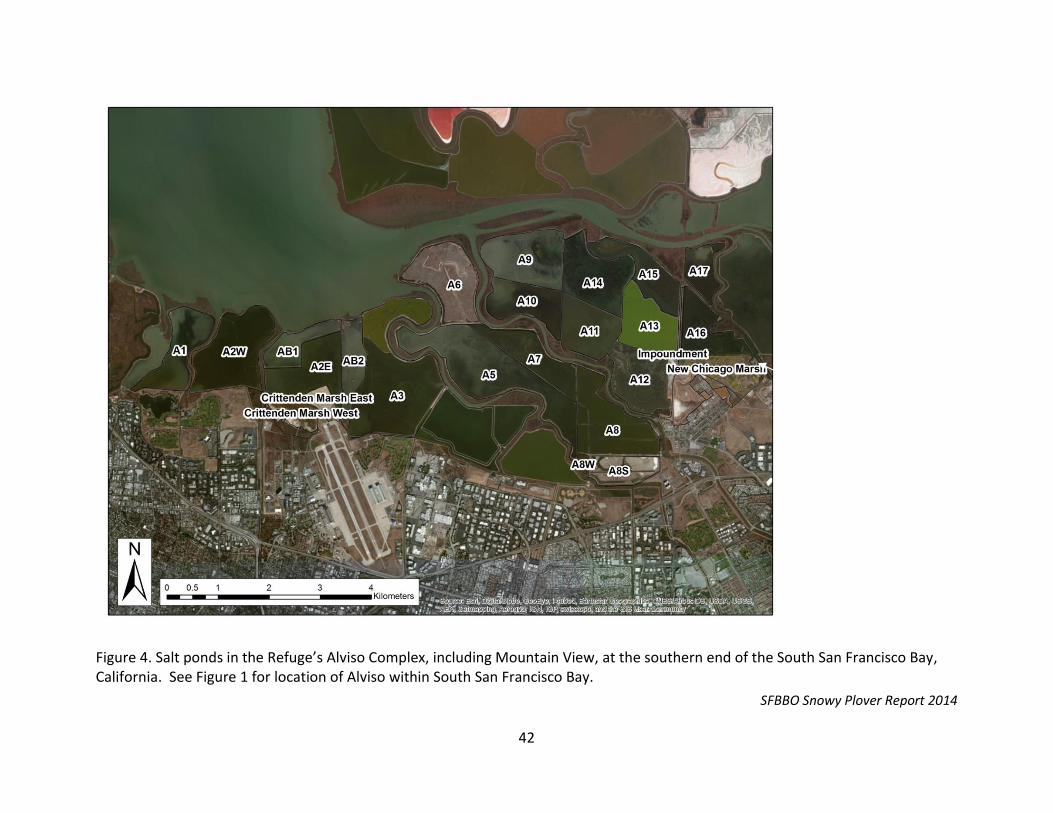
SFBBO Snowy Plover Report 2014
42
Figure 4. Salt ponds in the Refuge’s Alviso Complex, including Mountain View, at the southern end of the South San Francisco Bay, California. See Figure 1 for location of Alviso within South San Francisco Bay.
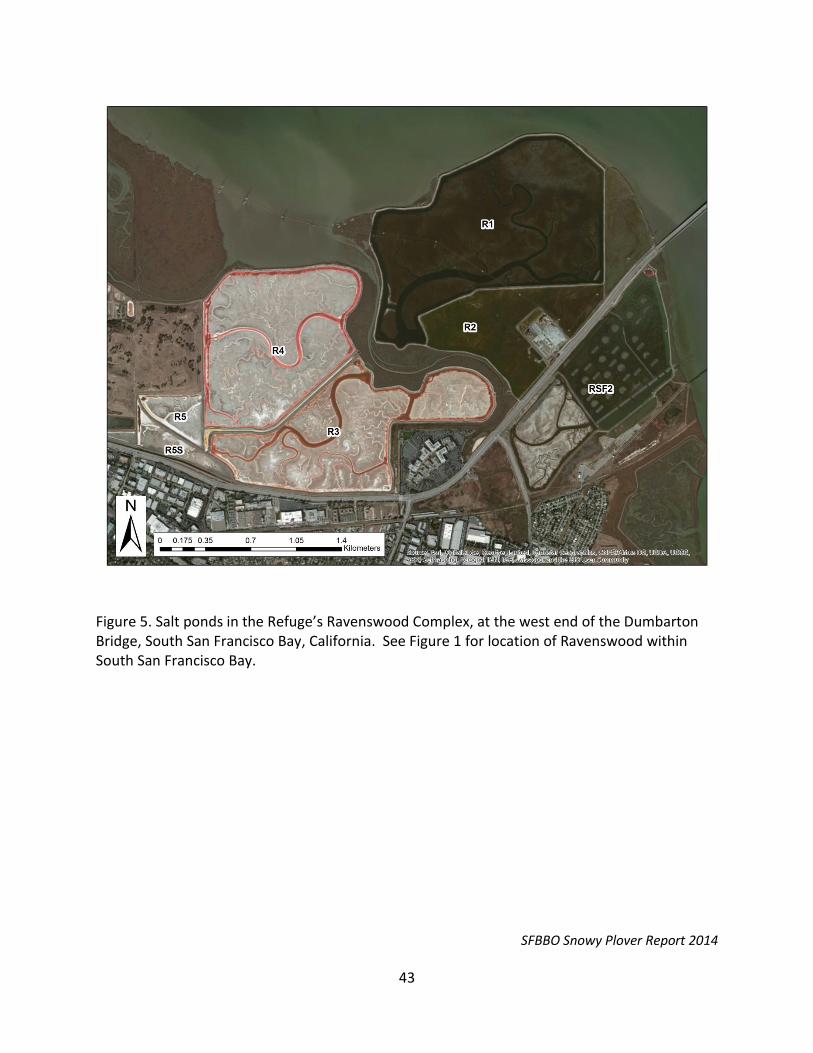
SFBBO Snowy Plover Report 2014
43
Figure 5. Salt ponds in the Refuge’s Ravenswood Complex, at the west end of the Dumbarton Bridge, South San Francisco Bay, California. See Figure 1 for location of Ravenswood within South San Francisco Bay.
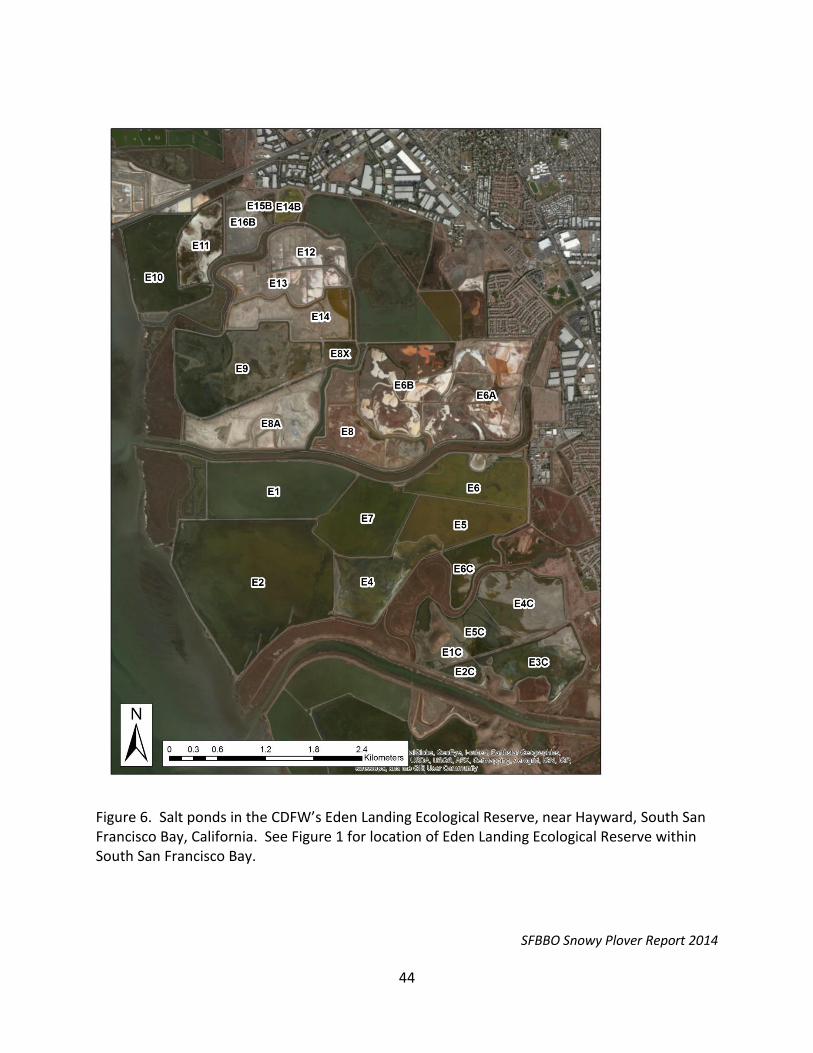
SFBBO Snowy Plover Report 2014
44
Figure 6. Salt ponds in the CDFW’s Eden Landing Ecological Reserve, near Hayward, South San Francisco Bay, California. See Figure 1 for location of Eden Landing Ecological Reserve within South San Francisco Bay.
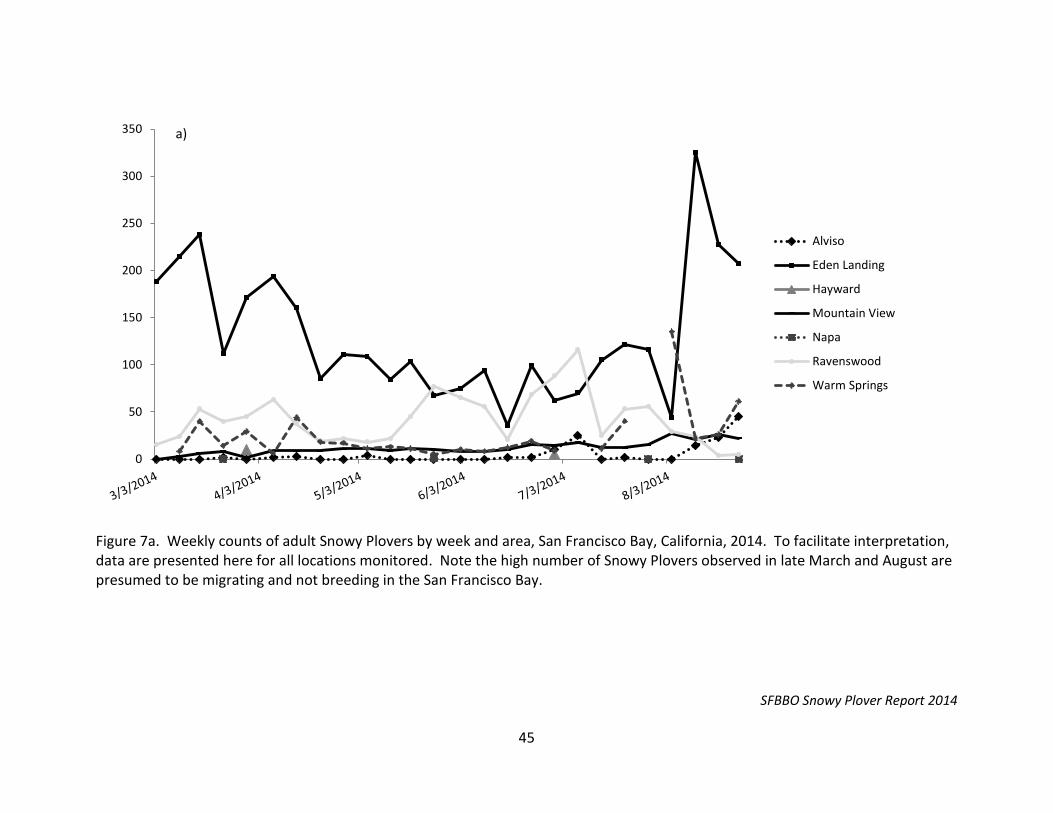
SFBBO Snowy Plover Report 2014
45
Figure 7a. Weekly counts of adult Snowy Plovers by week and area, San Francisco Bay, California, 2014. To facilitate interpretation, data are presented here for all locations monitored. Note the high number of Snowy Plovers observed in late March and August are presumed to be migrating and not breeding in the San Francisco Bay.
0
50
100
150
200
250
300
350
Alviso
Eden Landing
Hayward
Mountain View
Napa
Ravenswood
Warm Springs
a)
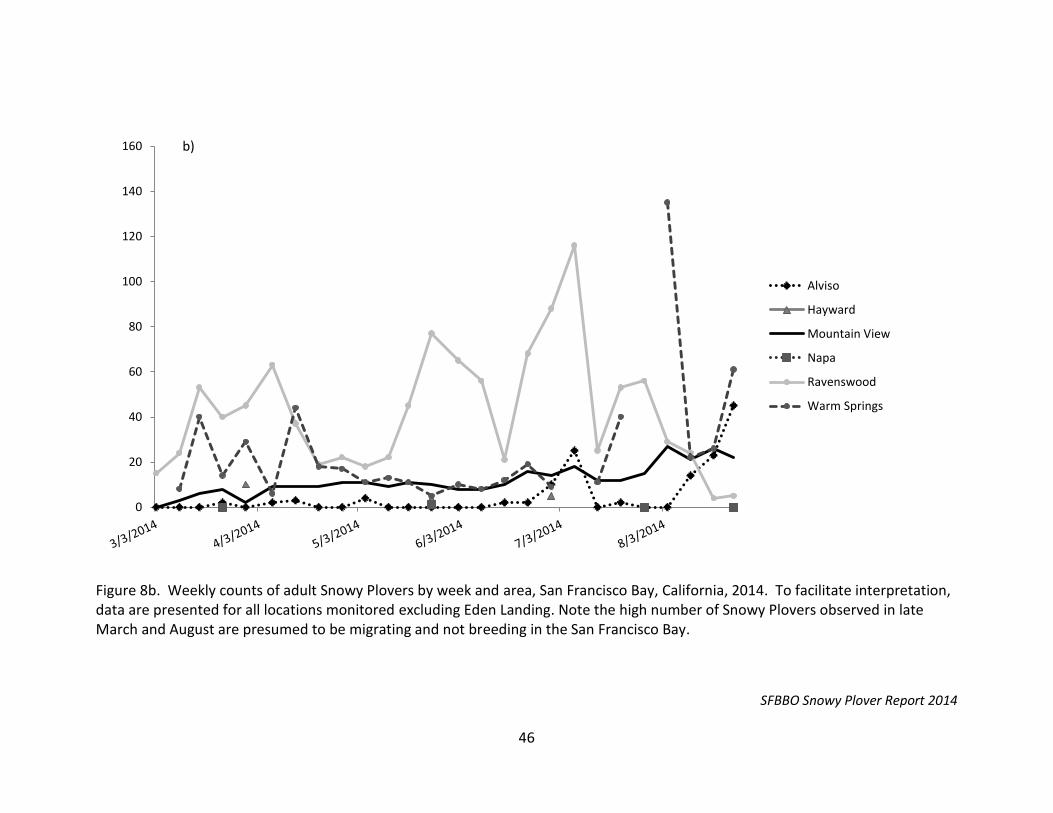
SFBBO Snowy Plover Report 2014
46
Figure 8b. Weekly counts of adult Snowy Plovers by week and area, San Francisco Bay, California, 2014. To facilitate interpretation, data are presented for all locations monitored excluding Eden Landing. Note the high number of Snowy Plovers observed in late March and August are presumed to be migrating and not breeding in the San Francisco Bay.
0
20
40
60
80
100
120
140
160
Alviso
Hayward
Mountain View
Napa
Ravenswood
Warm Springs
b)
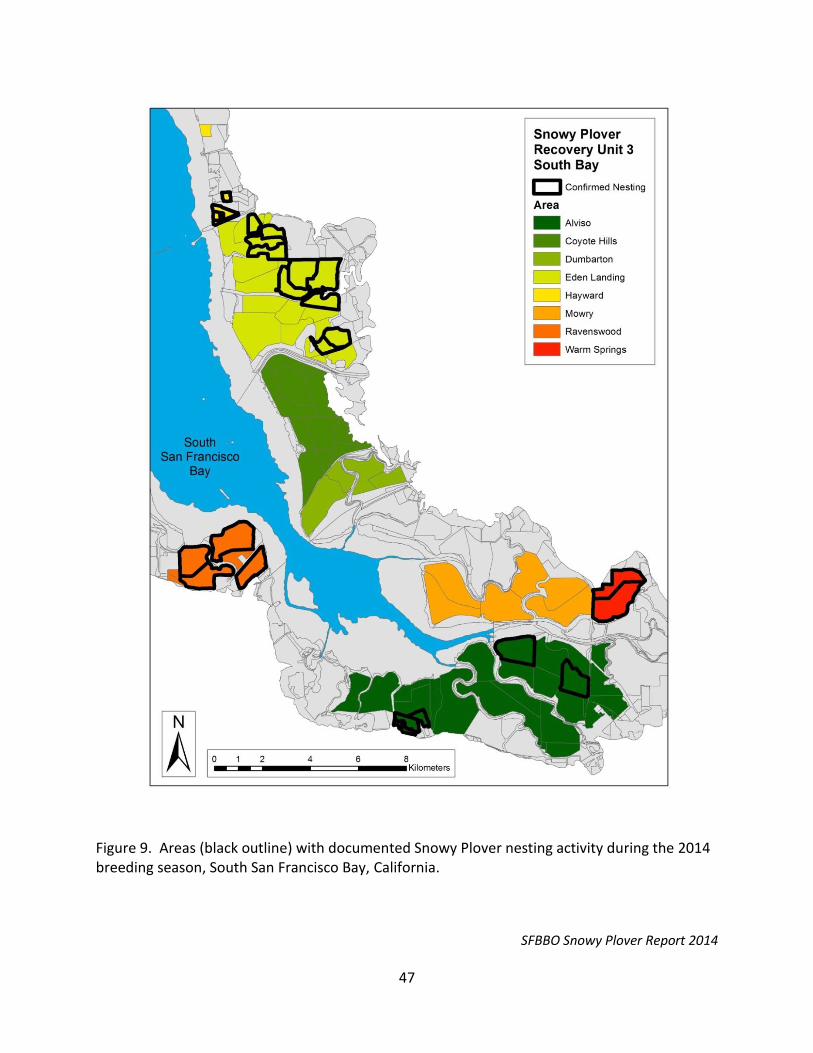
SFBBO Snowy Plover Report 2014
47
Figure 9. Areas (black outline) with documented Snowy Plover nesting activity during the 2014 breeding season, South San Francisco Bay, California.
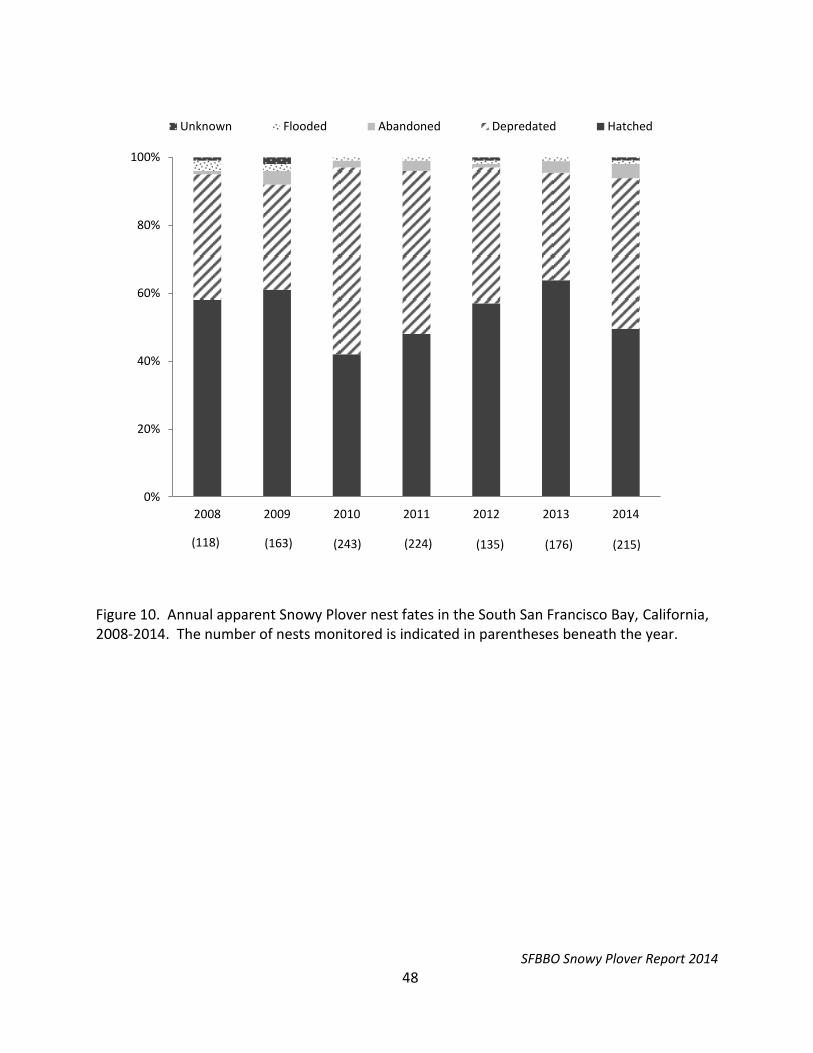
SFBBO Snowy Plover Report 2014
48
Figure 10. Annual apparent Snowy Plover nest fates in the South San Francisco Bay, California, 2008-2014. The number of nests monitored is indicated in parentheses beneath the year.
0%
20%
40%
60%
80%
100%
2008 2009 2010 2011 2012 2013 2014
Unknown Flooded Abandoned Depredated Hatched
(118) (163) (243) (224) (135) (176) (215)

SFBBO Snowy Plover Report 2014
49
Figure 11. The proportion of Snowy Plover nests found in each pond complex in the South San Francisco Bay, California, 2014.
Figure 12. The proportion of Snowy Plover nests found in each pond at Eden Landing Ecological Reserve in Hayward, California, 2014. Note that 52% of Eden Landing nests were found in ponds E12, E13 and E14. Construction activity began around these ponds in June 2014.
Eden Landing (all) 66%
Ravenswood 19%
Warm Springs 6%
Alviso 1%
Mountain View 6%
Hayward 2%
E6A 2%
E6B 13%
E8 23%
E12 1% E13
13%
E14 38%
E16B 4%
E6 1%
E4C 4%
E5C 1%
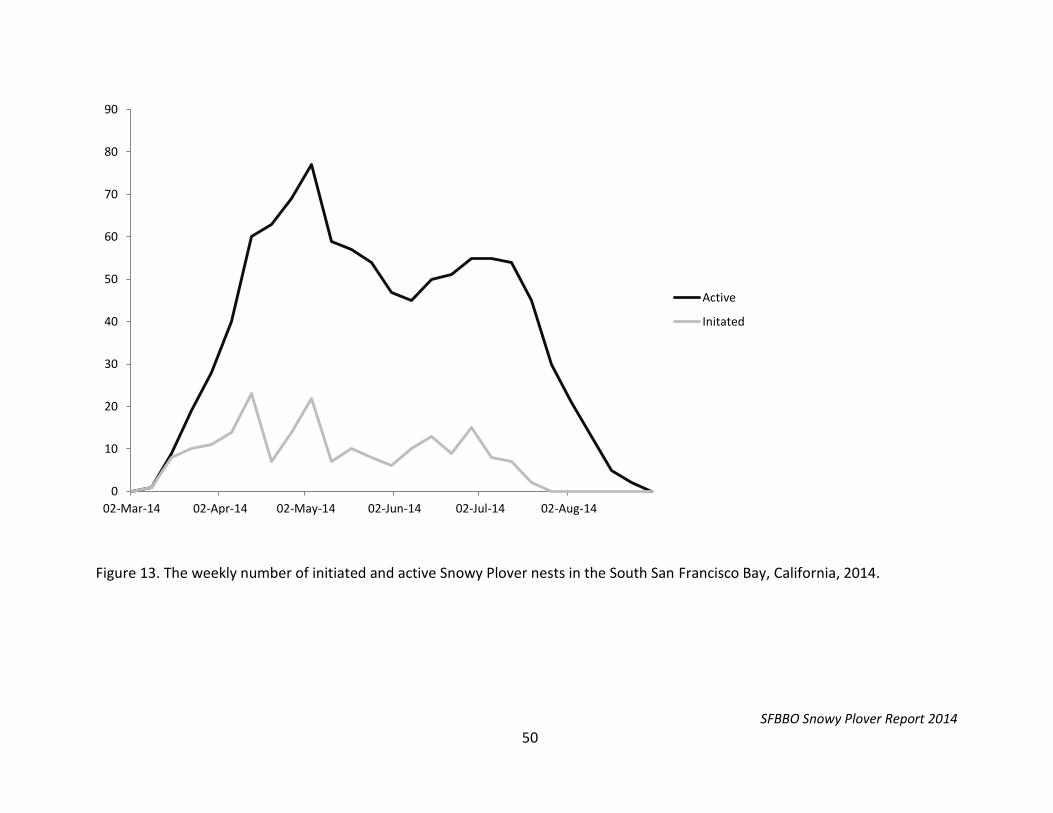
SFBBO Snowy Plover Report 2014
50
Figure 13. The weekly number of initiated and active Snowy Plover nests in the South San Francisco Bay, California, 2014.
0
10
20
30
40
50
60
70
80
90
02-Mar-14 02-Apr-14 02-May-14 02-Jun-14 02-Jul-14 02-Aug-14
Active
Initated
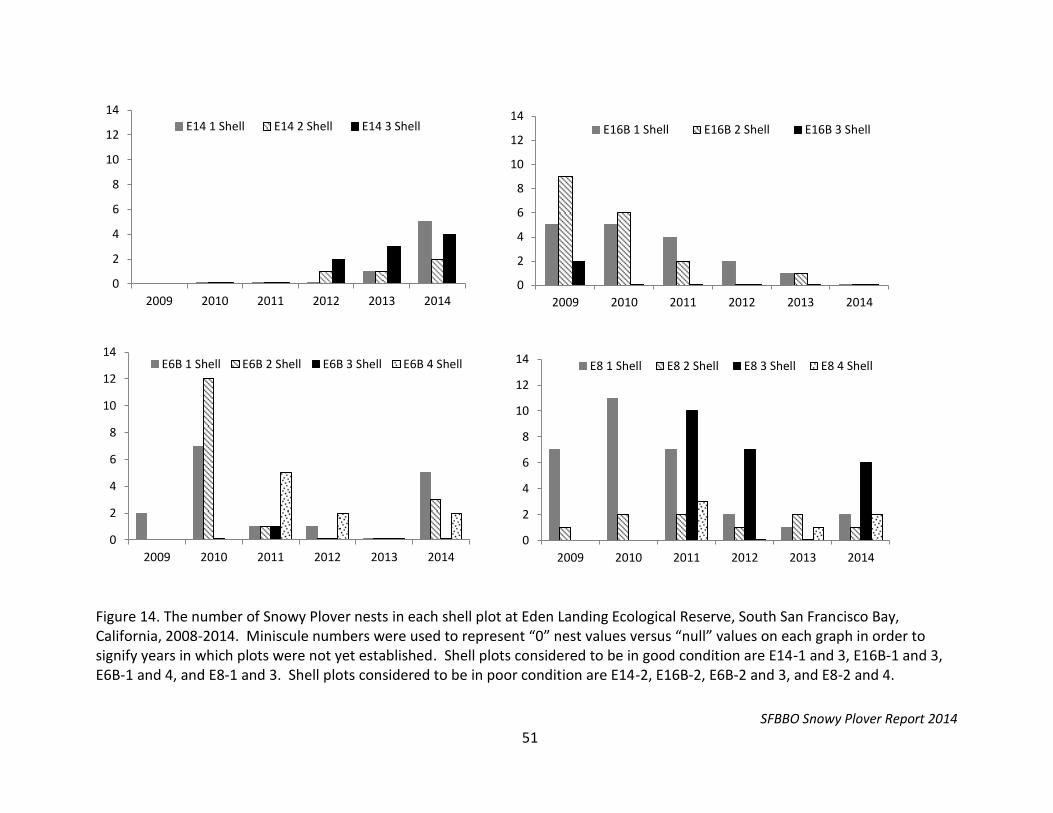
SFBBO Snowy Plover Report 2014
51
Figure 14. The number of Snowy Plover nests in each shell plot at Eden Landing Ecological Reserve, South San Francisco Bay, California, 2008-2014. Miniscule numbers were used to represent “0” nest values versus “null” values on each graph in order to signify years in which plots were not yet established. Shell plots considered to be in good condition are E14-1 and 3, E16B-1 and 3, E6B-1 and 4, and E8-1 and 3. Shell plots considered to be in poor condition are E14-2, E16B-2, E6B-2 and 3, and E8-2 and 4.
0
2
4
6
8
10
12
14
2009 2010 2011 2012 2013 2014
E14 1 Shell E14 2 Shell E14 3 Shell
0
2
4
6
8
10
12
14
2009 2010 2011 2012 2013 2014
E16B 1 Shell E16B 2 Shell E16B 3 Shell
0
2
4
6
8
10
12
14
2009 2010 2011 2012 2013 2014
E6B 1 Shell E6B 2 Shell E6B 3 Shell E6B 4 Shell
0
2
4
6
8
10
12
14
2009 2010 2011 2012 2013 2014
E8 1 Shell E8 2 Shell E8 3 Shell E8 4 Shell
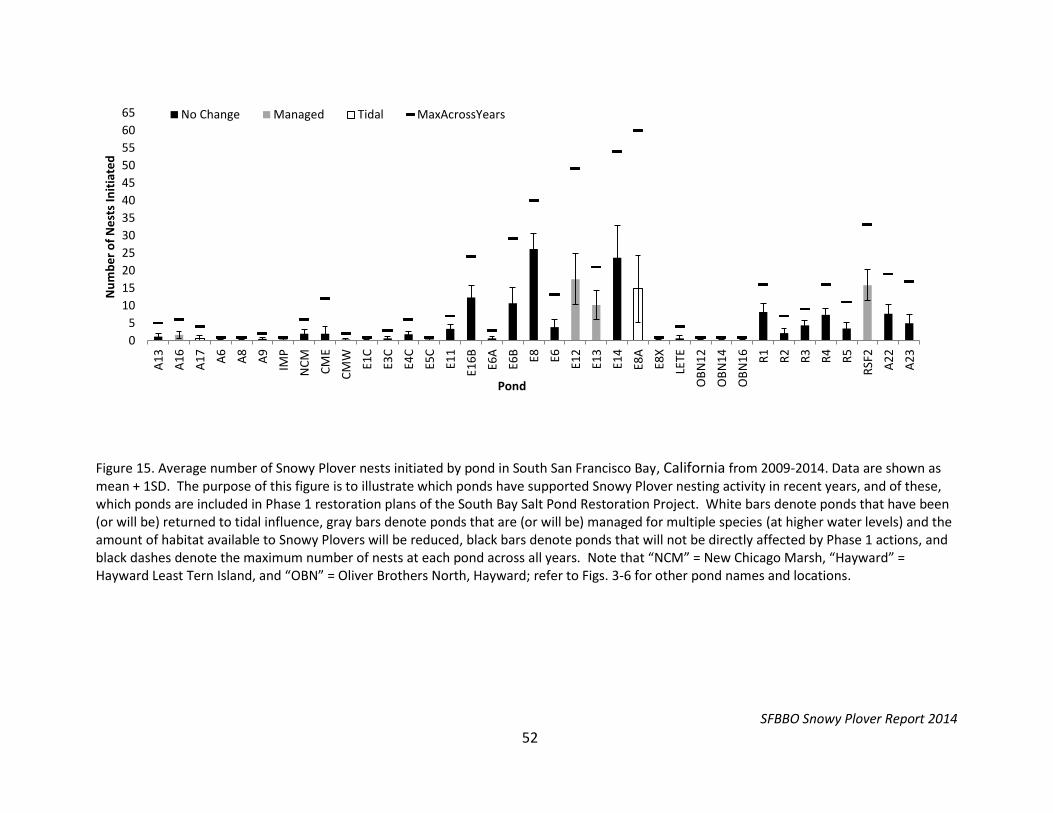
SFBBO Snowy Plover Report 2014
52
Figure 15. Average number of Snowy Plover nests initiated by pond in South San Francisco Bay, California from 2009-2014. Data are shown as mean + 1SD. The purpose of this figure is to illustrate which ponds have supported Snowy Plover nesting activity in recent years, and of these, which ponds are included in Phase 1 restoration plans of the South Bay Salt Pond Restoration Project. White bars denote ponds that have been (or will be) returned to tidal influence, gray bars denote ponds that are (or will be) managed for multiple species (at higher water levels) and the amount of habitat available to Snowy Plovers will be reduced, black bars denote ponds that will not be directly affected by Phase 1 actions, and black dashes denote the maximum number of nests at each pond across all years. Note that “NCM” = New Chicago Marsh, “Hayward” = Hayward Least Tern Island, and “OBN” = Oliver Brothers North, Hayward; refer to Figs. 3-6 for other pond names and locations.
0
5
10
15
20
25
30
35
40
45
50
55
60
65
A1
3
A1
6
A1
7
A6
A8
A9
IMP
NC
M
CM
E
CM
W
E1C
E3C
E4C
E5C
E11
E16
B
E6A
E6B E8 E6
E12
E13
E14
E8A
E8X
LETE
OB
N1
2
OB
N1
4
OB
N1
6
R1
R2
R3
R4
R5
RSF
2
A2
2
A2
3
Nu
mb
er
of
Ne
sts
Init
iate
d
Pond
No Change Managed Tidal MaxAcrossYears
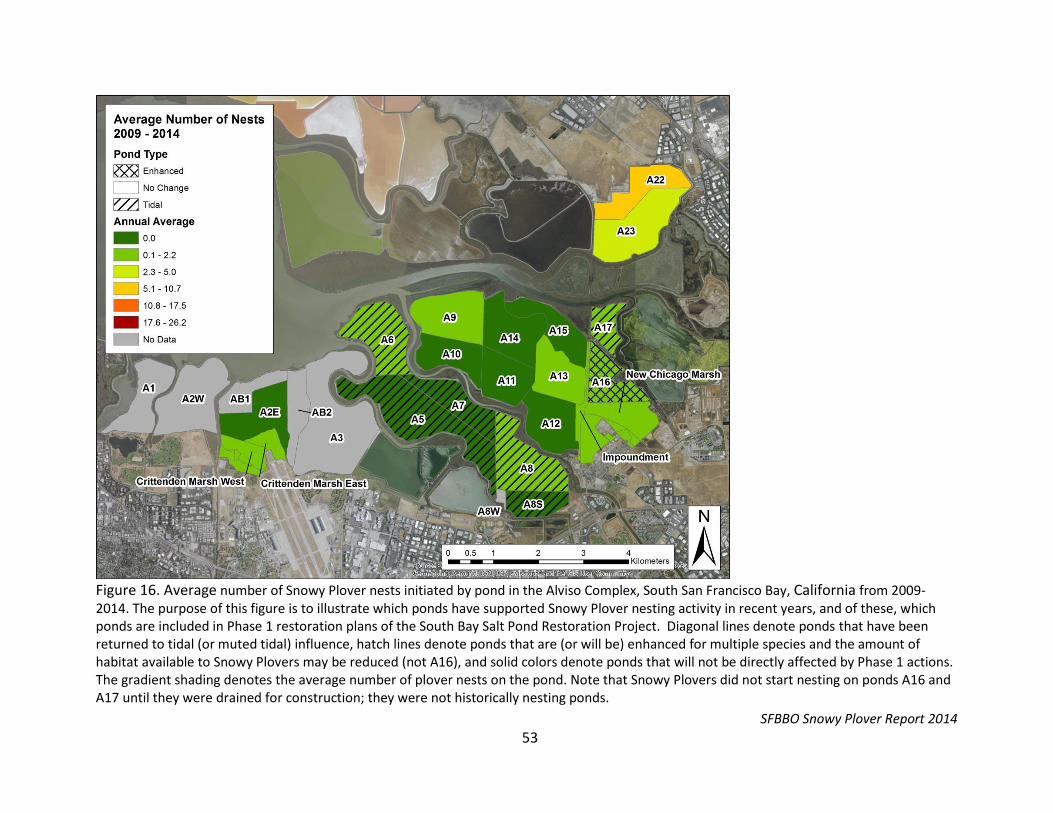
SFBBO Snowy Plover Report 2014
53
Figure 16. Average number of Snowy Plover nests initiated by pond in the Alviso Complex, South San Francisco Bay, California from 2009-2014. The purpose of this figure is to illustrate which ponds have supported Snowy Plover nesting activity in recent years, and of these, which ponds are included in Phase 1 restoration plans of the South Bay Salt Pond Restoration Project. Diagonal lines denote ponds that have been returned to tidal (or muted tidal) influence, hatch lines denote ponds that are (or will be) enhanced for multiple species and the amount of habitat available to Snowy Plovers may be reduced (not A16), and solid colors denote ponds that will not be directly affected by Phase 1 actions. The gradient shading denotes the average number of plover nests on the pond. Note that Snowy Plovers did not start nesting on ponds A16 and A17 until they were drained for construction; they were not historically nesting ponds.
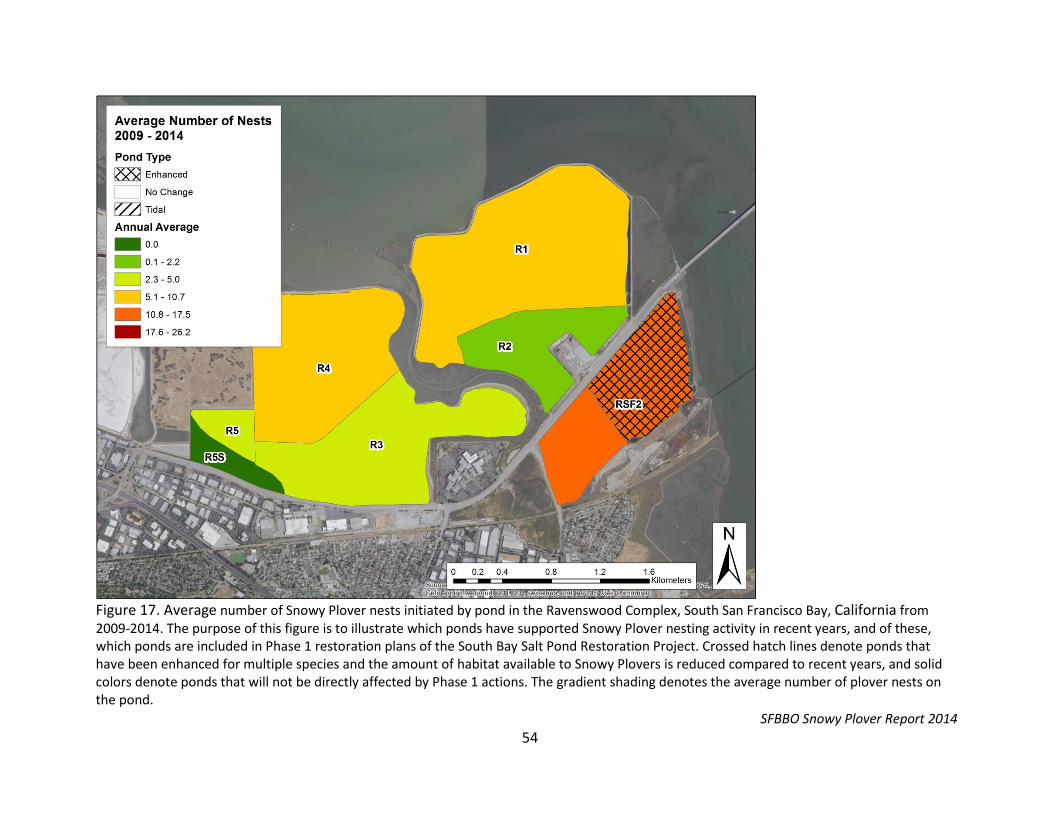
SFBBO Snowy Plover Report 2014
54
Figure 17. Average number of Snowy Plover nests initiated by pond in the Ravenswood Complex, South San Francisco Bay, California from 2009-2014. The purpose of this figure is to illustrate which ponds have supported Snowy Plover nesting activity in recent years, and of these, which ponds are included in Phase 1 restoration plans of the South Bay Salt Pond Restoration Project. Crossed hatch lines denote ponds that have been enhanced for multiple species and the amount of habitat available to Snowy Plovers is reduced compared to recent years, and solid colors denote ponds that will not be directly affected by Phase 1 actions. The gradient shading denotes the average number of plover nests on the pond.
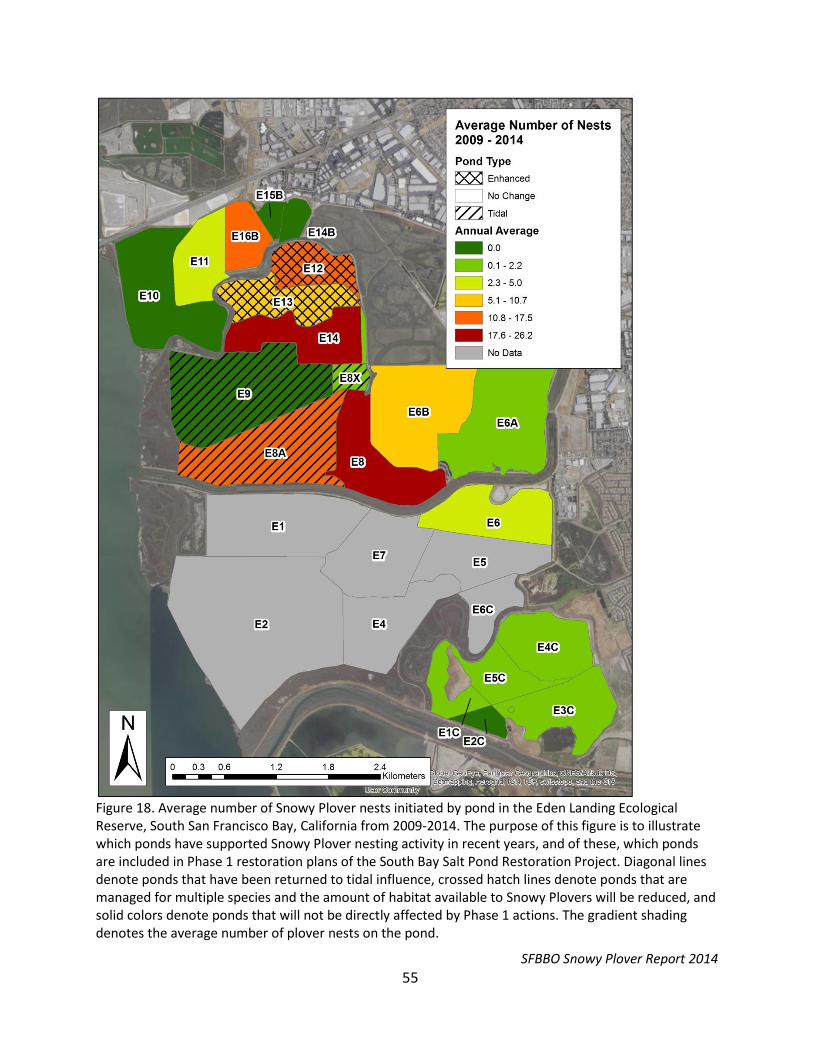
SFBBO Snowy Plover Report 2014
55
Figure 18. Average number of Snowy Plover nests initiated by pond in the Eden Landing Ecological Reserve, South San Francisco Bay, California from 2009-2014. The purpose of this figure is to illustrate which ponds have supported Snowy Plover nesting activity in recent years, and of these, which ponds are included in Phase 1 restoration plans of the South Bay Salt Pond Restoration Project. Diagonal lines denote ponds that have been returned to tidal influence, crossed hatch lines denote ponds that are managed for multiple species and the amount of habitat available to Snowy Plovers will be reduced, and solid colors denote ponds that will not be directly affected by Phase 1 actions. The gradient shading denotes the average number of plover nests on the pond.
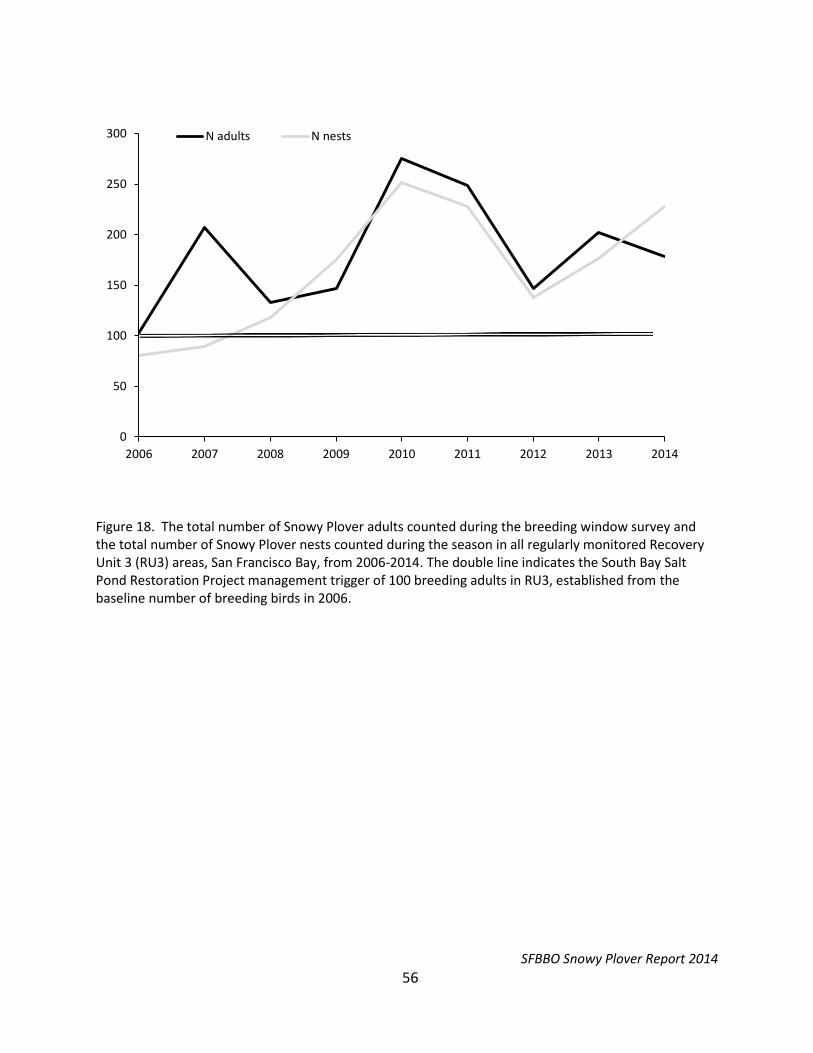
SFBBO Snowy Plover Report 2014
56
Figure 18. The total number of Snowy Plover adults counted during the breeding window survey and the total number of Snowy Plover nests counted during the season in all regularly monitored Recovery Unit 3 (RU3) areas, San Francisco Bay, from 2006-2014. The double line indicates the South Bay Salt Pond Restoration Project management trigger of 100 breeding adults in RU3, established from the baseline number of breeding birds in 2006.
0
50
100
150
200
250
300
2006 2007 2008 2009 2010 2011 2012 2013 2014
N adults N nests
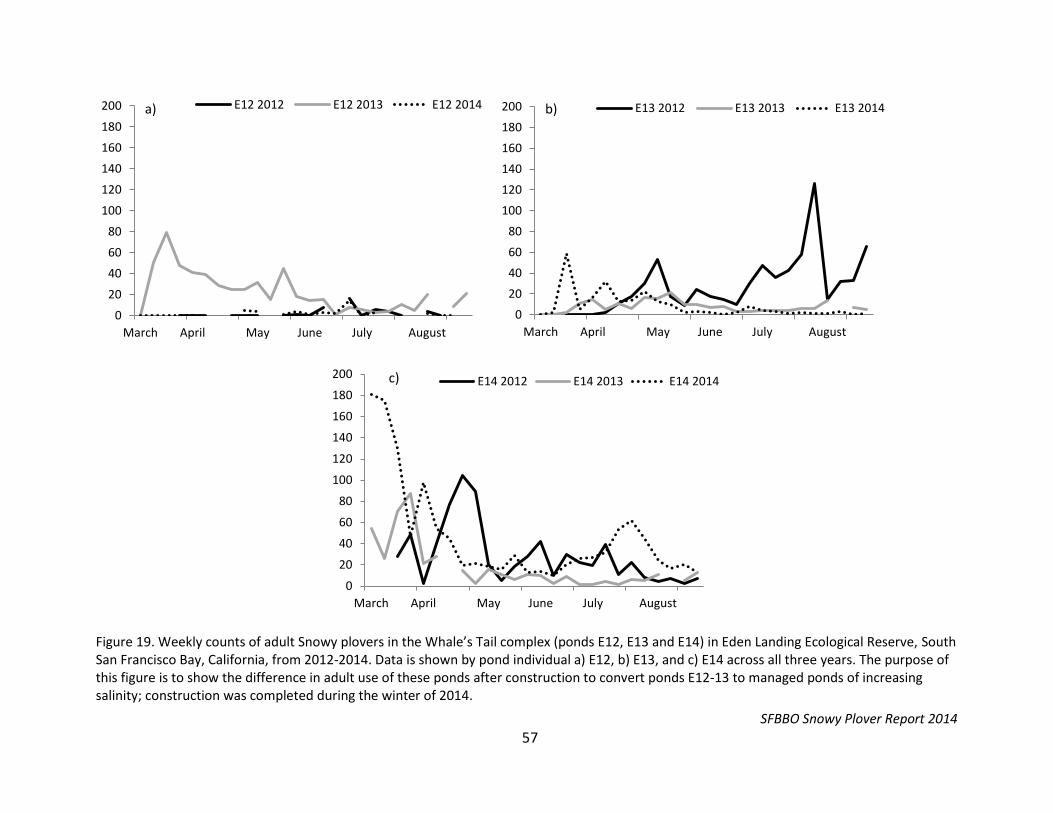
SFBBO Snowy Plover Report 2014
57
Figure 19. Weekly counts of adult Snowy plovers in the Whale’s Tail complex (ponds E12, E13 and E14) in Eden Landing Ecological Reserve, South San Francisco Bay, California, from 2012-2014. Data is shown by pond individual a) E12, b) E13, and c) E14 across all three years. The purpose of this figure is to show the difference in adult use of these ponds after construction to convert ponds E12-13 to managed ponds of increasing salinity; construction was completed during the winter of 2014.
0
20
40
60
80
100
120
140
160
180
200
March April May June July August
E12 2012 E12 2013 E12 2014a)
0
20
40
60
80
100
120
140
160
180
200
March April May June July August
E13 2012 E13 2013 E13 2014b)
0
20
40
60
80
100
120
140
160
180
200
March April May June July August
E14 2012 E14 2013 E14 2014c)
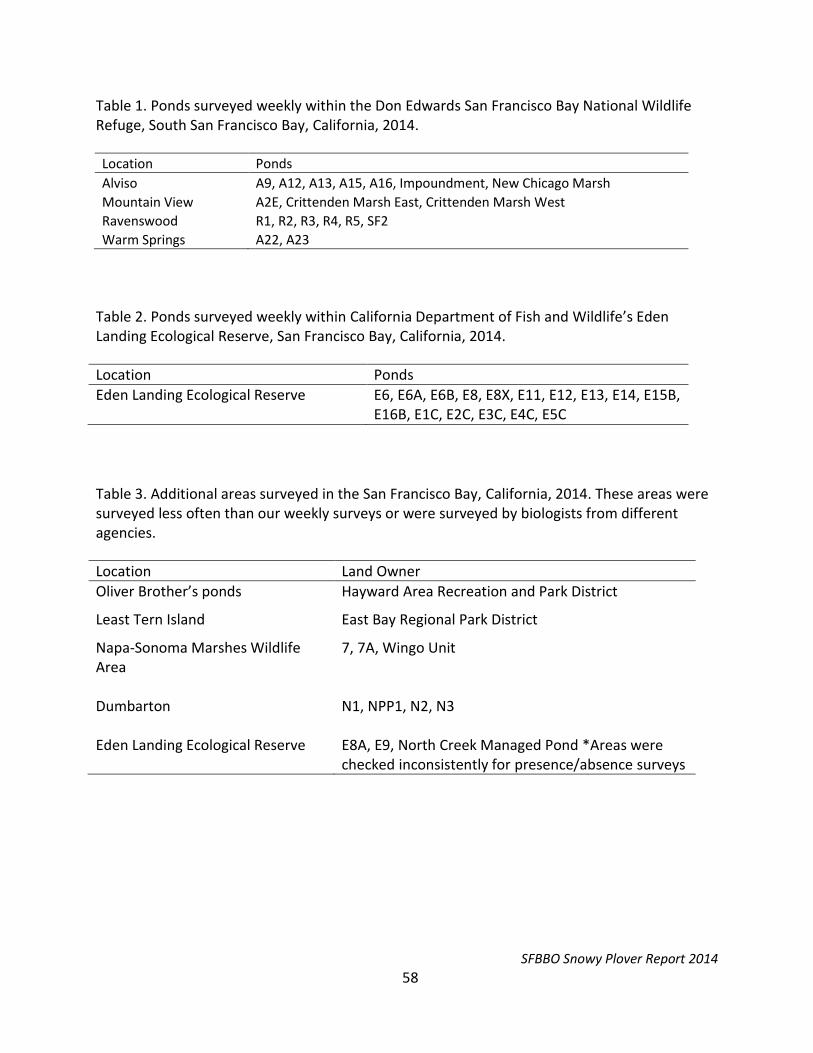
SFBBO Snowy Plover Report 2014
58
Table 1. Ponds surveyed weekly within the Don Edwards San Francisco Bay National Wildlife Refuge, South San Francisco Bay, California, 2014.
Location Ponds
Alviso A9, A12, A13, A15, A16, Impoundment, New Chicago Marsh
Mountain View A2E, Crittenden Marsh East, Crittenden Marsh West
Ravenswood R1, R2, R3, R4, R5, SF2
Warm Springs A22, A23
Table 2. Ponds surveyed weekly within California Department of Fish and Wildlife’s Eden Landing Ecological Reserve, San Francisco Bay, California, 2014.
Location Ponds
Eden Landing Ecological Reserve E6, E6A, E6B, E8, E8X, E11, E12, E13, E14, E15B, E16B, E1C, E2C, E3C, E4C, E5C
Table 3. Additional areas surveyed in the San Francisco Bay, California, 2014. These areas were surveyed less often than our weekly surveys or were surveyed by biologists from different agencies.
Location Land Owner
Oliver Brother’s ponds Hayward Area Recreation and Park District
Least Tern Island East Bay Regional Park District
Napa-Sonoma Marshes Wildlife Area
7, 7A, Wingo Unit
Dumbarton
N1, NPP1, N2, N3
Eden Landing Ecological Reserve
E8A, E9, North Creek Managed Pond *Areas were checked inconsistently for presence/absence surveys
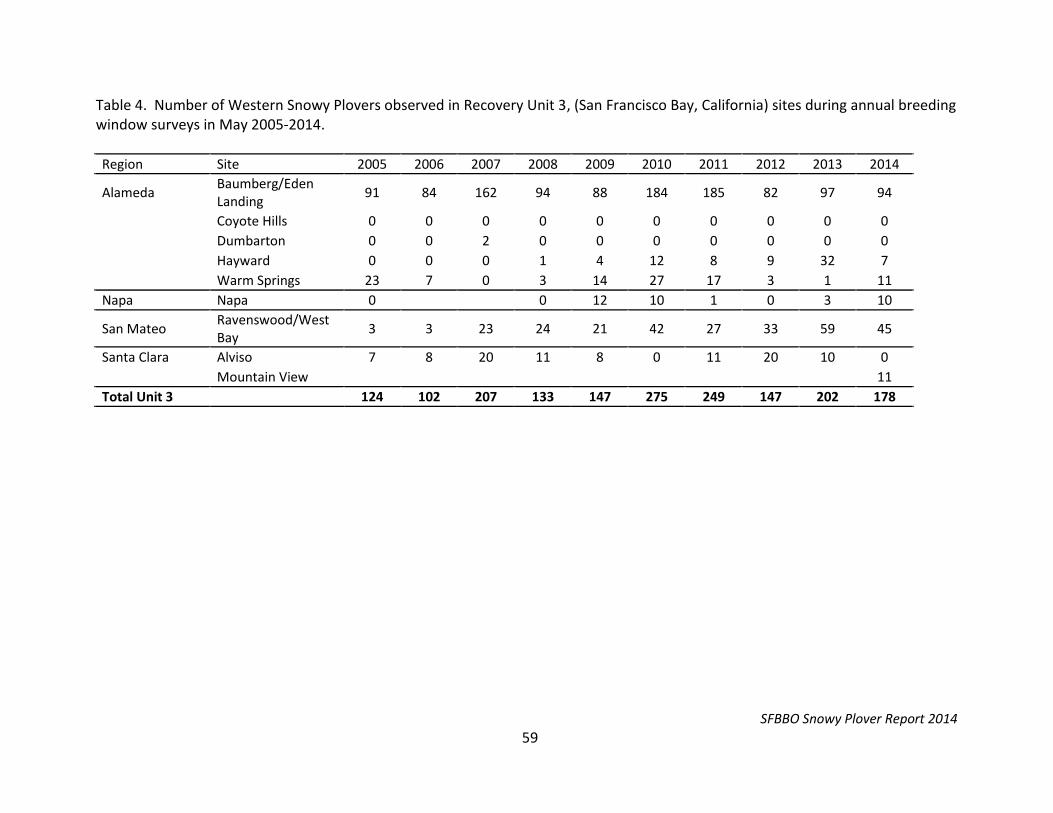
SFBBO Snowy Plover Report 2014
59
Table 4. Number of Western Snowy Plovers observed in Recovery Unit 3, (San Francisco Bay, California) sites during annual breeding window surveys in May 2005-2014. Region Site 2005 2006 2007 2008 2009 2010 2011 2012 2013 2014
Alameda Baumberg/Eden Landing
91 84 162 94 88 184 185 82 97 94
Coyote Hills 0 0 0 0 0 0 0 0 0 0
Dumbarton 0 0 2 0 0 0 0 0 0 0
Hayward 0 0 0 1 4 12 8 9 32 7
Warm Springs 23 7 0 3 14 27 17 3 1 11
Napa Napa 0 0 12 10 1 0 3 10
San Mateo Ravenswood/West Bay
3 3 23 24 21 42 27 33 59 45
Santa Clara Alviso 7 8 20 11 8 0 11 20 10 0
Mountain View 11
Total Unit 3 124 102 207 133 147 275 249 147 202 178
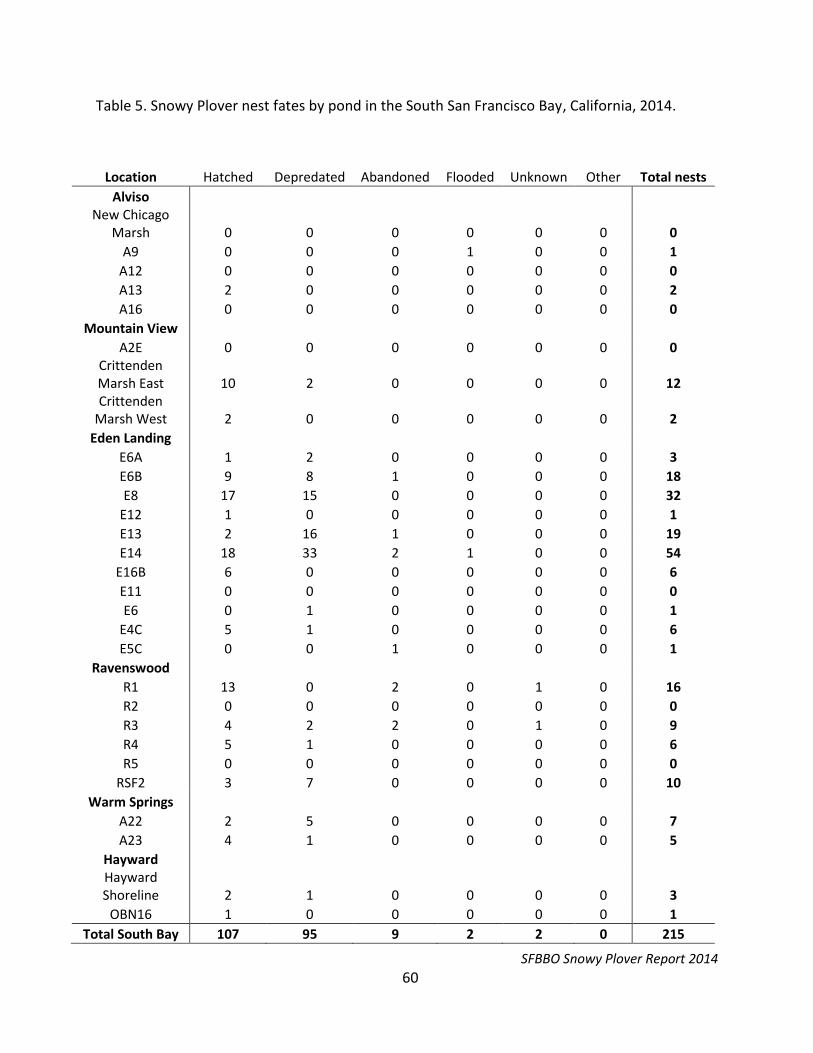
SFBBO Snowy Plover Report 2014
60
Table 5. Snowy Plover nest fates by pond in the South San Francisco Bay, California, 2014.
Location Hatched Depredated Abandoned Flooded Unknown Other Total nests
Alviso
New Chicago
Marsh 0 0 0 0 0 0 0
A9 0 0 0 1 0 0 1
A12 0 0 0 0 0 0 0
A13 2 0 0 0 0 0 2
A16 0 0 0 0 0 0 0
Mountain View
A2E 0 0 0 0 0 0 0 Crittenden Marsh East 10 2 0 0 0 0 12 Crittenden
Marsh West 2 0 0 0 0 0 2
Eden Landing
E6A 1 2 0 0 0 0 3
E6B 9 8 1 0 0 0 18
E8 17 15 0 0 0 0 32
E12 1 0 0 0 0 0 1
E13 2 16 1 0 0 0 19
E14 18 33 2 1 0 0 54
E16B 6 0 0 0 0 0 6
E11 0 0 0 0 0 0 0
E6 0 1 0 0 0 0 1
E4C 5 1 0 0 0 0 6
E5C 0 0 1 0 0 0 1
Ravenswood
R1 13 0 2 0 1 0 16
R2 0 0 0 0 0 0 0
R3 4 2 2 0 1 0 9
R4 5 1 0 0 0 0 6
R5 0 0 0 0 0 0 0
RSF2 3 7 0 0 0 0 10
Warm Springs
A22 2 5 0 0 0 0 7
A23 4 1 0 0 0 0 5
Hayward
Hayward Shoreline 2 1 0 0 0 0 3
OBN16 1 0 0 0 0 0 1
Total South Bay 107 95 9 2 2 0 215
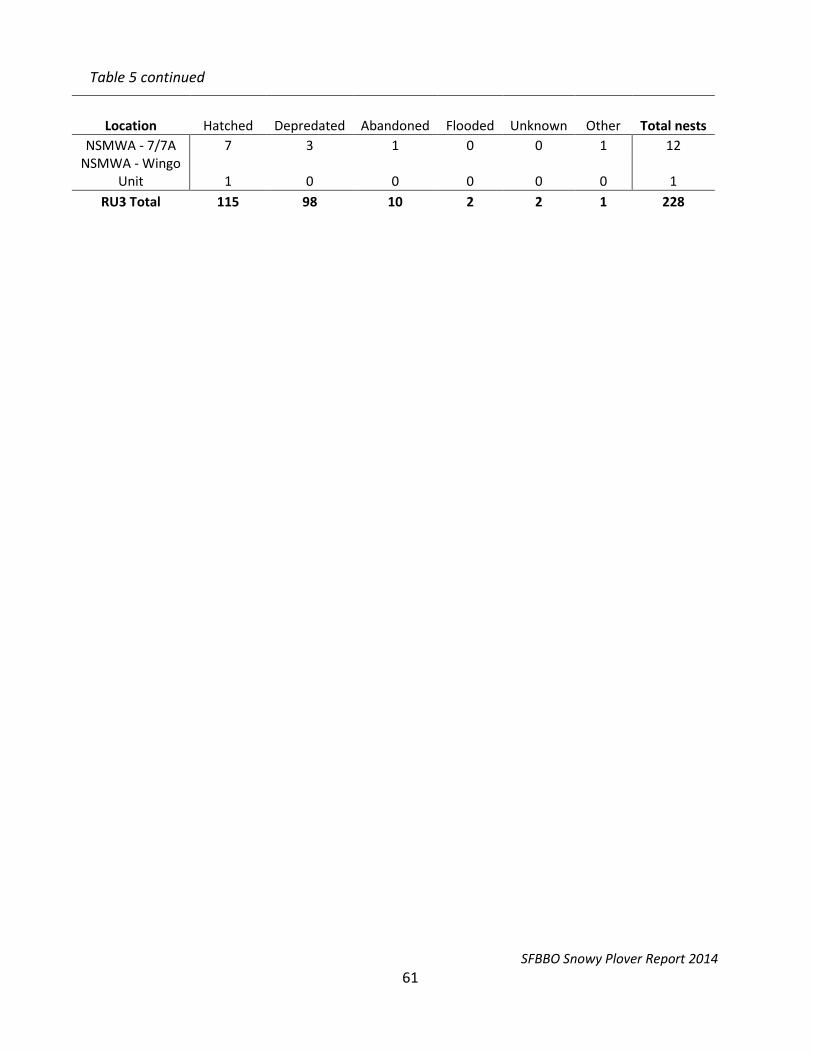
SFBBO Snowy Plover Report 2014
61
Location Hatched Depredated Abandoned Flooded Unknown Other Total nests
NSMWA - 7/7A 7 3 1 0 0 1 12 NSMWA - Wingo
Unit 1 0 0 0 0 0 1
RU3 Total 115 98 10 2 2 1 228
Table 5 continued

SFBBO Snowy Plover Report 2014
62
Table 6. Snowy Plover apparent nest densities (nest/ha) by pond on Refuge property in the South San Francisco Bay, California, 2014. The nest densities should be viewed with caution since the area used to calculate the densities represent only a rough gauge of potentially available nesting habitat.
Location Nest/ha
A9 0.01
A13 0.02
A16 0.00
R1 0.09
R2 0.00
R3 0.08
R4 0.05
R5 0.00
SF2 0.10
A22 0.06
A23 0.03
CM-E 0.59
CM-W 0.05
Table 7. Snowy Plover apparent nest densities (nests/ha) by pond at Eden Landing Ecological Reserve in the South San Francisco Bay, California, 2014. The nest densities should be viewed with caution since the area used to calculate the densities represent only a rough gauge of potentially available nesting habitat.
Location Nest/ha
E6A 0.02
E6B 0.16
E8 0.42
E12 0.02
E13 0.32
E14 0.80
E16B 0.20
E6 0.01
E4C 0.08
E5C 0.03
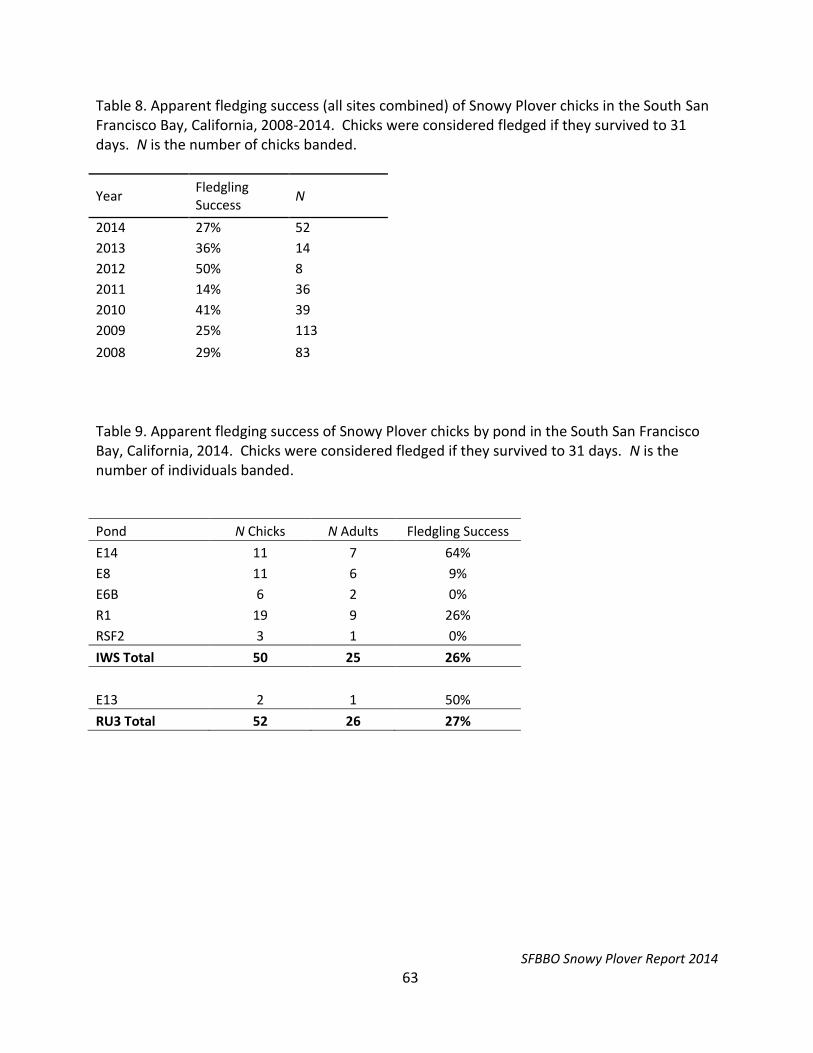
SFBBO Snowy Plover Report 2014
63
Table 8. Apparent fledging success (all sites combined) of Snowy Plover chicks in the South San Francisco Bay, California, 2008-2014. Chicks were considered fledged if they survived to 31 days. N is the number of chicks banded.
Year Fledgling Success
N
2014 27% 52
2013 36% 14
2012 50% 8
2011 14% 36
2010 41% 39
2009 25% 113
2008 29% 83
Table 9. Apparent fledging success of Snowy Plover chicks by pond in the South San Francisco Bay, California, 2014. Chicks were considered fledged if they survived to 31 days. N is the number of individuals banded.
Pond N Chicks N Adults Fledgling Success
E14 11 7 64%
E8 11 6 9%
E6B 6 2 0%
R1 19 9 26%
RSF2 3 1 0%
IWS Total 50 25 26%
E13 2 1 50%
RU3 Total 52 26 27%

SFBBO Snowy Plover Report 2014
64
Table 10. The number of nests in each shell plot at Eden Landing Ecological Reserve in the South San Francisco Bay, California, 2009-2014.
2009 2010 2011 2012 2013 2014
Pond Shell plot Year shells spread Total nests
Total nests
Total nests
Total nests
Total nests
Total nests
E14 1 2009 0 0 0 1 5
E14 2 2009 0 0 1 1 2
E14 3 2009 0 0 2 3 4
Total 0 0 3 5 11
E16B 1 2008 5 5 4 2 1 0
E16B 2 2008 9 6 2 0 1 0
E16B 3 2008 2 0 0 0 0 0
Total 16 11 6 2 2 0
E6A 1 2008 0 0 0 0 0 0
Total 0 0 0 0 0 0
E6B 1 2008 2 7 1 1 0 5
E6B 2 2009 12 1 0 0 3
E6B 3 2009 0 1 0 0 0
E6B 4 2010 5 2 0 2
Total 2 19 8 3 0 10
E8 1 2008 7 11 7 2 1 2
E8 2 2008 1 2 2 1 2 1
E8 3 2010 10 7 0 6
E8 4 2010 3 0 1 2
Total 8 13 22 10 4 11
Totals
26 43 36 18 11 32
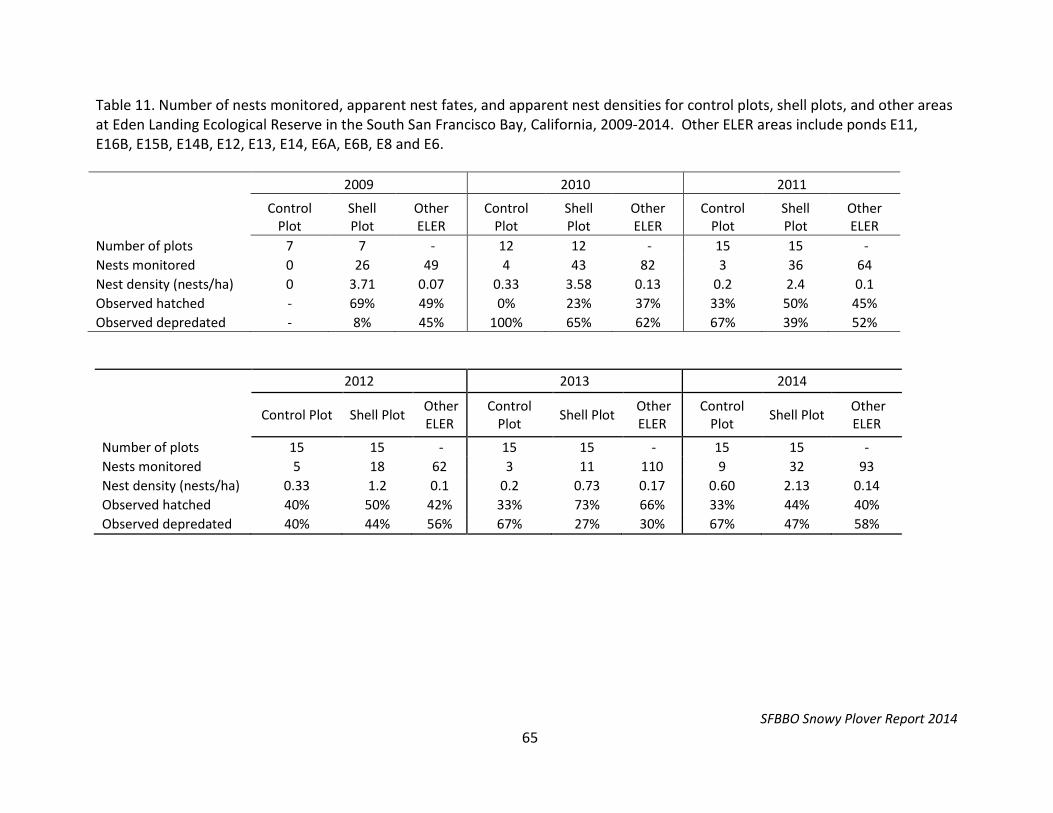
SFBBO Snowy Plover Report 2014
65
Table 11. Number of nests monitored, apparent nest fates, and apparent nest densities for control plots, shell plots, and other areas at Eden Landing Ecological Reserve in the South San Francisco Bay, California, 2009-2014. Other ELER areas include ponds E11, E16B, E15B, E14B, E12, E13, E14, E6A, E6B, E8 and E6.
2009 2010 2011
Control Plot
Shell Plot
Other ELER
Control Plot
Shell Plot
Other ELER
Control Plot
Shell Plot
Other ELER
Number of plots 7 7 - 12 12 - 15 15 -
Nests monitored 0 26 49 4 43 82 3 36 64
Nest density (nests/ha) 0 3.71 0.07 0.33 3.58 0.13 0.2 2.4 0.1
Observed hatched - 69% 49% 0% 23% 37% 33% 50% 45%
Observed depredated - 8% 45% 100% 65% 62% 67% 39% 52%
2012 2013 2014
Control Plot Shell Plot Other ELER
Control Plot
Shell Plot Other ELER
Control Plot
Shell Plot Other ELER
Number of plots 15 15 - 15 15 - 15 15 -
Nests monitored 5 18 62 3 11 110 9 32 93
Nest density (nests/ha) 0.33 1.2 0.1 0.2 0.73 0.17 0.60 2.13 0.14
Observed hatched 40% 50% 42% 33% 73% 66% 33% 44% 40%
Observed depredated 40% 44% 56% 67% 27% 30% 67% 47% 58%
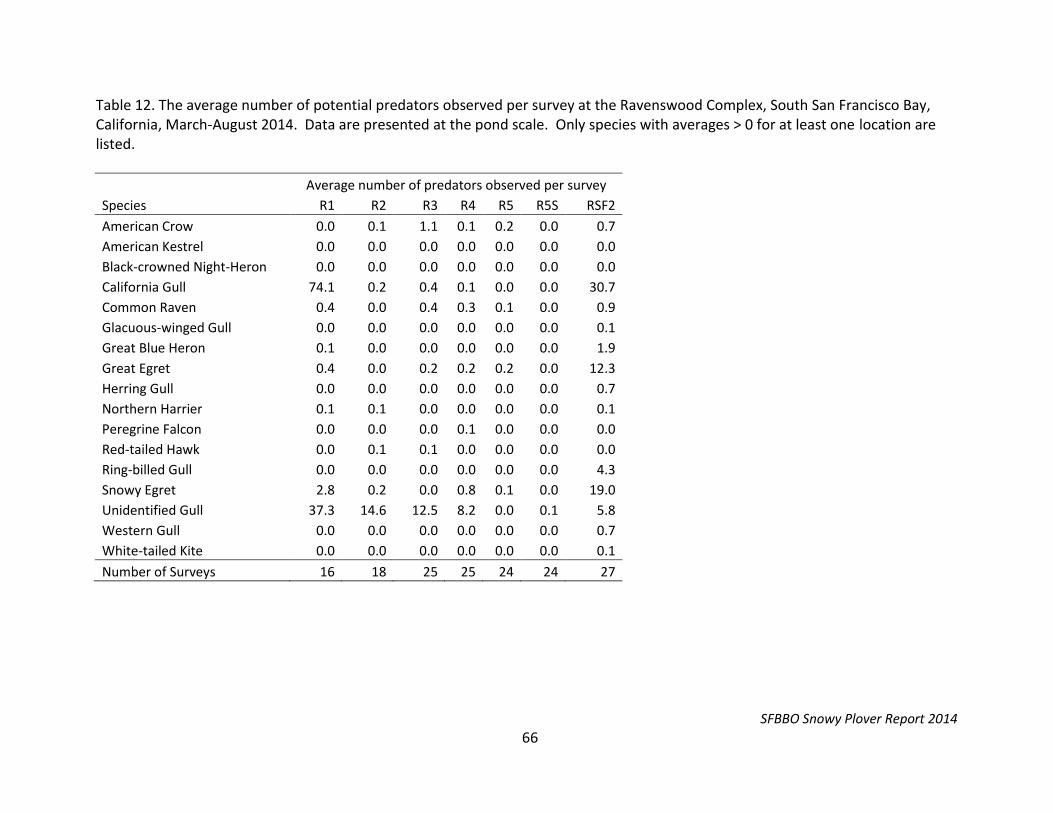
SFBBO Snowy Plover Report 2014
66
Table 12. The average number of potential predators observed per survey at the Ravenswood Complex, South San Francisco Bay, California, March-August 2014. Data are presented at the pond scale. Only species with averages > 0 for at least one location are listed.
Average number of predators observed per survey
Species R1 R2 R3 R4 R5 R5S RSF2
American Crow 0.0 0.1 1.1 0.1 0.2 0.0 0.7
American Kestrel 0.0 0.0 0.0 0.0 0.0 0.0 0.0
Black-crowned Night-Heron 0.0 0.0 0.0 0.0 0.0 0.0 0.0
California Gull 74.1 0.2 0.4 0.1 0.0 0.0 30.7
Common Raven 0.4 0.0 0.4 0.3 0.1 0.0 0.9
Glacuous-winged Gull 0.0 0.0 0.0 0.0 0.0 0.0 0.1
Great Blue Heron 0.1 0.0 0.0 0.0 0.0 0.0 1.9
Great Egret 0.4 0.0 0.2 0.2 0.2 0.0 12.3
Herring Gull 0.0 0.0 0.0 0.0 0.0 0.0 0.7
Northern Harrier 0.1 0.1 0.0 0.0 0.0 0.0 0.1
Peregrine Falcon 0.0 0.0 0.0 0.1 0.0 0.0 0.0
Red-tailed Hawk 0.0 0.1 0.1 0.0 0.0 0.0 0.0
Ring-billed Gull 0.0 0.0 0.0 0.0 0.0 0.0 4.3
Snowy Egret 2.8 0.2 0.0 0.8 0.1 0.0 19.0
Unidentified Gull 37.3 14.6 12.5 8.2 0.0 0.1 5.8
Western Gull 0.0 0.0 0.0 0.0 0.0 0.0 0.7
White-tailed Kite 0.0 0.0 0.0 0.0 0.0 0.0 0.1
Number of Surveys 16 18 25 25 24 24 27
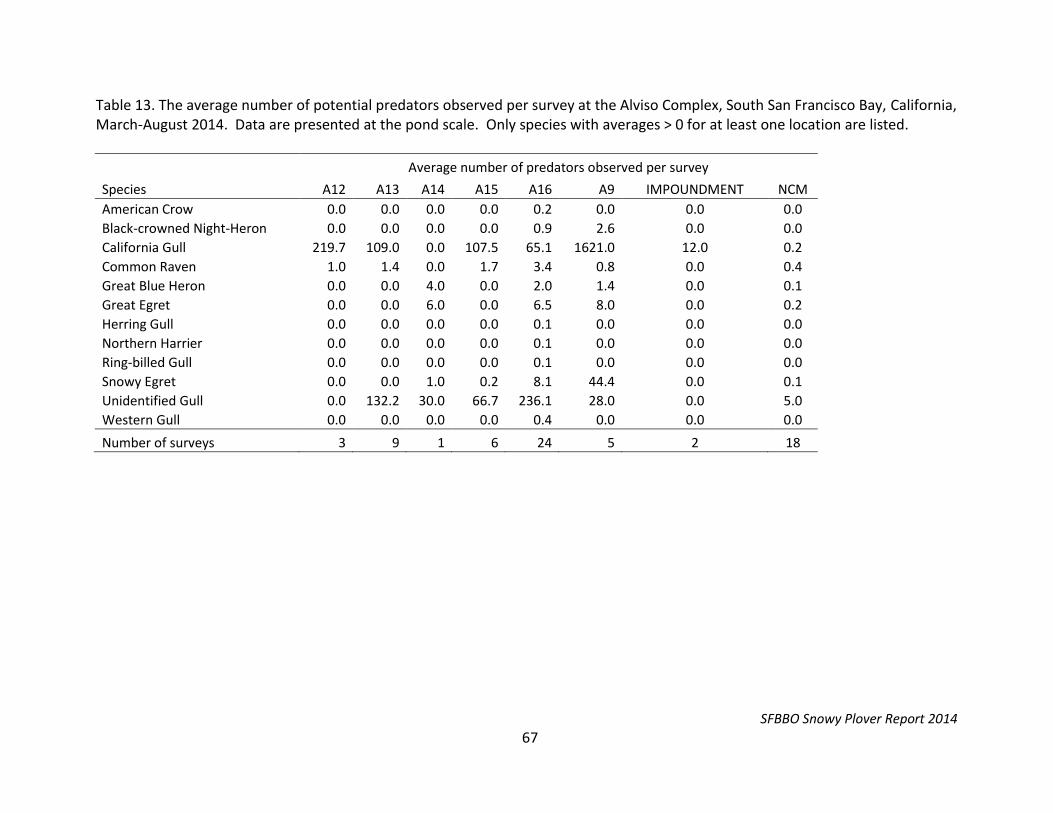
SFBBO Snowy Plover Report 2014
67
Table 13. The average number of potential predators observed per survey at the Alviso Complex, South San Francisco Bay, California, March-August 2014. Data are presented at the pond scale. Only species with averages > 0 for at least one location are listed.
Average number of predators observed per survey
Species A12 A13 A14 A15 A16 A9 IMPOUNDMENT NCM
American Crow 0.0 0.0 0.0 0.0 0.2 0.0 0.0 0.0
Black-crowned Night-Heron 0.0 0.0 0.0 0.0 0.9 2.6 0.0 0.0
California Gull 219.7 109.0 0.0 107.5 65.1 1621.0 12.0 0.2
Common Raven 1.0 1.4 0.0 1.7 3.4 0.8 0.0 0.4
Great Blue Heron 0.0 0.0 4.0 0.0 2.0 1.4 0.0 0.1
Great Egret 0.0 0.0 6.0 0.0 6.5 8.0 0.0 0.2
Herring Gull 0.0 0.0 0.0 0.0 0.1 0.0 0.0 0.0
Northern Harrier 0.0 0.0 0.0 0.0 0.1 0.0 0.0 0.0
Ring-billed Gull 0.0 0.0 0.0 0.0 0.1 0.0 0.0 0.0
Snowy Egret 0.0 0.0 1.0 0.2 8.1 44.4 0.0 0.1
Unidentified Gull 0.0 132.2 30.0 66.7 236.1 28.0 0.0 5.0
Western Gull 0.0 0.0 0.0 0.0 0.4 0.0 0.0 0.0
Number of surveys 3 9 1 6 24 5 2 18
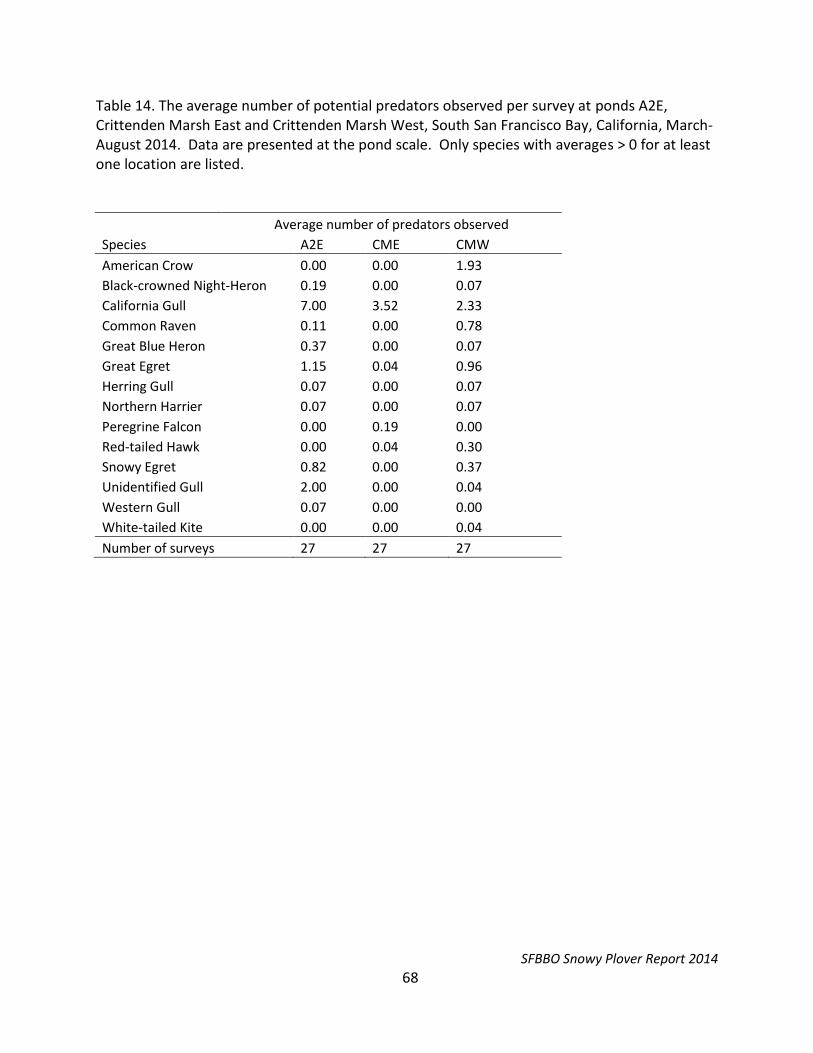
SFBBO Snowy Plover Report 2014
68
Table 14. The average number of potential predators observed per survey at ponds A2E, Crittenden Marsh East and Crittenden Marsh West, South San Francisco Bay, California, March-August 2014. Data are presented at the pond scale. Only species with averages > 0 for at least one location are listed.
Average number of predators observed
Species A2E CME CMW
American Crow 0.00 0.00 1.93
Black-crowned Night-Heron 0.19 0.00 0.07
California Gull 7.00 3.52 2.33
Common Raven 0.11 0.00 0.78
Great Blue Heron 0.37 0.00 0.07
Great Egret 1.15 0.04 0.96
Herring Gull 0.07 0.00 0.07
Northern Harrier 0.07 0.00 0.07
Peregrine Falcon 0.00 0.19 0.00
Red-tailed Hawk 0.00 0.04 0.30
Snowy Egret 0.82 0.00 0.37
Unidentified Gull 2.00 0.00 0.04
Western Gull 0.07 0.00 0.00
White-tailed Kite 0.00 0.00 0.04
Number of surveys 27 27 27
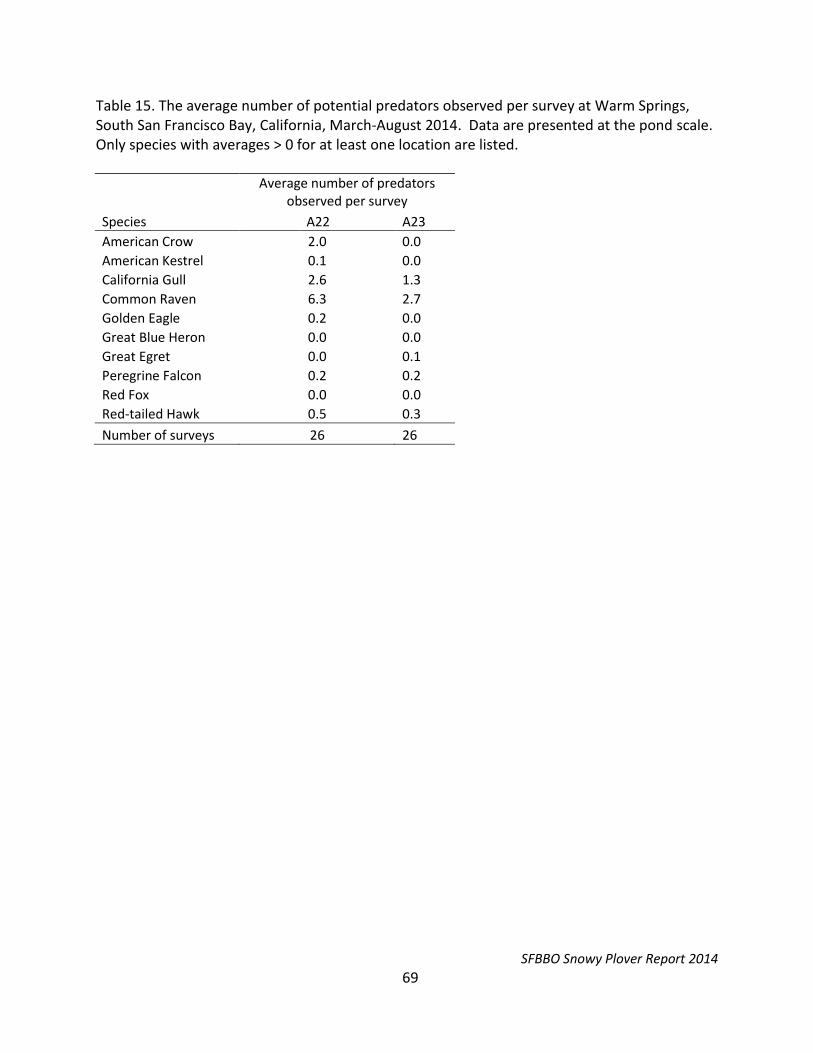
SFBBO Snowy Plover Report 2014
69
Table 15. The average number of potential predators observed per survey at Warm Springs, South San Francisco Bay, California, March-August 2014. Data are presented at the pond scale. Only species with averages > 0 for at least one location are listed.
Average number of predators
observed per survey
Species A22 A23
American Crow 2.0 0.0
American Kestrel 0.1 0.0
California Gull 2.6 1.3
Common Raven 6.3 2.7
Golden Eagle 0.2 0.0
Great Blue Heron 0.0 0.0
Great Egret 0.0 0.1
Peregrine Falcon 0.2 0.2
Red Fox 0.0 0.0
Red-tailed Hawk 0.5 0.3
Number of surveys 26 26
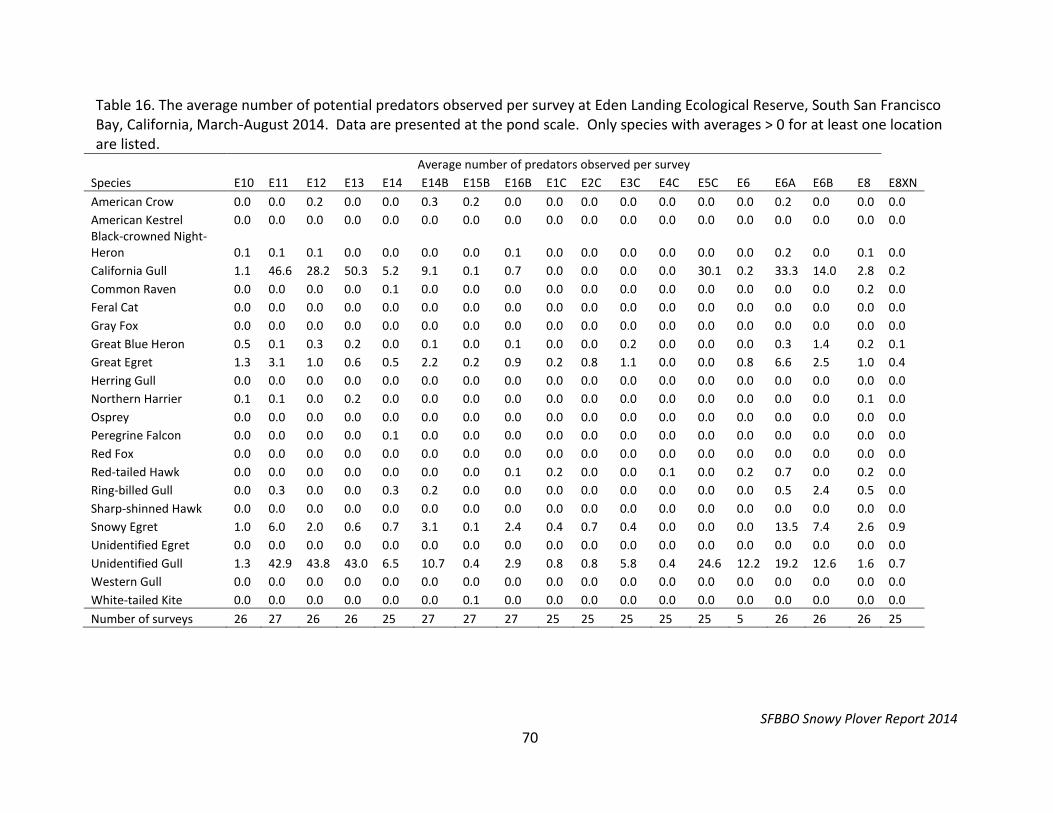
SFBBO Snowy Plover Report 2014
70
Table 16. The average number of potential predators observed per survey at Eden Landing Ecological Reserve, South San Francisco Bay, California, March-August 2014. Data are presented at the pond scale. Only species with averages > 0 for at least one location are listed.
Average number of predators observed per survey
Species E10 E11 E12 E13 E14 E14B E15B E16B E1C E2C E3C E4C E5C E6 E6A E6B E8 E8XN
American Crow 0.0 0.0 0.2 0.0 0.0 0.3 0.2 0.0 0.0 0.0 0.0 0.0 0.0 0.0 0.2 0.0 0.0 0.0
American Kestrel 0.0 0.0 0.0 0.0 0.0 0.0 0.0 0.0 0.0 0.0 0.0 0.0 0.0 0.0 0.0 0.0 0.0 0.0 Black-crowned Night-Heron 0.1 0.1 0.1 0.0 0.0 0.0 0.0 0.1 0.0 0.0 0.0 0.0 0.0 0.0 0.2 0.0 0.1 0.0
California Gull 1.1 46.6 28.2 50.3 5.2 9.1 0.1 0.7 0.0 0.0 0.0 0.0 30.1 0.2 33.3 14.0 2.8 0.2
Common Raven 0.0 0.0 0.0 0.0 0.1 0.0 0.0 0.0 0.0 0.0 0.0 0.0 0.0 0.0 0.0 0.0 0.2 0.0
Feral Cat 0.0 0.0 0.0 0.0 0.0 0.0 0.0 0.0 0.0 0.0 0.0 0.0 0.0 0.0 0.0 0.0 0.0 0.0
Gray Fox 0.0 0.0 0.0 0.0 0.0 0.0 0.0 0.0 0.0 0.0 0.0 0.0 0.0 0.0 0.0 0.0 0.0 0.0
Great Blue Heron 0.5 0.1 0.3 0.2 0.0 0.1 0.0 0.1 0.0 0.0 0.2 0.0 0.0 0.0 0.3 1.4 0.2 0.1
Great Egret 1.3 3.1 1.0 0.6 0.5 2.2 0.2 0.9 0.2 0.8 1.1 0.0 0.0 0.8 6.6 2.5 1.0 0.4
Herring Gull 0.0 0.0 0.0 0.0 0.0 0.0 0.0 0.0 0.0 0.0 0.0 0.0 0.0 0.0 0.0 0.0 0.0 0.0
Northern Harrier 0.1 0.1 0.0 0.2 0.0 0.0 0.0 0.0 0.0 0.0 0.0 0.0 0.0 0.0 0.0 0.0 0.1 0.0
Osprey 0.0 0.0 0.0 0.0 0.0 0.0 0.0 0.0 0.0 0.0 0.0 0.0 0.0 0.0 0.0 0.0 0.0 0.0
Peregrine Falcon 0.0 0.0 0.0 0.0 0.1 0.0 0.0 0.0 0.0 0.0 0.0 0.0 0.0 0.0 0.0 0.0 0.0 0.0
Red Fox 0.0 0.0 0.0 0.0 0.0 0.0 0.0 0.0 0.0 0.0 0.0 0.0 0.0 0.0 0.0 0.0 0.0 0.0
Red-tailed Hawk 0.0 0.0 0.0 0.0 0.0 0.0 0.0 0.1 0.2 0.0 0.0 0.1 0.0 0.2 0.7 0.0 0.2 0.0
Ring-billed Gull 0.0 0.3 0.0 0.0 0.3 0.2 0.0 0.0 0.0 0.0 0.0 0.0 0.0 0.0 0.5 2.4 0.5 0.0
Sharp-shinned Hawk 0.0 0.0 0.0 0.0 0.0 0.0 0.0 0.0 0.0 0.0 0.0 0.0 0.0 0.0 0.0 0.0 0.0 0.0
Snowy Egret 1.0 6.0 2.0 0.6 0.7 3.1 0.1 2.4 0.4 0.7 0.4 0.0 0.0 0.0 13.5 7.4 2.6 0.9
Unidentified Egret 0.0 0.0 0.0 0.0 0.0 0.0 0.0 0.0 0.0 0.0 0.0 0.0 0.0 0.0 0.0 0.0 0.0 0.0
Unidentified Gull 1.3 42.9 43.8 43.0 6.5 10.7 0.4 2.9 0.8 0.8 5.8 0.4 24.6 12.2 19.2 12.6 1.6 0.7
Western Gull 0.0 0.0 0.0 0.0 0.0 0.0 0.0 0.0 0.0 0.0 0.0 0.0 0.0 0.0 0.0 0.0 0.0 0.0
White-tailed Kite 0.0 0.0 0.0 0.0 0.0 0.0 0.1 0.0 0.0 0.0 0.0 0.0 0.0 0.0 0.0 0.0 0.0 0.0
Number of surveys 26 27 26 26 25 27 27 27 25 25 25 25 25 5 26 26 26 25
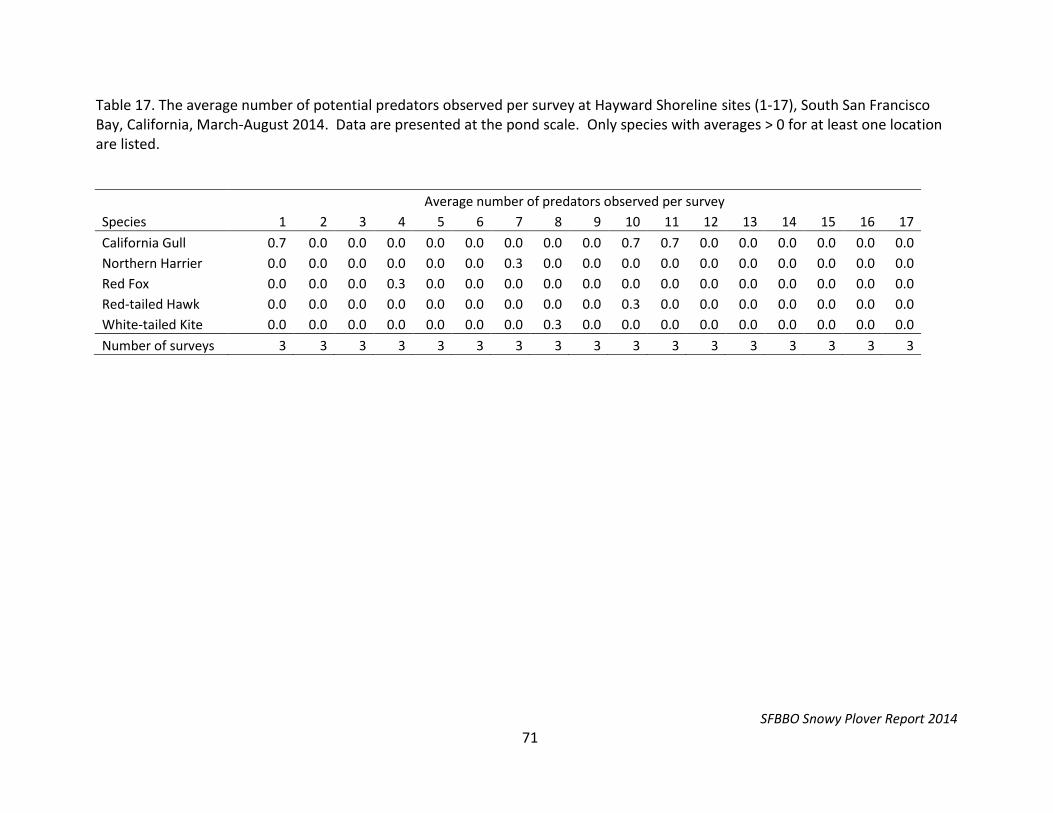
SFBBO Snowy Plover Report 2014
71
Table 17. The average number of potential predators observed per survey at Hayward Shoreline sites (1-17), South San Francisco Bay, California, March-August 2014. Data are presented at the pond scale. Only species with averages > 0 for at least one location are listed.
Average number of predators observed per survey
Species 1 2 3 4 5 6 7 8 9 10 11 12 13 14 15 16 17
California Gull 0.7 0.0 0.0 0.0 0.0 0.0 0.0 0.0 0.0 0.7 0.7 0.0 0.0 0.0 0.0 0.0 0.0
Northern Harrier 0.0 0.0 0.0 0.0 0.0 0.0 0.3 0.0 0.0 0.0 0.0 0.0 0.0 0.0 0.0 0.0 0.0
Red Fox 0.0 0.0 0.0 0.3 0.0 0.0 0.0 0.0 0.0 0.0 0.0 0.0 0.0 0.0 0.0 0.0 0.0
Red-tailed Hawk 0.0 0.0 0.0 0.0 0.0 0.0 0.0 0.0 0.0 0.3 0.0 0.0 0.0 0.0 0.0 0.0 0.0
White-tailed Kite 0.0 0.0 0.0 0.0 0.0 0.0 0.0 0.3 0.0 0.0 0.0 0.0 0.0 0.0 0.0 0.0 0.0
Number of surveys 3 3 3 3 3 3 3 3 3 3 3 3 3 3 3 3 3
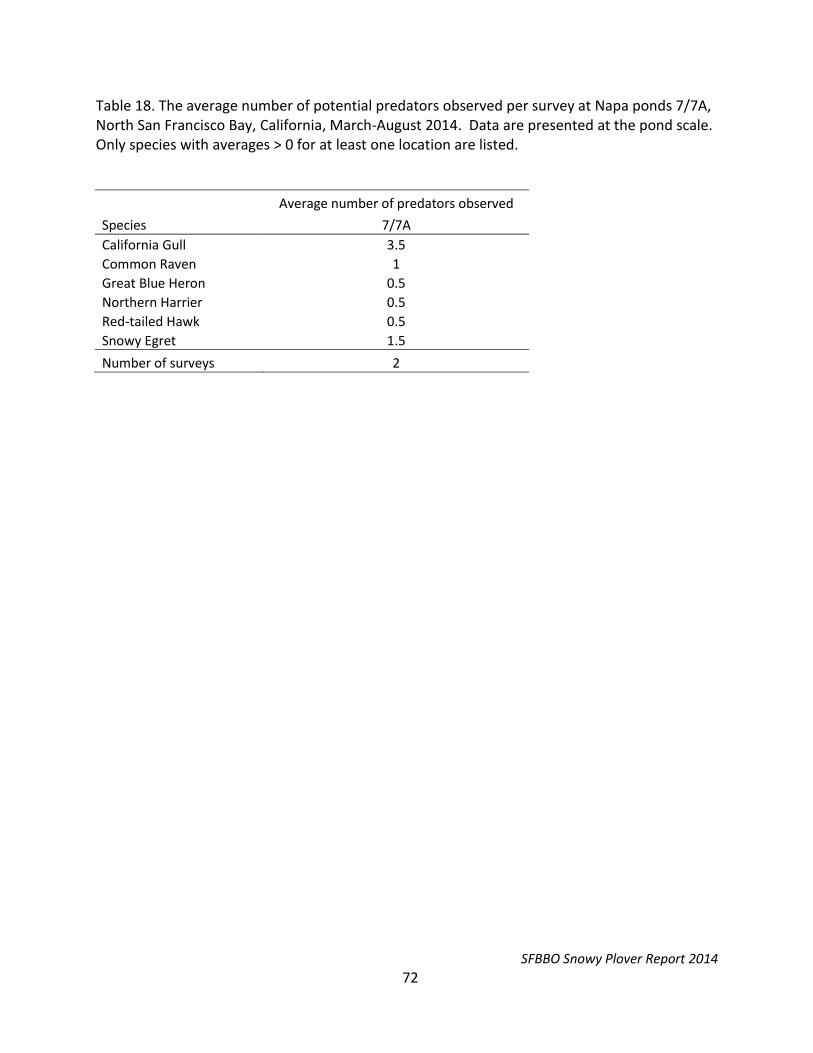
SFBBO Snowy Plover Report 2014
72
Table 18. The average number of potential predators observed per survey at Napa ponds 7/7A, North San Francisco Bay, California, March-August 2014. Data are presented at the pond scale. Only species with averages > 0 for at least one location are listed.
Average number of predators observed
Species 7/7A
California Gull 3.5
Common Raven 1
Great Blue Heron 0.5
Northern Harrier 0.5
Red-tailed Hawk 0.5
Snowy Egret 1.5
Number of surveys 2