Embed Size (px)
Citation preview

Supplementary Figure 1 Validation of Per2 deletion in neuronal cells in N Per2-/- mice. (a) Western blot from liver extracts of mice held under ad libitum conditions detecting PER2 protein in brain and liver tissue of the investigated genotypes. GAPDH as control for each genotype is shown in the panels to the right. (b)

Immunohistochemistry in the Suprachiasmatic nucleus (SCN), Dorsomedial hypothalamus (DMH), Ventromedial hypothalamus (VMH) and Lateral hypothalamus (LH) of wild type, T Per2-/- and N Per2-/- mice at ZT12. Antibodies recognizing NeuN (marker for differentiated neurons) and Per2 are in red and green, respectively. A white rectangle indicates enlarged part of merged image. Scale bar: 200 μm (black), 50 μm (blue). (c) Double-plotted (Mean + SEM, n =3-4) mRNA levels of circadian oscillator components Per2, Bmal1,Clock, Per1, Per2, RORα, Rev-erbα, Cry1 and Dbp in liver of N Per2-/- mice under ad libitum condition at different times of the day. Transcript levels were measured by quantitative PCR and normalized to Gapdh.

Supplementary Figure 2 Characterization of mice. (a) Total daily wheel-running activity under constant darkness (DD) and 12 h/12 hours dark (LD) conditions of wild-type, T Per2-/-, N Per2-/-, and L Per2-/- mice (n = 5). Top bar indicates feeding schedule. (b) T Per2-/- animals become arrhythmic under prolonged DD conditions. (c) General activity and body temperature in DD conditions under AL and RF of all genotypes. (d) Quantification of general activity and change in body temperature in DD under RF conditions (n = 5). (e) Plasma glucose at ZT4 and ZT16 under AL and

RF conditions (n = 4-6). (f) Circadian period of all genotypes determined by χ2-periodogram analysis (n = 6). (g) Quantification of phase shifts observed after a light pulse at CT14 and CT22 (n = 6). All values are mean ± SEM. One-way ANOVA with Tukey’s multiple comparison test, *p < 0.05, **p < 0.01, ***p < 0.001.

Supplementary Figure 3 Lack of rescue of food anticipation in T Per2-/- mice by adenoviral overexpression of Per2 in the liver. (a) PER2 protein in avPer2 infected L Per2-/- mice in various tissues. GAPDH as control for each genotype and treatment (right). (b) Examples of double plotted wheel-running actograms under ad libitum (AL) and restricted feeding (RF) conditions. The black arrow and blue line delineate daily access to food. The blue arrow indicates start of RF. avGFP = control adenovirus expressing green fluorescent protein (GFP). avPer2 = adenovirus

expressing Per2. (c) Quantification of wheel-running activity of n = 6 animals for each genotype. Right panel shows quantification of data from ZT2-ZT4 (yellow area, left panel). (d) Corticosterone levels in plasma (n = 4). All values are mean ± SEM. One-way ANOVA with Tukey’s multiple comparison test, *p < 0.05, **p < 0.01, ***p < 0.001.

Supplementary Figure 4 βOHB and acetyl-CoA levels after adenoviral Per2 and GFP expression in L Per2-/- and T Per2-/- mice. (a) and (b) Double plotted temporal expression profile of carnitin-palmitoyl transferase a (Cpt1a) and hydroxymethyl-glutaryl CoA synthase 2 (Hmgcs2) in liver tissue under ad libitum condition, respectively. Two-way ANOVA with Bonferroni multiple comparison test (n = 4-6) *p < 0.05, **p < 0.01 (c) βOHB plasma levels in L Per2+/+ (black), avGFP_L Per2-/- (white) and avPer2_L Per2-/- mice (pink). (d) βOHB plasma levels in T Per2+/+

(black), avGFP_T Per2-/- (white) and avPer2_T Per2-/- mice (red). (e) Acetyl-CoA levels in liver of L Per2+/+ (black), avGFP_L Per2-/- (white) and avPer2_L Per2-/- mice (pink). (f) Acetyl-CoA levels in liver of T Per2+/+ (black), avGFP_T Per2-/- (white) and avPer2_T Per2-/- mice (red). All values are mean ± SEM. One-way ANOVA with Tukey’s multiple comparison test (n = 4), *p < 0.05, **p < 0.01.

Supplementary Figure 5 Temporal profile of βOHB in plasma and timed coconut oil application to mice. (a) Double-plotted plasma β-hydroxybutyrate (βOHB) levels (n = 5-8) in wild type mice under ad libitum (AL) and restricted feeding (RF) condition at different times of the day. Arrows indicate food access. (b) Timed release of βOHB (green) but not NaCl (white) in L Per2-/- mice mimics the βOHB levels in plasma of L Per2+/+ control animals (black). Measured after 15 days

of infusion. (c) Top: Example of double plotted activity and body temperature actograms of coconut oil infused L Per2-/- mice under ad libitum (AL) and restricted feeding (RF) conditions. Arrows indicate food access. Bottom: quantification of the activity profile (n = 4-6), yellow rectangle represents ZT2-4 time before food access (food anticipatory activity; FAA), and quantification of activity and body temperature, before food access (n = 4). Serum free fatty acid levels at ZT22 and ZT3 in wild type and coconut oil infused L Per2-/- mice. All values are mean ± SEM. One-way ANOVA with Tukey’s post test. *p < 0.05. (d) Western blot showing PER2 levels in the liver after application of NaCl, βOHB, and Sodium pyruvate respectively. GAPDH was used as control for each genotype and treatment.

Supplementary Figure 6 Overexpression of Per2 in the liver does not alter Bmal1 and Per1 expression. Double-plotted (Mean + SEM, n = 3-4) mRNA levels of circadian oscillator components Bmal1 and Per1 in liver of wild-type, avGFP_L Per2-
/- and avPer2_L Per2-/- mice under restricted feeding conditions at different times of the day. Transcript levels were measured by quantitative PCR and normalized to Gapdh. Arrows indicate the time when food access started.

Supplementary Figure 7 Mistimed βOHB release does not restore FAA in L Per2-/- mice. Top: Example of double plotted activity and body temperature actograms of mistimed release of βOHB (ZT4-ZT8) in L Per2-/- mice. Arrows indicate the start of food access. Bottom: quantification of the activity profile (Mean + SEM, n = 4-6), yellow rectangle represents ZT2-4 time before food access (food anticipatory activity; FAA).

Supplementary Figure 8 Liver-specific deletion of exon 6 from Per2. Deletion was obtained by crossing Per2fl/Per2fl and liverCre+ (Alb1-cre) mice and was verified by Illumina ultra-deep sequencing. Read height was adjusted to 25 for all four tracks. A red box indicates deletion of exon 6.

a

b

c

d
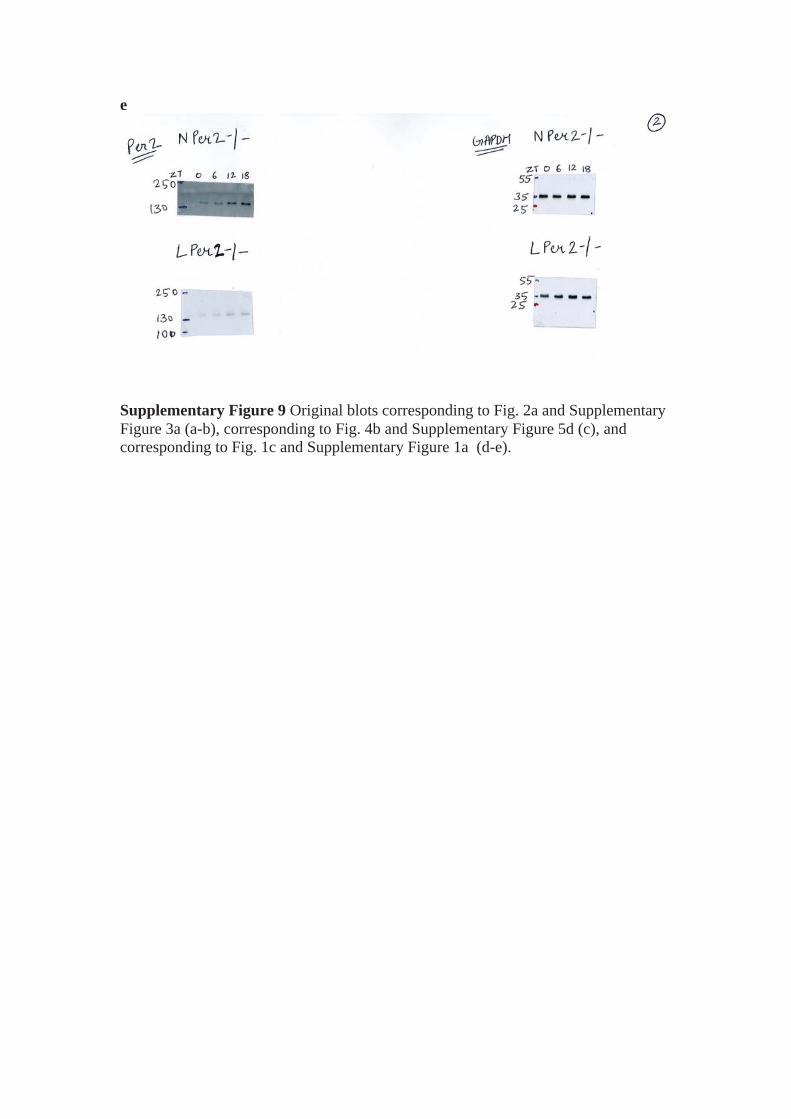
e
Supplementary Figure 9 Original blots corresponding to Fig. 2a and Supplementary Figure 3a (a-b), corresponding to Fig. 4b and Supplementary Figure 5d (c), and corresponding to Fig. 1c and Supplementary Figure 1a (d-e).
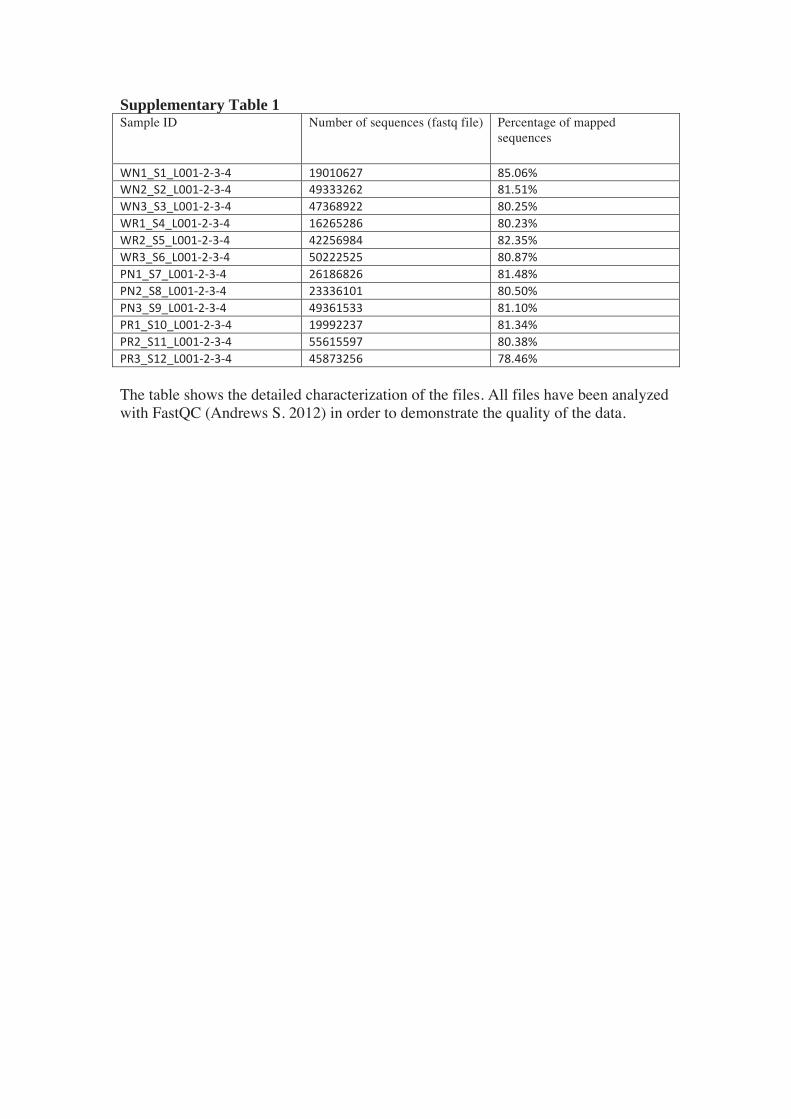
Supplementary Table 1 Sample ID Number of sequences (fastq file) Percentage of mapped
sequences
The table shows the detailed characterization of the files. All files have been analyzed with FastQC (Andrews S. 2012) in order to demonstrate the quality of the data.

Supplementary Table 2
Gene Sense primer Anti-sense primer TM probe (5` FAM: BHQ1 3`)
Gapdh CATGGCCTTCCGTGTTCCTA
CCTGCTTCACCACCTTCT TGA
CCGCCTGGAGAAACCTGCCAAGTAA
Per2 TCCACAGCTACACCA CCCCTTA
TTTCTCCTCCATGCA CTCCTGA
CCGCTGCACACACTCCAGGGCG
Hmgcs2 TGCCCTGGTGGTCTGTGGTG
GCCTTGGGCCCGATCAGCAT
CCCGAGTGGTAACGCCCGCCCC
Cpt1a CCAGGCTACAGTGGGACA
GCCAAAGGTGTCAAATGGG CATCCCTAAGCAGTGCCAGTT
Bmal1 CCAAGAAAGTATGGACACAGACAAA
GCATTCTTGATCCTTCCTTGGT
TGACCCTCATGGAAGGTTAGAATATGCAGAA
Clock TTGCTCCACGGGAATCCT T
GGAGGGAAAGTGCTC TGTTGTAG
ACACAGCTCATCCTCTCTGCT GCCTTTC
Per1 GGCATGATGCTGCTG ACCACG
GGTGGGGATGGGCTC TGTGA
TGGCCCTCCCTCACCTTAGCC TGTTCCT
RORα CCTTCACCAACGGAG AGACT
CCAGGT GGGATTTGG ATATG TCCCCAACCGTGTCCATGGC
Rev-erbα GAAGTGTCTCTCCGTTGG CATGTCT
CGCTCTGCATCTCGG CAAGCAT
CTGTGCGTTTTGGGCGCATCC CCAAG
Cry1 CTGGCGTGGAAGTCA TCGT
CTGTCCGCCGAGTTCTAT G
CGCATTTCACATACACTGTAT GACCTGGACA
The table enlists the primers and TaqMan probes used for quantitative PCR analysis.