Embed Size (px)
Citation preview
Student Outcomes from the Airborne Astronomy Ambassador Teacher Program: Results from Student Assessment in a Randomized Controlled Trial during the 2017-2018 School Year
Josh Valcarcel Ted Britton
Bryan Matlen
11.03.18

WestEd — a nonpartisan, nonprofit research, development, and service agency —
works with education and other communities throughout the United States and
abroad to promote excellence, achieve equity, and improve learning for children,
youth, and adults. WestEd has more than a dozen offices nationwide, from
Massachusetts, Vermont and Georgia, to Illinois, Arizona and California, with
headquarters in San Francisco. For more information about WestEd, visit WestEd.org;
call (415) 565-3000 or, toll-free, (877) 4-WestEd; or write: WestEd / 730 Harrison
Street / San Francisco, CA 94107-1242.
© 2018 WestEd. All rights reserved

Table of Contents
Executive Summary ............................................................................................................... 4
Overview and Background ..................................................................................................... 6
Student Assessment Data Analysis Procedure ...................................................................... 10
Overview of Student Assessment Findings ........................................................................... 12
Trends Across Models .................................................................................................................. 14
Attitudinal Survey Findings........................................................................................................... 16
Trends Across Survey Findings ...................................................................................................... 20
Study Limitations ......................................................................................................................... 22
Conclusions ......................................................................................................................... 23
Appendix A: Terminology Glossary ....................................................................................... 25
Appendix B: Testing Development and Administration ......................................................... 27
Testing Development ................................................................................................................... 27
Testing Procedure ........................................................................................................................ 30
Data Reduction ............................................................................................................................ 32
Appendix C: Baseline Equivalence ........................................................................................ 36
Appendix D: Impact Analysis Models ................................................................................... 40
Appendix E: About the Authors ............................................................................................ 50
References .......................................................................................................................... 51
4
Executive Summary
Since 2011, the SETI Institute has managed the NASA Airborne Astronomy Ambassadors (AAA)
program to provide teachers with professional development experiences regarding airborne
infrared astronomy and the practices of scientific research . This includes providing access to
NASA content experts and the opportunity to visit and fly on the Stratospheric Observation for
Infrared Astronomy (SOFIA). Starting in 2017, the SETI Institute implemented a 10-day
curriculum module – hereafter, the NASA AAA curriculum module – for participating teachers
to incorporate into their formal classroom curricula. The curriculum module was carefully
aligned with national Next Generation Science Standards (NGSS). To assess the impact of this
new NASA AAA curriculum module on student learning, the SETI Institute hired WestEd to
perform a randomized control trial (RCT) to test student learning related to the electromagnetic
spectrum and multi-wavelength astronomy. WestEd developed and administered a student
assessment to test the content knowledge of students whose teachers were involved in the
AAA program and those who had been selected but wait-listed until the next year to serve as a
delayed-treatment comparison group.
The results of this assessment indicate students who experienced the NASA AAA curriculum
module performed better on the student assessment than those who did not. Results were
based on a total of 2343 students, including 1473 treatment students and 870 control.
Hierarchical linear modeling (defined in Appendix A) shows that students exposed to the
curriculum did between 1.12 and 1.54 points (out of 23; 5-7%) better on the post-assessment
than students not exposed. These results were both statistically significant and substantively
meaningful, i.e., meeting the p-value and effect-size thresholds (see page 10, OR see Appendix
A) recommended by the Department of Education’s What Works Clearinghouse (WWC 2017).
Analyses were performed to look at the effect of the curriculum module when controlling for
class characteristics, student characteristics, and the interaction between the curriculum
module and student characteristics. The results of each analysis indicated similar results:
students who were exposed to the NASA AAA curriculum module performed better than those
who were not exposed. This finding was consistent for students of both genders and for

5
students from under-represented minority groups as well as those not from underrepresented
minority groups. No significant interaction was found between the effects of the NASA AAA
curriculum module and either gender or ethnicity.
Students were also surveyed on their attitudes towards STEM education and STEM careers.
Results indicate students exposed to the NASA AAA curriculum module felt they gained more
from their course and showed a larger change in attitudes from the beginning to the end of
their course than did students not exposed. This change was largest for questions related to
content knowledge – such as knowing about the electromagnetic spectrum, infrared radiation,
and infrared astronomy – and to questions related to the collaborative nature of science.
Student survey results indicate a lesser impact on student interest in science or science-related
careers.
The results of this assessment confirm that the NASA AAA curriculum module had a positive
and substantively important impact on student learning outcomes related to the
electromagnetic spectrum and infrared astronomy. Study limitations include potential over-
alignment between the curriculum and assessment and having only moderate instrument
reliability (see Appendix A for definition). Also, only limited information was available regarding
how the NASA AAA curriculum module was actually implemented and regarding the “business
as usual” instruction that the comparison students received

6
Overview and Background
The NASA Airborne Astronomy Ambassadors (AAA) program is a professional development
program developed and managed by the SETI Institute. In the current paradigm, the AAA
program is aimed at high school science teachers – providing content knowledge regarding the
electromagnetic spectrum and infrared astronomy. Started in 2011, the program provides
science teachers with hands-on professional development experiences, including a trip to
NASA’s Armstrong Flight Research Center and the opportunity to fly on NASA’s premier infrared
astronomy observatory, the Stratospheric Observation for Infrared Astronomy (SOFIA), a
specialized Boeing 747SP carrying an infrared telescope. Participating teachers called Airborne
Astronomy Ambassadors (AAAs) spend a week at the Armstrong Flight Research Center, meet
with key scientists, engineers, and technicians, tour instrument and hangar facilities, and spend
one to two nights flying aboard SOFIA. Prior to the week at Armstrong, teachers are provided
with six months of training. In addition to providing participants with SOFIA flight experiences,
AAA professional development includes an online, college-level introductory astronomy course,
and webinars providing infrared-specific astronomy tied to SOFIA. The program also gives
participants a 1-day in-person training regarding the contents of the SETI Institute-developed
NASA AAA curriculum module and pedagogies for teaching it.
Starting in 2017-2018, the AAA program has also included a 10-day curriculum module (the
NASA AAA curriculum module) regarding infrared astronomy and the electromagnetic spectrum
for Ambassadors to deliver to their students as part of their formal course curricula. This new
curriculum module is part of an effort by the SETI Institute to restructure the AAA program to
provide more direct impact on student learning in the classroom. The 10-day NASA AAA
curriculum module aims to support teaching students about the electromagnetic spectrum and
multi-wavelength astronomy . The SETI Institute AAA staff carefully designed the curriculum
module to align with national Next Generation Science Standards (NGSS) and the corresponding
California Science Framework. The curriculum module makes use of real-world examples of
research conducted using SOFIA, teacher experience aboard the aircraft, and by using hands-on
activities and investigations tied to the electromagnetic spectrum. The ultimate goal of the

7
NASA AAA curriculum module is to give students a more in-depth and retainable understanding
of the electromagnetic spectrum than is attained in a traditional science course. A secondary
aim of the program is to increase students’ interest in science education and career paths. The
AAA teacher professional development obtained during the intensive SOFIA flight week aimed
to provide real-world examples and personal experiences to support teaching of the NASA AAA
curriculum module, which incorporated opportunities to include personal AAA stories and
learnings. To enhance student connection to real-world research and highlight AAA experience,
the curriculum module included three specific instances for teachers to insert details personally
observed during their flight week.
The SETI Institute contracted WestEd to serve as external evaluators to the AAA program.
WestEd has served as the external evaluator for 6 of the 7 years since the Ambassador program
first launched. To most rigorously assess the impact of the NASA AAA curriculum module on
student learning outcomes, WestEd worked with the SETI Institute to conduct a randomized
control trial (RCT) study on the assessment. To evaluate the impact of the NASA AAA curriculum
module on students’ content knowledge related to infrared astronomy and the electromagnetic
spectrum, WestEd in conjunction with the SETI Institute developed a student content-
assessment that WestEd had teachers administer to their students during the 2017-2018
academic year. The assessment was administered both to students of teachers who
participated in the program as well as to students of teachers in a comparison group who were
wait-listed to participate in the program in 2018-2019. The SETI Institute partnered with eight
school districts in California, from which teachers applied to the program. The SETI Institute
selected 40 applicants total to participate in the program. The SETI Institute had capacity to fly
24 Ambassadors in the 2017-2018 school year, meaning 16 of the selected teachers would have
to wait until the next school year to receive training and fly onboard SOFIA. WestEd was
provided with a list of the 40 selected applicants and from this list randomly assigned 24 to
serve as the treatment group while the other 16 were designated as a delayed-treatment
comparison group. Of these teachers, one each from the treatment and comparison group
(including the sole participant from one of the eight districts) left the study before any training

8
or data collection was performed. Both these teachers cited personal issues as their rationale
for discontinuing their participation in the program. Thus, the final RCT study samples were
students of 23 teachers in the treatment group and 15 teachers in the control group.
The 23 teachers selected as the treatment group comprised Cycle 5 of the Airborne Astronomy
Ambassadors program and were given professional development experiences during the spring
and summer of 2017 as well as the opportunity to visit the Armstrong Flight Research Center
and fly on SOFIA. The remaining 15 teachers did not receive any training or exposure to NASA
or SETI Institute content experts until spring 2018. Teachers in the treatment group were given
the NASA AAA 10-day curriculum module to teach to their students during the 2017-2018
academic year, while teachers in the comparison group were instructed to use their standard
curricula.
To assess the impact of the NASA AAA curriculum module on student learning, WestEd
developed and administered a twenty-three item multiple choice content-assessment to
students in the treatment and comparison groups during the 2017-2018 academic year. WestEd
developed the student assessment in conjunction with the SETI Institute. WestEd worked with
teachers in both the treatment and comparison groups to have teachers administer the
assessment in class. The assessment was administered online using the SurveyMonkey online-
survey platform. Teachers in both groups were given the assessment on September 5th 2017
and were asked to administer it before teaching any content related to the electromagnetic
spectrum. In both groups, teachers were also asked to administer a post-assessment at some
point during the final three weeks of their course. Because teachers were not all teaching
courses of the same length (i.e. some taught semester long courses while others taught
yearlong courses), asking teachers to administer the pre- and post-assessments in timeframes
relative to the start and end of their course was the most practical way to establish equivalent
testing procedures across treatment and comparison groups. Teachers were given a three-week
timeframe to administer the post-assessment to ensure teachers had adequate opportunity to
conduct their normal final exams and projects.

9
Student pre- and post-assessment data were collected and analyzed by WestEd researchers to
investigate the impact of the NASA AAA curriculum module on student performance. This
report contains information and findings from the student assessment.
10
Student Assessment Data Analysis Procedure
Students assessment results were analyzed using hierarchical linear modeling (defined in
Appendix A) to look at student post-assessment scores, taking into account students’ pre-
assessment scores and students’ teacher as a random effect.
Impact analysis was conducted with all students with valid pre- and post-assessment data (n =
2324). For each analysis, four models were explored: a Condition Model, a Class Covariate
Model, a Student-Class Covariate Model, and an Interaction Model. The Condition Model
included students’ pre-score, condition status, and teacher as a random effect. The Class
Covariate Model included the Condition Model variables and class characteristics such as
subject and AP status. The Student-Class Model took those variables into account along with
student gender, ethnicity, and grade. The Interaction Model included all variables in the
Student-Class Model, as well as the interaction between condition and demographic variables
(i.e. gender and ethnicity). In all models, students’ pre-assessment scores were included as a
level-1 covariate. A complete description of each model is provided in Appendix C.
Student Assessment Internal Reliability
Cronbach’s alpha was used to assess the internal reliability of the student-assessment (see
Appendix A). Cronbach’s alpha was run on both the pre- and the post-assessment. For both the
pre- and post-assessment, all 23 assessment items and 2343 respondents were included in the
Cronbach alpha analysis. The Cronbach alpha value for the pre-assessment was .51 and the
value for the post-assessment was .60. The What Works Clearinghouse (WWC) defines the
minimum standard for internal reliability to be a Cronbach’s alpha of 0.50 or higher (WWC,
2018). This indicates the student assessment had acceptable levels of internal reliability.
Baseline Equivalence
Overall teacher attrition from assignment to post-assessment data collection was 5% (2 of 40),
with a 4% (1 of 25) attrition for the treatment group and a 6% attrition rate for the comparison
group (1 of 16). Two treatment teachers did not have their students do the attitudinal survey,

11
leading to an overall attrition rate of 10%, with a treatment attrition rate of 12% and a
comparison attrition rate of 6%. The teacher attrition rate for both the assessment and
attitudinal survey is considered low attrition according to WWC standards (WWC, 2018).
The overall attrition rate for students from pre- to post-assessment was 22%, with a differential
rate of 3% between treatment and control. This is considered low attrition according to WWC
standards (WWC, 2018). This is associated with a low expected bias and indicates baseline
equivalence between treatment and control. Nonetheless, the between-groups difference on
the pre-assessment was examined and a between-groups effect size of -0.9 was observed. This
is a small difference and indicates group equivalence on the pre-assessment.
Attitudinal survey responses showed an overall attrition rate of 26%, with a differential rate of
2% between treatment and control. As with the assessment data, this is considered a low
attrition according to WWC standards (WWC, 2018).
Effect Size and P-Values
Two important statistics reported in this paper are p-values and effect size.
P-values give information about the precision of the statistical analyses. Lower p-values are
representative of higher precision, and would indicate a higher likelihood that the differences
are statistically significant from zero, if there was truly no difference. The standard convention
in educational research, adopted by the WWC, is to consider p-values smaller than 0.05 to be
statistically significant from zero (WWC, 2018).
Effect sizes (reported as Cohen’s d; defined in Appendix A) represent the magnitude of the
statistical effects. Effect sizes represent the changes from pre-to post-test, in units of standard
deviations. Effect sizes below 0.25 are considered small, but could still be educationally
meaningful. Those above 0.25 are considered substantive for education according to the WWC
(WWC, 2018).

12
Overview of Student Assessment Findings
Student assessment results were analyzed using hierarchical linear modeling (see Appendix A)
to look at student post-assessment scores, taking into account students’ pre-assessment scores
and students’ teacher as a random effect. Impact analysis was conducted with all students with
valid pre- and post-assessment data (n = 2343). Further analysis was also conducted to look at
outcome data only for students enrolled in astronomy, earth-space science, or physics, three
courses identified by the SETI Institute as most-relevant for the NASA AAA curriculum module.
For each analysis, four models were explored: a Condition Model, a Class Covariate Model, a
Student-Class Covariate model, and an Interaction Model. In all models, students’ pre-
assessment score was included as a level-1 covariate. These models are explained in full in
Appendix D.
Findings across models indicate a consistent, significant, and substantively important positive
effect of the NASA AAA curriculum module on student assessment performance across impact
analysis models. Table 1 shows the condition coefficients and associated effect sizes for the
NASA AAA curriculum module. Table 1 does not include the results for the interaction models
as the main effects of interaction models are not readily interpretable. A full report of each of
the eight analytic models with complete information on coefficient, standard error, p-value,
and effect size information is provided in Appendix D.
Table 1. Coefficients, p-values, and effect sizes for condition variable across analysis models. Coefficient p-value Effect Size
Condition Model 1.12 0.01* 0.35 Class-Covariate Model 1.44 0.00* 0.44
Student-Class-Covariate Model
1.47 0.00* 0.45
Condition Model (for select subjects)
1.22 0.01* 0.37
Class-Covariate Model (for select subjects)
1.49 0.01* 0.45
Student-Class-Covariate Model (for select subjects)
1.54 0.01* 0.46

13
The above table illustrates that for each analysis that was run, students who were exposed to
the NASA AAA curriculum module performed better on the student-assessment than those who
were not exposed. In each analysis, it was found that students who were taught the NASA AAA
curriculum module performed better than those who were not. This difference ranged from a
1.12 points to 1.54 points difference across the models. This is to say, students exposed to the
curriculum module did 1.12 to 1.54 points better on the post-assessment than did comparison
students, when controlling for pre-assessment score and other variables. All models had
associated p-values under the 0.05 alpha threshold.
According to What Works Clearinghouse (WWC) procedural guidelines, “an effect size of 0.25
standard deviations or larger is considered to be substantively important” (WWC, 2018). In
addition, the WWC considers p-values less than .05 to be considered statistically significant.
With these guidelines in mind, it can be concluded that the NASA AAA curriculum module
provided a statistically significant and substantively important positive effect on student
learning outcomes across all analytic models. This represents a robust and reliable impact of
the curriculum module on the student assessment.
Figure 1. Average Post-assessment Content Knowledge Performance for Treatment and Control

14
Figure 1 shows average post-assessment student content knowledge performance for
treatment and control groups. This figure illustrates that treatment students scored higher than
did control students. This trend persisted when controlling for both course and student
demographics, as well as when limiting the analysis to only students enrolled in astronomy,
physics, or earth-space science courses.
Trends Across Models
A comparison of impact models revealed some consistent trends in student performance.
Across all models, students in AP courses did better on the post-assessment. Astronomy
students did better than biology or earth science students, but not chemistry students; the
results in relation to physics were mixed. Students of underrepresented minority (URM) groups
scored lower on the post-assessment than did non-URM students. Gender and grade showed
no significant differences. Likewise, there was no significant interaction between the condition
variable and either gender or ethnicity.
AP Courses: AP course status was a variable included in the Class covariate, Student-Class
Covariate, and Interaction models. Across all models, AP status had a significant impact on
assessment performance. Students in AP courses on average did 2.45 and 3.04 points better on
the post-assessment than did students in non-AP courses, when controlling for other variables.
Astronomy Courses: Across all analytic models, students in astronomy courses did better than
students in other courses. Astronomy students did significantly better than biology and earth-
space science students in each of the models. Astronomy students did better than physics
students, though this difference was not statistically significant in the full data set (there was a
significant difference when comparing only astronomy, earth space science, and physics).
Interestingly, astronomy students did not do significantly better on the assessment than did
chemistry students; though astronomy students did slightly better than did chemistry students
this difference was not statistically significant when controlling for other factors. It is important
to bear in mind that only the control group had chemistry students; there were no chemistry

15
students in the treatment group. Thus, there is evidence that chemistry students perform
similarly to astronomy students on the assessment, but evidence does not address whether
chemistry students would benefit from the curriculum as much as astronomy students. In
addition, the results of course comparisons in this report should not be over interpreted due to
the small number of classes involved in the study for a given course topic.
URM Students: Students from underrepresented minority groups showed significantly lower
post-assessment scores compared to students not in these groups. Students whose background
was Black/African American, Hispanic/Latino, or Native American/American Indian were
considered URM students, as defined by the National Action Council for Minorities in
Engineering (NACME, 2013). The impact of the curriculum module was similar for both groups.
Figure 2 shows the average assessment scores for URM and non-URM students in treatment
and control.
Figure 2. Average Post-assessment Content Knowledge Scores for non-URM and URM students in Treatment and Control

16
Gender: There was no significant gender difference. Both male and female students did
approximately the same on the post-assessment, when controlling for other factors. The impact
of the curriculum module was similar for both groups. Figure 3 shows the average post-
assessment scores for female and male students in treatment and control.
Grade: There was no significant difference across grade levels. Students performed roughly the
same on the post-assessment regardless of their grade level, controlling for other factors.
Interaction Effects: There was no significant interaction between the condition variable and
either gender or ethnicity. The NASA AAA curriculum module provided similar impact on
students of both genders and across ethnicities.
Attitudinal Survey Findings
To assess the impact of the NASA AAA curriculum module on students’ attitudes towards
science, students responded to 11 questions about how they believe their course has impacted
them and to 7 retrospective pre-post questions which asked about their views related to
science at the beginning and end of their course. All questions were on a five-point scale:
Figure 3. Average Content Knowledge Post-assessment scores for Female and Male students in Treatment and Control.

17
“strongly disagree”; “disagree”; ”neutral”; ”agree”’; ”strongly agree.” This scale was converted
to a numeric scale with “strongly disagree” = 1 and “strongly agree” = 5. Student responses on
each item were analyzed individually for each of the 11 belief questions and for each of the 7
post items for the retrospective pre-post item pairs.
Table 2 shows average retrospective pre- and post-scores for treatment and control students.
Treatment students showed higher post-ratings than did control students for all but two of the
questions. Treatment and control students gave equal ratings on both the pre- and post-
questions regarding interest in formally studying science after high school. Treatment students
gave a slightly lower rating on the pre- and post-questions regarding interest in becoming a
scientist. For all other questions, treatment students showed a higher rating than did control.
Table 2. Average Pre and Post Ratings on Retrospective Pre-Post Items by Condition Status
Control (N = 841)
Treatment (N = 1397)
Pre Post Pre Post
I am interested in formally studying more science after high school (e.g. in college)
M = 2.87 (SD = 1.18)
M = 2.94 (SD = 1.18)
M = 2.87 (SD = 1.12)
M = 2.94 (SD = 1.16)
I am interested in informally learning more about science on my own after high school (e.g. media, science center)
M = 2.88 (SD = 1.14)
M = 2.93 (SD = 1.17
M = 2.91 (SD = 1.04)
M = 2.98 (SD = 1.15
I would be comfortable with a job/career that requires using science
M = 2.96 (SD = 1.13)
M = 3.01 (SD = 1.15)
M = 3.00 (SD = 1.08)
M = 3.06 (SD = 1.14)
I am interested in becoming a scientist M = 2.54
(SD = 1.11) M = 2.66
(SD = 1.12) M = 2.49
(SD = 1.06) M = 2.62
(SD = 1.12)
I think there are multiple ways I can become involved in science
M = 3.18 (SD = 1.08)
M = 3.24 (SD = 1.11)
M = 3.22 (SD = 1.04)
M = 3.35 (SD = 1.09)
Scientific research requires a team of people with different types of skills
M = 3.49 (SD = 1.10)
M = 3.56 (SD =1.13)
M = 3.68 (SD = 1.03)
M = 3.79 (SD = 1.08)
Scientists DO NOT mostly work on their own**
M = 3.44 (SD = 1.16)
M = 3.44 (SD = 1.09)
M = 3.49 (SD = 1.02)
M = 3.58 (SD = 1.10)
**Item was reworded for reporting and scaling was reversed for analysis; original wording for this item was “Scientists work mostly on their own”
18
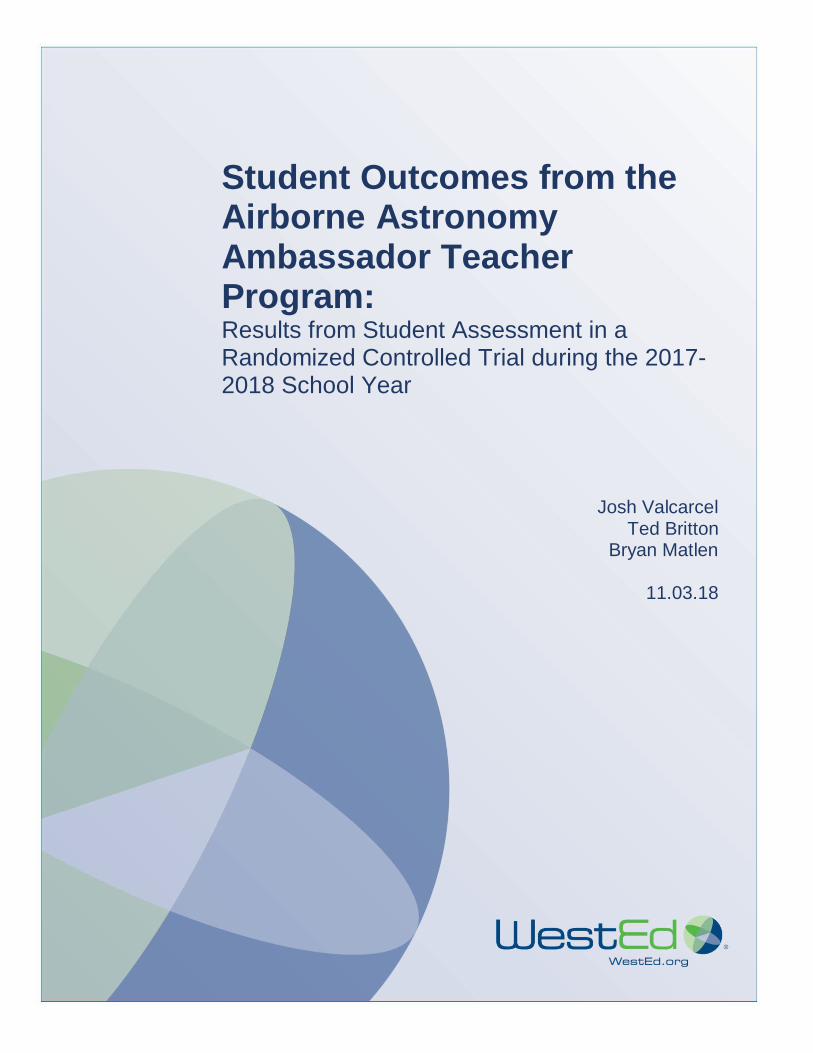
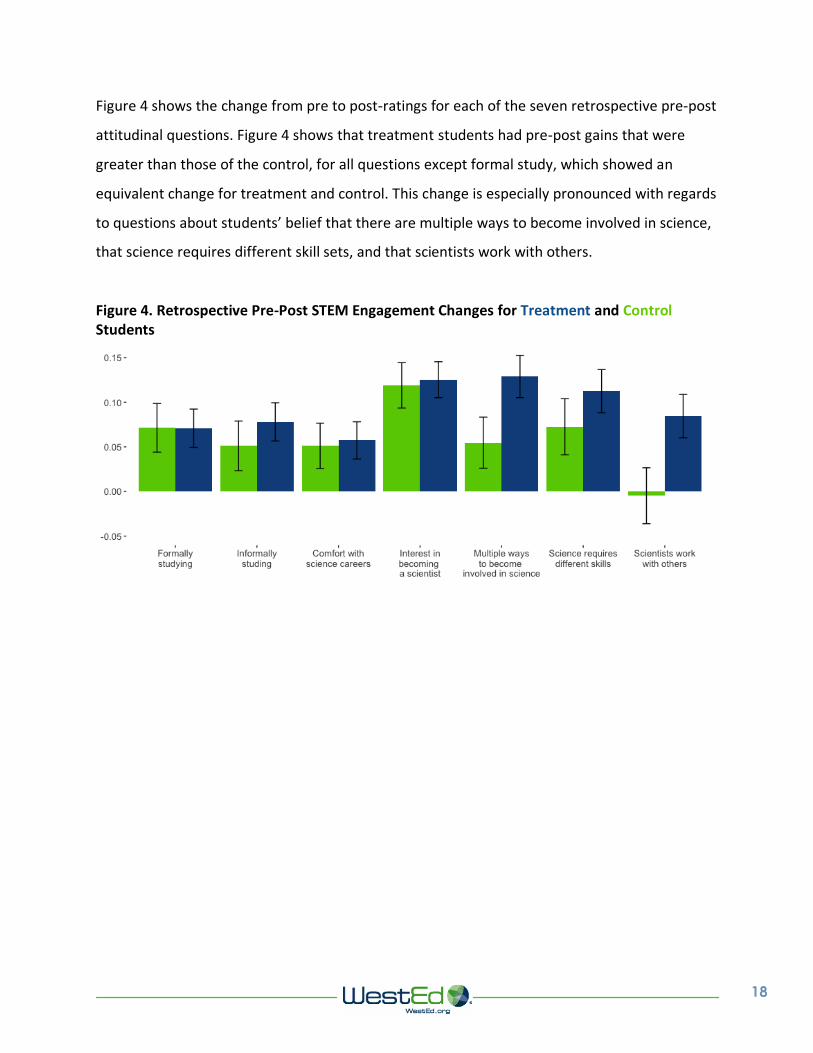
Figure 4 shows the change from pre to post-ratings for each of the seven retrospective pre-post
attitudinal questions. Figure 4 shows that treatment students had pre-post gains that were
greater than those of the control, for all questions except formal study, which showed an
equivalent change for treatment and control. This change is especially pronounced with regards
to questions about students’ belief that there are multiple ways to become involved in science,
that science requires different skill sets, and that scientists work with others.
Figure 4. Retrospective Pre-Post STEM Engagement Changes for Treatment and Control Students

19
Table 3 shows average ratings for the 11 questions students were asked about how much they
learned from their course. Students in the treatment group provided higher ratings than did
control students for all 11 questions.
Table 3. Average Ratings on Attitudinal Questions by Condition Status
Control (N = 845)
Treatment (N = 1398)
I got some new ideas about what science is M = 3.36
(SD = 1.05) M = 3.56
(SD = 0.97)
I better understand the electromagnetic spectrum M = 3.04
(SD = 1.04) M = 3.49
(SD = 0.99)
I better understand infrared radiation/light M = 3.13
(SD = 1.02 M = 3.66
(SD = 0.95)
I better understand infrared astronomy M = 3.01
(SD = 1.04) M = 3.45
(SD = 0.97)
I got some new ideas about what happens in scientific research projects
M = 3.31 (SD = 1.03)
M = 3.52 (SD = 0.98)
I am more interested in learning about scientific research M = 3.08
(SD = 1.12) M = 3.22
(SD = 1.09)
I am better at using models to explain science concepts M = 3.16
(SD = 1.04) M = 3.27
(SD = 1.01)
I am better at using data to answer questions M = 3.17
(SD = 1.04) M = 3.32
(SD = 0.96) I want to know more about what science-related careers there are
M = 3.03 (SD = 1.11)
M = 3.09 (SD = 1.12)
I got new ideas about what science-related careers there are M = 3.07
(SD = 1.02) M = 3.22
(SD = 1.01)
I learned the importance of teamwork in science M = 3.34
(SD = 1.09) M = 3.55
(SD = 1.06)
20
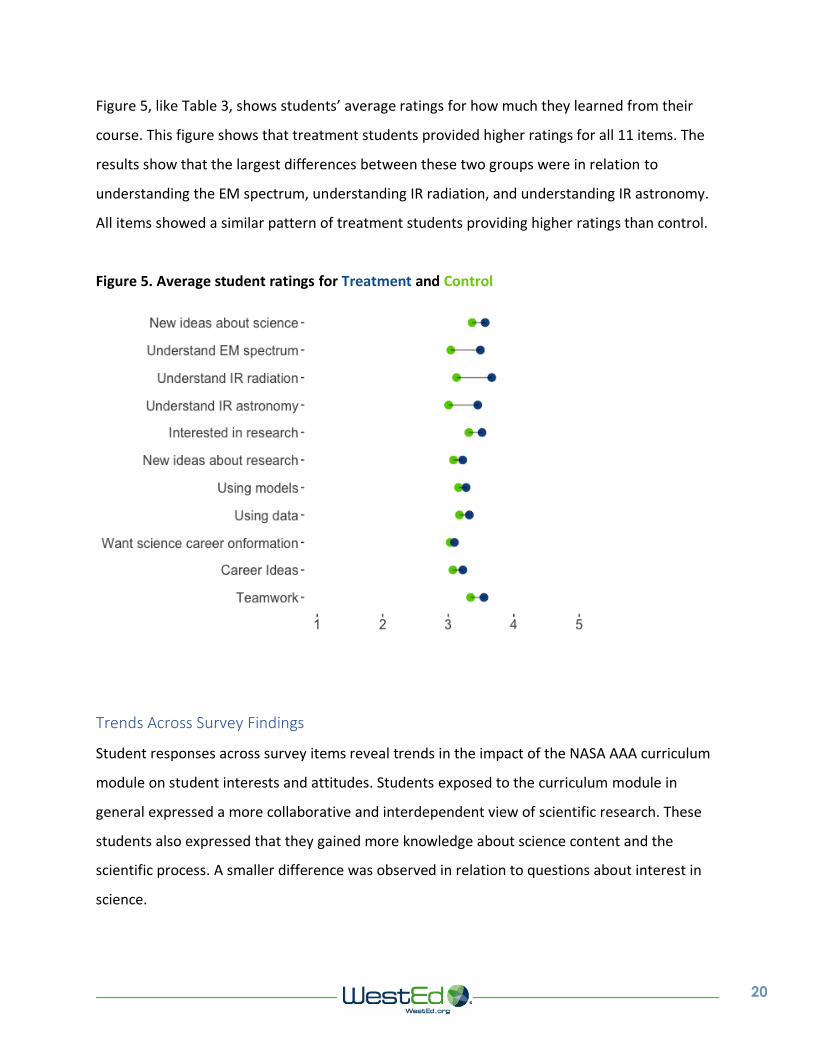
Figure 5, like Table 3, shows students’ average ratings for how much they learned from their
course. This figure shows that treatment students provided higher ratings for all 11 items. The
results show that the largest differences between these two groups were in relation to
understanding the EM spectrum, understanding IR radiation, and understanding IR astronomy.
All items showed a similar pattern of treatment students providing higher ratings than control.
Figure 5. Average student ratings for Treatment and Control
Trends Across Survey Findings
Student responses across survey items reveal trends in the impact of the NASA AAA curriculum
module on student interests and attitudes. Students exposed to the curriculum module in
general expressed a more collaborative and interdependent view of scientific research. These
students also expressed that they gained more knowledge about science content and the
scientific process. A smaller difference was observed in relation to questions about interest in
science.

21
Collaboration in science: Students in the treatment group consistently provided higher ratings
on questions related to teamwork and collaboration in science. Treatment students expressed
that they learned more about the importance of teamwork in science compared to comparison
groups and had higher levels of agreement that science requires teams of people with different
skills and that scientists do not work alone. This indicates that students who are exposed the
NASA AAA curriculum module develop a greater appreciation for the collaborative and
interdependent nature of contemporary scientific enterprise.
Content and Science Process Knowledge: Students exposed to the NASA AAA curriculum
module felt they gained more from their course about content knowledge related to the
electromagnetic spectrum, infrared radiation, and infrared astronomy. Similarly, these students
felt they gained more ideas about what science is and what happens in scientific research
projects. This indicates that students exposed to the NASA AAA curriculum module felt they
learned more content knowledge than those who were not exposed.
Interest in Science: Student interest in learning more about science or pursing a scientific
career was slightly higher for treatment students than comparison. Retrospective pre-post
changes in learning more science informally and interest or comfort in scientific careers was
greater for treatment than comparison students, though this difference was less than for other
items. Similarly, treatment students gave slightly higher ratings than control of how much their
course increased their interest in learning about scientific research or what science related
careers there are. However, these differences were less than those regarding content
knowledge.
Together, these findings indicate that the NASA AAA curriculum module has an impact on
students understanding of scientific content and scientific processes, as well as provides
students with a more collaborative view of scientific research but had a lesser impact on
students’ interest in science.
22
Study Limitations
When interpreting the results of this report, it is important to keep in mind several key
limitations of the study.
(Over)Alignment: One important limitation to this report is that the information it is based on
comes from an assessment that was designed for the NASA AAA curriculum module. The WWC
states that the outcome must not be overaligned with the intervention in order for a research
study to meet their standards (WWC, 2018). Results were based on a researcher-developed
test, developed around the NASA AAA curriculum module.
Psychometrics: Though the internal reliability for both the pre- and post-assessments was
considered acceptable according to WWC standards, the internal reliability is lower than that of
many existing standardized testing instruments. Future research should explore the effects of
the curriculum module with more validated measures.
Mechanisms of Change: This study was not designed to study implementation. The study
reported on in this report was designed to serve as a study of promise on student outcomes.
The study did not address how the curriculum module was implemented or how it compares to
instruction provided to students not receiving the curriculum module. Further research is
needed to investigate what causal mechanisms are driving differences in student performance.
Generalizability: This study was conducted with students drawn exclusively from California
public schools. As such, the generalizability of these findings may be limited. For instance, the
weighted average percentage of URM students across districts involved in this study was 59%,
compared to the statewide average of 60% across California. This indicates that this study can
be generalized to other students in California in terms of ethnicity. However, the results cannot
be generalized to other states with other ethnic distributions. In addition, the study also may
not be generalizable to other districts within the state of California in terms of other
23
characteristics, such as urban/rural or socioeconomic status. Future studies should look at the
effects of the curriculum module with more heterogeneous samples of students.
Conclusions
The results of this report indicate that students who were taught the NASA AAA curriculum
module learned more about the electromagnetic spectrum and infrared astronomy than did
students who were not exposed. Students exposed to the NASA AAA curriculum module did
better on the student-assessment developed by WestEd researchers than those not exposed.
This finding was consistent when controlling for both class characteristics and student
demographics. The finding was similar for both male and female students and for students from
underrepresented minority groups and those not from underrepresented minority groups. The
effects of the curriculum module did not appear to have any notable interaction with either
gender or ethnicity.
Attitudinal survey items showed a consistent trend of treatment students providing more
favorable ratings than did comparison students. This difference was most notable with regards
to questions related to the collaborative nature of science and to content knowledge and
scientific process knowledge. Treatment students gave higher levels of agreement that science
requires teams of people with different skills and that scientists do not work alone. Treatment
students also gave higher ratings of how much they learned about the electromagnetic
spectrum, infrared radiation, and infrared astronomy. Other items showed a similar trend of
more favorable ratings from treatment students, though to a lesser degree.
The results of this report should be interpreted in light of the limitations outlined in the
preceding section. First, this report is based on an assessment that was designed around the
NASA AAA curriculum module and thus may be over-aligned with it. Testing with standardized
testing instruments may yield a more subtle impact of the curriculum module than that
observed in this report. This report also does not include information on how the curriculum

24
module was implemented in classrooms, or what instruction was given to students not exposed
to the NASA AAA curriculum module. This study was also based on students in only seven
districts in the state of California and may not be generalizable to students in other states or
from districts with different characteristics.
Within the limitations of this study, the results do clearly indicate a consistent positive impact
of the curriculum module, at substantively important sizes, on student performance. Taking
into account this is an early state research study aimed at understanding the NASA AAA
curriculum module, the results of this study demonstrate the promise of improving student
learning outcomes. Together, these results indicate that the NASA AAA curriculum module had
a substantively important positive effect on student learning outcomes and attitudes.
25
Appendix A: Terminology Glossary
Coefficient: The average difference in outcome (e.g. post-test) scores between two groups,
controlling for all other variables in the analysis.
Cohen’s d: A measure of effect size, defined as the between-group difference in means divided
by the pooled standard deviation, where pooled standard deviation is the weighted average of
standard deviation for two or more groups.
Cronbach’s alpha: A measure of internal reliability, ranging from 0.0 to 1.0. Higher values
indicate higher internal reliability. The WWC defines 0.50 as the minimum threshold for
acceptable levels of internal reliability using Cronbach’s alpha.
Effect sizes: Magnitude of the statistical effects. Effect sizes represent the changes from pre- to
post-test, in units of standard deviations. Effect size is often reported using Cohen’s d. Effect
sizes below 0.25 are considered small but could still be educationally meaningful. Those above
0.25 are considered substantive for education according to the WWC (WWC, 2018).
Hedges g: A measure of effect size used to measure the difference between two means.
Hedge’s g is similar to Cohen’s d, but corrects for small sample sizes. Hedge’s g is
recommended measure of effect size for regression models according to WWC standards
(WWC, 2018).
Hierarchical Linear Modeling: A regression-based (i.e. predictive) analytic technique that takes
the hierarchical structure of the data into account, where groups of units (e.g. students) are
clustered together in an organized fashion (e.g. within teachers). Hierarchical linear modeling
accounts for variance amongst scores that is due to clustering (e.g. the effects of teachers),
when looking at the effects of other variables.

26
Internal Reliability: A measure of the correlation between different items on the same test. A
higher correlation between items on a test indicates higher internal reliability. It is often
measured using Cronbach’s alpha.
P-values: Give information about the precision of the statistical analyses. Lower p-values are
representative of higher precision and would indicate a higher likelihood that the differences
are statistically significant from zero, if there was truly no difference. The standard convention
in educational research, adopted by the WWC, is to consider p-values smaller than 0.05 to be
statistically significant from zero (WWC, 2018).
Standard deviation: A measure of the amount of variability in a data set. It is defined as the
square root of the sum of scores subtracted from the mean, divided by the number of
observations. The larger the standard deviation, the more spread out scores are within a data
set.
Standard Error: The standard deviation for a given sample, divided by the number of
observations in the sample.

27
Appendix B: Testing Development and Administration
Testing Development
The assessment was developed by WestEd researchers and reviewed by the SETI Institute.
WestEd researchers developed the assessment by reviewing the NASA AAA curriculum module
developed by the SETI Institute AAA staff. Two researchers from WestEd contributed to the
creation of this assessment – Dr. Daniel Brenner and Matt David Silberglitt, M.A. Dr. Brenner
has a Ph.D. in chemistry and manages the technology aspects of the SimScientist projects,
developing and testing simulation-based assessments and instruction for middle school science.
Matt Silberglitt has taught high school astronomy as well as worked on research and
development for science assessments for small-scale projects and state-level accountability
assessments. WestEd researchers developed the assessment to address the NGSS dimensions
covered by the curriculum module, as determined by the SETI Institute. WestEd created a 23-
item assessment which consisted of 21 multiple-choice questions with four answer choices, and
two questions where students were asked to choose three correct statements out of a total of
five. The SETI Institute reviewed the assessment to ensure all questions were scientifically
accurate and contained viable distractor response options.
The assessment covered seven of the eight Science and Engineering Practices (SEPs), three of
the seven Crosscutting Concepts (CCCs), and four separate Disciplinary Core Ideas (DCIs) from
the Next Generation Science Standards. The list below shows the SEPs, CCCs, and DCIs covered
by the assessment. Table B-1 shows the relevant NGSS dimensions for each question on the
pre-assessment. The post-assessment contained the same questions as the pre-assessment, but
with a new ordering of items and response options.

28
SEPs covered in the student-assessment
2. Developing and using models
3. Planning and carrying out investigations
4. Analyzing and interpreting data
5. Using mathematics and computational thinking
6. Constructing explanations (for science) and designing solutions (for engineering)
7. Engaging in argument from evidence
8. Obtaining, evaluating, and communicating information
CCCs covered in the student-assessment
1. Patterns. Observed patterns of forms and events guide organization and classification, and
they prompt questions about relationships and the factors that influence them.
2. Cause and effect: Mechanism and explanation. Events have causes, sometimes simple,
sometimes multifaceted. A major activity of science is investigating and explaining causal
relationships and the mechanisms by which they are mediated. Such mechanisms can then be
tested across given contexts and used to predict and explain events in new contexts.
4. Systems and system models. Defining the system under study — specifying its boundaries
and making explicit a model of that system — provides tools for understanding and testing
ideas that are applicable throughout science and engineering.
DCIs covered in the student-assessment
1. PS4.A: Wave Properties
Sound can make matter vibrate, and vibrating matter can make sound. (1-PS4-1)
2. PS4.B: Electromagnetic Radiation
Objects can be seen if light is available to illuminate them or if they give off their own
light. (1-PS4-2)
Some materials allow light to pass through them, others allow only some light through
and others block all the light and create a dark shadow on any surface beyond them,

29
where the light cannot reach. Mirrors can be used to redirect a light beam. (Boundary:
The idea that light travels from place to place is developed through experiences with
light sources, mirrors, and shadows, but no attempt is made to discuss the speed of
light.) (1-PS4-3)
3. PS4.C: Information Technologies and Instrumentation
People also use a variety of devices to communicate (send and receive information) over
long distances.
4. ESS1.A: The Universe and its Stars
Patterns of the motion of the sun, moon, and stars in the sky can be observed,
described, and predicted. (1-ESS1-1)
Table B-1. Relevant NGSS SEPs, CCCs, and DCIs for each item on the student pre-assessment
Q# SEP CCC DCI Q# SEP CCC DCI
Q1 2
PS4.B Q13 8 PS4.C
Q2 2
PS4.B Q14 6 ESS1.A
Q3 7
PS4.B Q15 2 PS4.B
Q4 3
PS4.B Q16 2 PS4.B
Q5 6
PS4.B Q17 2 PS4.B
Q6 2
PS4.B Q18 7 ESS1.A
Q7 5 1 PS4.A Q19 4 PS4.C
Q8 6
PS4.B Q20 4 2 PS4.B
Q9 6
PS4.B Q21 6 4 PS4.B
Q10
1 PS4.B Q22 7 1 PS4.B
Q11
1 PS4.B Q23 8
Q12 8
PS4.C

30
Testing Procedure
The NASA AAA student assessment was administered online via the online survey tool,
SurveyMonkey. Assessment data were collected in-class, where students were given the class
period to complete the assessment. The assessment was administered by the teacher involved
in the study, or in the case of one treatment teacher (who was on extended leave during the
time of post-assessment), a substitute proctor. Participating teachers were sent a student
roster to fill out for each class where they administered the assessment. Teachers assigned
each student an ID number based on the roster and gave students a strip of paper with their ID
number and a link to the assessment. Teachers provided WestEd with a list of the courses in
which they were administering the assessment and the subject of each course. Students used
the link they were provided to access the assessment and provided their teacher-provided ID so
that WestEd could track responses between each student’s pre- and post-assessment.
Teachers were provided with the link to the pre-assessment on September 5th, 2017 to
administer to their students and were asked to administer it before they started covering
content related to the electromagnetic spectrum. Twenty one (21) of the 23 treatment teachers
and 14 of the 15 control teachers administered the pre-assessment between September 5th and
October 25th. The remaining three teachers administered the pre-assessment in January, during
the Spring semester. The average date of pre-assessment administration was 12 days after
September 5th for the comparison group and 17 days after September 5th for the treatment
group.
Teachers were asked to administer the post-assessment during the last three weeks of their
course, to make the administration process as comparable as possible between treatment and
control. Teachers were asked to select a date within the last three weeks of their course on
which to administer the post-assessment. WestEd sent teachers the link to the post-assessment
one to five days before the day on which they planned to administer the post-assessment.
Thirteen (13) of the 23 treatment teachers and 6 of the 15 control teachers administered the
post-assessment between November 1st and December 22nd of 2017. The remaining 10

31
treatment and 9 control teachers administered the post-assessment between May 8th and June
5th of 2018.
The average time between pre-assessment and post-assessment administration was 160 days
for treatment students and 170 days for comparison students. Hierarchical linear modeling was
used to analyze whether there was a significant difference between treatment and comparison
with regards to when the assessments were administered. A hierarchical linear model with
status as a fixed effect and teacher as a random effect showed there was no significant
difference with regards to pre-assessment administration date, post- assessment
administration date, or the time from pre- to post-assessment between treatment and control.
In addition, entering time from pre- to post-assessment as a fixed effect covariate indicated
time did not have an impact on post-assessment performance, nor did its inclusion in the model
notably alter the impact of any other variables, including the condition variable. Based on this,
it can be concluded there is no significant difference in the administration timing between
treatment and control students.

32
Data Reduction
Respondent Validation
A total of 3269 responses were recorded on the pre-assessment. Of these, 3009 responses
were considered valid. A total of 260 responses were removed during the cleaning process,
including:
- 98 incomplete records (i.e. did not get at least half way through assessment) - 89 students who intended to take post but retook pre - 19 without valid IDs - 54 were duplicate IDs
Of the 3009 valid responses to the pre-assessment, 1148 were from control students and 1861
were from treatment students.
A total of 2665 responses were recorded on the post-assessment. In addition, 88 responses of
students who retook the pre-assessment instead of taking the post-assessment were added to
the post-assessment data. Of these, 2580 were considered valid. A total of 173 were removed
during the cleaning process, including:
- 117 incomplete records (i.e. did not get at least half way through assessment) - 13 without valid IDs - 43 were duplicate IDs
Of the 2580 valid responses on the post-assessment, 950 were from control students and 1630
were from treatment students.
A total of 2343 respondents completed both the pre- and post-assessments. Of these 870 were
control students and 1473 were treatment students. This yields an overall retention rate of
77.8% (2343/3009), with a retention rate of 75.8% for control (870/1148) and 79.2% for
treatment (1473/1861).
A total of 2238 respondents completed all survey items in the post-assessment. Of these, 841
were control students and 1397 were treatment students. This yields an overall retention rate
of 74.4%, with a retention rate of 33.3% for control and 74.6% for treatment.

33
With an overall attrition rate of 22% and a differential attrition rate of 3%, the attrition rate is
considered low attrition according to the What Works Clearinghouse Procedures and Standards
Handbook (WWC, 2018). This is considered to be associated with a low expected bias,
indicating baseline equivalence between the treatment and control groups.
Though attrition was low and the integrity of the random assignment should not have been
compromised, we examined the difference between groups on the pre-assessment, with status
as a fixed effect and teacher as a random effect. The effect size difference between groups on
their pre-score was .9. This is a small difference and within the range of statistical correction.
Score Calculation
Student-assessment data were collected via the online survey platform, SurveyMonkey and
exported as a .csv file to RStudio for data analysis. For each question in the assessment,
responses were recoded as a “0” for incorrect responses and “1” for correct responses. For
questions where students had to select three of five possible choices, only students who
selected the three correct choices (and no more) were given a 1 for said question. Scores were
calculated by summing the total number of correct answers. Frequency distributions were run
on each question before and after recoding to ensure the number of correct responses after
the recoding matched the number of respondents who selected the correct answer.
Ethnicity
Students were asked at the end of the post-assessment what their race/ethnicity was. Students
were given six ethnic groups to choose from including: African American or Black; American
Indian or Alaska Native; Asian; Caucasian or White; Latino or Hispanic; Native Hawaiian or Other
Pacific Islander. Students could also select “Other” or “Prefer not to answer”. Students were
asked to mark all that applied.
For analytic purposes, ethnicity was dummy coded for underrepresented minority status.
Students who selected African American or Black, American Indian or Alaska Native, or Latino

34
or Hispanic were coded as underrepresented minorities. Students who did not select any of
these three categories were considered to not be underrepresented minorities.
Gender
Students were asked at the end of the post-assessment to indicate their gender as female,
male, or prefer not to answer. For analytic purposes, gender was dummy coded, with those
indicating female receiving a “1” and those indicating male receiving a “0”. Students who
selected prefer not to answer or who skipped the question were excluded from analysis.
Grade
Students were asked at the end of the post-assessment to indicate their grade, with response
options including 9th, 10th, 11th, 12th, and other. Grade was considered a categorical variable
during analysis.

35
Course Subject and AP Status
The subject of the course in which each student took the assessment was provided by students’
teachers. Teachers provided WestEd with a list of which periods they administered the student
assessment to and what the course title was for each. WestEd researchers compiled teacher
responses into a .csv file and recoded each one into one of six subjects: astronomy, biology,
chemistry, earth science, intro science, or physics. Table B-2 shows the original course titles for
each course the assessment was administered in. Courses with AP in the title (AP Physics, AP
Physics 1, AP Physics 2, AP Physics C: Mechanics- E &M) were coded as AP for analysis.
Table B-2. Course subject as defined by analytic recoding, and original teacher description
Subject Teacher Description
Astronomy
Astronomy
Astronomy Term 1
Honors Astronomy
Biology
Biology
Biology with Earth Science
Lab Biology 1
Chemistry Chemistry
Honors Chemistry
Earth-Space Science
Academic Earth Science
Earth Science
Living Earth
Intro Science Int. Science
Physics
AP Physics
AP Physics 1
AP Physics 2
AP Physics C: Mechanics-E&M
Conceptual Physics
Physics
Physics A

36
Appendix C: Baseline Equivalence
Subject
Table C-1 shows the number and proportion of students in each subject, by condition group.
Table X shows there is not an equal distribution of students across subjects in the two
conditions. For example, only 4% of control students are biology, compared to 26% of
treatment students. Conversely, 9% of control students are chemistry compared to none of the
treatment students. However, subject was taken into account in impact analysis modeling to
control for this difference.
Table C-1. Number and proportion of students in each subject by condition group
Control Treatment Astronomy 131 15% 172 12%
Biology 32 4% 384 26% Chemistry 80 9% 0 0%
Earth Science 338 39% 404 27% Intro Science 0 0% 24 2%
Physics 289 33% 489 33%
Table C-2 shows the number and proportion of students that took the assessment in an AP
course, by condition group. Table C-2 shows there is a similar distribution of AP students across
conditions. Nonetheless, AP status was taken into account in impact analysis modeling to
control for its effects.
Table C-2. Number and proportion of students in AP courses by condition group
Control Treatment AP 39 4% 39 3%
Non-AP 831 96% 1434 97%
37
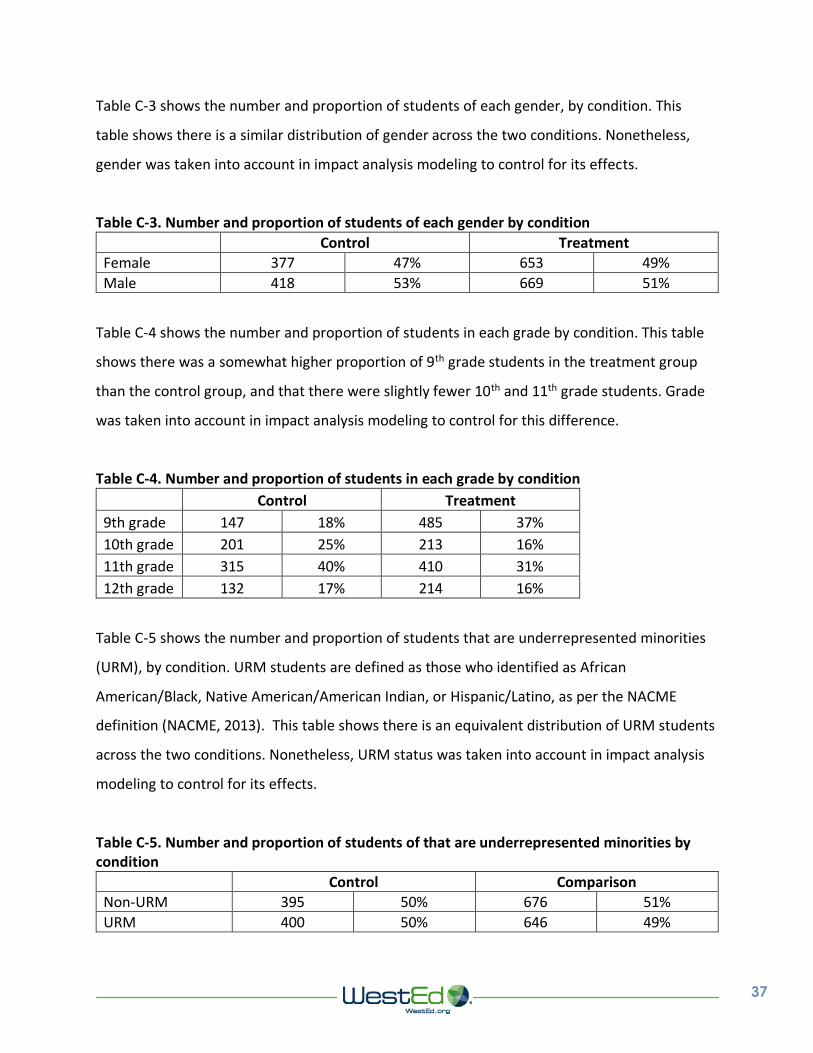
Table C-3 shows the number and proportion of students of each gender, by condition. This
table shows there is a similar distribution of gender across the two conditions. Nonetheless,
gender was taken into account in impact analysis modeling to control for its effects.
Table C-3. Number and proportion of students of each gender by condition
Control Treatment
Female 377 47% 653 49%
Male 418 53% 669 51%
Table C-4 shows the number and proportion of students in each grade by condition. This table
shows there was a somewhat higher proportion of 9th grade students in the treatment group
than the control group, and that there were slightly fewer 10th and 11th grade students. Grade
was taken into account in impact analysis modeling to control for this difference.
Table C-4. Number and proportion of students in each grade by condition
Control Treatment
9th grade 147 18% 485 37%
10th grade 201 25% 213 16%
11th grade 315 40% 410 31%
12th grade 132 17% 214 16%
Table C-5 shows the number and proportion of students that are underrepresented minorities
(URM), by condition. URM students are defined as those who identified as African
American/Black, Native American/American Indian, or Hispanic/Latino, as per the NACME
definition (NACME, 2013). This table shows there is an equivalent distribution of URM students
across the two conditions. Nonetheless, URM status was taken into account in impact analysis
modeling to control for its effects.
Table C-5. Number and proportion of students of that are underrepresented minorities by condition
Control Comparison
Non-URM 395 50% 676 51%
URM 400 50% 646 49%

38
Table C-6 shows the percentage of students in each school district involved in the study that are
from underrepresented minority groups. The information in this table is taken from the
California Department of Education’s website Enrollment by Ethnicity tables for the 2017-2018
academic year. Table C-6 shows that the percentage of URM students ranged from 37.7% to
79.6%. The statewide average for under-represented minority percentage was 60.3%. The
weighted average of districts in this study was 59.1%. This indicates that the districts in this
sample are representative of the state of California in terms of student ethnicity.
Table C-6. Proportion of students from underrepresented minority groups in each school district involved in the study
School District Percent URM
Anaheim Union High 70.4%
Antelope Valley Union High 79.6%
Campbell Union High 37.7%
East Side Union High 53.4%
Manteca Unified 62.7%
Santa Clara Unified 37.7%
Vista Unified 66.7%
William S. Hart Union High 42.5%
Average of Districts in Study (weighted) 59.1%
Statewide (California) 60.3%
It is worth noting that the California Department of Education website categorizes students’
ethnicity in terms of: African American, American Indian, Asian, Filipino, Hispanic, Pacific
Islander, White, or Two or More Races. For the purposes of Table C-6, the percentage URM was
calculated by summing the percentage of students that were African American, American
Indian, or Hispanic. This means students who reported two-or-more races were not counted in
the percentage of URM students displayed in Table C-6. This is in contrast of the approach used
for identifying URM students in this study, where students were given a list of ethnicities from
which they could select all that applied and researchers designated any students as URM who
selected African American/Black, Native American/American Indian, or Hispanic/Latino,

39
regardless of what other options a student chose. According to the California Department of
Education, the percentage of students who were two-or-more races was 3.5% statewide, which
is equal to the weighted average of the percentage of students that were two-or-more races
across the districts involved in this study. The percentage in each district involved in this study
ranged from 1.6% to 4.9%, for a weighted average of 3.5%. This indicates that despite the
difference in reporting methods, the districts in this study are representative of the state at
large in terms of student demographics.

40
Appendix D: Impact Analysis Models
Four models were used to explore student assessment data: a Condition Model, a Class
Covariate Model, a Student-Class Covariate Model, and an Interaction Model.
Condition Model: The Condition Model (model 1) included fixed effects, including the condition
variable and students’ pre-test (i.e. post-assessment) score. The Condition Model took the
following form:
γij = β00 + β01TXj + β10Preij + ζ0J+ ϵI0
Where γij is the post-test (i.e. post-assessment) score for the i-th student of the j-th teacher, TXj
is a dichotomous variable indicating assignment to treatment, Pre represents students' pre-test
score, and β00 is the grand mean of student scores. ϵI0 is a random level-1 error term and ζ0J is
the teacher random effect, the variance component of which captures the nesting of students
within instructors. Importantly, the main effect of treatment assignment is captured by β01.
Class Covariate Model: In addition to the condition and pre-terms in the Condition Model, the
Class-Covariate Model (model 2) included class-level fixed effects of subject (Astronomy,
Biology, Chemistry, Earth Science, Intro Science, or Physics), and AP status.
Student-Class-Covariate Model: This model included all variables in the Class Covariate Model,
and added student-level fixed effects of students’ gender (Female or Male), students’ ethnicity
(coded as URM or not) and grade (9th – 12th grade or Other). Due to administration issues,
student level demographic data were not collected from two teachers whose students were
excluded from this analysis.
Interaction Model: This model included all variables in the Student-Class Covariate Model, and
added interaction effects between condition and gender, as well as between condition and

41
ethnicity. This model includes the same sample of students included in the Student-Class-
Covariate Model.
We examined overall gains from pre-assessment to post-assessment scores for all students who
completed the pre- and post-assessments. As displayed in Table D-1 below, there is a
statistically significant difference, at the 0.05 significance level, in pre-assessment to post-
assessment scores for both the control and treatment groups. Results in Table D-1 show that
post-assessment scores decreased for the control group, while they increased for the treatment
group after exposure to the NASA AAA curriculum module.
Table D-1. Student Assessment Pre-test and Post-test Scores (Mean, Standard Deviations and Cohen’s D Effect Size of the Difference) for both condition groups
CONDITION N PRE-TEST
MEAN, SD
POST-TEST
MEAN, SD
GAIN 95% CI FOR
MEAN DIFF.
T-STATISTIC
P-VALUE
EFFECT SIZE
CONTROL 870 7.88 2.99
7.19 2.97
-0.69 -0.47- -0.92
-5.96 .00 -0.23
TREATMENT 1473 7.99 3.01
8.51 3.39
0.52 0.34- 0.70
5.68 .00 0.16
Impact on Assessment
The output from the Condition and Class-Covariate Models are presented in Table D-2. The
model attempts to address the question: After attempting to control for student pre-test (i.e.
pre-assessment) scores (and other baseline variables), what is the impact of the NASA AAA
curriculum module on students’ knowledge of infrared astronomy and the electromagnetic
spectrum? In other words, we are interested in what a control student’s knowledge of the
electromagnetic spectrum would be if his/her instructor, in an alternative universe, were
assigned to teach the NASA AAA curriculum module. Because students cannot participate in
both conditions simultaneously, our randomized trial is a proxy for this counterfactual scenario.

42
Table D-2. Student Assessment Modeling Output with Class Characteristics
Condition Model Class Covariate Model
Coef SE P Coef SE p
Intercept 4.60 0.34 0.00* 5.50 0.48 .00*
PreTest 0.33 0.02 0.00* 0.31 0.02 .00*
Condition 1.12 0.38 0.01* 1.44 0.44 .00*
AP 2.85 0.52 .00*
Biology -1.22 0.63 .06
Chemistry -0.95 0.98 .34
Earth Science -1.39 0.33 .00*
Intro Science -2.89 1.35 .04*
Physics -1.30 0.46 .01* Condition Effect Size (hedges g) 0.35 .44
Number of observations 2343 2343
The main variable of interest in the models is the condition variable. For this variable, positive
coefficients indicate higher post-test (i.e. post-assessment) scores for treatment students. The
condition coefficient can be interpreted as the average difference in post-assessment
achievement scores in the treatment relative to the control condition, given that the groups
were equivalent prior to the intervention.
In both the Condition and Class-Covariate models, the estimate of the condition variable is
positive – indicating greater post-test achievement in the treatment relative to the control
group. In both the Condition Model and Class-Covariate Model, there was a statistically
significant positive effect of the condition variable. In other words, in both models the effect
of condition on student post-assessment scores is both statistically significant (p-value < .05)
and has a substantively important effect size (> .25). The Department of Education’s What
Works Clearinghouse considers effect sizes at or above 0.25 to be substantively important
(WWC, 2018).
For example, in the Condition Model, the effect of condition is positive when controlling for
pre-assessment score, with a 1.12 question improvement in post-assessment score; this

43
translates to a p value of < .05 and an effect size of 0.35. In the Class-Covariate Model, the
effect of condition is positive when controlling for pre-assessment and class characteristics,
with a 1.44 question improvement translating to a p value of < .05 and effect size of 0.44.
Table D-3 shows the number and proportion of students in each subject with complete
demographics data, by condition group. Table D-3 shows there is not an equal distribution of
subjects across subjects in the two conditions. For example, only 4% of control students are
biology, compared to 27% of treatment students. Conversely, 10% of control students are
chemistry but none of the treatment students are. However, subject was taken into account in
impact analysis modeling to control for this difference.
Table D-3. Number and proportion of students with complete demographics data in each subject by condition group
Control Treatment
Astronomy 119 15% 160 12%
Biology 31 4% 356 27% Chemistry 76 10% 0 0%
Earth Science 319 40% 348 26%
Intro Science 0 0% 0 0%
Physics 251 32% 459 35%
Of the 2343 students who completed the post-assessment, 2117 completed the student survey
section and provided demographic variables such as gender, ethnicity, and grade. There were
795 students in the control group and 1322 students in the comparison group who completed
all demographics information.
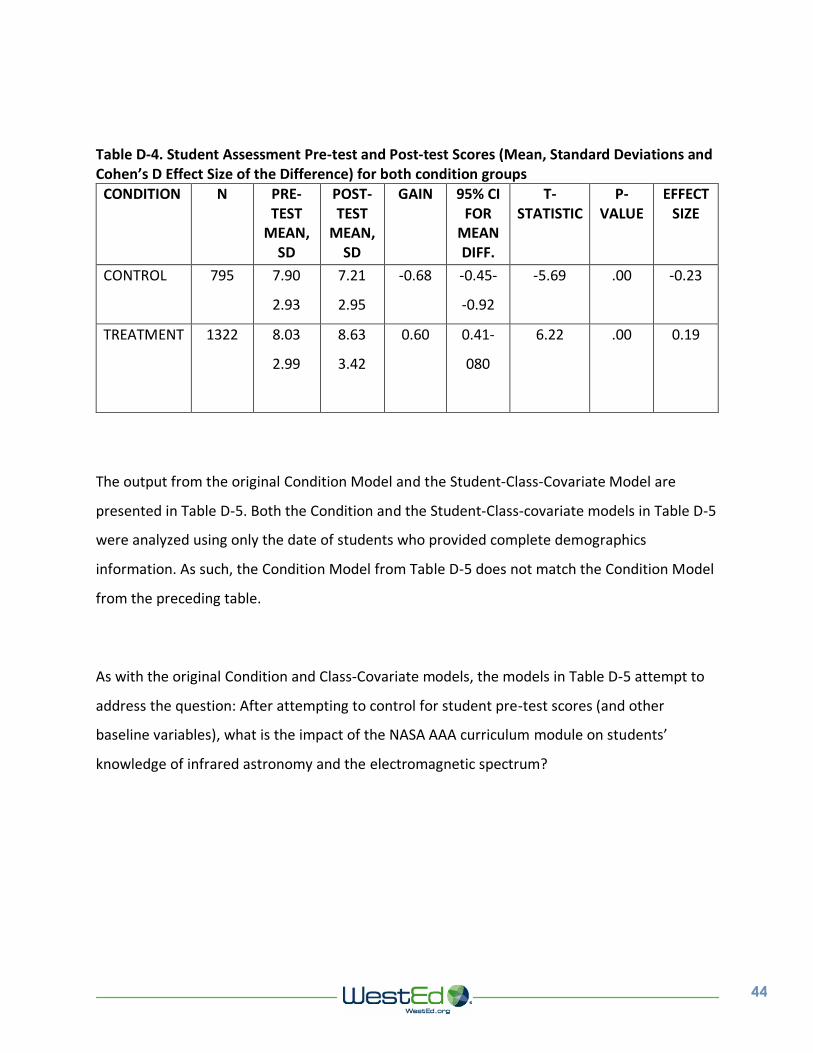
We examined overall gains from pre-assessment to post-assessment for the subset of students
who provided complete demographics information. As displayed in Table D-4 below, there is a
statistically significant difference, at the 0.05 significance level, in pre-assessment to post-
assessment scores for both the control and treatment groups. Results show that post-
assessment scores decreased for the control group, while they increased for the treatment
group after exposure to the NASA AAA curriculum module.
44
Table D-4. Student Assessment Pre-test and Post-test Scores (Mean, Standard Deviations and Cohen’s D Effect Size of the Difference) for both condition groups
CONDITION N PRE-TEST
MEAN, SD
POST-TEST
MEAN, SD
GAIN 95% CI FOR
MEAN DIFF.
T-STATISTIC
P-VALUE
EFFECT SIZE
CONTROL 795 7.90
2.93
7.21
2.95
-0.68 -0.45-
-0.92
-5.69 .00 -0.23
TREATMENT 1322 8.03
2.99
8.63
3.42
0.60 0.41-
080
6.22 .00 0.19
The output from the original Condition Model and the Student-Class-Covariate Model are
presented in Table D-5. Both the Condition and the Student-Class-covariate models in Table D-5
were analyzed using only the date of students who provided complete demographics
information. As such, the Condition Model from Table D-5 does not match the Condition Model
from the preceding table.
As with the original Condition and Class-Covariate models, the models in Table D-5 attempt to
address the question: After attempting to control for student pre-test scores (and other
baseline variables), what is the impact of the NASA AAA curriculum module on students’
knowledge of infrared astronomy and the electromagnetic spectrum?
45
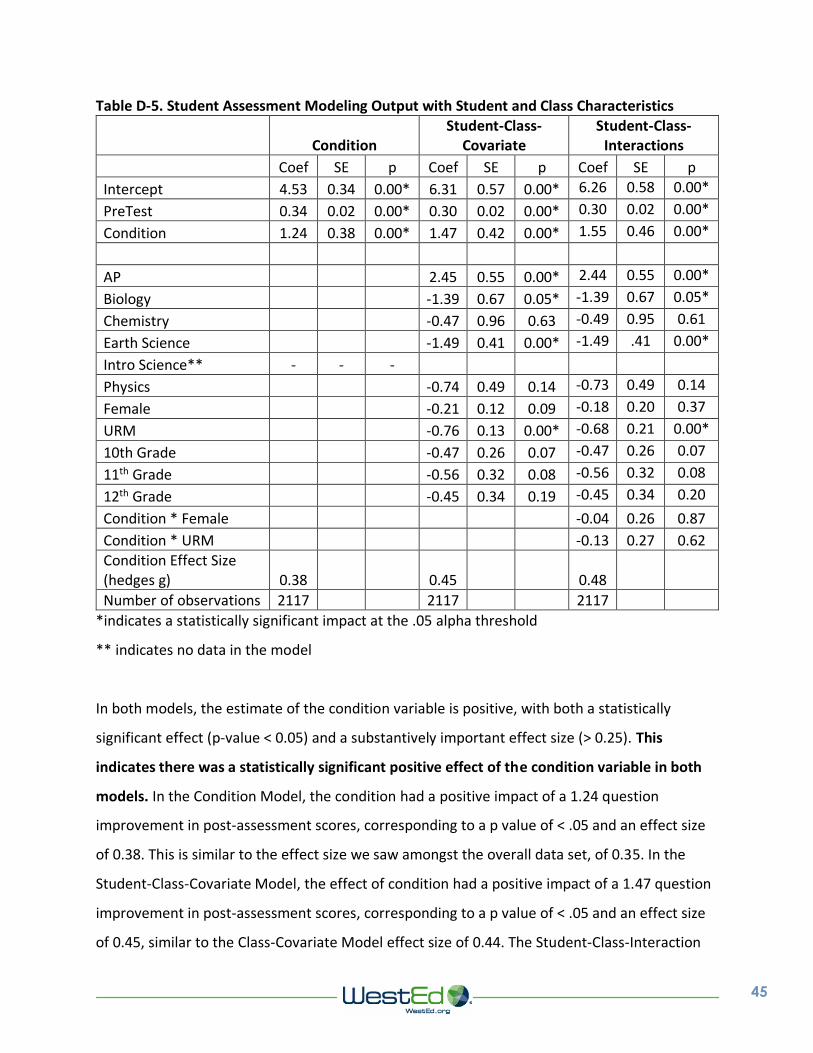
Table D-5. Student Assessment Modeling Output with Student and Class Characteristics
Condition Student-Class-
Covariate Student-Class-
Interactions
Coef SE p Coef SE p Coef SE p
Intercept 4.53 0.34 0.00* 6.31 0.57 0.00* 6.26 0.58 0.00*
PreTest 0.34 0.02 0.00* 0.30 0.02 0.00* 0.30 0.02 0.00*
Condition 1.24 0.38 0.00* 1.47 0.42 0.00* 1.55 0.46 0.00*
AP 2.45 0.55 0.00* 2.44 0.55 0.00*
Biology -1.39 0.67 0.05* -1.39 0.67 0.05*
Chemistry -0.47 0.96 0.63 -0.49 0.95 0.61
Earth Science -1.49 0.41 0.00* -1.49 .41 0.00*
Intro Science** - - -
Physics -0.74 0.49 0.14 -0.73 0.49 0.14
Female -0.21 0.12 0.09 -0.18 0.20 0.37
URM -0.76 0.13 0.00* -0.68 0.21 0.00*
10th Grade -0.47 0.26 0.07 -0.47 0.26 0.07
11th Grade -0.56 0.32 0.08 -0.56 0.32 0.08
12th Grade -0.45 0.34 0.19 -0.45 0.34 0.20
Condition * Female -0.04 0.26 0.87
Condition * URM -0.13 0.27 0.62 Condition Effect Size (hedges g) 0.38 0.45 0.48
Number of observations 2117 2117 2117
*indicates a statistically significant impact at the .05 alpha threshold
** indicates no data in the model
In both models, the estimate of the condition variable is positive, with both a statistically
significant effect (p-value < 0.05) and a substantively important effect size (> 0.25). This
indicates there was a statistically significant positive effect of the condition variable in both
models. In the Condition Model, the condition had a positive impact of a 1.24 question
improvement in post-assessment scores, corresponding to a p value of < .05 and an effect size
of 0.38. This is similar to the effect size we saw amongst the overall data set, of 0.35. In the
Student-Class-Covariate Model, the effect of condition had a positive impact of a 1.47 question
improvement in post-assessment scores, corresponding to a p value of < .05 and an effect size
of 0.45, similar to the Class-Covariate Model effect size of 0.44. The Student-Class-Interaction

46
Model in Table D-5 also shows that there is no significant interaction between the treatment
condition and student’s gender, nor between treatment condition and their ethnicity. This is to
say that the NASA AAA curriculum module had a similar impact for both genders and across
ethnic groups. The effect size for interaction models such as this are not typically interpreted.
Astronomy/Physics/Earth Science Only
Because the NASA AAA curriculum module was designed specifically for integration into courses
centered on astronomy, physics, integrated science, or earth-space science, WestEd
researchers conducted an impact analysis to look at the effects of the NASA AAA curriculum
module on student learning outcomes for the subset of students who were enrolled in
astronomy, physics, or earth science. As with the overall data set, three models were explored:
a Condition model, a Class Covariate Model, and a Student-Class Covariate Model.
As with the overall data set, we examined overall gains from pre-assessment to post-
assessment for students in astronomy, physics, or earth science, who completed the pre- and
post-assessments. As displayed in Table D-6 below, there is a statistically significant difference,
at the 0.05 significance level, in pre-assessment to post-assessment scores for both the control
and treatment groups. Results show that post-assessment scores decreased for the control
group, while they increased for the treatment group after exposure to the NASA AAA
curriculum module.
Table D-6. Student Assessment Pre-test and Post-test Scores (Mean, Standard Deviations and Cohen’s D Effect Size of the Difference) for students in select subjects by condition groups
CONDITION N PRE-TEST
MEAN, SD
POST-TEST
MEAN, SD
GAIN 95% CI FOR
MEAN DIFF.
T-STATISTIC
P-VALUE
EFFECT SIZE
CONTROL 758 7.95 3.04
7.23 3.03
-.73 -0.48 - -0.97
-5.71 0.00* -0.24
TREATMENT 1065 8.11 3.09
8.66 3.51
.55 0.33-0.77
4.93 0.00* 0.17
47
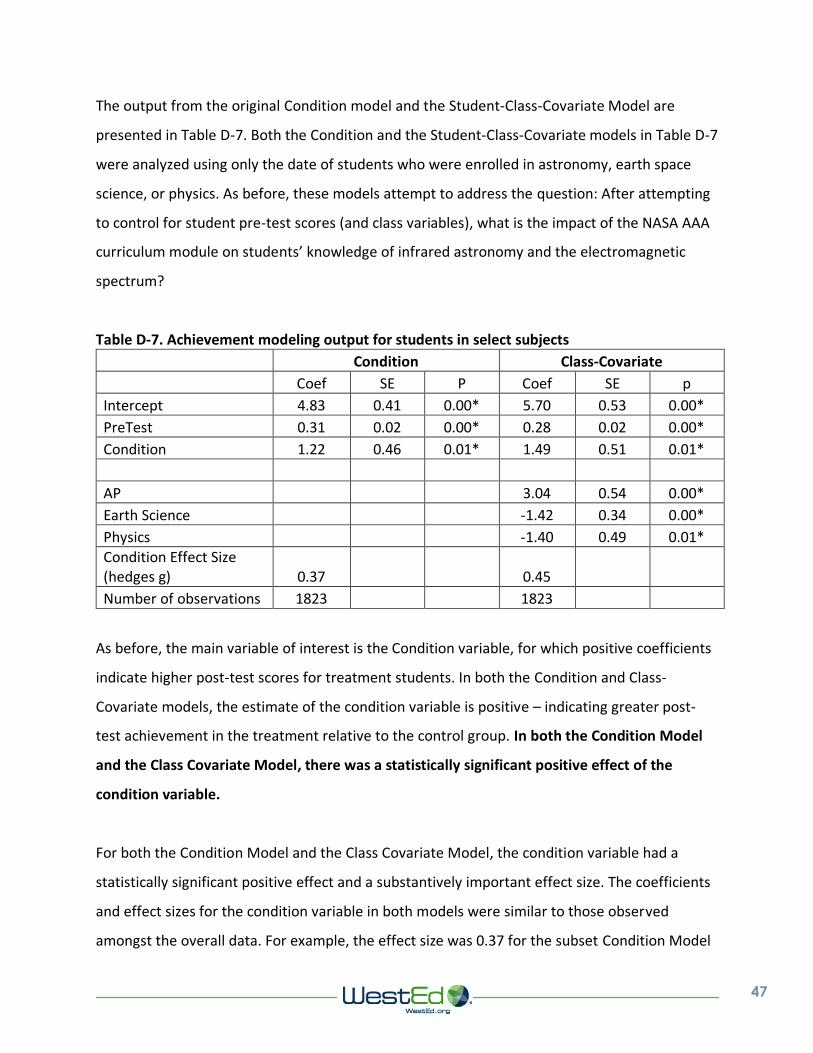
The output from the original Condition model and the Student-Class-Covariate Model are
presented in Table D-7. Both the Condition and the Student-Class-Covariate models in Table D-7
were analyzed using only the date of students who were enrolled in astronomy, earth space
science, or physics. As before, these models attempt to address the question: After attempting
to control for student pre-test scores (and class variables), what is the impact of the NASA AAA
curriculum module on students’ knowledge of infrared astronomy and the electromagnetic
spectrum?
Table D-7. Achievement modeling output for students in select subjects
Condition Class-Covariate
Coef SE P Coef SE p
Intercept 4.83 0.41 0.00* 5.70 0.53 0.00*
PreTest 0.31 0.02 0.00* 0.28 0.02 0.00*
Condition 1.22 0.46 0.01* 1.49 0.51 0.01*
AP 3.04 0.54 0.00*
Earth Science -1.42 0.34 0.00*
Physics -1.40 0.49 0.01* Condition Effect Size (hedges g) 0.37 0.45
Number of observations 1823 1823
As before, the main variable of interest is the Condition variable, for which positive coefficients
indicate higher post-test scores for treatment students. In both the Condition and Class-
Covariate models, the estimate of the condition variable is positive – indicating greater post-
test achievement in the treatment relative to the control group. In both the Condition Model
and the Class Covariate Model, there was a statistically significant positive effect of the
condition variable.
For both the Condition Model and the Class Covariate Model, the condition variable had a
statistically significant positive effect and a substantively important effect size. The coefficients
and effect sizes for the condition variable in both models were similar to those observed
amongst the overall data. For example, the effect size was 0.37 for the subset Condition Model

48
(i.e. students enrolled in astronomy, physics, or earth science) and 0.35 for the overall
Condition Model. Similarly, the effect size was 0.45 for the Class-Covariate Model in the subset
and 0.44 in the overall Class-Covariate Model.
As with the overall data set, we examined overall gains from pre-assessment to post-
assessment for the subset of students enrolled in astronomy, physics, or earth science, who
provided complete demographic information. As displayed in Table D-8 below, there is a
statistically significant difference, at the 0.05 significance level, in pre-assessment to post-
assessment sores for both the control and treatment groups. Results show that post-
assessment scores decreased for the control group, while they increased for the treatment
group after exposure to the NASA AAA curriculum module. This trend mirrors that observed
amongst the complete data set.
Table D-8. Student Assessment Pre-test and Post-test Scores (Mean, Standard Deviations and Cohen’s D Effect Size of the Difference) for students in select subjects with demographics data in both condition groups
CONDITION N PRE-TEST
MEAN, SD
POST-TEST
MEAN, SD
GAIN 95% CI FOR
MEAN DIFF.
T-STATISTIC
P-VALUE
EFFECT SIZE
CONTROL 688 7.98 2.98
7.24 3.01
-0.74 -0.48- -1.00
-5.60 0.00* -0.25
TREATMENT 967 8.12 3.07
8.76 3.54
0.64 0.41- 0.87
5.42 0.00* 0.19
For the subset of students enrolled in astronomy, physics, or earth science, the output from the
original Condition Model and the Student-Class-Covariate Model in Table D-9 were analyzed
using only the data of students who provided complete demographics information. As such, the
Condition Model from Table D-9 does not match the Condition Model from the preceding table.

49
Table D-9. Student Assessment Modeling Output with Student and Class Characteristics for Students In Select Classes
Condition Student-Class-
Covariate Student-Class
Interaction
Coef SE p Coef SE p Coef SE p
Intercept 4.75 0.42 0.00* 6.54 0.64 0.00* 6.50 0.65 0.00*
PreTest 0.31 0.03 0.00* 0.27 0.03 0.00* 0.27 0.03 0.00*
Condition 1.31 0.48 0.01* 1.54 0.50 0.01* 1.62 0.53 0.01*
AP 2.67 0.57 0.00* 2.65 0.57 0.00*
Earth Science -1.60 0.44 0.00* -1.60 0.44 0.00*
Physics -0.79 0.53 0.15 -0.78 0.53 0.15
Female -0.30 0.14 0.04* -0.17 0.22 0.44
URM -0.74 0.16 0.00* -0.76 0.23 0.00*
10th Grade -0.37 0.31 0.23 -0.37 0.31 0.23
11th Grade -0.57 0.37 0.12 -0.57 0.37 0.12
12th Grade -0.48 0.39 0.22 -0.47 0.39 0.23
Condition * Female -0.22 0.29 0.44
Condition * URM 0.04 0.31 0.90
Condition Effect Size (hedges g) 0.39 0.46 0.49
Number of observations 1655 1655
1655
In both models, the estimate of the condition variable remained positive, with both a
statistically significant effect size (p value < 0.05) and a substantively important effect size (>
0.25). This indicates there was a statistically significant positive effect of the condition
variable in both models. The condition variable had a positive impact of a 1.31 question
improvement on post-assessment scores in the Condition Model, and a positive impact of a
1.54 question improvement in the Student-Class-Covariate Model; these values correspond to
effect sizes of 0.39 and 0.46 for the condition variable in the Condition and Student-Class-
Covariate models respectively. These values are similar to those observed in the overall
Condition and Student-Class-Covariate models from Table D-5. Like the model in Table D-5, this
model shows there is no significant interaction between the curriculum module and either
gender or ethnicity.

50
Appendix E: About the Authors
This report was written by Joshua Valcarcel and Dr. Ted Britton, with substantial quantitative
consulting from Dr. Bryan Matlen. The report is based on a student assessment developed by
Dr. Daniel Brenner and Matt Silberglitt, M.A. Josh Valcarcel completed his Master’s degree in
program evaluation at Claremont Graduate University and has conducted numerous
educational evaluations at WestEd, including serving as the Project Director for the past two-
years for evaluation of the NASA AAA program. Ted Britton serves as Associate Director of the
WestEd STEM program, and has lead several major research and evaluation projects. Bryan
Matlen is a senior methodologist for several large-scale efficacy studies at WestEd and leads
formative and summative evaluations of educational technology products. Bryan Matlen
currently serves as the Principle Investigator (PI) of an IES funded project which investigates
optimal ways of designing STEM visuals and co-PI on an NSF funded project which explores how
analogical principles interact to support learning in mathematics classrooms. Matt Silberglitt
has managed development of science assessments for WestEd in the states of Massachusetts
and Nevada, and contributed to the development of science assessments in Kentucky, Kansas,
Ohio, Louisiana, and West Virginia. Matt has also overseen development of science
assessments at Minnesota Department of Education and developed assessments at Data
Recognition Corporation. Matt Silberglitt has also taught high school astronomy and started
astronomy clubs at two schools in Minnesota. Dr. Daniel Brenner received his Ph.D. in
chemistry and manages the technology aspects of the SimScientists projects, developing and
testing simulation-based assessments and instruction for middle school science.

51
References
Institute of Educational Sciences (2017) Procedures Handbook Volume 4. Retrieved from:
https://ies.ed.gov/ncee/wwc/Docs/referenceresources/wwc_procedures_handbook_v4.pdf
California Department of Education (2018) 2017-2018 Enrollment by Ethnicity. Retrieved from:
https://dq.cde.ca.gov/dataquest/dqcensus/enrethlevels.aspx?agglevel=District&year=2017-
18&cds=1964733
National Action Council for Minorities in Engineering (2013) Underrepresented Minorities in
STEM. Retrieved from: http://www.nacme.org/underrepresented-minorities