Embed Size (px)
Citation preview

8/6/2019 West Virginia Data Profile - May 2011
http://slidepdf.com/reader/full/west-virginia-data-profile-may-2011 1/34

8/6/2019 West Virginia Data Profile - May 2011
http://slidepdf.com/reader/full/west-virginia-data-profile-may-2011 2/34
A high school diploma is no longer enough; now, nearly every good
job requires some education beyond high school ± such as an
associate¶s or bachelor¶s degree, certificate, license, or completion
of an apprenticeship or significant on-the-job training.
Far too many students drop out or graduate from high school
without the knowledge and skills required for success, closing doors
and limiting their post-high school options and opportunities.
The best way to prepare students for life after high school is to alignK-12 and postsecondary expectations. All students deserve a world-
class education that prepares them for college, careers and life.
Why College- and Career-Ready
Expectations for All?
2

8/6/2019 West Virginia Data Profile - May 2011
http://slidepdf.com/reader/full/west-virginia-data-profile-may-2011 3/34
A HIGH SCHOOL DIPLOMA IS NOLONGER ENOUGH FOR SUCCESS
The changing economy is accelerating theexpectations gap, as careers increasingly requiresome education/training beyond high school,and more developed knowledge and skills.

8/6/2019 West Virginia Data Profile - May 2011
http://slidepdf.com/reader/full/west-virginia-data-profile-may-2011 4/34
4Source: Carnevale, Anthony P. et al. (June 2010). Help Want ed: Proj ec tions of Jobs and E duc ationR equir ements Throug h 2018. Georgetown Center on Education and the Workforce.ww9.georgetown.edu/grad/gppi/hpi/cew/pdfs/FullReport.pdf
Jobs in Today¶s (and Tomorrow¶s) Workforce
Require More Education and Training

8/6/2019 West Virginia Data Profile - May 2011
http://slidepdf.com/reader/full/west-virginia-data-profile-may-2011 5/34
The Rise of Middle-Skill Jobs
5Source: Holzer, Harry J. and Robert I. Lerman (February 2009). The F ut ur e of Mi ddle-Sk i ll Jobs.Brookings Institution.
High-skill jobs
Occupations in the professional/technical and managerial categories.
Often require four-year degrees and above
Middle-skill jobs
Occupations that include clerical, sales, construction, installation/repair,
production, and transportation/material moving.
Low-skill jobs
Occupations in the service and agricultural categories.
Often require some education and training beyond high school (but
typically less than a bachelor¶s degree), including associate¶s degrees,
vocational certificates, significant on-the-job training.

8/6/2019 West Virginia Data Profile - May 2011
http://slidepdf.com/reader/full/west-virginia-data-profile-may-2011 6/34
Employment Shares by Occupational Skill Level
6Source: National Skills Coalition (2010). The Bri dge to a N ew E c onomy : Wor ker Training Fi ll s the Ga p.http://www.nationalskillscoalition.org/assets/reports-/the-bridge-to-a-new-economy.pdf ; National Skills Coalition (2011).
Stat e Mi ddle Sk i ll Fac t Sheets. http://www.nationalskillscoalition.org/resources/fact-sheets/state-fact-sheets/

8/6/2019 West Virginia Data Profile - May 2011
http://slidepdf.com/reader/full/west-virginia-data-profile-may-2011 7/34

8/6/2019 West Virginia Data Profile - May 2011
http://slidepdf.com/reader/full/west-virginia-data-profile-may-2011 8/34
Education and Training Beyond High School
Is Increasingly Being Demanded
8Source: Bureau of Labor Statistics. Occupational Out l ook H and book, 2010 -11 E d ition.http://www.bls.gov/oco/oco2003.htm

8/6/2019 West Virginia Data Profile - May 2011
http://slidepdf.com/reader/full/west-virginia-data-profile-may-2011 9/34
The Jobs of Tomorrow
9Source: Milano, Jessica,B
ruce Reed & Paul Weinstein Jr. (Sept 2009). A
Matt er of Deg r ees: Tomorrow¶ s Fast est Grow ing Jobs and Why Community College Graduat es Wi ll Get Them. TheNew Democratic Leadership Council.
West Virginia should be preparing students for the jobs of
tomorrow, not the jobs of yesterday ± or even today.
A quarter of American workers are now in jobs not even listed in the
Census Bureau¶s occupation codes in 1967.
Given the growth of new job sectors ± most notably ³green jobs´ ± it is
common sense to provide all students with a strong foundation that
keeps all doors open and all opportunities available in the future.

8/6/2019 West Virginia Data Profile - May 2011
http://slidepdf.com/reader/full/west-virginia-data-profile-may-2011 10/34
The Public Agrees That Education or
Training Beyond High School
is Necessary for Future Success
10
To really get ahead in life, a
person needs at least some
education beyond high
school, whether that means
university, community
college, technical or vocational school.
To really get ahead in life,
a person needs more
than just a high school
education.
87
8
Source: Achieve, Inc. (2010). Ac hi ev ing the Possible: What Ameri c ans Think the College and Car eer -R ead y Agend a. http://www.achieve.org/files/AchievingThePossible-FinalReport.pdf

8/6/2019 West Virginia Data Profile - May 2011
http://slidepdf.com/reader/full/west-virginia-data-profile-may-2011 11/34
America¶s International Edge is Slipping in
Postsecondary Degree Attainment
11Source: OECD. E duc ation at a Gl ance 2010 . (All rates are self-reported.) http://www.oecd-ilibrary.org/education/education-at-a-glance-2010_eag-2010-en; National Center for Higher EducationManagement Systems, analysis of 2009 American Community Survey. http://www.higheredinfo.org
0 10 20 30 40 50 60% Young Adults (25-34) with College Degree % Adults (25-64) with College Degree

8/6/2019 West Virginia Data Profile - May 2011
http://slidepdf.com/reader/full/west-virginia-data-profile-may-2011 12/34
% of Citizens with Postsecondary Degrees Among OECD Countries, by Age Group (2 )
- 4 4 - 4 3 -44 2 -34 ALL (2 - 4)
1 U.S. (40%) Canada (44%) Canada (54%) Korea (58%) Canada (49%)
2 Canada (40%) Japan (43%) Japan (48%) Canada (56%) Japan (43%)
3 N.Z. (34%) U.S. (40%) Finland (44%) Japan (55%) U.S. (41%)
4 Finland (29%) N.Z. (38%) U.S. (43%) N.Z. (48%) N.Z. (40%)
Australia (28%) Finland (37%) Korea (43%) Norway (46%) Finland (37%)
Norway (28%) Australia (33%) N.Z. (40%) Ireland (45%) Korea (37%)
7 Switz. (27%) Denmark (32%) Norway (38%) Denmark (43%) Norway (36%)
8 U.K. (27%) Norway (32%) Australia (38%) Belgium (42%) Australia (36%)
Sweden (26%) Switz. (31%) Denmark (37%) Australia (42%) Denmark (34%)
1 Neth. (26%) Neth. (31%) Ireland (37%) U.S. (42%) Ireland (34%)
11 Denmark (26%) Iceland (30%) Switz. (36%) Sweden (41%) Switz. (34%)
12 Japan (26%) U.K. (30%) Iceland (36%) France (41%) U.K. (33%)
13 Germany (24%) Belgium (29%) Belgium (35%) Neth. (40%) Belgium (32%)
14 Iceland (24%) Sweden (28%) U.K. (33%) Spain (39%) Neth. (32%)
1 Belgium (22%) Ireland (27%) Sweden (33%) Luxembourg (39%) Sweden (32%)
4 - 4: West Virginia (2 %) WV (27%) WV (3 %) WV (2 %)
America¶s International Edge is Slipping in
Postsecondary Degree Attainment
12Source: OECD. E duc ation at a Gl ance 2010. http://www.oecd-ilibrary.org/education/education-at-a-glance-2010_eag-2010-en ; National Center for Higher Education Management Systems analysis of 2009 AmericanCommunity Survey. http://www.higheredinfo.org

8/6/2019 West Virginia Data Profile - May 2011
http://slidepdf.com/reader/full/west-virginia-data-profile-may-2011 13/34
FAR TOO MANY STUDENTS DROP
OUT OR GRADUATE FROM HIGH
SCHOOL UNPREPARED FOR REALWORLD CHALLENGES
8/6/2019 West Virginia Data Profile - May 2011
http://slidepdf.com/reader/full/west-virginia-data-profile-may-2011 14/34
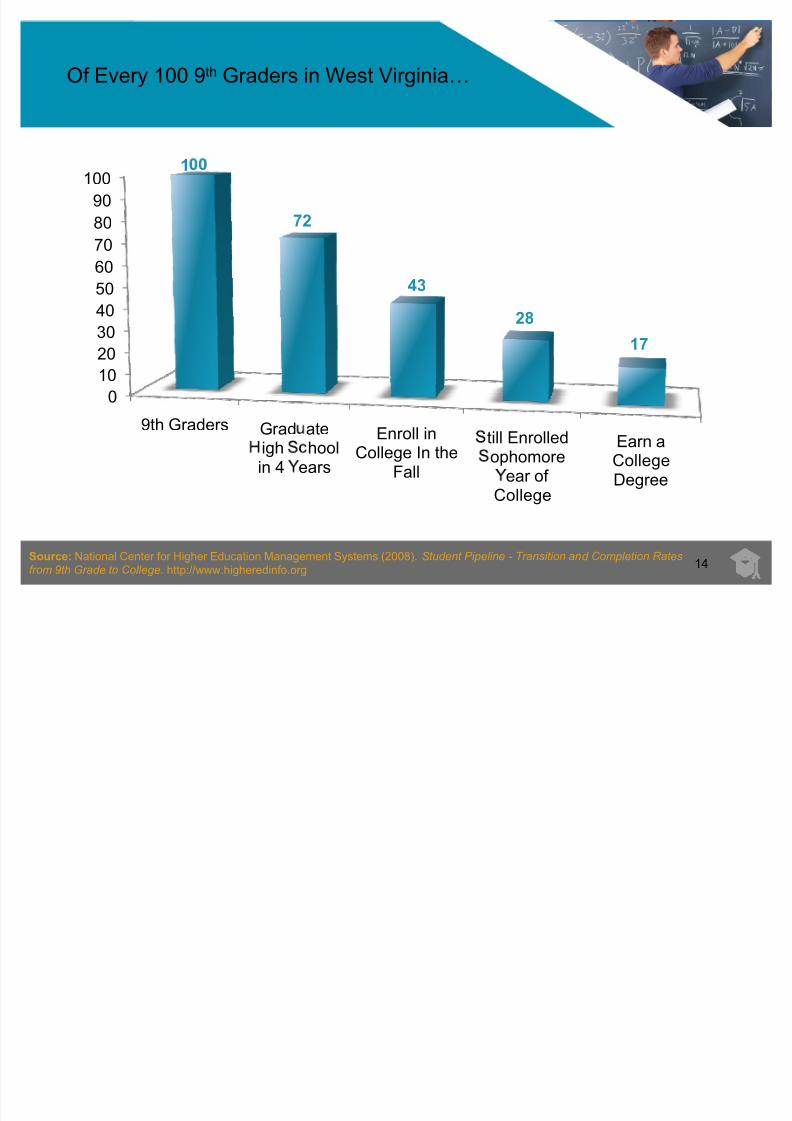
Of Every 100 9th Graders in West Virginia«
14Source: National Center for Higher Education Management Systems (2008). St udent Pi pel ine - Transition and Completion Rat esfrom 9th Grade to College. http://www.higheredinfo.org
0
10
20
30
40
50
60
70
80
90
100
9th Graders Grad ateigh hoolin 4 ears
Enroll inCollege In the
Fall
till Enrolledophomore
ear of College
Earn aCollegeDegree
1
72
43
28
17

8/6/2019 West Virginia Data Profile - May 2011
http://slidepdf.com/reader/full/west-virginia-data-profile-may-2011 15/34
Achievement Remains Low: 8th Grade
Achievement Over Time
15Source: National Assessment of Educational Progress. Analysis of data downloaded fromhttp://nces.ed.gov/nationsreportcard/naepdata/
8th Grade Math 1 2 2
West Virginia 10% 19%
U.S. 21% 34%
8th Grade Reading 1 8 2
West Virginia 27% 22%
U.S. 33% 32%
8th Grade Science 1 2
West Virginia 21% 22%
U.S. 29% 30%
%At or Above Proficient on 8th Grade NAEP
8/6/2019 West Virginia Data Profile - May 2011
http://slidepdf.com/reader/full/west-virginia-data-profile-may-2011 16/34
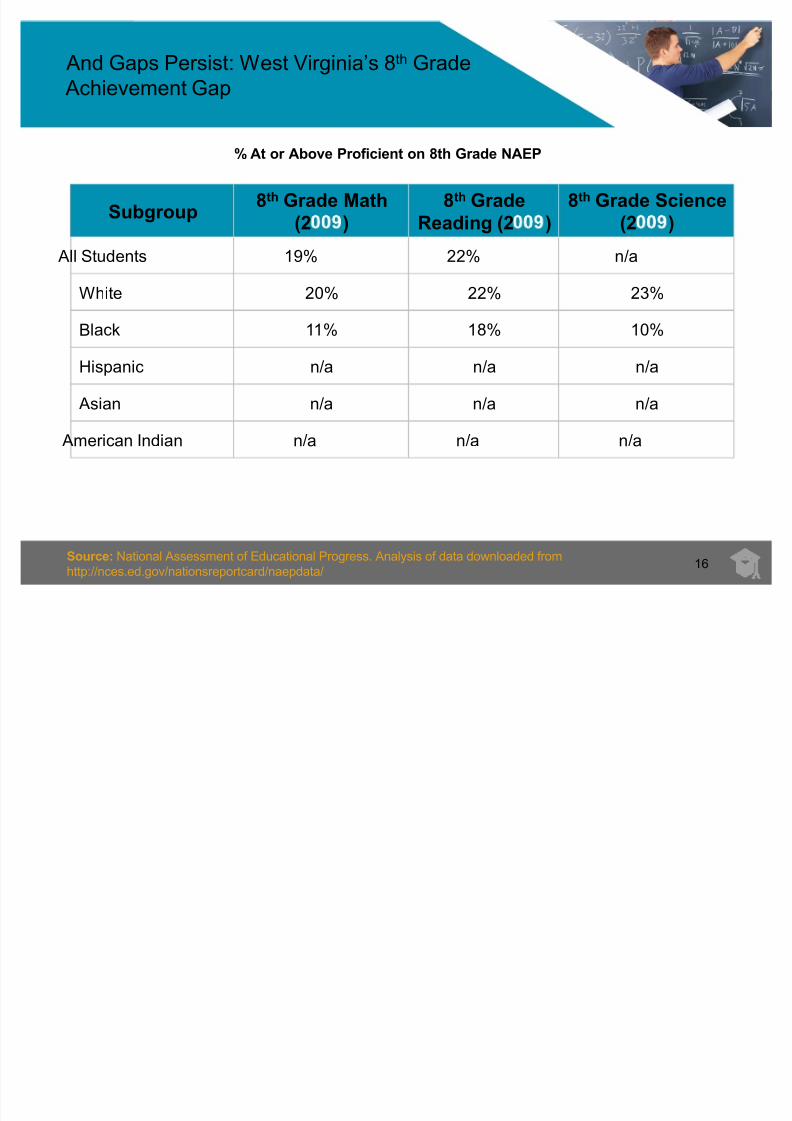
And Gaps Persist: West Virginia¶s 8th Grade
Achievement Gap
16Source: National Assessment of Educational Progress. Analysis of data downloaded fromhttp://nces.ed.gov/nationsreportcard/naepdata/
Subgroup8th Grade Math
(2 )
8th Grade
Reading (2 )
8th Grade Science
(2 )
All Students 19% 22% n/a
White 20% 22% 23%
Black 11% 18% 10%
Hispanic n/a n/a n/a
Asian n/a n/a n/a
American Indian n/a n/a n/a
%At or Above Proficient on 8th Grade NAEP

8/6/2019 West Virginia Data Profile - May 2011
http://slidepdf.com/reader/full/west-virginia-data-profile-may-2011 17/34
High School Graduation Rates Remain
Inequitable in West Virginia
17Source: Education Week (2007). Graduation in the Unit ed Stat es.http://www.edweek.org/media/ew/dc/2010/34sos_gradrate.pdf
U.S.
WV
0%
20%
40%
60%
80%
100%
AmericanIndian AsianHispanicBlack
White All
5 %
8 %
56%54%
77%
6 %
53%64%
72%72%
n/an/a

8/6/2019 West Virginia Data Profile - May 2011
http://slidepdf.com/reader/full/west-virginia-data-profile-may-2011 18/34
America¶s International Edge is Slipping in
High School Graduation Rates
18Source: OECD. E duc ation at a Gl ance 2010 . (All rates are self-reported) http://www.oecd-ilibrary.org/education/education-at-a-glance-2010_eag-2010-en; National Center for Higher EducationManagement Systems, analysis of 2008 and 2009 American Community Survey. http://www.higheredinfo.org
0 20 40 60 80 100
Iceland
U.K.
Netherlands
Norway
Ireland
Denmark
Germany
Israel
Canada
Poland
Korea
U.S.
est irginia
% Young Adults (25-34) with HS Diploma+ % Adults (25-64) with HS Diploma+

8/6/2019 West Virginia Data Profile - May 2011
http://slidepdf.com/reader/full/west-virginia-data-profile-may-2011 19/34
Enrollment in College Does NOT Equal
College Readiness
19Source: National Center for Education Statistics (2003). R emed ial E duc ation at Deg r ee-Granting Postsec ond ary Instit utions in Fall 2000.
Percentage of U.S. first-year students in two-year and four-year institutions requiring remediation

8/6/2019 West Virginia Data Profile - May 2011
http://slidepdf.com/reader/full/west-virginia-data-profile-may-2011 20/34
Freshmen at Two-Year Colleges are More
Likely to Require Remediation
20Source: National Center for Education Statistics (2003). R emed ial E duc ation at Deg r ee-Granting Postsec ond ary Instit utions in Fall 2000.
0%
5%
0%
5%
20%
25%30%
35%
40%
45%
Reading, Writingor Math
ReadingWriting
Math
42%
1 %23%
34%
24%
6%8%13%
2-Year Colleges 4-Year Colleges

8/6/2019 West Virginia Data Profile - May 2011
http://slidepdf.com/reader/full/west-virginia-data-profile-may-2011 21/34
Many College Students Fail to Return Their
Sophomore Year and Go On To Earn Degrees
21Source: National Center for Higher Education Management Systems (2008). R et ention Rat es -First -Ti me College Fr eshmen R et urning Their Sec ond Y ear ; Graduation Rat es.http://www.higheredinfo.org/
0%
20%
40%
60%
80%
Completion (4-Year)Persistence (4-
Year)Persistence (2-Year)
56%
75%
54%
45%
71%
4 %
8/6/2019 West Virginia Data Profile - May 2011
http://slidepdf.com/reader/full/west-virginia-data-profile-may-2011 22/34
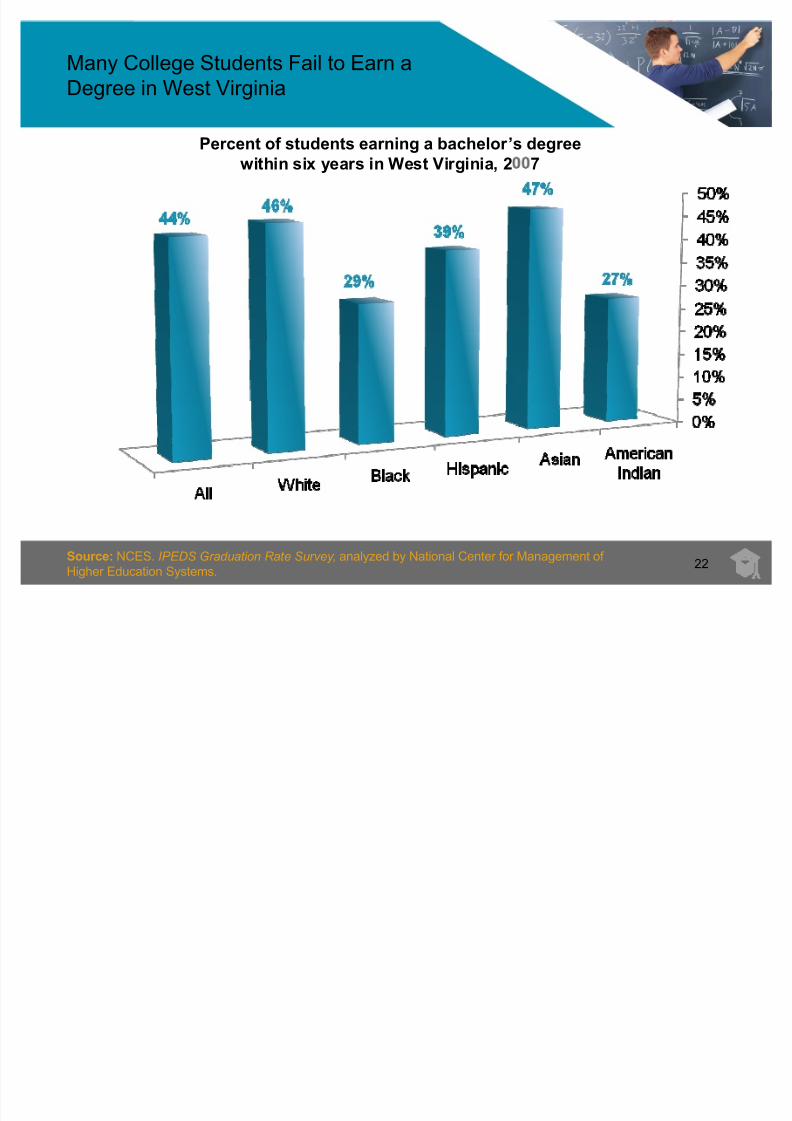
Many College Students Fail to Earn a
Degree in West Virginia
22Source: NCES. IPEDS Graduation Rat e Sur vey , analyzed by National Center for Management of Higher Education Systems.
Percent of students earning a bachelor¶s degreewithin six years in West Virginia, 2 7

8/6/2019 West Virginia Data Profile - May 2011
http://slidepdf.com/reader/full/west-virginia-data-profile-may-2011 23/34
The Majority of Graduates Would Have Taken
Harder Courses, Particularly in Mathematics
23Source: Peter D. Hart Research Associates/Public Opinion Strategies (2005). Rising to the Challenge: Ar e H i g h Sc hool Graduat es Pr epar ed for College and Wor k ? West Virginia, DC: Achieve.
Would have taken
more challenging
courses in at least
one area
Math
Science
English
Knowing what you know today about the expectations of college/work «

8/6/2019 West Virginia Data Profile - May 2011
http://slidepdf.com/reader/full/west-virginia-data-profile-may-2011 24/34
A MORE RIGOROUS & RELEVANT
HIGH SCHOOL EDUCATION WILL
OPEN DOORS FOR STUDENTS ± AND KEEP THEM OPEN

8/6/2019 West Virginia Data Profile - May 2011
http://slidepdf.com/reader/full/west-virginia-data-profile-may-2011 25/34
25
Personal Benefits of Education in West Virginia
While there may be jobs available to high school dropouts and
graduates, they often pay l and off r l c rit y than jobs
held by those with at least some postsecondary experience.
The link between educational attainment and gainful employmentis clear:
More education is associated with higher
earnings and higher rates of employment.

8/6/2019 West Virginia Data Profile - May 2011
http://slidepdf.com/reader/full/west-virginia-data-profile-may-2011 26/34
26Source: U.S. Census Bureau (2010). C urr ent Po pul ation Sur vey . Figures are based on the total personsin the civilian labor force. http://www.census.gov/hhes/www/cpstc/cps_table_creator.html
Personal Benefits of Education in West Virginia
W est Vir g inia Statisti c s: Total Unempl oy ment : 9%, M ean Inc ome: $38 ,5 00

8/6/2019 West Virginia Data Profile - May 2011
http://slidepdf.com/reader/full/west-virginia-data-profile-may-2011 27/34
27Source: Carnevale, Anthony P. et al. (June 2010). HelpWant
ed:Proj
ec tions of Jobs an
d E duc
ation R equ
ir eme
nts Throug
h
2018. Georgetown Center on Education and the Workforce. www9.georgetown.edu/grad/gppi/hpi/cew/pdfs/FullReport.pdf
Analysis based on author¶s analysis of March 2008 CPS data.
Benefits to Education

8/6/2019 West Virginia Data Profile - May 2011
http://slidepdf.com/reader/full/west-virginia-data-profile-may-2011 28/34
28Source: ACT (2010). ACT 2009 R esul ts. http://www.act.org/news/data/09/states.html ; College Board. M ean 2010 S AT Sc or es by Stat e. http://professionals.collegeboard.com/profdownload/2010-sat-trends.pdf
West Virginia¶s Students Taking College
Admissions Exams
2 1 West Virginia U.S.
Participation in ACT 64% 47%
Average ACT Score 20.7 21
Participation in SAT 16% 47%
Average SAT Score 1522 1509

8/6/2019 West Virginia Data Profile - May 2011
http://slidepdf.com/reader/full/west-virginia-data-profile-may-2011 29/34
29Source: ACT (2010). College R ead iness Benc hmar k Attainment by Stat e.http://www.act.org/news/data/10/benchmarks.html?utm_campaign=cccr10&utm_source=data10_leftnav&utm_medium=web#benchmark
Students Meeting College Readiness
Benchmark
U.S.
WV
0
20
40
60
80
English, 2010Reading, 2010
Math, 2010Science, 2010
All 4 tests, 2010
66
52
43
224
71
54
3224
18
Percentage of ACT-tested graduates who met or
exceeded the College Readiness Benchmark score
Not e: A benc hmar k sc or e ind i c at es a 5 0% c hance of obtaining a Bor hi g her or about a 7 5 % c hance of obtaining a C or hi g her in the c orr es pond ing c r ed it -bearing c ollege c ourses.

8/6/2019 West Virginia Data Profile - May 2011
http://slidepdf.com/reader/full/west-virginia-data-profile-may-2011 30/34
30Source: College Board (2011). AP R eport to the Nation.http://professionals.collegeboard.com/profdownload/7th-annual-ap-report-to-the-nation-2011.pdf
Students Participating in Advanced
Placement and Exceeding College and Career
Readiness
Percent of all 12th Graders Participating inAdvanced Placement (2 8)

8/6/2019 West Virginia Data Profile - May 2011
http://slidepdf.com/reader/full/west-virginia-data-profile-may-2011 31/34

8/6/2019 West Virginia Data Profile - May 2011
http://slidepdf.com/reader/full/west-virginia-data-profile-may-2011 32/34
West Virginia¶s Commitment to Closing the
Expectations Gap to Date
32
In 2 6, West Virginia adopted high school standards aligned withcollege and career expectations
West Virginia administers the WESTEST, an 11th grade assessment
capable of measuring students¶ readiness for college and careers, that
is used to place students in credit-bearing, first-year college courses.
West Virginia¶s longitudinal data system satisfies nine of the Data
Quality Campaign¶s ten essential elements, including the regular
matching of student-level data across K-12 and postsecondary
systems.
West Virginia adopted the Common Core State Standards in June
2 1 .
West Virginia is a Governing State in the SMARTER Balanced
Assessment Consortium (SBAC), a group of states working to develop
a common assessment system using Race to the Top Common
Assessment funds.

8/6/2019 West Virginia Data Profile - May 2011
http://slidepdf.com/reader/full/west-virginia-data-profile-may-2011 33/34
How West Virginia Can Continue to
Build on its Momentum«
«Realize the promise of the Common Core State Standards by implementing
them fully and successfully, taking into consideration the related curricular
and policy changes.
«Adopt college- and career-ready graduation requirements, aligned to the
Common Core State Standards, to ensure all students are prepared, and
eligible, for entry into college and skilled careers.
«Remain committed to the goals of the common assessment consortium
and developing a next-generation, computer-based assessment system that
will measure the full range of the Common Core State Standards.
«Continue to make progress on the state¶s data collection efforts,
particularly around making student data available to relevant stakeholders.
«Re-examine the state¶s K-12 accountability system to determine how it can
reward measures of college and career readiness, in alignment with the
state¶s standards and course requirements.

8/6/2019 West Virginia Data Profile - May 2011
http://slidepdf.com/reader/full/west-virginia-data-profile-may-2011 34/34
HOW WELL IS WEST
VIRGINIA PREPARING ALL
STUDENTS FORCOLLEGE, CAREERS AND
LIFE
May 2011