Embed Size (px)
Citation preview

West meets East:
Monitoring and modeling urbanization
in China
Land Cover-Land Use Change Program Science Team Meeting
April 3, 2012
Annemarie Schneider
Center for Sustainability and the Global Environment, University of Wisconsin-Madison

How are humans changing the Earth?
What are the drivers and implications of this change?
How does the built environment affect energy use, carbon emissions, and climate?
New attention to urban areas in land use/land cover research
Can urban development strategies be aligned with climate change adaptation?
How can urban planning tools be used to develop more resilient cities?
How do urban processes contribute to global environmental change?
Introduction

Introduction
Monitoring urban systems and land
patterns regionally-globally using
satellite data
Local case-study analysis of
geographically comprehensive sample
of cities
Predictive modeling, forecasting of
dynamic socio-economic forces and
land-based outcomes
Understanding urbanization in China
and the Monsoon Asia region

Introduction
Tremendous opportunity to shape the built environment
Majority of urban
development on the
ground by 2050 in China
will be built between now
and then
Single-family home and ‘villa’ development – new trends in China

Policy reforms
1978 economic, land reforms:
decentralization, land use rights,
liberalization of household registration
system (hukou) and work unit (danwei)
1990s great western development
program
2001 new emphasis on villages
Impacts?
Rapid rural-urban migration
Rapid land use change
Agricultural expansion, intensification
GDP 1978-2008: 8-14%
Increase in income -
vehicles, housing, diet
Urbanization in China
Photos: A. Perlstein

Urban expansion in China
Sample of 15 urbanizing regions...
Case study methods
Remote sensing -
multi-date change detection
Work closely with
collaborators, contacts
Assess trajectory of
multiple time points
Monitor peri-urban, village
development
Spatial analysis
Compare east vs. west

Remote sensing methods
Numerous change detection methods, 30 year history
april 1991 august 1992 november 2000
Common problems
Complexity of landscape in SE Asia
Confusion between new urban
and bare agriculture plots
Agricultural, vegetation variability
Choice of method:
Supervised multi-date classification
Multi-temporal, multi-seasonal approach
Dense time stacks of Landsat data
Training examples:
stable and changed classes
Accuracy assessment

Dense time stacks of Landsat data
Seasonal information - i.e. multiple ‘looks’ per year - is
the only way to reliably monitor urban and built-up areas
in the complex environments of Southeast Asia
Sample Landsat dense time series for Kunming, 50 images 1988-2009

Enhanced v
egeta
tion index (
EV
I)
Phenology of
urban areas

Seasonal trajectories of land cover types
Multi-year NDVI trajectories derived from atmospherically-corrected Landsat data (LEDAPS, Masek, 2007).

Remote sensing methods
1. Which supervised classification algorithm performs the best given
complex, dense temporal stacks?
Traditional maximum likelihood classifier
Boosted decision trees (C4.5)
recursive partitioning of training data into successively
more homogeneous subsets based on entropy
Support vector machines (libSVM)
optimal boundaries between classes are defined in
feature space using optimization algorithms
2. Can feature selection lead to greater map accuracy?
40-55 scenes, uncorrected Landsat data
Additional inputs: NDVI, min, max, mean of each band)
3. How well do multi-temporal approaches work in
peri-urban environments given the small size
of settlements?
a c b
a b
final class labels
support
vectors
optimal hyperplane
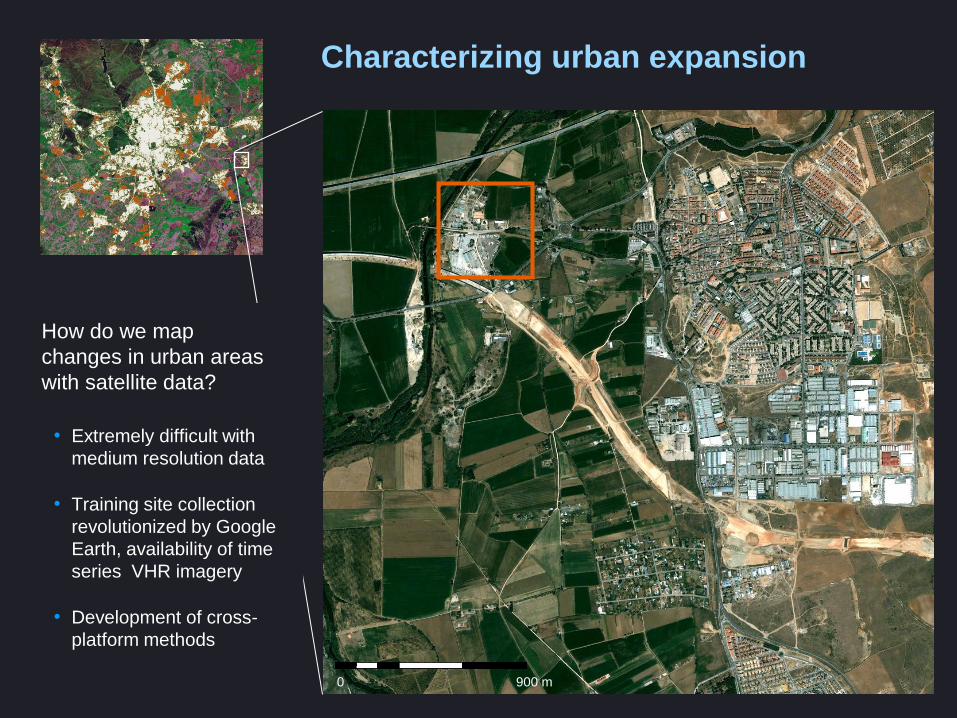
Characterizing urban expansion
How do we map
changes in urban areas
with satellite data?
• Extremely difficult with
medium resolution data
• Training site collection
revolutionized by Google
Earth, availability of time
series VHR imagery
• Development of cross-
platform methods
0 900 m

Results
Accuracy assessment –
algorithm performance
Cross-validation approach using
tenfold 80/20 splits
Decision trees and SVM
outperform traditional max
likelihood
Decision trees and SVM perform
equally well (statistically
speaking)
Additional data inputs caused
small increase in accuracy
Chengdu Xi’An Kunming
Overall accuracy results
a. Maximum likelihood
all landsat bands 56.3 (1.6) 76.1 (0.6) 68.6 (1.1)
all landsat, all ndvi 53.4 (1.5) 74.9 (1.0) 68.2 (1.7)
all landsat, all metrics 48.9 (2.1) 73.4 (1.5) 67.7 (1.2)
all landsat, ndvi, metrics 51.4 (1.5) 74.5 (0.9) 68.7 (0.9)
all landsat, no slc-off 67.9 (1.4) 89.4 (0.6) 63.6 (24.2)
all ndvi 71.8 (1.3) 84.1 (0.7) 76.8 (0.7)
all ndvi, all metrics 74.6 (1.8) 86.6 (1.2) 71.3 (17.7)
b. Decision trees
all landsat bands 85.5 (0.7) 93.0 (0.6) 91.1 (0.9)
all landsat, all ndvi 88.1 (0.9) 93.6 (0.7) 91.7 (1.0)
all landsat, all metrics 88.0 (0.6) 93.7 (0.7) 91.9 (0.8)
all landsat, ndvi, metrics 89.8 (0.8) 93.8 (0.6) 92.9 (0.4)
all landsat, no slc-off 75.6 (1.4) 91.8 (0.3) 86.7 (0.7)
all ndvi 77.5 (1.1) 91.0 (0.9) 86.7 (0.7)
all ndvi, all metrics 82.6 (0.8) 93.2 (0.5) 91.2 (0.7)
c. Support vector machines
all landsat bands 90.0 (1.3) 93.9 (0.8) 92.5 (0.6)
all landsat, all ndvi 89.3 (0.7) 94.1 (0.5) 92.8 (0.8)
all landsat, all metrics 91.0 (0.7) 93.8 (0.6) 92.9 (0.7)
all landsat, ndvi, metrics 90.9 (0.8) 94.1 (0.7) 93.0 (0.8)
all landsat, no slc-off 79.5 (1.0) 91.5 (0.5) 87.8 (0.4)
all ndvi 76.1 (1.1) 90.2 (0.9) 84.4 (1.2)
all ndvi, all metrics 84.0 (0.9) 93.4 (0.7) 90.9 (0.5)

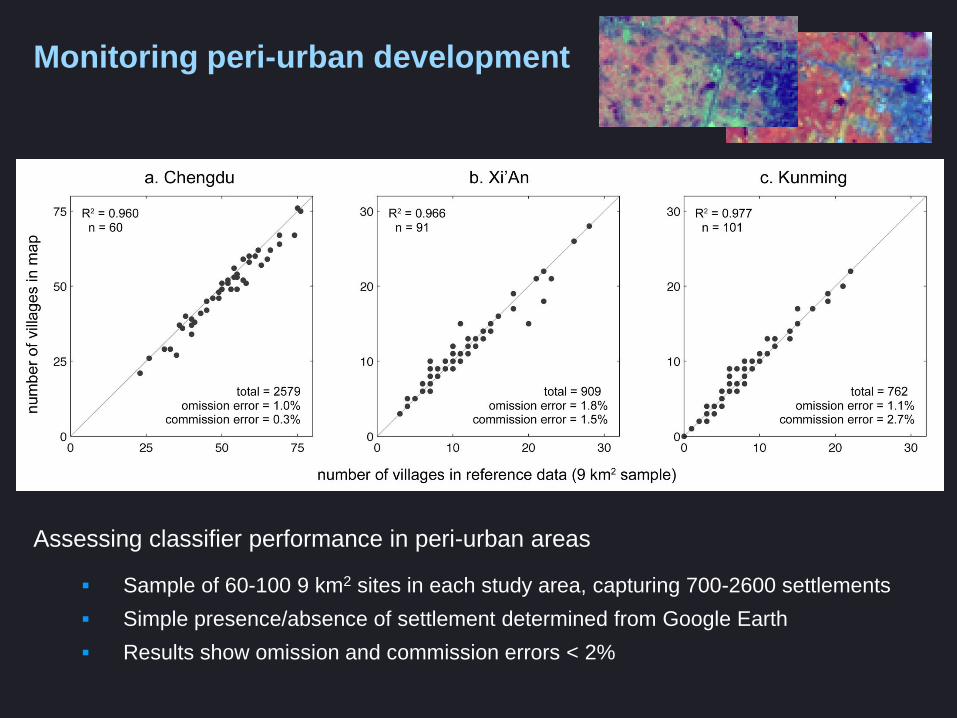
Monitoring peri-urban development
Assessing classifier performance in peri-urban areas
Sample of 60-100 9 km2 sites in each study area, capturing 700-2600 settlements
Simple presence/absence of settlement determined from Google Earth
Results show omission and commission errors < 2%
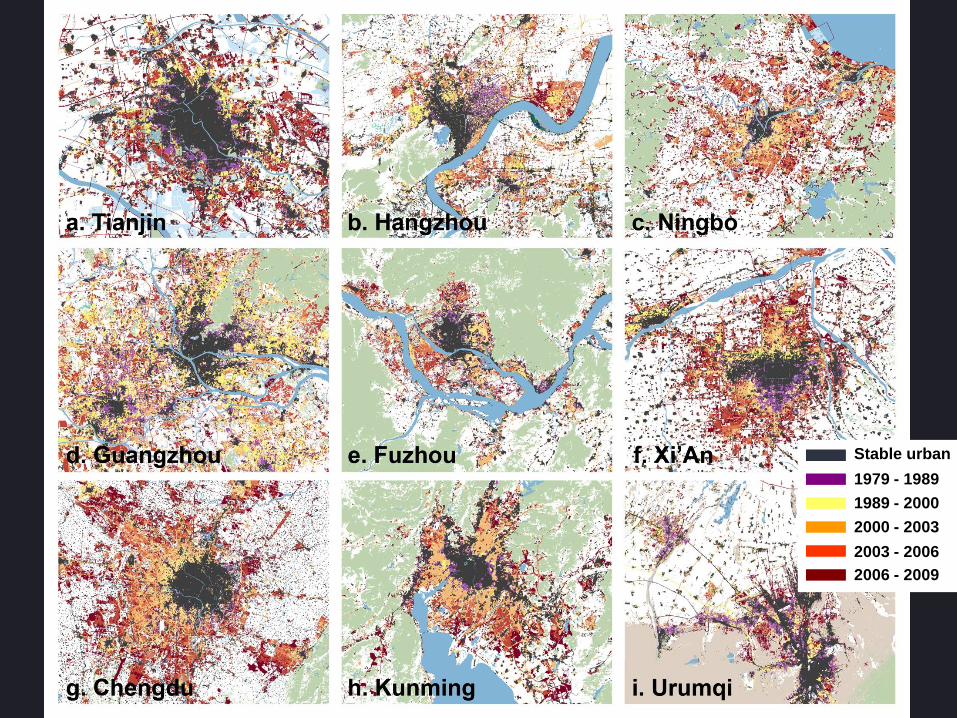
Stable urban
1979 - 1989
1989 - 2000
2000 - 2003
2003 - 2006
2006 - 2009

Results – waves of urban expansion
Average annual
rates of change,
1990-2000 and
2000-2009
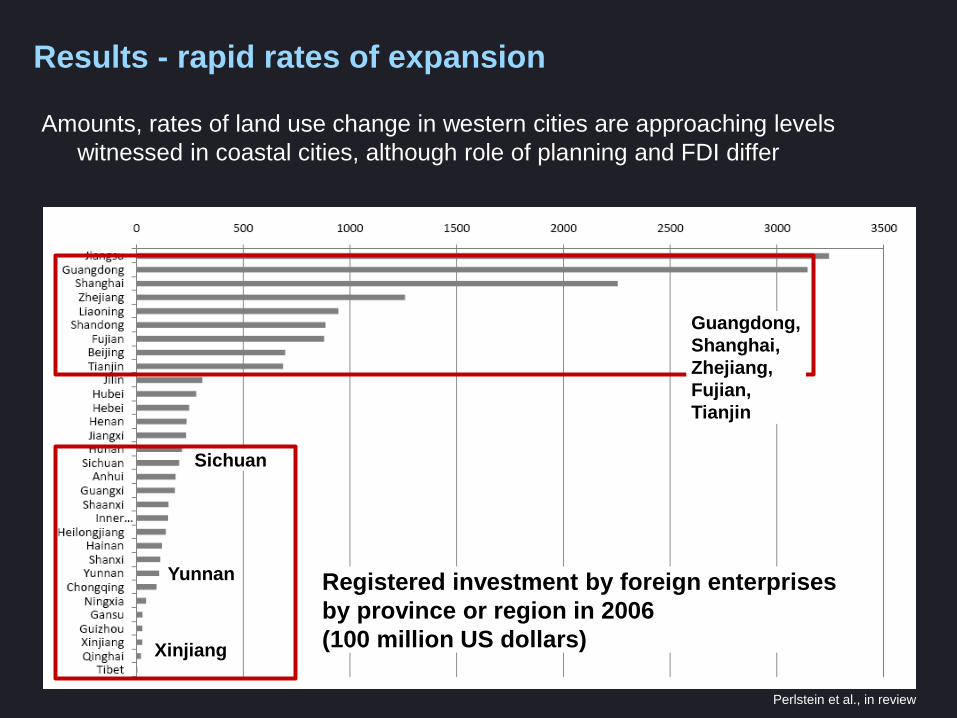
Results - rapid rates of expansion
Amounts, rates of land use change in western cities are approaching levels
witnessed in coastal cities, although role of planning and FDI differ
Registered investment by foreign enterprises
by province or region in 2006
(100 million US dollars)
Yunnan
Sichuan
Xinjiang
Perlstein et al., in review
Guangdong,
Shanghai,
Zhejiang,
Fujian,
Tianjin

Results - rapid expansion, loss of arable land
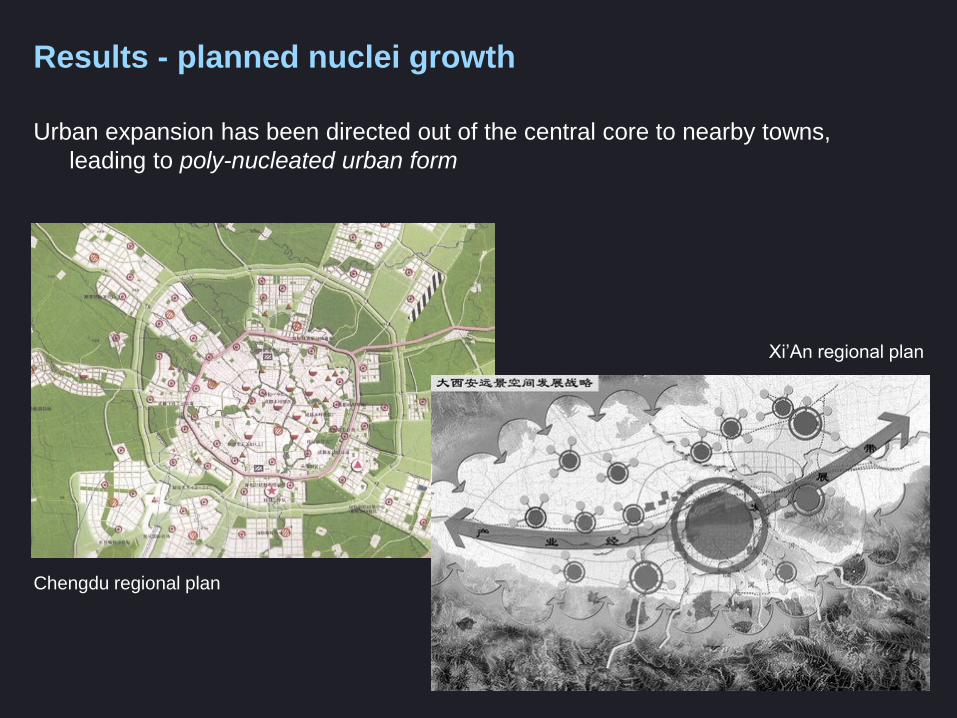
Results - planned nuclei growth
Urban expansion has been directed out of the central core to nearby towns,
leading to poly-nucleated urban form
Chengdu regional plan
Xi’An regional plan

Results - planned nuclei growth
Urban expansion has been directed out of the central core to nearby towns,
leading to poly-nucleated urban form
Simple measurement:
amount of urban land within core, nuclei at each time point
core
nuclei

Results - planned expansion far from city
Chengdu 1988 Chengdu 2000 Chengdu 2009
Urban expansion has been directed out of the central core to nearby towns,
leading to poly-nucleated urban form
For each period, is development proximate to or far from existing urban land?

Results - planned expansion far from city
In later periods (2003-2006, 2006-2009),
urban expansion occurs farther from the city’s edge (5-10 km)

Results – population change vs. expansion of urban land
1970s-2010

Conclusions
How are urban areas changing across China?
How can we monitor rapid expansion across
multiple time periods?
New era of remote sensing - increasing availability of
VHR and multi-temporal datasets
Results show that urban expansion can be mapped
successfully with dense time stacks of Landsat data
Overall accuracy across cities - 90-94%
DTs and SVMs perform equally
well in terms of accuracy,
but DTs perform better with
respect to noisy, missing data
Feature selection produced
mixed results, yet including
NDVI and metrics showed
modest accuracy increases (1-4%)
High quality training data
Dongguan, Eastern China urban land 1990
urban expansion, 1990-2000
Chengdu, Western China
Wuhan, Central China
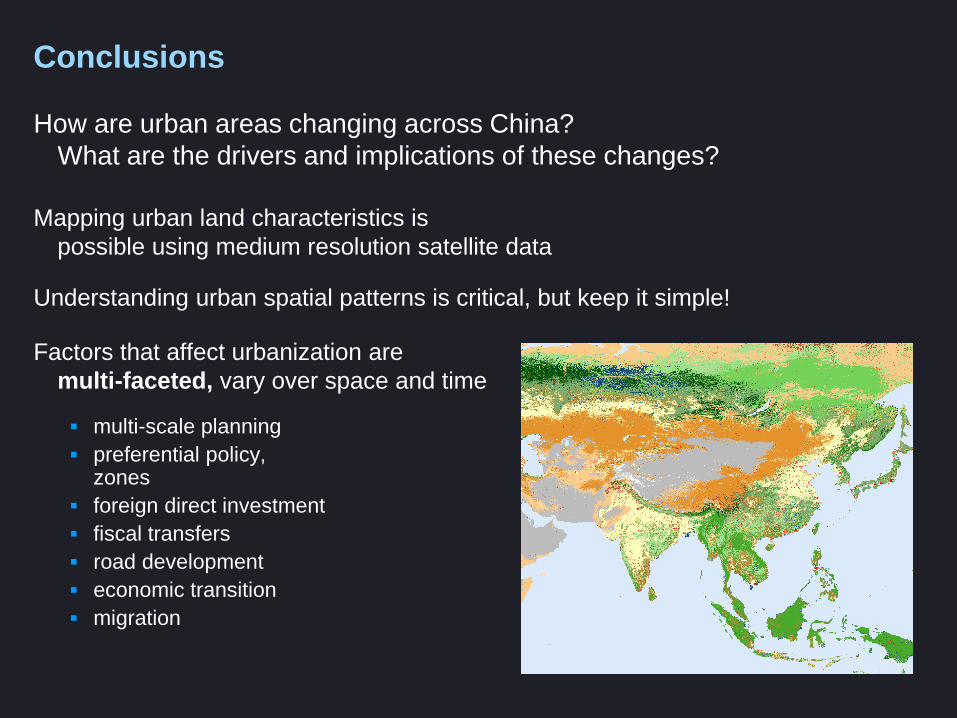
Conclusions
How are urban areas changing across China?
What are the drivers and implications of these changes?
Mapping urban land characteristics is
possible using medium resolution satellite data
Understanding urban spatial patterns is critical, but keep it simple!
Factors that affect urbanization are
multi-faceted, vary over space and time
multi-scale planning
preferential policy, development zones
foreign direct investment
fiscal transfers
road development
economic transition
migration
urban land 1990
urban expansion, 1990-2000
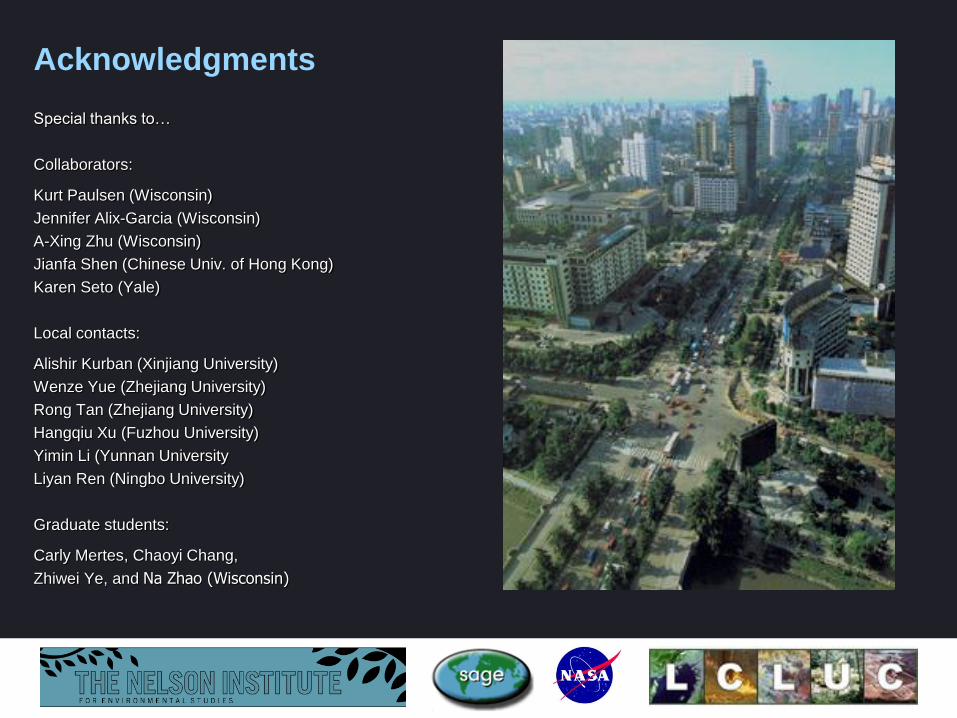
Acknowledgments
Special thanks to…
Collaborators:
Kurt Paulsen (Wisconsin)
Jennifer Alix-Garcia (Wisconsin)
A-Xing Zhu (Wisconsin)
Jianfa Shen (Chinese Univ. of Hong Kong)
Karen Seto (Yale)
Local contacts:
Alishir Kurban (Xinjiang University)
Wenze Yue (Zhejiang University)
Rong Tan (Zhejiang University)
Hangqiu Xu (Fuzhou University)
Yimin Li (Yunnan University
Liyan Ren (Ningbo University)
Graduate students:
Carly Mertes, Chaoyi Chang,
Zhiwei Ye, and Na Zhao (Wisconsin)


![Groundwater Monitoring Instruments Modeling Software Catalog[1]](https://img.pdfslide.us/doc/110x75/54f9c26c4a7959d7638b5157/groundwater-monitoring-instruments-modeling-software-catalog1.jpg)
