Embed Size (px)
Citation preview

WEST COAST MARINE HIGHWAY MARKET ANALYSIS PROJECT
Prepared for:
Whatcom Council of Governments on behalf of
West Coast Corridor Coalition through a cooperative agreement with
United States Department of Transportation – Maritime Administration
April 2014
Prepared by: Cardno TEC Inc. 2825 Eastlake Avenue East, Suite 300 Seattle, WA 98102
West Coast Marine Highway Market Analysis
ABSTRACT
The West Coast Corridor Coalition sponsored the M-5 Marine Highway Corridor study to determine the market and operational viability of Marine Highway services on the West Coast. Such services should be economically and operationally attractive to shippers and able to obtain sufficient cargo volumes in the marketplace. Operational, utilization, and cost parameters for six potential Marine Highway services were developed for the study, using a market analysis of cargo routing data from the Federal Highways Administration’s (FHWA) Freight Analysis Framework (FAF3). Four of the services were between port pairs, and the other two services were strings with multiple ports. Three of the four potential services between port pairs were estimated judged to have the greatest potential to be economically viable from an operational perspective, and a business plan and viability assessment was developed for them. Those port pairs were:
1) San-Pedro Bay Ports (Ports of Los Angeles and Long Beach) to the Port of Oakland;
2) San-Pedro Bay Ports to Pacific Northwest Ports (Ports of Seattle and Tacoma); and
3) Port of Oakland to Pacific Northwest Ports.
The two multi-port service strings were not included in the expanded analysis, because the relatively short-distance between the port pairs on the strings was not cost or time competitive with truck transportation. The strings included San Diego/San Pedro, San Pedro/Port Hueneme, Oakland/ Redwood City, and Humboldt Bay/Crescent City.
The business plan and viability assessment found that a Marine Highway service between the San-Pedro Bay Ports and the Port of Oakland appears to have potential for financial viability due to available cargoes and other operational factors. The study also identified several challenges that if solved, could increase the likelihood of developing other successful Marine Highway services on the M-5 Marine Highway Corridor:
1) The shortage of efficient, right-sized vessels eligible to transport U.S. domestic cargoes;
2) The shortage of credible market data to identify cargoes available for Marine Highway services; and
3) The lack of maritime entrepreneurs willing to take the risk of starting up a new service.
DISCLAIMER AND LIMITATIONS This report is the result of a study conducted under a cooperative agreement between the Whatcom Council of Governments, Humboldt Bay Harbor Recreation and Conservation District, and the Port of Redwood City. The cooperative agreement was funded by the U.S. Maritime Administration. This report is disseminated under the sponsorship of the West Coast Corridor Coalition. The statements, findings, conclusions, and recommendations in this report are those of the researchers and staff, and do not necessarily reflect the views of any government agencies or organizations that funded the study. This report does not constitute a standard, specification, or regulation. The United States Government does not endorse the findings in this report. Neither the United States Government nor any agency thereof, nor any of their employees, nor any of their contractors, subcontractors or their employees, makes any warranty, express or implied, or assumes any legal liability or responsibility for the accuracy, completeness, or any third party's use or the results of such use of any information contained in this document in whole or in part. Certain forward-looking statements are based upon interpretations or assessments of best available information at the time of writing. Actual events may differ from those assumed, and events are subject to change. Findings are time-sensitive and relevant only to current conditions at the time of writing. Factors influencing the accuracy and completeness of the forward-looking statements may exist that are outside of the purview of the consulting firm, TEC Inc. Questions regarding this report or its contents should be directed to: Eric Stromberg, Project Manager, [email protected]

West Coast Marine Highway Market Analysis
ES-i
EXECUTIVE SUMMARY On January 31, 2011, the Whatcom Council of Governments (COG) issued a Request for Proposals (RFP) soliciting interest to undertake a "West Coast Marine Highway Market Analysis Project." The Whatcom COG, acting on behalf of the West Coast Corridor Coalition, together with the Humboldt Bay Harbor Recreation and Conservation District, and the Port of Redwood City, entered into a cooperative agreement for the organization and management of the research project. A Management Committee was formed, comprised of the aforementioned entities, to review, evaluate, and approve all deliverables, as well as providing guidance to the selected consultant team during the study. The market analysis study was funded by a cooperative agreement with the U.S. Department of Transportation (USDOT) under the Maritime Administration (MARAD) Marine Highway Grant program.
As stated in the RFP, the “solicitation seeks to further advance the America’s Marine Highway Program by identifying corridor-specific Marine Highway markets, developing tailored business plans and optimal operational models for those markets along and related to the M-5 Marine Highway Corridor." The navigable waterways along the U.S. West Coast were designated the M-5 Marine Highway Corridor by the Secretary of Transportation.
The study was broken down into six parts:
1. Literature Search,
2. Market Analysis,
3. Operational Development,
4. Business Plan and Viability,
5. Environmental Analysis, and
6. Conclusions and Recommendations.
The project was awarded to the TEC Inc. (TEC) team, comprised of TEC, Parsons Brinckerhoff, and Global Logistics Development Partners on April 7, 2011. Independent consultant Erik Stromberg, project manager, Pete Keller, Mike Zachary, and Paul Bea, completed the TEC team.
The approach to this project was based on an understanding of the business of ocean and coastwise shipping, inland transportation and ports, and the long history of studies related to Marine Highway services and its antecedent label, “short sea shipping.” The study team focused on developing practical, "real world" solutions to the question posed in the RFP. No assumptions were made about sweeping changes in law or the shipping business and practices. Instead, this study was written to determine 1) if there were commercial opportunities for the development of West Coast Marine Highway services, and 2) what are the gaps to be bridged. Public policy, including local community and environmental regulatory issues, were addressed as an important part of the scope. A full discussion of the report's conclusions and recommendations is found in Part 6.
Below are highlights from the study team’s work on each part.

West Coast Marine Highway Market Analysis
ES-ii
Part 1 – Literature Review. The topic of Marine Highways has been subject to extensive study and discussion, as demonstrated by the 200 relevant studies, reports, presentations, program regulations, and articles. Most sources yielded a relatively homogenous blend of discussion on the need for Marine Highway services, as well as the constraints and opportunities for their realization. The literature suggests that there are promising Pacific Coast markets that warrant study and analysis. For Marine Highway services to work in those markets, they will need to meet critical reliability, pricing and frequency of departure requirements.
The availability of right-sized and efficient vessels that are suitable for Marine Highway services (with the exception of tug/barge operations) is often mentioned as a challenge facing new coastal services.1 The need for efficient vessels is partly attributable to the need for Marine Highway vessels to almost exclusively operate in the International Maritime Organization (IMO) sanctioned North American Emissions Control Area (ECA) that was established to reduce vessel air emissions.
As a general matter, the externalities and public benefits of Marine Highway services are important topics to address if they are to become a more common element within the Nation’s Surface Transportation System.
Although commercial marine operations are normally in the domain of the private sector, government policy can be a factor in creating conditions that serve to heighten or dampen opportunities for Marine Highway service development. Various published reports, including the Maritime Administration’s own Report to Congress (April 2011) identify policy approaches to encouraging Marine Highway services development and incentivizing the use of such services.
Part 2 – Market Analysis. A market analysis was done with an understanding that the available freight movement data – principally the FHWA's Freight Analysis Framework (FAF3) – was limited in its capabilities to address all aspects of the potential market for Marine Highway services. However, when an understanding of U.S. West Coast freight movement is combined with County Business Patterns, U.S. Bureau of Economic Analysis (USBEA) Regional Economic Data, and Census Trade Data detailing international cargo flows, an understanding of freight movement along the I-5 / M-5 corridor traffic became possible. The information was used in a filtering process to identify potentially viable port pairs.
Because the coastal M-5 Corridor represents a new market for Marine Highway services, a successful Marine Highway service will need to attract both cargo (shippers) and transportation providers (carriers). Critical commercial parameters consist of the following:
• Density – the amount of cargo transported in a single move.
• Frequency – the number of times a transport move is made (weekly, biweekly, daily).
• Reliability – the ability to predict, on a consistent basis, the movement of cargo. This factor includes arrival, departure, transit time, costs, security, and overall customer confidence in the move.
1 Vessel operating, construction, and manning requirements are set by the Merchant Marine Act of 1920 Section 27 (P.L. 66-261 46 USC 551.
West Coast Marine Highway Market Analysis
ES-iii
• Balance – the ability to have revenue moves in both directions (elimination or reduction of deadheading or empty non-revenue moves).
• Revenue/Cost – for a carrier/operator, revenue that creates a profit; for the shipper costs of transportation that maintains the economics of the pricing model for the commodity moved.
There are two categories of cargo transport opportunities for U.S. West Coast Marine Highway services. The first is the opportunity to deploy domestic feeder services as a service augmentation and efficiency enhancement to international container services. The liner carriers may find benefit in moving some of their cargoes between these ports if they can reduce vessel days and costs. Further, as these cargoes are already at marine facilities, drayage operations would be simplified. While it is acknowledged that most international containers would not switch to feeder services, if a small portion of volumes was converted, and it was combined with domestic cargo, it would form the basis for a potentially successful West Coast Marine Highway service.
The second category is domestic freight currently moving along the U.S. West Coast I-5 corridor via truck or rail. Low value and minimal time sensitive cargo comprise the most likely candidates for Marine Highway services and are listed in greater detail in Table 2-5. The largest, perhaps most interesting product is "waste/scrap," which moves in high volume both north and south, especially between the San Francisco and San Pedro Bay regions.
As a result of the Market Analysis, the following Marine Highway service opportunities were selected for operational analysis: San Diego – San Pedro Bay, San Pedro Bay – San Francisco Bay, San Pedro Bay – Pacific Northwest, San Francisco – Pacific Northwest, West Coast Hub-Feeder Service, and Golden State Marine Highway. (It should be noted that the California Green Trade Corridor, or M-580 Corridor between Stockton and Oakland, was not included for operational or business case analysis because the project was in the process of bidding and award due diligence during the study period.)
Part 3 – Operational Development. This section formed the core component of this study and identified current actual costs associated with coastal shipping operations, with trucking as its major competitor. A detailed operational plan for four potentially viable port pairs and two multi-port Marine Highway corridors was developed with associated costs quantified. For this analysis, existing tonnage (in U.S. domestic trades), current labor arrangements, and law (i.e., no exemption to the Harbor Maintenance Tax (HMT), were utilized. When compared with costs from competing modes and operational/service parameters, three domestic pairs with opportunities in the short term to mid-term future required additional analysis in a conceptual business pro forma framework.
Although a tug and barge operation is operationally feasible, the most commercially viable Marine Highway service vessel at this point in time would appear to be a modest sized cellular container vessel or a combination lift on/lift off (Lo/Lo) and roll on/roll off (Ro-Ro) vessel built to specifications that would include:
• Best in class fuel efficiency;
• Thrusters for maneuverability;
West Coast Marine Highway Market Analysis
ES-iv
• Unattended engine room technology;
• Gearless and hatchless for landside operational efficiencies; and
• Some Ro/Ro space for trailers and over-sized cargoes.
In general, a viable Marine Highway service will attract international cargoes (i.e. for shipment overseas) that are not time sensitive, are bulky or heavy, and load in 40-foot containers. This pertains to both import and export cargoes. However, while many suggest that a Marine Highway service could provide an option to load containers heavy, care should be taken not to exceed safe container, crane and vessel design limits and the drayage weight limits (adding an overweight permit to the dray will be cost prohibitive). In addition, balancing container fleet types and container inventories can be a challenge that will need to be resolved for the Marine Highway service to be successful.
Marine highway service applications will require marine terminal facilities to support the conveyance type chosen for the service. Berths should be available as necessary to accommodate Marine Highway service requirements, which may include flexible and responsive terminal operations. The transit time and service certainty provided by truck and rail operators will need to be seamlessly matched as much as possible. Consistency of operations is a prime consideration as today’s sophisticated supply chains, even for less time sensitive cargoes, still demand a reliable, consistent service.
Operational requirements for the shipment of domestic cargo on Marine Highway services should be recognized in the operations of marine terminals. Cargo cut-offs, which in the international trades are normally a day prior to vessel sailing, will need to be compressed to an hour or so prior to sailing. This adds complexity, and commensurate costs, especially in larger ports. Domestic operations may also require extended terminal operating hours, which can increase costs.
Operational Development Assumptions:
Modal cooperation: The marketplace for freight delivery along the coast includes truck, rail, and potentially Marine Highway services. However, it is likely that similar to the truck/rail competitive environment, a Marine Highway service provider will find it useful to explore cooperative ventures in which the service will be augmented by truck or rail transportation services. A case in point would be the interest of an intermodal marketing company (IMCs) to avail themselves of a Marine Highway service to move its product between modes and thus become a customer of the Marine Highway service.
Proximity to port: Dray 25 miles for major urban ports, 35 miles or more for smaller ports.
International/domestic cargo mix: International cargo (i.e. for shipment overseas) currently being carried by international container carriers will serve as base cargo for a prospective Marine Highway service, to be augmented by domestic cargoes within economically feasible distances.
Port and labor charges: Port labor plays a vital role in the U.S. marine transportation system, and their participation is necessary for a successful Marine Highway System. This analysis assumed all-in stevedoring rates at larger ports of $180/lift and at smaller
West Coast Marine Highway Market Analysis
ES-v
ports of $150/lift. All-in rates were allowed to be variable based on actual operating conditions within a 10-20 percent range.
Pricing model: New Marine Highway services are priced to operate at a 20 percent discount from trucking rates to attract new customers. Understanding that over time and with acceptance by the market, this discount will likely tend to equalize with alternative surface modal rates.
Utilization: The business models in this study aggressively assume 100 percent utilization with alternative analysis at 90 percent and 80 percent in some cases.
Route length: No assumptions are made with regard to coast wise route length.
Vessel type: No initial assumptions were made with regard to vessel type, although a generic combination roll on/roll off and lift on/lift off vessel with a capacity of 600 twenty foot equivalent unit (TEUs) would likely be most appropriate for coast-wise sailing (price based on 100 percent Lo/Lo for simplicity). Nonetheless, a tug and barge as a vessel type would not be excluded from consideration in certain circumstances.
Market size: No minimum market size assumptions were made; however, the greater the market size, the better opportunity for long term success.
Port to port compared to multiple port calls: The economics and logistical challenges for a multiple port corridor are greater than for a single port pair. However, there may be market opportunities at each of the multiple ports that can potentially outweigh the numerous cost points. A systems analysis would quantify the factors necessary to achieve an economically viable multi-port service.
Wharfage/dockage charges: No reductions in public port charges or dockage charges based on port tariff were assumed.
Harbor Maintenance Tax: No waiver was assumed. However, there is no definitive calculation of the average U.S. West Coast HMT charges. Based on a U.S. Army Corps of Engineers study of container cargo value from their Waterborne Commerce Statistics Center, an average HMT charge of $37.50/TEU was assumed.
Part 4 – Business Plan and Viability. A prospective ten-year pro forma business plan was generated for three of the prospective Marine Highway services: San Pedro – Oakland, San Pedro – Pacific Northwest (PNW), and Oakland – PNW. A short term business pro forma plan would be up to five years; five to 10 years for a mid-term business pro forma plan; and over ten years for a long term business pro forma plan.
Revenue forecasts were based on the assumption that a 20 percent discount off current trucking rates would be required to entice traffic to a start-up Marine Highway service, with rate increases of three percent at three year intervals. All pricing is inflation adjusted at two percent per year. Utilization was assumed to reach 95 percent at year three – an admittedly optimistic assumption. Vessel financing assumed that a Title XI loan guarantee was secured.
A number of models with varying assumptions were run. They included:
1. existing tonnage with no discounts applied;
West Coast Marine Highway Market Analysis
ES-vi
2. existing tonnage and costs, but with an exemption to the HMT; and
3. existing tonnage and 20 percent discount off stevedoring and port wharfage/dockage charges.
These variables were applied also to a new build with associated costs and savings based on the American Marine Highway Design Project (AMH Design Project) for the U.S. Maritime Administration, (October 2011).2
One prospective Marine Highway service cleared this analysis and assumptions, San Pedro – Oakland. These port pairs warrant further investigation as to their viability through a more robust business plan.
Part 5 – Environmental Analysis. There are numerous regulations and public policy constraints that a Marine Highway service would need to navigate. Time and resources will be required to address all issues, but the analysis did not identify any major environmental impacts that would eliminate any one of the proposed corridors or port pairs.
Part 6 – Conclusions and Recommendations. The study’s approach, assumptions, and findings are reiterated, while also describing key success factors related to private- and public-sector actions needed to take advantage of Marine Highway services along the M-5 Corridor. Overall, a viable Marine Highway service requires two fundamental components: 1) services that are economically and operationally attractive; and, 2) potential cargo volumes that are attainable in the marketplace.
For Marine Highway services to be attractive to shippers, the services should offer an economic advantage over surface modes to potential customers in lower per unit transportation costs or service improvements (e.g., reliability and transit time). For the operator, the ability to provide service frequency and pricing required by the customer will depend largely on volume (in both directions), utilization, and systems costs. The challenges facing a Marine Highway service operation are highlighted. Recommendations in this document were made based on what the study team viewed as important yet commercially and operationally feasible changes. Specifically, this study has identified the following key success factors:
Vessels: Services need vessels of the appropriate size and fuel efficiency. New build construction are estimated to cost $150 million by the American Marine Highway Dual-Use Vessel Design Project. They represent a good option for securing appropriate vessels if construction costs can be successfully amortized as fuel costs increase and Liquid Natural Gas (LNG) technology is adapted.
Revenue cargo: With international cargo as a base, augmented by domestic cargo, a Marine Highway service can potentially connect international gateway ports. More detailed market analysis should be completed to test the interests of line haul container operators and identify potentially viable domestic cargoes.
Marine terminal operations: A successful Marine Highway service operation is characterized as flexible, responsive, reliable, and economical.
2 https://www.marad.dot.gov/documents/AMH_Report_Final_Report_10282011_updated.pdf

West Coast Marine Highway Market Analysis
ES-vii
Drayage: Price competitiveness is determined by relative proximity to the port.
Management and financing: A strong management team with clear concept of service, competition, and customer requirements. Financing needs to be secured at a sufficient level to cover the critical start-up period, which may last longer than planned.
Potential for public policy cost savings: Taking the following steps would further increase the chance of success for economically advantageous Marine Highway services:
• Public port charges: Considerations of cost reductions, as in the M-580 corridor model, at least on a start-up basis; and
• HMT: Waive or reduce the tax for Marine Highway service domestic moves.
Recommendations include:
• Monitor the business and operational implementation of the M-580 Project. This service could represent a model for future Marine Highway services, or it may represent a more limited test case. Regardless, best practices should be documented from the M-580 Project.
• Conduct a follow up study of the potentially viable Marine Highway service identified in this study, with a special view to its acceptance by container line-haul carriers along with opportunities for domestic cargo. It will be worthwhile to approach that initiative along the lines of a private sector due diligence process. It may also be worthwhile to convene a working conference of targeted shippers and carriers to address the opportunities presented.
• Quantify objective measures that will allow comparison of all-in costs, including externalities, of a Marine Highway service.
West Coast Marine Highway Market Analysis
i
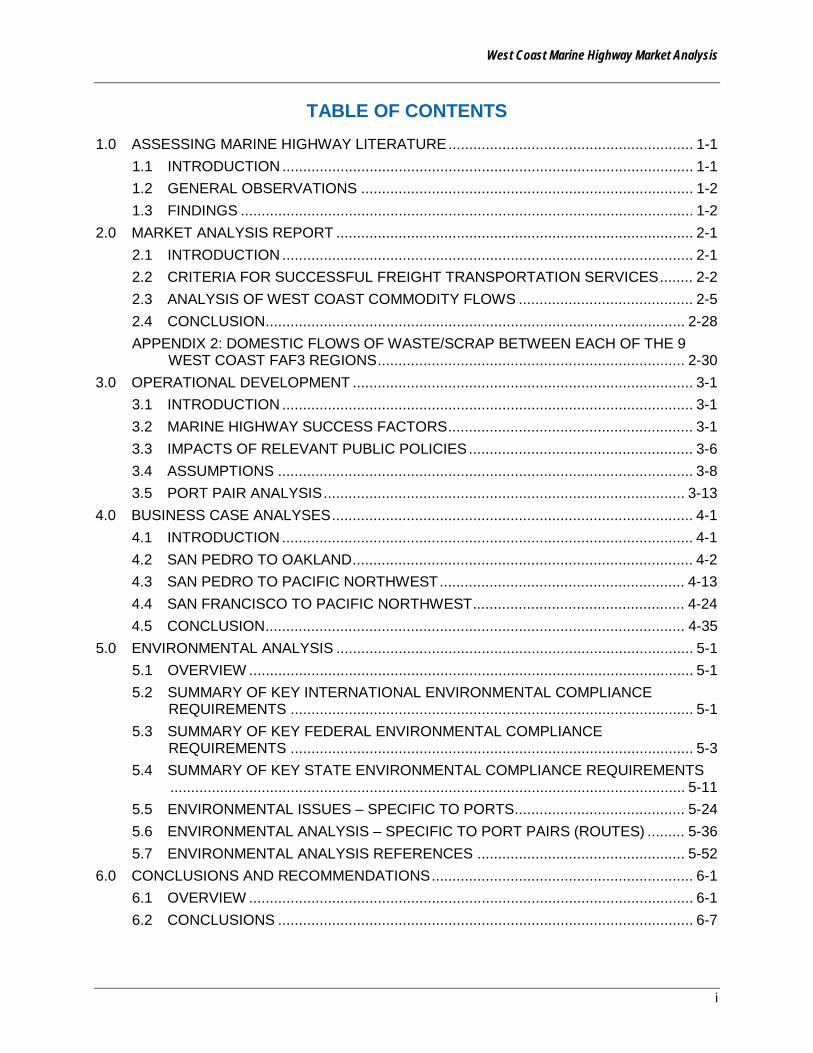
TABLE OF CONTENTS 1.0 ASSESSING MARINE HIGHWAY LITERATURE ........................................................... 1-1
1.1 INTRODUCTION ................................................................................................... 1-1 1.2 GENERAL OBSERVATIONS ................................................................................ 1-2 1.3 FINDINGS ............................................................................................................. 1-2
2.0 MARKET ANALYSIS REPORT ...................................................................................... 2-1 2.1 INTRODUCTION ................................................................................................... 2-1 2.2 CRITERIA FOR SUCCESSFUL FREIGHT TRANSPORTATION SERVICES ........ 2-2 2.3 ANALYSIS OF WEST COAST COMMODITY FLOWS .......................................... 2-5 2.4 CONCLUSION ..................................................................................................... 2-28 APPENDIX 2: DOMESTIC FLOWS OF WASTE/SCRAP BETWEEN EACH OF THE 9
WEST COAST FAF3 REGIONS .......................................................................... 2-30 3.0 OPERATIONAL DEVELOPMENT .................................................................................. 3-1
3.1 INTRODUCTION ................................................................................................... 3-1 3.2 MARINE HIGHWAY SUCCESS FACTORS ........................................................... 3-1 3.3 IMPACTS OF RELEVANT PUBLIC POLICIES ...................................................... 3-6 3.4 ASSUMPTIONS .................................................................................................... 3-8 3.5 PORT PAIR ANALYSIS ....................................................................................... 3-13
4.0 BUSINESS CASE ANALYSES ....................................................................................... 4-1 4.1 INTRODUCTION ................................................................................................... 4-1 4.2 SAN PEDRO TO OAKLAND .................................................................................. 4-2 4.3 SAN PEDRO TO PACIFIC NORTHWEST ........................................................... 4-13 4.4 SAN FRANCISCO TO PACIFIC NORTHWEST ................................................... 4-24 4.5 CONCLUSION ..................................................................................................... 4-35
5.0 ENVIRONMENTAL ANALYSIS ...................................................................................... 5-1 5.1 OVERVIEW ........................................................................................................... 5-1 5.2 SUMMARY OF KEY INTERNATIONAL ENVIRONMENTAL COMPLIANCE
REQUIREMENTS ................................................................................................. 5-1 5.3 SUMMARY OF KEY FEDERAL ENVIRONMENTAL COMPLIANCE
REQUIREMENTS ................................................................................................. 5-3 5.4 SUMMARY OF KEY STATE ENVIRONMENTAL COMPLIANCE REQUIREMENTS
............................................................................................................................ 5-11 5.5 ENVIRONMENTAL ISSUES – SPECIFIC TO PORTS ......................................... 5-24 5.6 ENVIRONMENTAL ANALYSIS – SPECIFIC TO PORT PAIRS (ROUTES) ......... 5-36 5.7 ENVIRONMENTAL ANALYSIS REFERENCES .................................................. 5-52
6.0 CONCLUSIONS AND RECOMMENDATIONS ............................................................... 6-1 6.1 OVERVIEW ........................................................................................................... 6-1 6.2 CONCLUSIONS .................................................................................................... 6-7

West Coast Marine Highway Market Analysis
ii
ATTACHMENT 1 ABBREVIATIONS AND ACRONYMS
ATTACHMENT 2 GLOSSARY
ATTACHMENT 3 LIBRARY
ATTACHMENT 4 INTERNATIONAL SERVICES APPENDIX
List of Tables
Table 2-1 Low Potential Product Groups - West Coast Domestic..................................... 2-8 Table 2-2 West Coast Waterborne Exports of Waste/Scrap in 2007 .............................. 2-11 Table 2-3 Commodity Codes for Waste/Scrap ............................................................... 2-11 Table 2-4 West Coast Domestic High Value Commodity Flows ..................................... 2-13 Table 2-5 Potential Marine highway Commodity Groups – West Coast Domestic .......... 2-13 Table 2-6 Freight Analysis Framework Region Flows .................................................... 2-16 Table 2-7 Domestic Flows between Large Coastal Regions and Long Distance ............ 2-17 Table 2-8 Los Angeles and Orange Counties’ Share of Los Angeles CSA Employment in
2009............................................................................................................... 2-21 Table 2-9 Domestic Commodity Flows – Thousands of Metric Tons in 2007 ................. 2-22 Table 2-10 International Import Commodity Flows – Thousands of Metric Tons in 2007 .. 2-23 Table 2-11 International Export Commodity Flows – Thousands of Metric Tons in 2007 .. 2-24 Table 2-12 Domestic flows of waste/scrap between each of the 9 West Coast FAF3 regions
...................................................................................................................... 2-30 Table 3-1 Ponce Class Fuel Consumption ..................................................................... 3-11 Table 3-2 Cost Factors .................................................................................................. 3-20 Table 3-3 Additional Costs ............................................................................................. 3-21 Table 3-4 San Pedro to San Francisco Schedule ........................................................... 3-24 Table 3-5 San Pedro to San Francisco Schedule ........................................................... 3-25 Table 3-6 Cost Factors .................................................................................................. 3-27 Table 3-7 Additional Costs ............................................................................................. 3-28 Table 3-8 San Pedro to Seattle Schedule ...................................................................... 3-31 Table 3-9 Cost Factors .................................................................................................. 3-33 Table 3-10 Additional Costs ............................................................................................. 3-34 Table 3-11 San Francisco to Pacific Northwest Schedule ................................................ 3-37 Table 3-12 Cost Factors .................................................................................................. 3-38 Table 3-13 Additional Costs ............................................................................................. 3-38 Table 3-14 Competing Surface Transportation Distances: ............................................... 3-41 Table 3-15 Time Underway to Complete Rotation ............................................................ 3-41 Table 3-16 San Pedro to Columbia River Schedule at 22 knots ....................................... 3-42 Table 3-17 Distribution Model .......................................................................................... 3-43
West Coast Marine Highway Market Analysis
iii
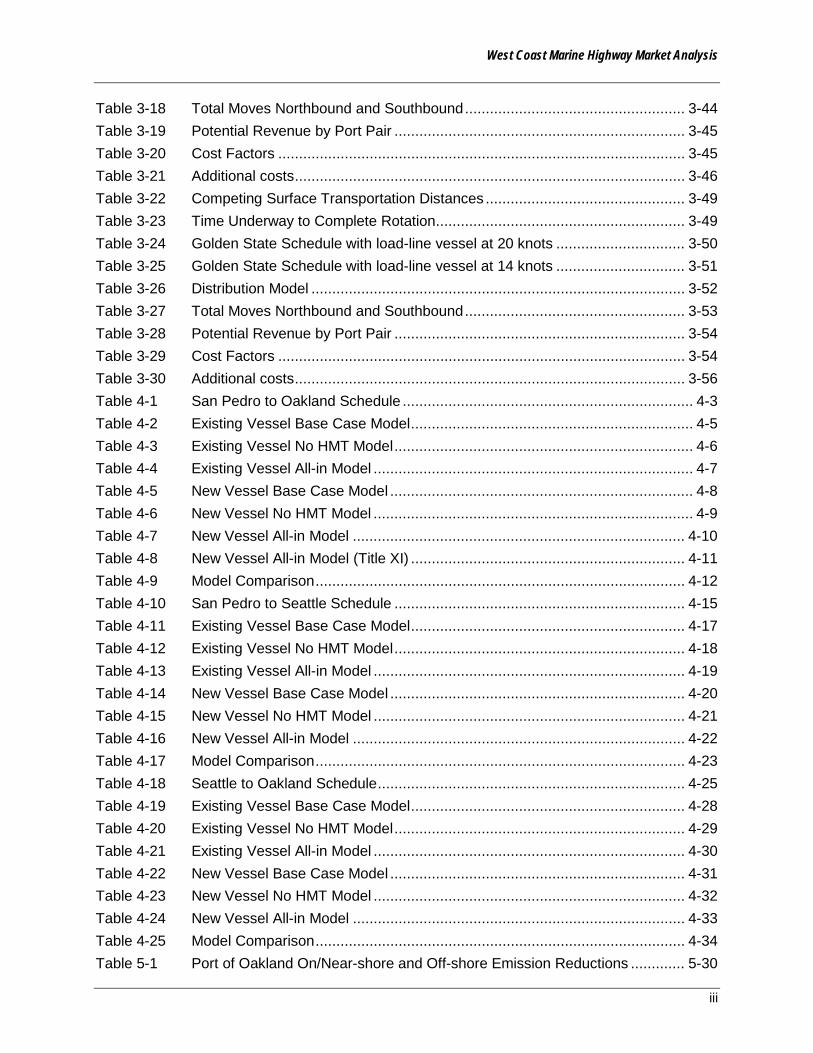
Table 3-18 Total Moves Northbound and Southbound ..................................................... 3-44 Table 3-19 Potential Revenue by Port Pair ...................................................................... 3-45 Table 3-20 Cost Factors .................................................................................................. 3-45 Table 3-21 Additional costs .............................................................................................. 3-46 Table 3-22 Competing Surface Transportation Distances ................................................ 3-49 Table 3-23 Time Underway to Complete Rotation ............................................................ 3-49 Table 3-24 Golden State Schedule with load-line vessel at 20 knots ............................... 3-50 Table 3-25 Golden State Schedule with load-line vessel at 14 knots ............................... 3-51 Table 3-26 Distribution Model .......................................................................................... 3-52 Table 3-27 Total Moves Northbound and Southbound ..................................................... 3-53 Table 3-28 Potential Revenue by Port Pair ...................................................................... 3-54 Table 3-29 Cost Factors .................................................................................................. 3-54 Table 3-30 Additional costs .............................................................................................. 3-56 Table 4-1 San Pedro to Oakland Schedule ...................................................................... 4-3 Table 4-2 Existing Vessel Base Case Model .................................................................... 4-5 Table 4-3 Existing Vessel No HMT Model ........................................................................ 4-6 Table 4-4 Existing Vessel All-in Model ............................................................................. 4-7 Table 4-5 New Vessel Base Case Model ......................................................................... 4-8 Table 4-6 New Vessel No HMT Model ............................................................................. 4-9 Table 4-7 New Vessel All-in Model ................................................................................ 4-10 Table 4-8 New Vessel All-in Model (Title XI) .................................................................. 4-11 Table 4-9 Model Comparison ......................................................................................... 4-12 Table 4-10 San Pedro to Seattle Schedule ...................................................................... 4-15 Table 4-11 Existing Vessel Base Case Model .................................................................. 4-17 Table 4-12 Existing Vessel No HMT Model ...................................................................... 4-18 Table 4-13 Existing Vessel All-in Model ........................................................................... 4-19 Table 4-14 New Vessel Base Case Model ....................................................................... 4-20 Table 4-15 New Vessel No HMT Model ........................................................................... 4-21 Table 4-16 New Vessel All-in Model ................................................................................ 4-22 Table 4-17 Model Comparison ......................................................................................... 4-23 Table 4-18 Seattle to Oakland Schedule .......................................................................... 4-25 Table 4-19 Existing Vessel Base Case Model .................................................................. 4-28 Table 4-20 Existing Vessel No HMT Model ...................................................................... 4-29 Table 4-21 Existing Vessel All-in Model ........................................................................... 4-30 Table 4-22 New Vessel Base Case Model ....................................................................... 4-31 Table 4-23 New Vessel No HMT Model ........................................................................... 4-32 Table 4-24 New Vessel All-in Model ................................................................................ 4-33 Table 4-25 Model Comparison ......................................................................................... 4-34 Table 5-1 Port of Oakland On/Near-shore and Off-shore Emission Reductions ............. 5-30
West Coast Marine Highway Market Analysis
iv
Table 5-2 2010 Progress and Initiatives for Ship-Based Operations .............................. 5-33 Table 5-3 2010 Progress and Initiatives for Ship-Based Operations .............................. 5-35 Table 5-4 Proposed Marine highway Summary of Environmental Issues ....................... 5-39
West Coast Marine Highway Market Analysis
v
List of Figures
Figure 2-1 FAF3 Geographic Zones ................................................................................ 2-14 Figure 2-2 Crop Receipts by County ............................................................................... 2-18 Figure 2-3 Non-metallic mineral mining and quarrying employment in California............. 2-19 Figure 2-4 Food Products Manufacturing Employment in Washington and Oregon ......... 2-20 Figure 2-5 Food Products Manufacturing Employment in California (NAICS 311) ........... 2-20 Figure 2-6 Los Angeles to San Francisco....................................................................... 2-25 Figure 2-7 Los Angeles to Pacific Northwest ................................................................... 2-25 Figure 2-8 San Francisco to Pacific Northwest ................................................................ 2-26 Figure 2-9 California Green Trade Corridor ..................................................................... 2-27 Figure 3-1 San Diego – San Pedro Bay .......................................................................... 3-16 Figure 3-2 San Pedro Basin ............................................................................................ 3-19 Figure 3-3 Port of San Diego........................................................................................... 3-20 Figure 3-4 San Pedro Bay – San Francisco Bay ............................................................. 3-22 Figure 3-5 Port of Oakland .............................................................................................. 3-26 Figure 3-6 Port of San Francisco .................................................................................... 3-26 Figure 3-7 San Pedro Bay – Pacific Northwest ............................................................... 3-29 Figure 3-8 Port of Seattle ................................................................................................ 3-32 Figure 3-9 Port of Tacoma .............................................................................................. 3-32 Figure 3-10 San Francisco Bay – Pacific Northwest .......................................................... 3-35 Figure 3-11 West Coast Hub-Feeder ................................................................................ 3-39 Figure 3-12 Golden State Marine highway ........................................................................ 3-47 Figure 5-1 International Maritime Organization Areas to be Avoided ............................... 5-37 Figure 5-2 San Diego to San Pedro Bay Route ............................................................... 5-41 Figure 5-3 San Pedro Bay to San Francisco Bay ............................................................ 5-43 Figure 5-4 San Pedro Bay to Pacific Northwest............................................................... 5-45 Figure 5-5 San Francisco Bay to Pacific Northwest ......................................................... 5-46
West Coast Marine Highway Market Analysis
Part 1 Assessing Marine Highway Literature
1-1
1.0 ASSESSING MARINE HIGHWAY LITERATURE
1.1 INTRODUCTION Part 1 of this “West Coast Marine Highway Market Analysis” is an assessment of the existing literature on the topic of Marine Highway services. In it, the following are specifically addressed:
• What steps were taken to address Part 1 tasks, and the general character of literature,
• Commonalities and differences among the key sources,
• Findings on impediments to Marine Highway services, externalities and benefits, the potential Marine Highway service market with a focus on the Pacific Coast, operational issues, and
• Success factors.
There were common observations and conclusions among the key sources examined and little in the way of contradiction and disagreement. Marine Highway service operations should provide reliable, cost competitive service that meets the frequency needs of a market accustomed to the convenience and flexibility that is the hallmark of the trucking. There are challenges to Marine Highway service development, some of which could be mitigated or resolved by addressing government policy. Perceptions are another challenge, with domestic marine transportation services sometimes being perceived as impractical and uncompetitive. Overcoming that perception, well-founded or not, is part of the challenge facing the purveyors of Marine Highway services. Lastly, the externalities and public benefits of marine transportation, such as the pros and cons from an environmental perspective, are seen as issues to acknowledge and address if Marine Highway services are to become a more common element in the U.S. intermodal transportation system.
1.1.1 Method
The study team conducted a search of the team’s resources as well as the internet for source material of potential value and application to this project. Nearly 200 documents and data sources were selected for review based on an extensive review of sources. Many of the sources are not specific to Pacific Coast coastal and inland shipping but are representative of the overall literature.
A spreadsheet was created (Library, Attachment 3), separating documents into four general categories:
• Reports, Studies, Papers (83 items),
• PowerPoint Presentations, Testimony, Data Sources (42 items),
• Program, Regulations (18 items), and
• Journals and Press (105 items).
The documents in the library were given a score representing a rough approximation of the value that the documents could provide for purposes of this project.
West Coast Marine Highway Market Analysis
Part 1 Assessing Marine Highway Literature
1-2
The most recent, representative and/or in other ways worthwhile sources were selected for further review in this chapter.
1.1.2 Document Types
Within the four categories are reports by and for public commissions and agencies; studies pertaining to specific regions; academic papers; state and metropolitan planning organizations transportation planning documents; market analysis for corridors; data pertaining to port infrastructure and freight flow; testimony before Congress; comments in the rulemaking process; industry forecasts; trade press articles; and, last, presentations gleaned from conferences, webcasts and meetings. The documents and information collected are, in many instances, freely available on the internet through links provided on the Library spreadsheet. However, some of the documents are no longer available through the World Wide Web and thus are provided along with this report in digital form and accessible through the West Coast Marine Highway (WCMH) website created for this project.
Most reports are on the topic of short sea shipping and marine highway services; others are on broader, related transportation subject that include sections or brief mentions of the topic. Some are focused on government policy and include recommendations as to policy changes that would address, directly or indirectly, short sea transportation issues. Some are documents that were prepared by companies or entrepreneurs with ambitions to start new marine highway services or, in the instance of the NASSCO shipyard in California, to build vessels for the coastwise trade.
Most documents captured on the Library spreadsheet were produced in the period from 2005 to 2012. While data employed in studies even just a few years ago can be less useful in deciphering today’s marketplace, by including those, this study has the flexibility to mine still pertinent information contained therein.
1.2 GENERAL OBSERVATIONS A first observation is that the findings in the selected documents are consistent with previously published market studies, trade interviews, and other papers that explore the operational issues. Studies that include an examination of public policy, benefits, and impacts associated with marine transportation and Marine Highway services development, in particular, tend to be in general agreement on those topics.
Second, there is a lack of publicly available freight flow data for purposes of identifying potential new Marine Highway service markets. Essential information on landside freight flows is inadequate for detailed market analysis.
Last, the European experience (e.g., “Marco Polo”, “Motorways of the Sea”) provides useful information on how government policies and programs might factor into developing U.S. domestic and, specifically, Pacific Coast services, even though the service geography is distinctly different.
1.3 FINDINGS Key documents identified in the literature review include 1) the corridor and project proposals submitted to the United States Maritime Administration (MARAD) and with which the West

West Coast Marine Highway Market Analysis
Part 1 Assessing Marine Highway Literature
1-3
Coast Corridor Coalition project management committee is well familiar, 2) various transportation studies and government sponsored data sources that have value in identifying freight flows and landside transportation conditions, and 3) studies and reports specific to Marine Highway services issues for the U.S. West Coast. These documents are:
• Corridor/Projects
o Golden State Marine Highway Project Application (Redwood City, et. al.),
o Blue Coast Intermodal plan (Humboldt Marine Logistics [HML]),
o California Green Trade Corridor documents (Port of Stockton, et. al.),
o Columbia/Snake/Willamette Corridor proposal (Pacific Northwest Waterways Association [PNWA]), and
o M-5 Corridor Proposal (West Coast Corridor Coalition [WCCC]).
• Transportation Studies
o WCCC Trade and Transportation Study (WCCC),
o San Diego and Imperial Valley Gateway Study (San Diego Association of Governments [SANDAG]), and
o Government Accountability Office’s Surface Freight Transportation comparison of modes and subsidization (GAO).
• Nine source documents were selected for this report. They fall into three sometimes overlapping categories, listed below: Market Discussion
o Four Corridors Case Studies of Short Sea Services (U.S. Department of Transportation [USDOT]),
o Feasibility Assessment of Short Sea Shipping to Service the Pacific Coast (Center for the Commercial Deployment of Transportation Technologies [CCDoTT]), and
o Cross Border Short Sea Shipping Study (IMTC).
• Operations Discussion
o Operational Development of Marine Highways to Serve the Pacific Coast (CCDoTT),
o North American Marine Highways (National Cooperative Freight Research Program [NCFRP] / Transportation Research Board [TRB]),
o Westar Transport Short Sea Shipping Vision (Westar), and
o Expanding Short Sea Shipping in California (Friends of the Earth [FOE]).
• Externalities and Benefits Discussion
o America’s Marine Highway Report to Congress, April 2011(USDOT),

West Coast Marine Highway Market Analysis
Part 1 Assessing Marine Highway Literature
1-4
o Short Sea Developments in Europe: Lessons for Canada (North American Transportation Competitiveness Research Council),
o North American Marine Highways (NCFRP/TRB) (2nd listing), and
o Expanding Short Sea Shipping in California (FOE) (2nd listing)
1.3.1 Similarities among Key Source Documents
1.3.1.1 Similarities: Challenges
While there are variations found as to some details, consensus is easily found as to challenges to the development of Marine Highway services.
Government Policy
Government policies may impact the cost of shipping freight on the United States’ national transportation system, including freight that will be shipped on Marine Highway services. Where appropriate, those predicted cost impacts are included in the market analysis found later in this study. Some policies, such as the Harbor Maintenance Tax (HMT),3 can lead to increased transportation costs for cargo owners when their imports and domestic cargoes are transported on water. The HMT is also notable because it is not assessed when freight is transported using landside modes, potentially putting water transportation at a disadvantage.
The government also sets rules and regulations governing the different freight transportation modes (including highways, railroads, and Marine Highways), and these regulations can impact the operational costs for the companies that are responsible for transporting freight on the U.S. national transportation system. For example, the U.S. marine transportation system has regulations designed to protect the economic wellbeing of the U.S. maritime sector and U.S. merchant mariners. Those regulations serve a vital national economic and security interest, and may impact the operational costs for Marine Highway services. These regulatory policies include Section 27 of the Merchant Marine Act of 1920 (known as the Jones Act),4 as well as the U.S. Coast Guard (USCG) vessel operating standards that are the same for both ocean-going and coastwise shipping.
3 The HMT is an ad valorem tax created by Congress in the Water Resources Development Act of 1986 (PL 99-662) and took effect in 1987. Its current level of 0.125% of cargo value was set in 1991. At this time, most HMT receipts from domestic cargo are collected on bulk commodities (e.g., petroleum). In fiscal year 2009, HMT collections on all domestic cargo amounted to 8% of total HMT receipts. The size of the HMT paid by a shipper is determined by the value of the freight. For example, a container with $100,000 in cargo would have an additional $125.00 in transportation costs directly charged to the cargo owner. Payment of the HMT in the instance of domestic moves is made quarterly by the cargo owner. Imported cargo when transshipped to a second vessel pays first on the import move and a second time on the domestic move. The HMT generally is considered a disincentive to use of Marine Highway Service although the degree to which it is a discouragement presumably varies depending on the cargo, the price sensitivity of that cargo, and the magnitude of the charge. 4 The U.S. Merchant Marine Act of 1920 places four requirements on vessels carrying U.S. domestic cargoes. These are that 1) the vessels must be owned by U.S. companies that are controlled by U.S. citizens with at least 75 percent U.S. ownership; 2) at least 75 percent crewed by U.S. citizens; 3) built (or rebuilt) in the United States; and 4) registered in the United States.
West Coast Marine Highway Market Analysis
Part 1 Assessing Marine Highway Literature
1-5
Operational Elements
Operational elements also impact the costs and ultimate success of companies seeking to establish Marine Highway services. Six operational elements are taken into account for the purpose of this study.
First, Beneficial Cargo Owners (BCO) are more apt to utilize a regularly scheduled service that meets the delivery frequency needs of their customer base. Frequency of service ranks high as a factor considered by potential users. The operator's financial resources are considerations in decisions as to availability of equipment and level of service. For example, daily service is often mentioned as a required service factor in providing a viable and competitive option for shippers and motor carriers. There are instances noted where vessel operators were not able to improve upon their once or twice weekly services due to lack of equipment or operating capital and so were unable to respond to known customer and market demands.
Second, while not often mentioned as a ranking problem faced by start-ups, the availability of port infrastructure and equipment is noted in some of the key source reports. Smaller ports, in particular, may require new cranes or structures in order to start to serve roll on/roll off (Ro/Ro) or lift on/lift off (Lo/Lo) domestic shipping. Worth noting, smaller ports can be attractive for the handling of domestic freight away from the larger and busier international ports.
The third element is the ability to secure proper capital equipment (i.e., vessels) for the Marine Highway service. The need for the right size and type of vessel for a particular market is an important indicator of ultimate success for a new service. For example, a Ro/Ro vessel may be more suitable for a domestic freight market oriented to trucking, and a 4,000 TEU container ship may have far more capacity, and burn more fuel, than is desired for a start-up service in a still developing market. Vessels used for domestic freight movements must be built in a United States shipyard,5 so addressing this need in a way that facilitates an increase in Marine Highway services will likely necessitate the construction of new vessels in U.S. shipyards.
The study team identified few eligible vessels that have Ro/Ro, Lo/Lo, or combination capability, and those vessels were not built with Marine Highway service needs in mind. Other than one Ro/Ro vessel currently contracted by the Pasha Group, no new builds were identified that would be available to support a Marine Highway service.
While there are deck barges and tugs available for use in U.S. coastal shipping, there are no known ATBs that are available for Ro/Ro, Lo/Lo, or combination deployment. Existing ATBs would require modification to fill the roles contemplated.
Building new vessels seems to provide the best long-term opportunity to acquire vessels that meet the needs of potential Marine Highway services. However, given the cost of vessel construction and the lead time necessary to build new vessels, it would appear that some level of public construction or financial assistance will be necessary if private sector interests are going to consider new vessel assets, whether load line or ATB, for Marine Highway application. To further explore opportunities for building vessels more suited to Marine Highway services, the Maritime Administration has commissioned an AMH Design Project (October 2011) that will
5 Merchant Marine Act of 1920 Section 27 (P.L. 66-261) 46 USC 551
West Coast Marine Highway Market Analysis
Part 1 Assessing Marine Highway Literature
1-6
explore the options for building new dual-use U.S. build vessels, with potential funding at least in part from the DoD.
Financing construction of new vessels can also be a challenge for start-up service providers. Because of risk of financing maritime assets that often have relatively long-term amortization periods (30 years or longer), it can be difficult to secure affordable financing for the construction of new vessels. The U.S. government created the Title XI loan guarantee program to help address the risks inherent to financing marine vessels, but the documents reviewed for this study suggest that Title XI loan guarantees are considered out of reach for start-ups in the Marine Highway services sector. While the need for stringent financial requirements to ensure that debtors can afford to repay their Title XI guaranteed loans is understandable, those requirements might put the loan guarantees out of reach for all but established vessel operators or other well financed companies. One source (North American Marine Highways - NCFRP #5), suggests that changes may make Title XI "more conducive" to Marine Highway services.
The fourth operational element is the difference in port costs for intermodal cargoes. While cargoes being transferred from a containership to a trucking or railroad service are charged once for crane operations, cargoes being transferred to a Marine Highway service vessel are charged twice. This puts the Marine Highway services at a cost disadvantage to the other modes.
The fifth operational element is “logistics inertia.” While shippers’ supply chains are constantly adjusting to reflect changes in the marketplace, technology and economics, satisfaction with existing practices by those who control the freight can be difficult to overcome. Getting shippers, carriers, or third party logistics providers (3PLs) to commit freight to a new operator in a new service is a challenge, especially if there is low familiarity or even skepticism with the domestic marine mode, which leads to the next impediment of perception.
Some shippers and transportation carriers have reported having a negative view of shipping domestic cargoes on coastal or inland waterway services. For example, the Short Sea Shipping Port Probability Study report of 2005 prepared for Port Canaveral and MARAD reported the perception that these marine services are slow and/or unreliable. These services also need to demonstrate their cost competitiveness, and until they do, decision-makers in goods movement, even persons in the maritime sector, might voice skepticism as to the potential for vessels carrying everyday freight in the domestic trade.
The last element, as much market oriented as operational, to starting new Marine Highway service is inadequate trade flow data needed to help define the market. It particularly is an obstacle to the development of services in markets that are yet undefined because there is not an existing marine transportation service.
1.3.1.2 Similarities: Externalities and Benefits
Among the source documents reviewed for information on Externalities and Benefits, there was broad agreement on the public benefits and costs of marine transportation. Those costs and benefits are reflected in the positive arguments offered in favor of Marine Highway service development as well as arguments—if not against Marine Highway service development—in favor of taking early measures to address associated environmental impacts.
West Coast Marine Highway Market Analysis
Part 1 Assessing Marine Highway Literature
1-7
The first cost is vessels and related port and drayage equipment air emissions, and these are being addressed at the IMO, national, and local levels through engine standards and fuel requirements. This cost is principally associated with ocean going vessels calling at international cargo terminals, both because of the sheer number of vessels calling at those terminals and the sulfur content of fuels burned in the past. These vessels and ports have been the focus of attention by communities, environmental agencies and organizations, and increasingly by the industry which seeks to improve relations in the public sector and adopt operational changes that improve the bottom line. The identification of environmental externalities is very familiar to the port/maritime sector on the Pacific Coast where some of the most aggressive measures have been initiated to mitigate these environmental effects.
Second, and related to the emissions issue above, is the call for environmental analysis of Marine Highway services. MARAD is currently performing a programmatic environmental assessment based on the standards set out in the National Environmental Policy Act (NEPA). Organizations including the Friends of the Earth (FOE), filed public comments in the American Marine Highway’s rulemaking (Docket No. MARAD-2008-0096), saying that “MARAD must first analyze environmental impact related to increased short sea shipping traffic and propose alternatives and mitigation strategies as mandated by the National Environmental Protection Act (NEPA) and the Ecological Society of America, as well as comply with applicable obligations under the Clean Air Act (CAA) and state laws.” The FOE filing also notes, as if to clarify that the call for environmental impact analysis is not to suggest general opposition to the development of Marine Highway services, this “is not to say that the Marine Highway program should be scuttled out of hand, but to elucidate that substantial environmental scrutiny is warranted.” 6
Third, and building on the preceding point, environmental groups have acknowledged the potential and actual public benefits of the marine mode. They emphasize and urge, as is found most recently in the FOE paper “Expanding Short Sea Shipping in California,” the adoption of clean technologies and fuels, and less impactful operational practices while in transit and in port. Two documents identified in the source library for this study indicate strong interest on the part of the Environmental Defense Fund organization in the development of Marine Highway Services on the part of, “America’s Deep Blue Highway” (2008) which was endorsed by Environmental Defense Fund (EDF) President, Fred Krupp makes a strong case for the adoption of cleaner fuels. The EDF related publication, “The Good Haul,” highlights specific Marine Highway projects and plans among exemplary developments in goods movement.
Fourth, the source documents reference the efficient carrying capacity of ships and barges and the relative advantage, measured on a tonnage basis, of marine transportation over the land modes as regards fuel consumption and emissions.
Among the source documents, reference was also found to marine transportation as a suitable alternative to the use of freight rail in routing hazardous materials i.e., away from population centers, and taking heavy cargo off public roads. One can find cost-saving calculations in documents, such as Marine Highway project proposals that were submitted to USDOT, about the uncompensated wear on roads by trucking and how marine routes can provide public benefit in avoided highway maintenance.
6 On February 24, 2012, MARAD's Office of Environment initiated a programmatic environmental assessment for the Program with a call for participation in public scoping meetings in locations around the country. A report will be issued in FY 2013.

West Coast Marine Highway Market Analysis
Part 1 Assessing Marine Highway Literature
1-8
Another oft-mentioned benefit is the relative open capacity of marine lanes contrasted with the reduced capacity of congested highways and land corridors. That is mentioned along with calculations that, in general, Marine Highway service can provide capacity that is less costly than the construction of new road lanes. The comparative costs and capacity of new Marine Highway service and new interstate highway lanes deserve study to better assess the potential public benefit.
Finally, the documents mention benefit calculators, such as that used in Europe for evaluating projects for European Union (EU) program support through Marco Polo. The U.S. Environmental Protection Agency’s (USEPA) Smartway is one example of a U.S. benefits calculation program. Such calculations can be necessary in determining public benefits of transportation projects, especially at a time when quantitative measures are coming into greater use to support government decision-making.
1.3.1.3 Similarities: Markets and Operations
There also are common elements among key source documents when examining the business basics of operations and what is known and perceived about the market for Marine Highway services.
The cost of services is the foremost consideration when evaluating the potential viability of Marine Highway services in a market already served by truck or railroad. A Marine Highway service corridor between two port pairs will likely require an additional stevedoring operation that will add time and expense. Moreover, several studies indicate that Marine Highway services may have to do better (by as much as 10 percent in one study) than simply matching truck rates in order to compensate for one or more days of additional transit time on the water.
Already mentioned in this report (Section 1.3.1.1) is frequency of service as a factor almost universally identified as a high ranking consideration when developing and marketing a Marine Highway service. The exceptions are the low value commodities that are not time-sensitive.
A third element is service reliability. It is among the most frequently mentioned in the sources, underscoring the value of service schedules and reliability to goods movement logistics. Predictability and observing scheduled arrivals and departures, according to sources, is important to attract and retain customers accustomed to motor carrier operations. It also can help overcome the view of some that domestic marine operations, in particular coastal barging, are especially susceptible to bad weather conditions.
Next, the study team found some common references to the Northern California / Southern California (NoCA/SoCA) corridor, e.g., Oakland/Los Angeles, where freight flows are characterized by their high volume. The sources observe that intra-California regional pairing thus warrants consideration for its potential as a Marine Highway services market. One source suggested that the volume in that corridor is sufficient to justify large ships with multiple daily sailings, but then later concludes that truck rates are were not sufficiently high at that time to make next day marine service cost competitive.
Fifth, some source studies tend to agree that the longer distance between origin and destination, such as Southern California and the Pacific Northwest (PNW), while not as high in
West Coast Marine Highway Market Analysis
Part 1 Assessing Marine Highway Literature
1-9
freight volume, show more potential for Marine Highway service development, especially if the cargo is not time-sensitive.
The distance between the port and the cargoes’ origin or destination is also an important issue. The dray distance—which is to say between the cargo origin or destination, and the port—should be fairly short. Seventy-five miles was a suggested maximum distance limit, and in this report, a distance of 25-35 miles was assumed to be optimal. Low margin and heavy commodities consistently are considered by source reports as a principal market for marine transportation. That is especially the case, as one source noted, where rail is not a competitive option.
More than one report suggested that a door-to-door marine highway service integrated with trucking would be a more marketable operation. One source suggests that a large trucking company with broad geographic scope would be a good partner as it would have equipment available in multiple locations.
On the question of ramp versus lift cargo loading there appears to be general agreement that Ro/Ro is better suited for marine highway service, especially as regards the movement of domestic goods, which likely would not be shipped in containers. However that is not to suggest Lo/Lo operations would not work in some instances. Indeed, some of the USDOT designated marine highway projects make the case for the Lo/Lo model.
Last is the matter of vessel standardization. At least two of the sources, and others the study team are familiar with, have suggested the need for models or standards for marine highway service vessels for the American market. That is driven by the sense, as mentioned earlier, that vessels should be suited for the market. Importantly, it also would mean an improvement in United States shipyard productivity with the construction of identical vessels, resulting in a lowering of vessel costs to marine highway service operators.
1.3.1.4 Success Factors
There are several success factors listed in the source documents. Finding and serving what might be called a natural market can make for a successful venture. As noted above, marine transportation is an established mode for low margin and heavy cargo, particularly bulk commodities, because vessel operators can offer competitive, highly efficient service to a generally non-time-sensitive market. Identifying an underserved niche market, such as where rail infrastructure and service isn’t available to satisfy shippers' needs, can be the foundation for a new Marine Highway service.
As referenced earlier, an important factor influencing the success of a Marine Highway service is possession of vessel(s) tuned to the market being served (or plans to serve). The vessel—a capital investment—is well sized to the potential cargo volumes, which often means a vessel of a smaller size. One source concluded: better to start small, and then grow.
Multiple sources suggest that door-to-door service is required as opposed to port-to-port operations that do not incorporate into the service the land moves to and from the port. Integrating operations with the other modes—trucking in most instances—is a strong selling point and an important factor in building a customer base. A vessel operator that is corporately integrated with trucking—and thus is a single, multimodal company—is considered ideal.

West Coast Marine Highway Market Analysis
Part 1 Assessing Marine Highway Literature
1-10
Sources have noted successful operators in Europe and other parts of the world where the short sea trade is an accepted practice; suitable vessels are in good supply, and charter vessels are used to match the market's requirements. When employing charters, the operator is not hampered by the financial burden of vessels built for the operator to serve a market that is subject to change. (One source notes that time-charters have a downside in that a suitable replacement vessel may not be available at the expiration of a charter. That can make for a service disruption).
Last, the European continent is an example of a thriving short sea market and successful services. There are many feeder and domestic marine service operations. (Sometimes “domestic” is defined to include two countries). The geography of that part of the world is considered conducive to freight and passenger use of marine transport. Suitable vessels are more widely available, and charter vessels are used to match the market's requirements. It is not exactly replicable in the United States to the extent the study team developed its own approach to logistics, but in the European experience some lessons might be learned. The study team notes that a USDOT designated America’s Marine Highways project plans to apply the European feeder model on the Atlantic and Gulf coasts. A USDOT funded Marine Highway study, conducted by George Mason University and concluded in 2011, examined technological practices in Europe for possible application here. One such example is an EU sponsored marine transport promotion center to match operators with potential customers. Finally, one of the sources suggests that while government support such as through the EU Marco Polo program, is not a guarantee of success, it has helped the start and testing of new services, which can lead to successful operations.
Government Policy
There is agreement among source reports as to the types of policy initiatives and issues that would or could successfully address Marine Highway service development needs. Government policy recommendations or policy areas having a bearing on marine highway service activity that are commonly referenced in source documents include:
• Exempting cargo, sometimes specifically defined as intermodal or non-bulk, from the Harbor Maintenance Tax is the most prominent recommendation.
• Providing shipper incentives, such as tax credits, is seen by sources as a way to jump-start interest in marine highway services.
• Funding infrastructure grants to address terminal facility requirements has been shown to be a need evident in applications for USDOT discretionary grants.
• Improving vessel financing, including adjustments to Title XI requirements, investment tax credits, and carbon credits could help operators and start-ups afford the large capital requirements for vessel construction or reconstruction.
• Developing and supporting vessel technology improvements to achieve greater efficiency and lower environmental impact is sometimes mentioned.
• Addressing externalities in taxing, as in a carbon tax, has been mentioned here as it is discussed in other countries.
West Coast Marine Highway Market Analysis
Part 1 Assessing Marine Highway Literature
1-11
Harbor Maintenance Tax
Regionally based differences have been seen in proposals to exempt marine highway cargoes from the HMT. Legislative proposals for the cargo exemption have been proposed to apply between United States ports, but they also have included cargo movements between Canada and the United States on the Great Lakes/St. Lawrence Seaway System, effectively exempting Canada exports to United States ports in that region. A variation on that recommendation has included legislation to exempt shipments from Nova Scotia.
Shipper Incentives
Incentives for shippers were mentioned in several source documents. Such incentives could take various forms, including tax credits given to the shippers or to the service providers themselves.
1.3.1.5 Drawing Conclusions
The following conclusions were drawn based on the literature review.
1. The existence of high flow volumes of freight and commodities is only the starting point in determining whether a market for marine highway exists and whether marine highway services can be competitive and address a supply chain need.
2. There are Pacific Coast markets that appear promising and warrant study and analysis.
3. The need for right sized, right type Marine Highway service-eligible vessels presents a challenge to new coastwise services that might find it difficult to afford new vessels suited to the target market.
4. New Marine Highway vessels should be built to be competitive in the market place, to be able to meet future environmental restrictions on coastal marine operations.
5. Short sea policy in Europe exists “in a more holistic manner” than it is found in North America. It is an established system of feeder and domestic services between neighboring nations and within national coastal and inland waters constitutes an aspect of a multimodal policy through national and European Union program and regulatory measures.
6. Last, while commercial marine operations are by definition in the domain of the private sector, government policy can affect Marine Highway service development by addressing impediments.

West Coast Marine Highway Market Analysis
Part 2 Market Analysis
2-1
2.0 MARKET ANALYSIS REPORT
2.1 INTRODUCTION A viable M-5 Marine Highway service requires two principal interrelated factors:
• Services that are economically and operationally attractive
• Potential product volumes that are attainable in the marketplace
For most successful freight transportation services, viability needs to be looked at from both the shippers’ perspectives and the operators’ perspectives. A marine highway service is no different and should be operationally and economically viable. As a new service, it may also need to meet the tests not only of customer acceptance, but also of public acceptance and environmental regulatory approval.
For services to be attractive to a shipper, they should offer an economic advantage through lower per unit transportation costs or in service improvements (e.g., reliability and transit time). The gross transportation costs depend, in turn, on terminal, vessel and other operating costs. However, the per unit costs will depend on the overall vessel utilization rates, or in other words, the cargo volumes carried on the overall service in both directions. This is also known as “density”, and it is an import measure of the service’s economic efficiency.
Transportation costs should be considered relative to product value and transit times, taking into account the value of inventory and other time sensitive factors. Related to the importance of time is frequency of service, which translates into both transit times and shippers’ perception of convenience and reliability. For the operator, frequency of service directly relates to volume (in both directions). Higher volumes reduce the per unit overhead and operating costs, increasing the chances that the freight rate paid by the shippers will fully cover all operating costs.
A successful Marine Highway service will need to attract both cargo (shippers) and transportation providers (carriers). Critical commercial parameters consist of the following factors.
• Density – the amount of cargo transported in a single move.
• Frequency – the number of times a transport move is made (daily, weekly, and biweekly).
• Reliability – The ability to predict, on a consistent basis, the movement of cargo. This factor includes arrival, departure, time in transit, costs, security, and overall customer confidence in the move.
• Balance – the ability to have revenue moves in both directions (elimination or reduction of deadheading or empty non-revenue moves).
Product Volumes
Services

West Coast Marine Highway Market Analysis
Part 2 Market Analysis
2-2
• Revenue/Cost – for a carrier/operator, revenue that creates a profit; for the shipper costs of transportation that maintains the economics of the pricing model for the commodity moved.
The required mix of these service parameters will vary based upon the perspective of the analysis. For example, the beneficial cargo owner (BCO or shipper) would likely focus on cost, reliability, transit time, and frequency. Vessel owner/operators (carriers) would likely say that the key parameters are rates (revenues), volume, and cost of operations, which are based primarily on density and balanced flows. These parameters will also vary in nature and scope depending on the type of cargo and whether the trade flows are domestic or international (or a combination of both).
The following discussion shows how these critical commercial parameters would be applied for international and domestic cargoes, as well as for the various operational characteristics of each type of service. The balance of the Market Analysis section (Part 2) will address the identification, nature, and scope of freight flows between and among the federal Commodity Flow Survey/Freight Analysis Framework (FAF3) regions in the study area. Based on the market analysis, this report identifies potential Marine Highway service corridors by “port pairings” along with prospective commodities and volumes. The next section (Operational Development, Part 3) will evaluate transportation economic and logistics issues involved with the prospective Marine Highway services emerging from the market analysis, including the Marine Highway service segments identified in the request for proposal (RFP). These two Parts set up the discussion of Part 4, in which a business case analysis is developed for identified, viable, prospective Marine Highway service corridors.
2.2 CRITERIA FOR SUCCESSFUL FREIGHT TRANSPORTATION SERVICES The clear understanding and valuation of service criteria is critical to both beneficial cargo owners and carriers (rail, trucking, drayage, and water) as they will determine the viability of a domestic Marine Highway service.
For a service to be viable for a carrier, revenues (based on rates), volume, density and balanced flows (which determine costs) are all important. Density is the amount of cargo moved in a single or unit load or the “utilization” factor for any given move. Volume equates to density times frequency and can be annualized or "seasonal”. Balanced flow is the ability to deliver a load and within the same round trip, bring back a revenue load (no empty trips, also called deadheading). Specialty cargoes (such as garbage) with relatively unique transport controls may not have the same issue with balanced flow, because the carrier will factor the non-revenue return trip into its rate structure.
BCO or shipper routing decisions tend to prioritize transportation cost, service reliability, frequency of service, and transit time. With higher valued cargoes, transit time and reliability tend to become more important than transportation cost. BCOs will not tolerate long dwell times (inventory carrying costs) for high valued inventory that must be delivered and available on the shelf for purchase. In the case of high valued cargos, frequency of service is the second key factor (behind reliability and transit time). The BCO’s interest in volume, density, and balanced flow are only of concern as they relate to the commercial viability of the carrier and the long-term reliability of the service.
West Coast Marine Highway Market Analysis
Part 2 Market Analysis
2-3
While there is overlap in the essential elements of domestic and international freight transportation, there are sufficient differences in the nature of the move to warrant a separate discussion on each. In addition, while the regulatory environment of domestic trade differs from international trade, the reach of public policy can fundamentally affects the competitiveness of any prospective Marine Highway service by influencing transportation costs.
2.2.1 Domestic Freight Moves
Cargo type is the first fundamental factor influencing the viability of a proposed Marine Highway service. The cargo type will not only determine the type and operating characteristics of the vessel, but also the physical infrastructure and equipment required at the marine terminal and for the inland distribution network. The cargo type will also influence the potential for efficient blending of domestic and international cargo moves in terms of density, balanced flow, and frequency. Based on the above parameters and cargo types, each potential Marine Highway corridor will be identified and analyzed in terms of viability. For this study, the following cargo categories have been identified for domestic freight movements:
• Containers and cargoes that can be containerized (both dry and reefer),
• Breakbulk and neobulk,
• Ro/Ro (e.g., trailers),
• Bulk commodities (liquid or dry),
• Project cargoes (oversize and/or heavy), and
• Specialty (e.g., waste/scrap including garbage).
Cargoes not currently moving in containers, (e.g., bulk, project, specialty, breakbulk, and neobulk) are included in the analysis because of their potential to be containerized and the interest of the study team to be as inclusive as possible in identifying potential Marine Highway cargoes.
In the study’s section on Operational Development (Part 3), specific operational parameters will be discussed in detail. However, understanding the operational logistics will directly lead to a better understanding of the commodity types available for a viable Marine Highway service. In general for a domestic Marine Highway service—United States port to United States port—the move would involve the following:
• Drayage from a pick-up point. The pick-up point could be a warehouse, a distribution or transload facility or a rail or truck yard/terminal. The dray would then take the cargo to the Marine Highway terminal at the originating port. This point is crucial to the viability of a Marine Highway service. A lengthy dray or a dray routing that adds to the cost, time-in-transit, or reliability of the service lessens the competiveness and resulting attractiveness of a Marine Highway service. Consequently, cargoes that originate or are destined to locations near Marine Highway terminals will represent better targets for more detailed marketing analysis.

West Coast Marine Highway Market Analysis
Part 2 Market Analysis
2-4
• Marine highway terminal operations would include all aspects of receiving the cargo, storing and loading it onto the Marine Highway vessel. For domestic cargo, customs and other security related (except for theft security) issues are not a major factor. The vessel then departs for the destination port and the associated Marine Highway terminal.
• Vessel operations would be determined by cargo type and related vessel type in accordance with operating rules and regulations, including environmental regulations for operating on international and inland waterways.
Upon arrival at the destination port, the Marine Highway terminal operation would include the receipt and processing of the cargo for inland delivery, including arranging for and coordinating cargo pick-up and delivery. The inland delivery would be by dray to a drop-off point. For this study, the team assumed that delivery could be made directly to a store or final distribution storage location as listed in the pick-up options above. The critical components of this activity are the same for the pick-up activity—length of dray, efficiency of marine terminal operations and the type of cargo.
2.2.2 International Cargo Moves
For international cargo, the core service parameters are similar to domestic cargo moves (since the Marine Highway portion of the cargo movement would be domestic, by definition), but additional factors come into play. The direction of the cargo flow (import or export) adds some degree of complexity and cost to international freight flow when compared to domestic moves.
A detailed discussion of the effects of these the various cost and operational elements for domestic and international moves are included in both Part 3 (Operations) and Part 4 (Business Analysis) discussions.
Volume, density, and balanced flow remain critical factors for the vessel operator to consider. In addition, where the Marine Highway service can serve as a substituted service for part of an ocean carrier’s routing strategy, the opportunity exists for the international carrier to more efficiently utilize its existing assets. For example, Matson Steamship Company’s (Matson) service from 1995 to 2001 found success for some time by relying on the partnership with a foreign carrier providing all-water service to and from Europe by serving the trade lanes north of San Pedro Bay. Through such a partnership the ocean carrier could optimize vessel deployment and reduce steaming time (by up to a week) by removing the need for the ocean carrier’s vessel to steam north of Los Angeles.
For a Marine Highway service providing this type of feeder service, volume, density, and balance are identical to the factors discussed as part of the domestic service. Coordination with the ocean carrier is also essential.
Cargo type continues to play an important role in the determination of success factors, especially where the ocean vessel requirements, including terminal loading/unloading operations are concerned. The core cargo types investigated for international freight flows overlap domestic cargo types with the understanding that in subsequent tasks, the international aspects of each criteria will come into play:
• Container,
West Coast Marine Highway Market Analysis
Part 2 Market Analysis
2-5
• Neo and Break bulk,
• Ro/Ro,
• Bulk commodities,
• Project cargo (oversize and heavy), and
• Specialty (e.g., waste/scrap).
The Marine Highway service’s interface with international cargo starts at the inbound port with the discharge of Marine Highway cargo at the international marine terminal. All aspects of marine terminal operations for the movement of international cargo, including Customs clearance and security compliance, take place at the international terminal. This study operates on the assumption that the Marine Highway carrier would not call on every international marine terminal within the inbound port. The direct transfer of cargo from ship to Marine Highway vessel is assumed not to occur because of operational inefficiencies.
Moving containers from the arriving international terminal to the Marine Highway terminal may involve an intra-harbor transfer that will most likely be done by a drayage company, but could also be accomplished using a yard hostler and chassis on port controlled roads. This container move is similar to current international rail cargo operations in which cargo moves in-bond to the inland rail destination. Typically, the inland rail clearance point is a large intermodal yard (e.g., Chicago or Kansas City) with robust Customs clearance and inspection capabilities. The Marine Highway system will need assured capability to handle Customs and security requirements at all destination points, including smaller ports where they may serve as the destination port.
The terminal operations at the originating port's Marine Highway terminal would be no different than that described for the domestic move. Transit to the destination port would then occur based upon cargo and vessel types as previously discussed. However, the vessel will need to be able to handle both domestic trailers and international (intermodal) containers and other cargoes. Terminal operations will play an important role in determining the vessel type (for example, use of a gantry crane versus a mobile harbor crane versus Ro/Ro operations). Arrival at the destination port for the Marine Highway service is identical to the process described above for the domestic cargo. However, mixing international and domestic traffic, while increasing the density, balance and frequency factors, may bring in the additional complexity of Customs clearance and other governmental agencies involved in international commerce. Cargo segregation as well as labor work rules will also need to be considered and new procedures created as part of any Marine Highway service.
Terminal operations and the local dray would be identical to the domestic move for out-gate processing. For export cargo, the process is reversed as described earlier in this section.
2.3 ANALYSIS OF WEST COAST COMMODITY FLOWS This section comprises the main focus of the market analysis and is broken down into the following discussions:
• Type of product and modes,

West Coast Marine Highway Market Analysis
Part 2 Market Analysis
2-6
• Product value as a relevant factor,
• Geographic dimensions including origins and destinations, and
• High potential commodity flow corridors.
2.3.1 Overview of Data Availability, Accuracy and Comprehensiveness
Published data sources used in this study include:
• Federal Highway Administration (FHWA) FAF3 commodity flow data http://www.ops.fhwa.dot.gov/freight/freight_analysis/faf/
• United States Census Foreign Trade Division trade data http://www.census.gov/foreign-trade/data/index.html
• United States Census County Business Patterns http://www.census.gov/econ/cbp/index.html
• USBEA regional economic data http://www.bea.gov/regional/index.htm
2.3.1.1 Freight Analysis Framework
Commodity flows between regions are based on FHWA FAF3 data released in January 2011. Data includes value and tons for 42 commodity groups and modes of transportation. These freight flow estimates are based on a variety of information sources including the United States 2007 Commodity Flow Survey and International trade data from the United States Census Foreign Trade Division. For regional flows of international trade it also incorporates information from PIERS the Journal of Commerce’s commercially available data system, combined with rail movement data from Rail Inc. A variety of other data sources supplement these primary sources. Documentation for the FAF3 is available at: http://www.ops.fhwa.dot.gov/freight/freight_analysis/faf/.
FAF3 data include flows of value and tonnage between 123 domestic regions including 74 metropolitan areas, 33 state remainders (where detail is available for a state’s metropolitan areas) and 16 individual states where metropolitan detail is not provided. International goods flows are broken out separately, where detail includes eight foreign trade regions.
FAF3 commodity groups, modes, and regional definitions are discussed in more depth in later sections.
2.3.1.2 United States Census Trade Data
United States trade data includes detail for thousands of commodity groups by country and port. It includes value and weight data and modal detail. Waterborne data is includes a breakdown of containerized versus non-containerized value and tonnage. This information is used to supplement the FAF3 information by providing an indicator of product detail and whether or not the commodity is containerized.
West Coast Marine Highway Market Analysis
Part 2 Market Analysis
2-7
2.3.1.3 County Business Patterns and United States Bureau of Economic Analysis Regional Economic Data
This information provides a useful indicator for the location of product origins or destinations where the FAF3 regions are quite large, especially the Los Angeles Consolidated Statistical Area (CSA) which includes Riverside and San Bernardino Counties.
2.3.1.4 Alternative Data Sources for More Detailed Commodity Flow Analysis
In some limited cases, where Marine Highway operations may be viable from an economic perspective, it may be useful to consider use of more detailed commodity flow data from Global Insight’s commercially available TranSearch database to refine the potential for Marine Highway use for specific products or origins/ destinations. For example, for very localized and specialty Marine Highway services (e.g., short distance bulk operations) estimated county to county flows for specific detailed commodities could shed light on potential volumes for such services. However, for these cases estimated county to county flows may also prove inadequate depending on the geographies involved. Ultimately, market analysis in support of specific Marine Highway service proposals is likely to require detailed (and costly) market survey information to be collected.
2.3.2 Feasibility by Type of Product and Modes
Commodity detail incorporated in this analysis includes two principal sources. First, two-digit SCTG7 commodity groups are used in the United States Commodity Flow Survey (USCFS) (collected most recently in 2007) and also in the FHWA FAF3. There are 42 two-digit commodity groups (See Table 2-12 at the end of this section). Second, for international trade data, both overseas and also cross border trade with Mexico and Canada, commodity detail is available for thousands of commodities defined by Harmonized System (HS) codes. Note that the SCTG system is defined by detailed HS codes.
Modal commodity flow detail in USCFS/FAF3 includes the following categories for domestic cargo as well as for the international portion of imports and exports:
• Truck,
• Rail,
• Water,
• Air,
• Pipeline, and
• Multiple Modes.
Part of the process for identifying cargo types that may be feasible for Marine Highway transport involves filtering out those product categories that are not likely to be moved over a Marine Highway. There are a number of product groups for which Marine Highway transportation are not likely to be relevant, especially given a focus on transferring products moving by container
7 Standard Classification of Transported Goods from the United States Department of Commerce and the USDOT’s Bureau of Transportation Statistics

West Coast Marine Highway Market Analysis
Part 2 Market Analysis
2-8
or trailer from highways to Marine Highways. The most obvious example is petroleum and petroleum products, especially product moved by pipeline (see modal list above). There are also a number of other bulk products (including coal and ores) that are moved most effectively in specialized bulk operations, in some cases currently moved in part over water. Other heavy bulk products, including project cargo, logs, gravel, and natural sands are generally moved locally over short distances by truck. Finally there are product groups for which tonnage is very small and does not warrant inclusion in volume analysis. These products include pharmaceuticals, tobacco, and live animals.
Due to the type of product, including local products, modal considerations, low volumes, or products that are local in nature, the following 12 commodity groups have low potential to be moved over a Marine Highway.
Table 2-1 Low Potential Product Groups - West Coast Domestic SCTG KTons M$ $/kg
01 Live animals/fish 4,419 7,361 1.67 09 Tobacco products 363 5,295 14.58 11 Natural sands 65,533 1,094 0.02 12 Gravel 247,671 2,913 0.01 14 Metallic ores 21 139 6.45 15 Coal 171 6 0.03 16 Crude petroleum 1,548 699 0.45 17 Gasoline 172,164 129,278 0.75 18 Fuel oils 49,544 33,043 0.67 19 Coal 58,139 23,295 0.40 25 Logs 50,446 2,161 0.04 43 Mixed freight 44,611 129,362 2.90 99 Unknown 29,446 34,110 1.16
Notes: KTons – kilotons M$ – mean value $/kg – dollars per kilogram
2.3.2.1 Domestic Feeder Opportunities for International Container Services
As part of the modal discussion, the opportunity to deploy domestic feeder services to augment and enhance the efficiency of the international container services deserves special attention.
The maritime infrastructure along the West Coast handles millions of TEUs each year, with the Ports of Los Angeles and Long Beach handling nearly 14 million TEUs in 2011. However, this traffic is in the form of international liner services calling on West Coast ports from Asia, Australia/New Zealand, South America, and Europe. Some of these services transit the Panama Canal or come north from South America and make the San Pedro ports their first call on the United States West Coast. The San Pedro ports proximity to major world maritime trade lanes, coupled with the population density of southern California, mature road and rail connections and the growth of distribution activities in the region, has led to the phenomenal growth of the San Pedro ports.

West Coast Marine Highway Market Analysis
Part 2 Market Analysis
2-9
Often the vessels that arrive at San Pedro from the south complete their voyages with calls at other West Coast gateways, including Oakland, Seattle/Tacoma, and/or Port Metro Vancouver (PMV) before either returning south to Panama, South America, or east to Asia. As Los Angeles/Long Beach are typically the dominant ports from an import volume point of view, it often makes economic sense for deep-sea vessel operators to terminate the voyage in San Pedro and “substitute service” for cargoes going to or from other United States West Coast ports. This “substituted service” is normally performed by rail or truck and is paid for by the international liner operator. The benefit to the international operator is reflected in lower vessel and fuel costs as the ship does not continue on a voyage and they still have the benefit of the customer whom they are serving, albeit utilizing a different transportation mode. To the customer, the service is normally transparent. International liner operators will utilize substituted service for both imports and exports, depending on their port and customer requirements.
A viable Marine Highway operation between San Pedro and major ports to the north to include Oakland, Seattle, Tacoma, and PMV could attract substituted service cargoes from international liner operators.
The liner carriers may find benefit in moving some of their cargoes between these ports if they can reduce vessel days and costs from their larger, line haul international vessels. Using a feeder Marine Highway service would also provide valuable base cargo, which would allow consistency of service from which to build a viable domestic Marine Highway business. As these cargoes are already at marine facilities, drayage operations would be simplified--cargo would already be containerized. Further, both import and export traffic could be attracted creating a balance and density that will be critical to any Marine Highway venture.
An important example of such a service is the Matson feeder service which was mentioned earlier. A more detailed description and analysis of the service is discussed in Part 3, but the service was considered successful for five years, mainly due to the following market driven reasons:
• Matson had a contract with the Canadian Railway to haul cargo south to Los Angeles from Vancouver, British Columbia, that was considered the mainstay of the service.
• Matson had at least two ocean carriers from Europe and Latin America that previously had service up and down the U.S. West Coast but entered into a contract that transferred all cargo bound for ports north of San Pedro Bay to Matson, thus freeing their vessels to return south, saving a minimum of one week transit time. The contracts also provided for the carriers southbound cargo from ports north of San Pedro to be loaded on the Matson service for transshipment in Los Angeles.
• Domestic cargo, when combined with the above international cargo, provided consistent and balanced cargo flows for the system as the majority of domestic cargo was northbound from California.
While much of international container cargo volumes would be unlikely to switch to feeder services, converting even a small portion of those international volumes could form the basis for a U.S. West Coast Marine Highway service when combined with other potential volumes. International volumes would likely be unbalanced southbound, which could complement potentially unbalanced domestic (export or feeder) volumes moving north.
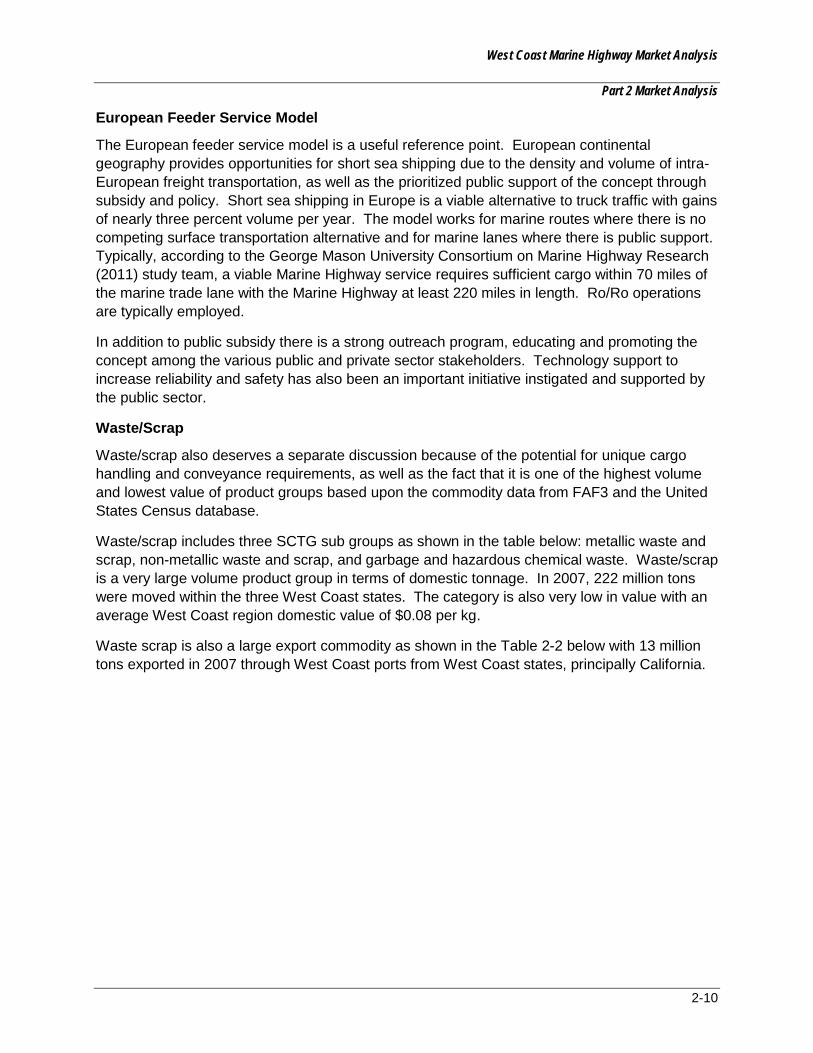
West Coast Marine Highway Market Analysis
Part 2 Market Analysis
2-10
European Feeder Service Model
The European feeder service model is a useful reference point. European continental geography provides opportunities for short sea shipping due to the density and volume of intra-European freight transportation, as well as the prioritized public support of the concept through subsidy and policy. Short sea shipping in Europe is a viable alternative to truck traffic with gains of nearly three percent volume per year. The model works for marine routes where there is no competing surface transportation alternative and for marine lanes where there is public support. Typically, according to the George Mason University Consortium on Marine Highway Research (2011) study team, a viable Marine Highway service requires sufficient cargo within 70 miles of the marine trade lane with the Marine Highway at least 220 miles in length. Ro/Ro operations are typically employed.
In addition to public subsidy there is a strong outreach program, educating and promoting the concept among the various public and private sector stakeholders. Technology support to increase reliability and safety has also been an important initiative instigated and supported by the public sector.
Waste/Scrap
Waste/scrap also deserves a separate discussion because of the potential for unique cargo handling and conveyance requirements, as well as the fact that it is one of the highest volume and lowest value of product groups based upon the commodity data from FAF3 and the United States Census database.
Waste/scrap includes three SCTG sub groups as shown in the table below: metallic waste and scrap, non-metallic waste and scrap, and garbage and hazardous chemical waste. Waste/scrap is a very large volume product group in terms of domestic tonnage. In 2007, 222 million tons were moved within the three West Coast states. The category is also very low in value with an average West Coast region domestic value of $0.08 per kg.
Waste scrap is also a large export commodity as shown in the Table 2-2 below with 13 million tons exported in 2007 through West Coast ports from West Coast states, principally California.
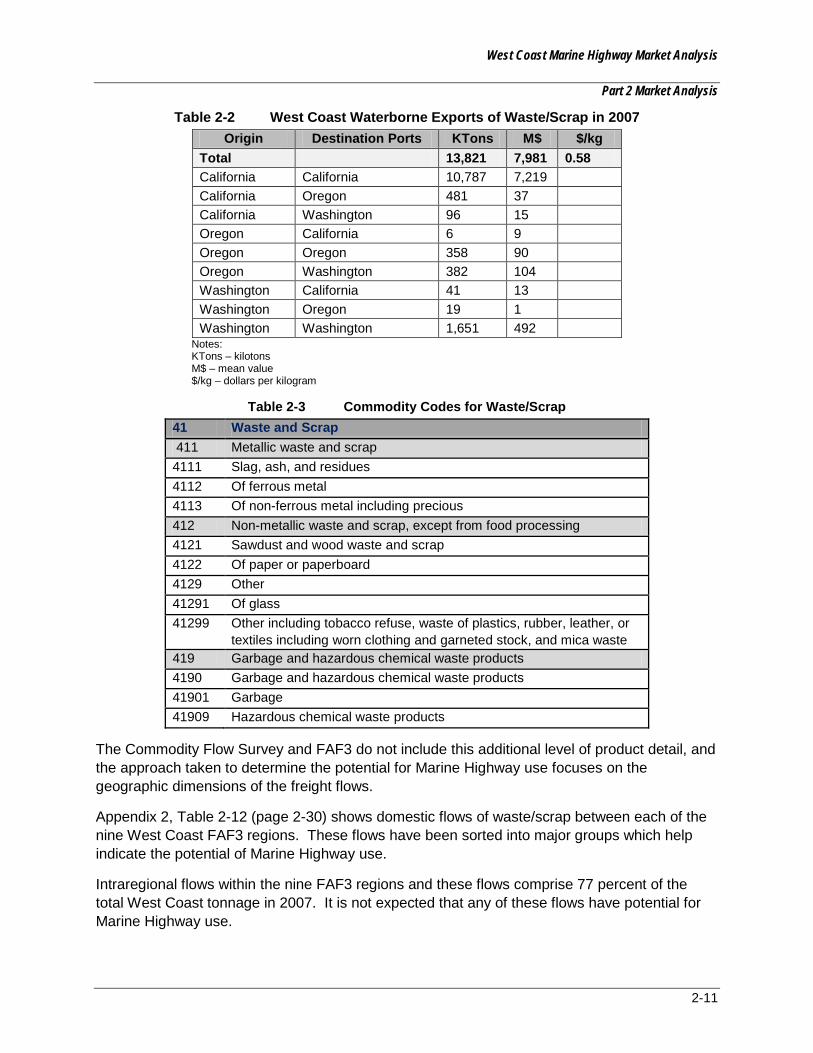
West Coast Marine Highway Market Analysis
Part 2 Market Analysis
2-11
Table 2-2 West Coast Waterborne Exports of Waste/Scrap in 2007 Origin Destination Ports KTons M$ $/kg
Total 13,821 7,981 0.58 California California 10,787 7,219 California Oregon 481 37 California Washington 96 15 Oregon California 6 9 Oregon Oregon 358 90 Oregon Washington 382 104 Washington California 41 13 Washington Oregon 19 1 Washington Washington 1,651 492
Notes: KTons – kilotons M$ – mean value $/kg – dollars per kilogram
Table 2-3 Commodity Codes for Waste/Scrap
41 Waste and Scrap 411 Metallic waste and scrap 4111 Slag, ash, and residues 4112 Of ferrous metal 4113 Of non-ferrous metal including precious 412 Non-metallic waste and scrap, except from food processing 4121 Sawdust and wood waste and scrap 4122 Of paper or paperboard 4129 Other 41291 Of glass 41299 Other including tobacco refuse, waste of plastics, rubber, leather, or
textiles including worn clothing and garneted stock, and mica waste 419 Garbage and hazardous chemical waste products 4190 Garbage and hazardous chemical waste products 41901 Garbage 41909 Hazardous chemical waste products
The Commodity Flow Survey and FAF3 do not include this additional level of product detail, and the approach taken to determine the potential for Marine Highway use focuses on the geographic dimensions of the freight flows.
Appendix 2, Table 2-12 (page 2-30) shows domestic flows of waste/scrap between each of the nine West Coast FAF3 regions. These flows have been sorted into major groups which help indicate the potential of Marine Highway use.
Intraregional flows within the nine FAF3 regions and these flows comprise 77 percent of the total West Coast tonnage in 2007. It is not expected that any of these flows have potential for Marine Highway use.

West Coast Marine Highway Market Analysis
Part 2 Market Analysis
2-12
Contiguous region flows include those between relatively close regions (e.g., Los Angeles and San Diego) and these flows account for an additional nine percent of waste scrap tonnage. Like intraregional flows it is expected that these freight movements would have low potential for Marine Highway use given the relatively low inland distances involved.
Other Sacramento and California "remainder" flows are those between these regions and other West Coast regions and account for nine percent of U.S. West Coast flows. Given that the Sacramento and California remainder regions are generally located relatively far inland, it is also expected that these flows have little potential for Marine Highway use.
The regional flows outlined above accounted for 95 percent of total waste/scrap product flows in 2007 leaving five percent that have potential for Marine Highway use. These represent long distance moves that are also relatively close to the Pacific Coast.
San Francisco is the largest destination for remaining waste/scrap tonnage with three percent of total domestic volume. The principal origin is Los Angeles but large volumes originate in San Diego.
Los Angeles is the second largest destination of remaining waste/scrap tonnage with two percent of domestic tonnage. The major origin of this freight is San Francisco.
Other smaller flows of waste/scrap are from San Francisco to San Diego from and from Los Angeles to the PNW.
In summary, there were two principal flows of waste/scrap in 2007 which appear to have potential for Marine Highway use. These were flows of about five million tons moving in each direction between Los Angeles and San Francisco. While these would appear to be almost mirroring flows, the volumes are most likely comprised of different product mixes and disposition. Some portion of each is likely destined for processing into containerized exports out of San Pedro Bay ports or Oakland while other products serve as raw materials for industrial use in the Los Angeles or San Francisco regions. If the combined 10-million tons were all converted to exports, this volume would closely match the total of California exports noted in the Table 2-2. This topic requires further investigation and interviews with companies involved in scrap processing and wholesaling.
2.3.3 Product Value as a Relevant Factor
In addition to screening out certain products because of modal or other considerations, higher-value products are generally less likely candidates for shipping on Marine Highway services. For these product groups, despite higher transportation costs, the quicker transit times and flexibility provided by landside modes will usually outweigh the possibility of marginally lowering transportation costs. High value products include seven commodity groups, are shown in Table 2-4 below.

West Coast Marine Highway Market Analysis
Part 2 Market Analysis
2-13
Table 2-4 West Coast Domestic High Value Commodity Flows SCTG KTons M$ $/Kg
21 Pharmaceuticals 2,501 60,609 24.23 30 Textiles/leather 3,918 51,232 13.08 34 Machinery 18,096 154,661 8.55 35 Electronics 5,825 96,880 16.63 36 Motorized vehicles 13,946 75,560 5.42 37 Transport equip. 498 13,716 27.55 38 Precision instruments 950 17,003 17.91 Notes: KTons – kilotons M$ – mean value $/kg – dollars per kilogram
Lower value products appear to have the most potential for shipment on Marine Highways services, mainly because these products are less sensitive to transit time.
However, there are several low value commodity groups that have low potential for Marine Highway services because they have origins and destinations that are distant from the Pacific Coast and the associated ports. These include agricultural products and non-metallic minerals which are discussed are discussed in Section 2.3.4.2.
There are 16 low value commodity groups (not including waste/scrap) that were identified as the most likely to take advantage of opportunities to ship on a Marine Highway service. These are displayed in Table 2-5 below. They are generally manufactured products.
Table 2-5 Potential Marine highway Commodity Groups – West Coast Domestic
SCTG2 KTons M$ $/Kg 05 Meat/seafood 10,232 32,664 3.19 06 Milled grain prods. 15,168 18,132 1.20 07 Other foodstuffs 62,532 61,837 0.99 08 Alcoholic beverages 19,061 32,382 1.70 20 Basic chemicals 7,422 4,290 0.58 23 Chemical prods. 13,067 23,876 1.83 24 Plastics/rubber 10,353 35,619 3.44 26 Wood prods. 57,265 29,505 0.52 27 Newsprint/paper 11,214 9,487 0.85 28 Paper articles 10,121 14,798 1.46 29 Printed prods. 4,416 11,767 2.66 31 Nonmetal min. prods. 192,409 31,546 0.16 32 Base metals 15,306 26,361 1.72 33 Articles-base metal 15,539 48,396 3.11 39 Furniture 4,065 16,483 4.05 40 Misc. mfg. prods. 10,941 38,535 3.52
Notes: SCTG2 – Standard Classification of Transported Goods Code KTons – kilotons M$ – mean value $/kg – dollars per kilogram
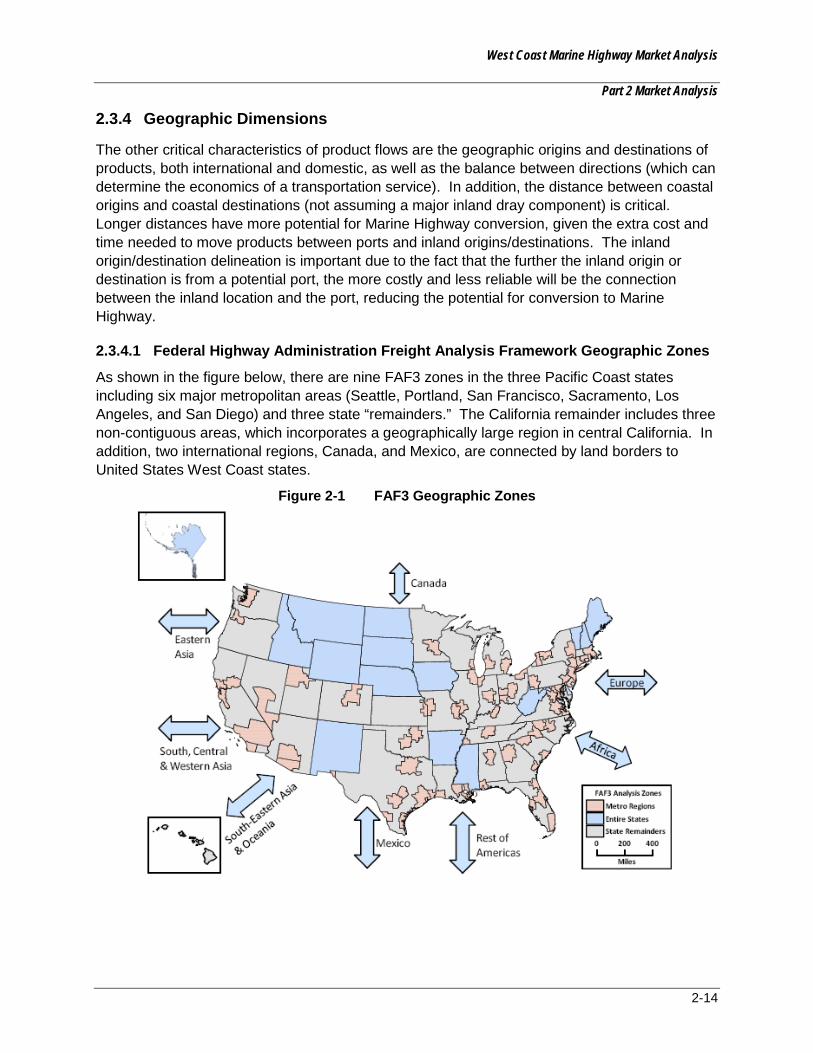
West Coast Marine Highway Market Analysis
Part 2 Market Analysis
2-14
2.3.4 Geographic Dimensions
The other critical characteristics of product flows are the geographic origins and destinations of products, both international and domestic, as well as the balance between directions (which can determine the economics of a transportation service). In addition, the distance between coastal origins and coastal destinations (not assuming a major inland dray component) is critical. Longer distances have more potential for Marine Highway conversion, given the extra cost and time needed to move products between ports and inland origins/destinations. The inland origin/destination delineation is important due to the fact that the further the inland origin or destination is from a potential port, the more costly and less reliable will be the connection between the inland location and the port, reducing the potential for conversion to Marine Highway.
2.3.4.1 Federal Highway Administration Freight Analysis Framework Geographic Zones
As shown in the figure below, there are nine FAF3 zones in the three Pacific Coast states including six major metropolitan areas (Seattle, Portland, San Francisco, Sacramento, Los Angeles, and San Diego) and three state “remainders.” The California remainder includes three non-contiguous areas, which incorporates a geographically large region in central California. In addition, two international regions, Canada, and Mexico, are connected by land borders to United States West Coast states.
Figure 2-1 FAF3 Geographic Zones

West Coast Marine Highway Market Analysis
Part 2 Market Analysis
2-15
Relevant Origin/Destination Corridors
For this analysis seven primary trade corridors were reviewed which have either long coastal or inland transportation distances and/or for which an origin or destination already includes a potential Marine Highway port.
• Between United States West Coast Regions
o SoCA – NoCA
o SoCA – PNW
o NoCA – PNW
• Cross Border
o Mexico Cross Border – U.S. West Coast
o Canada Cross Border – U.S. West Coast
• Current International cargo destined to or originating in United States inland regions
o Transpacific
o South America/Europe
Analysis of commodity flows in these corridors is included in the last section of this report. Note that Cross Border flows are not a part of America’s Marine Highway program.
Intraregional and “Local”
Between the nine West Coast FAF3 zones there are 81 combinations of origins and destinations (see Table 2-6 below). These include nine intra-regional flows (e.g., from Los Angeles to Los Angeles) which accounted for nearly 70 percent of total domestic cargo tonnage in 2007 and which are not likely to move by Marine Highway.
Flows between many contiguous regions can also be excluded as potential Marine Highway flows because trucking is either the only means of transport or the level of service with trucking far exceeds a Marine Highway potential (e.g., between Seattle and the Washington remainder- a truck going from Yakima to Seattle is quicker and less costly than drayage to a river port, transfer to a vessel, voyage to Puget Sound port and drayage to final destination).

West Coast Marine Highway Market Analysis
Part 2 Market Analysis
2-16
Table 2-6 Freight Analysis Framework Region Flows
Seattle Portland WA Rem OR Rem Sacr SF LA SD CA Rem Seattle Portland WA Rem OR Rem Sacramento SF LA SD CA Rem
Coastal & Long Distance Sacramento Coastal High Density Contiguous Columbia/ Snake Intra-Region
Notes: WA Rem – Washington Remainder OR Rem – Oregon Remainder
Sacr – Sacramento SF – San Francisco
LA – Los Angeles SD – San Diego
CA Rem – California Remainder
Coastal Long-Distance Metropolitan Regions
At the other end of the spectrum, the most likely domestic flows that would be candidates for movement by Marine Highway are those between major metropolitan areas on the Pacific Coast where there are long coastal or inland transportation distances between these areas (nominally more than 500 miles). This is a distance in which reliable and cost effective rail transportation becomes a strong competitor for both trucking and Marine Highway cargoes. There are 16 such flows out of the 81 total. These are shown in dark blue in Table 2-6 above and are listed in Table 2-7 below.

West Coast Marine Highway Market Analysis
Part 2 Market Analysis
2-17
Table 2-7 Domestic Flows between Large Coastal Regions and Long Distance
Total KTons in 2007
Total Value (M$) in 2007
Southbound 17,801.1 32,159.6 Seattle WA CSA San Francisco CA CSA 588.0 1,526.8 Seattle WA CSA Los Angeles CA CSA 3,355.7 4,372.6 Seattle WA CSA San Diego CA MSA 37.7 369.8 Portland OR-WA MSA (OR Part) San Francisco CA CSA 344.5 3,739.0 Portland OR-WA MSA (OR Part) Los Angeles CA CSA 1,219.5 2,270.8 Portland OR-WA MSA (OR Part) San Diego CA MSA 60.7 236.3 San Francisco CA CSA Los Angeles CA CSA 11,254.0 17,626.0 San Francisco CA CSA San Diego CA MSA 940.9 2,018.3 Northbound 18,632.3 48,439.9 San Diego CA MSA San Francisco CA CSA 980.9 1,449.5 San Diego CA MSA Portland OR-WA MSA (OR Part) 44.1 254.1 San Diego CA MSA Seattle WA CSA 114.5 1,063.8 Los Angeles CA CSA San Francisco CA CSA 11,305.2 24,116.2 Los Angeles CA CSA Portland OR-WA MSA (OR Part) 1,580.8 4,971.4 Los Angeles CA CSA Seattle WA CSA 1,721.0 9,710.3 San Francisco CA CSA Portland OR-WA MSA (OR Part) 676.6 1,687.4 San Francisco CA CSA Seattle WA CSA 2,209.2 5,187.2 Notes: WA – Washington OR – Oregon CA – California MSA – Metropolitan Service Area OR Part – Oregon portion Ktons – kilotons M$ - mean value This geographic subset of total West Coast domestic flows represents just 2.2 percent of the total U.S. West Coast domestic tonnage but 5.9 percent of total cargo value. Note that most of the largest freight flows include Los Angeles (the entire Los Angeles basin) as an origin or destination. Inter-regional traffic to and from San Diego is generally quite low and in reality may overlap with freight being moved from/to San Diego but via Los Angeles. This analysis only includes the potential of Mexican cargo entering the San Diego area via truck.
The Los Angeles basin CSA provides large cargo volumes over a large geographic region that stretches from Los Angeles to the Arizona border (over 200 miles). Thus, the Los Angeles CSA includes some freight flows with origins or destinations that would include a long distance inland dray from ports and represent limited or non-existent potential for movement by Marine Highway.
2.3.4.2 Commodity Groups with Distant Inland Origins or Destinations
Of the lower value product groups some have origins or destinations that are distant from the Pacific Coast and the associated ports, limiting their potential for Marine Highway transportation.
Agricultural products that are produced in inland regions would have to be moved by truck to potential Marine Highway ports. In many cases these distances are over 100 miles, reducing or eliminating potential cost savings compared to direct trucking. Figure 2-2 displays crop receipts by county showing that many of the largest crop producing counties (such as Kern and Fresno
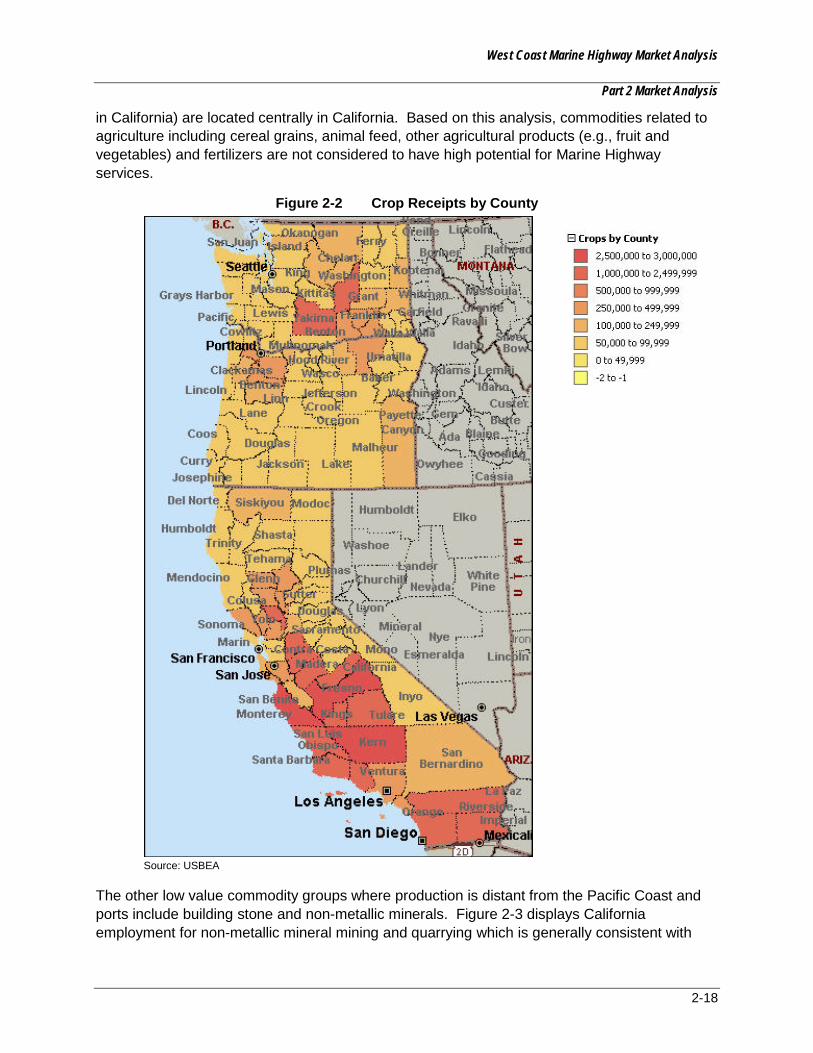
West Coast Marine Highway Market Analysis
Part 2 Market Analysis
2-18
in California) are located centrally in California. Based on this analysis, commodities related to agriculture including cereal grains, animal feed, other agricultural products (e.g., fruit and vegetables) and fertilizers are not considered to have high potential for Marine Highway services.
Figure 2-2 Crop Receipts by County
Source: USBEA
The other low value commodity groups where production is distant from the Pacific Coast and ports include building stone and non-metallic minerals. Figure 2-3 displays California employment for non-metallic mineral mining and quarrying which is generally consistent with
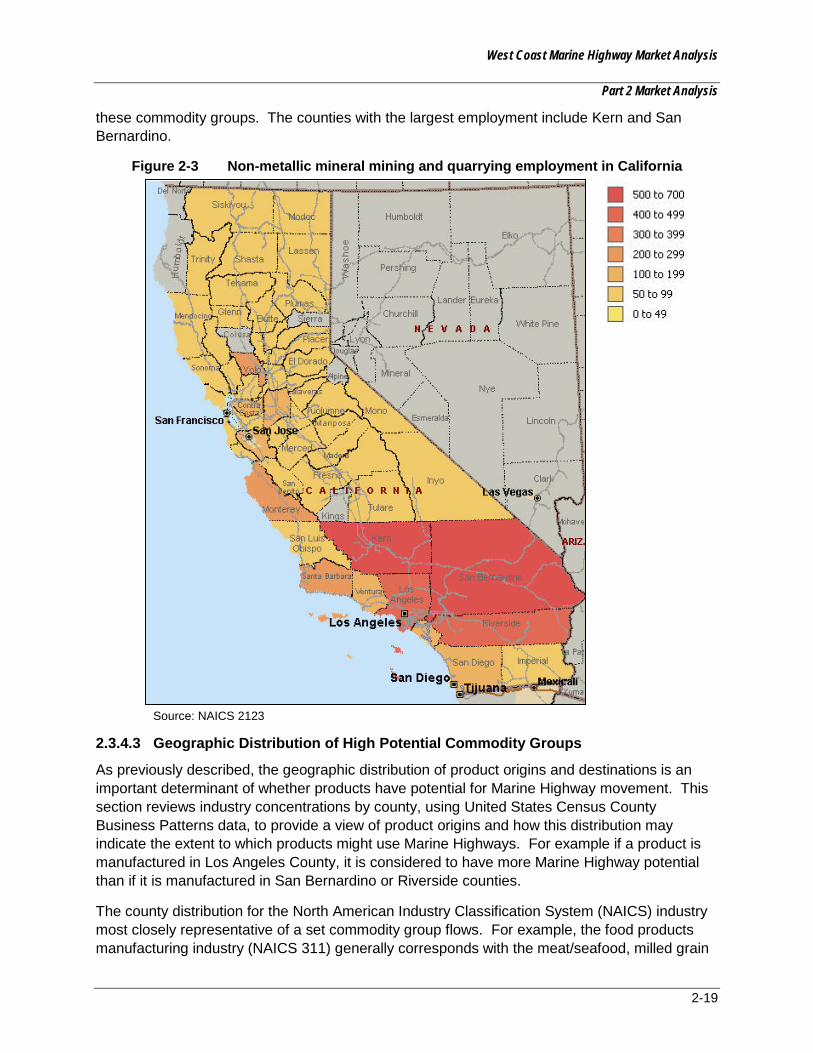
West Coast Marine Highway Market Analysis
Part 2 Market Analysis
2-19
these commodity groups. The counties with the largest employment include Kern and San Bernardino.
Figure 2-3 Non-metallic mineral mining and quarrying employment in California
Source: NAICS 2123
2.3.4.3 Geographic Distribution of High Potential Commodity Groups
As previously described, the geographic distribution of product origins and destinations is an important determinant of whether products have potential for Marine Highway movement. This section reviews industry concentrations by county, using United States Census County Business Patterns data, to provide a view of product origins and how this distribution may indicate the extent to which products might use Marine Highways. For example if a product is manufactured in Los Angeles County, it is considered to have more Marine Highway potential than if it is manufactured in San Bernardino or Riverside counties.
The county distribution for the North American Industry Classification System (NAICS) industry most closely representative of a set commodity group flows. For example, the food products manufacturing industry (NAICS 311) generally corresponds with the meat/seafood, milled grain
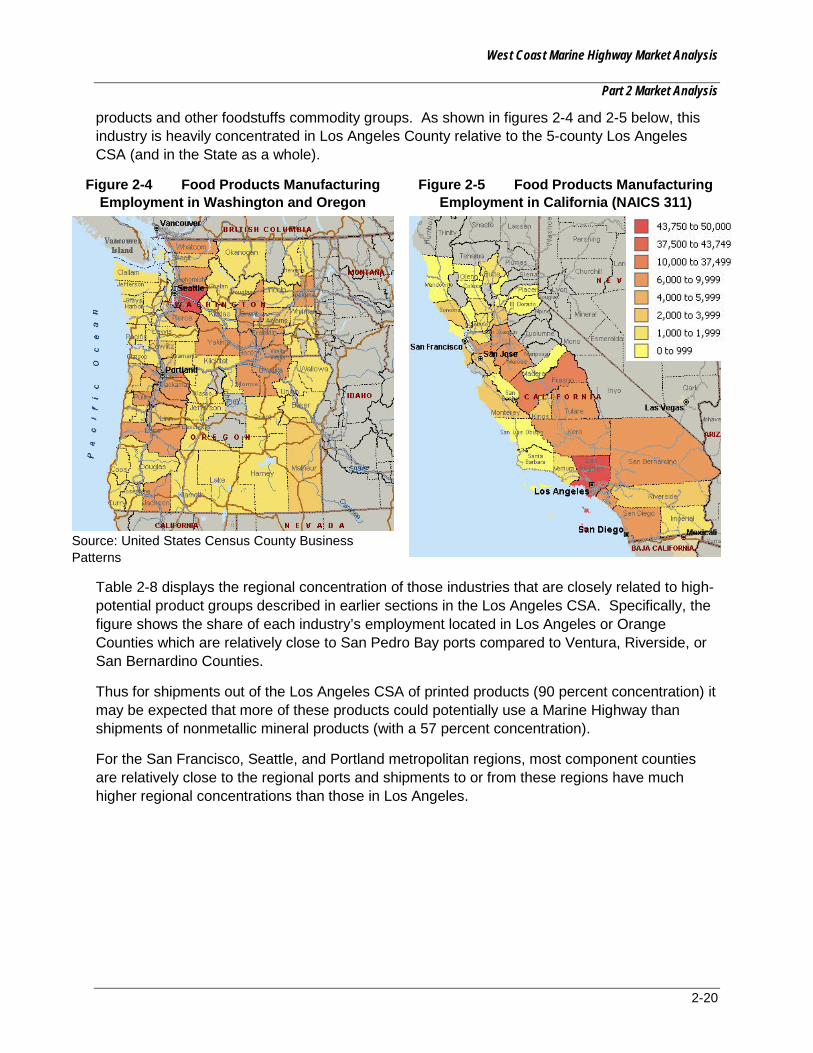
West Coast Marine Highway Market Analysis
Part 2 Market Analysis
2-20
products and other foodstuffs commodity groups. As shown in figures 2-4 and 2-5 below, this industry is heavily concentrated in Los Angeles County relative to the 5-county Los Angeles CSA (and in the State as a whole).
Figure 2-4 Food Products Manufacturing Employment in Washington and Oregon
Figure 2-5 Food Products Manufacturing Employment in California (NAICS 311)
Source: United States Census County Business Patterns
Table 2-8 displays the regional concentration of those industries that are closely related to high-potential product groups described in earlier sections in the Los Angeles CSA. Specifically, the figure shows the share of each industry’s employment located in Los Angeles or Orange Counties which are relatively close to San Pedro Bay ports compared to Ventura, Riverside, or San Bernardino Counties.
Thus for shipments out of the Los Angeles CSA of printed products (90 percent concentration) it may be expected that more of these products could potentially use a Marine Highway than shipments of nonmetallic mineral products (with a 57 percent concentration).
For the San Francisco, Seattle, and Portland metropolitan regions, most component counties are relatively close to the regional ports and shipments to or from these regions have much higher regional concentrations than those in Los Angeles.

West Coast Marine Highway Market Analysis
Part 2 Market Analysis
2-21
Table 2-8 Los Angeles and Orange Counties’ Share of Los Angeles CSA Employment in 2009
2.3.5 Commodity Flows by Corridor--Highest Potential for Marine Highway
Traffic
This section examines freight flows that have the most potential for Marine Highway use, that is, relatively low value products by major commodity flow corridor. Table 2-9 displays total domestic flows between major coastal regions for each of the 16 low value commodity groups. Corridors are shown in columns with northbound and southbound flows separated. Tables 2-10 and 2-11 display commodity flows between United States coastal regions for international waterborne imports and exports, where the United States origin or destination is a port.
From the FAF3 analysis, the study team found that exports that could utilize a Marine Highway did not present a large opportunity due to the inland location origin and the speed, reliability and cost to directly transport the product to an international port without using a Marine Highway port and double handling, outweighed the potential for Marine Highway utilization. Section 2.2.3 focused on commodity flows which already occur on water--international container trade through West Coast ports to United States inland regions--that could possibly be converted to Marine Highway feeder services as part of a WCMH service. The development of such services would complement domestically oriented services and potentially make both service components more viable than either considered separately.
These tables are followed by sections summarizing commodity flows between West Coast coastal regions including domestic and international cargos. The coastal regions typically are named after the largest or most prominent city. However, because there are often multiple ports within these regions, for purposes of this study, these regions are labeled by bay, harbor, or river. Appendices provide more detailed tables for each corridor. Taken together these corridors are viewed as representing potentially viable Marine Highways from a market perspective. Part 3 of this study will take these corridors and examine them from a competitive cost perspective. That analysis will also incorporate the additional corridors and potential Marine Highways identified in the RFP.
0% 20% 40% 60% 80% 100%
327 Nonmetallic mineral products321 Wood Products
3121 Beverage Manufacturing326 Plastics and Rubber Products
331 Primary metal products337 Furniture and related products339 Miscellaneous manufacturing
332 Fabricated metal products322 Paper Products Manufacturing
325 Chemical Products Manufacturing311 Food Products Manufacturing
323 Printing
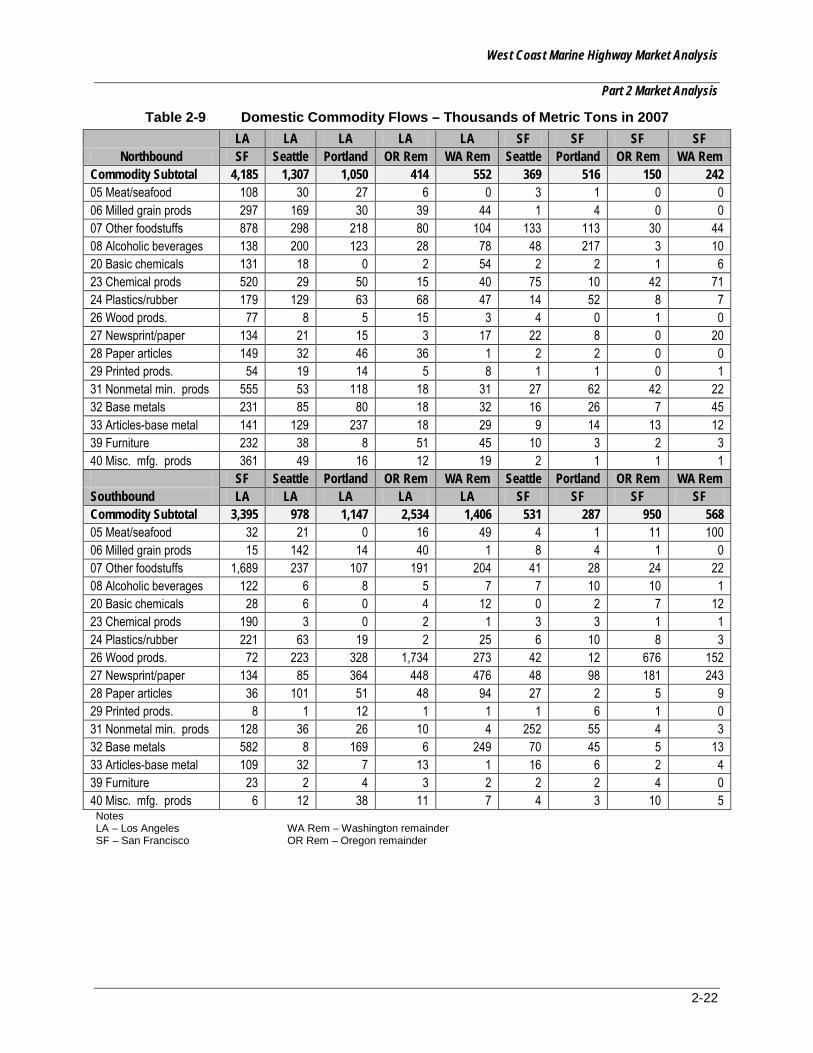
West Coast Marine Highway Market Analysis
Part 2 Market Analysis
2-22
Table 2-9 Domestic Commodity Flows – Thousands of Metric Tons in 2007
LA LA LA LA LA SF SF SF SF Northbound SF Seattle Portland OR Rem WA Rem Seattle Portland OR Rem WA Rem
Commodity Subtotal 4,185 1,307 1,050 414 552 369 516 150 242 05 Meat/seafood 108 30 27 6 0 3 1 0 0 06 Milled grain prods 297 169 30 39 44 1 4 0 0 07 Other foodstuffs 878 298 218 80 104 133 113 30 44 08 Alcoholic beverages 138 200 123 28 78 48 217 3 10 20 Basic chemicals 131 18 0 2 54 2 2 1 6 23 Chemical prods 520 29 50 15 40 75 10 42 71 24 Plastics/rubber 179 129 63 68 47 14 52 8 7 26 Wood prods. 77 8 5 15 3 4 0 1 0 27 Newsprint/paper 134 21 15 3 17 22 8 0 20 28 Paper articles 149 32 46 36 1 2 2 0 0 29 Printed prods. 54 19 14 5 8 1 1 0 1 31 Nonmetal min. prods 555 53 118 18 31 27 62 42 22 32 Base metals 231 85 80 18 32 16 26 7 45 33 Articles-base metal 141 129 237 18 29 9 14 13 12 39 Furniture 232 38 8 51 45 10 3 2 3 40 Misc. mfg. prods 361 49 16 12 19 2 1 1 1 SF Seattle Portland OR Rem WA Rem Seattle Portland OR Rem WA Rem Southbound LA LA LA LA LA SF SF SF SF Commodity Subtotal 3,395 978 1,147 2,534 1,406 531 287 950 568 05 Meat/seafood 32 21 0 16 49 4 1 11 100 06 Milled grain prods 15 142 14 40 1 8 4 1 0 07 Other foodstuffs 1,689 237 107 191 204 41 28 24 22 08 Alcoholic beverages 122 6 8 5 7 7 10 10 1 20 Basic chemicals 28 6 0 4 12 0 2 7 12 23 Chemical prods 190 3 0 2 1 3 3 1 1 24 Plastics/rubber 221 63 19 2 25 6 10 8 3 26 Wood prods. 72 223 328 1,734 273 42 12 676 152 27 Newsprint/paper 134 85 364 448 476 48 98 181 243 28 Paper articles 36 101 51 48 94 27 2 5 9 29 Printed prods. 8 1 12 1 1 1 6 1 0 31 Nonmetal min. prods 128 36 26 10 4 252 55 4 3 32 Base metals 582 8 169 6 249 70 45 5 13 33 Articles-base metal 109 32 7 13 1 16 6 2 4 39 Furniture 23 2 4 3 2 2 2 4 0 40 Misc. mfg. prods 6 12 38 11 7 4 3 10 5 Notes LA – Los Angeles WA Rem – Washington remainder SF – San Francisco OR Rem – Oregon remainder
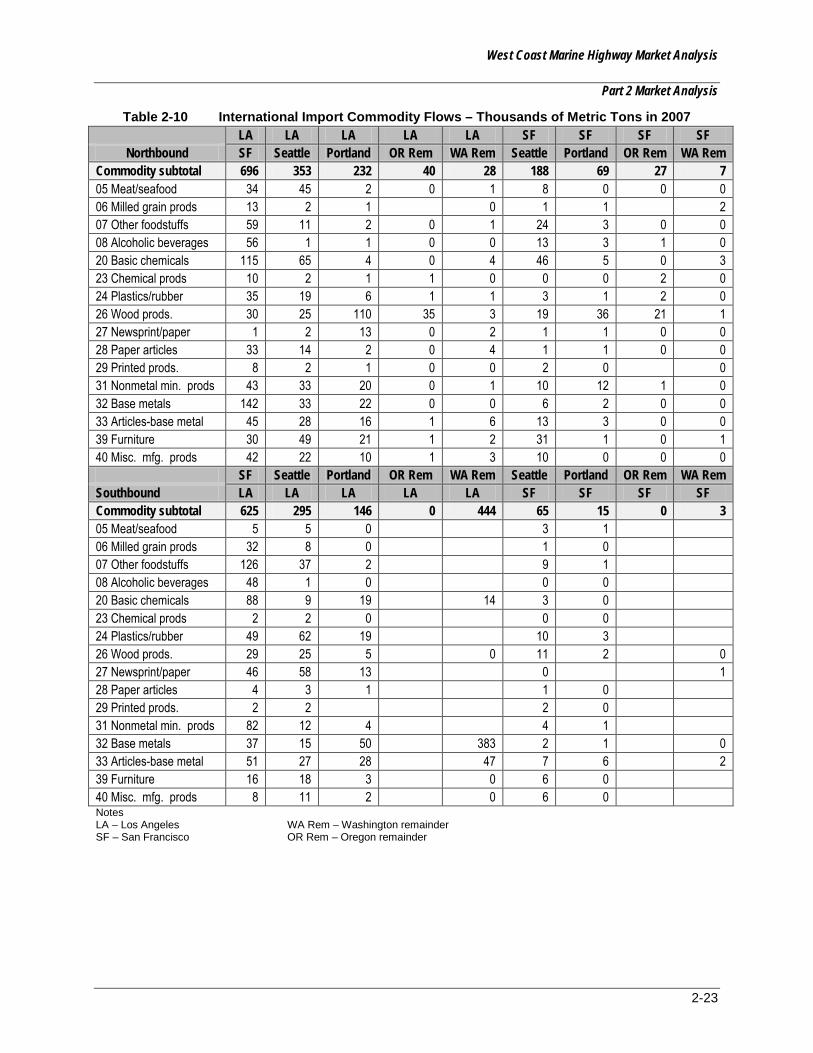
West Coast Marine Highway Market Analysis
Part 2 Market Analysis
2-23
Table 2-10 International Import Commodity Flows – Thousands of Metric Tons in 2007
LA LA LA LA LA SF SF SF SF Northbound SF Seattle Portland OR Rem WA Rem Seattle Portland OR Rem WA Rem
Commodity subtotal 696 353 232 40 28 188 69 27 7 05 Meat/seafood 34 45 2 0 1 8 0 0 0 06 Milled grain prods 13 2 1 0 1 1 2 07 Other foodstuffs 59 11 2 0 1 24 3 0 0 08 Alcoholic beverages 56 1 1 0 0 13 3 1 0 20 Basic chemicals 115 65 4 0 4 46 5 0 3 23 Chemical prods 10 2 1 1 0 0 0 2 0 24 Plastics/rubber 35 19 6 1 1 3 1 2 0 26 Wood prods. 30 25 110 35 3 19 36 21 1 27 Newsprint/paper 1 2 13 0 2 1 1 0 0 28 Paper articles 33 14 2 0 4 1 1 0 0 29 Printed prods. 8 2 1 0 0 2 0 0 31 Nonmetal min. prods 43 33 20 0 1 10 12 1 0 32 Base metals 142 33 22 0 0 6 2 0 0 33 Articles-base metal 45 28 16 1 6 13 3 0 0 39 Furniture 30 49 21 1 2 31 1 0 1 40 Misc. mfg. prods 42 22 10 1 3 10 0 0 0 SF Seattle Portland OR Rem WA Rem Seattle Portland OR Rem WA Rem Southbound LA LA LA LA LA SF SF SF SF Commodity subtotal 625 295 146 0 444 65 15 0 3 05 Meat/seafood 5 5 0 3 1 06 Milled grain prods 32 8 0 1 0 07 Other foodstuffs 126 37 2 9 1 08 Alcoholic beverages 48 1 0 0 0 20 Basic chemicals 88 9 19 14 3 0 23 Chemical prods 2 2 0 0 0 24 Plastics/rubber 49 62 19 10 3 26 Wood prods. 29 25 5 0 11 2 0 27 Newsprint/paper 46 58 13 0 1 28 Paper articles 4 3 1 1 0 29 Printed prods. 2 2 2 0 31 Nonmetal min. prods 82 12 4 4 1 32 Base metals 37 15 50 383 2 1 0 33 Articles-base metal 51 27 28 47 7 6 2 39 Furniture 16 18 3 0 6 0 40 Misc. mfg. prods 8 11 2 0 6 0 Notes LA – Los Angeles WA Rem – Washington remainder SF – San Francisco OR Rem – Oregon remainder
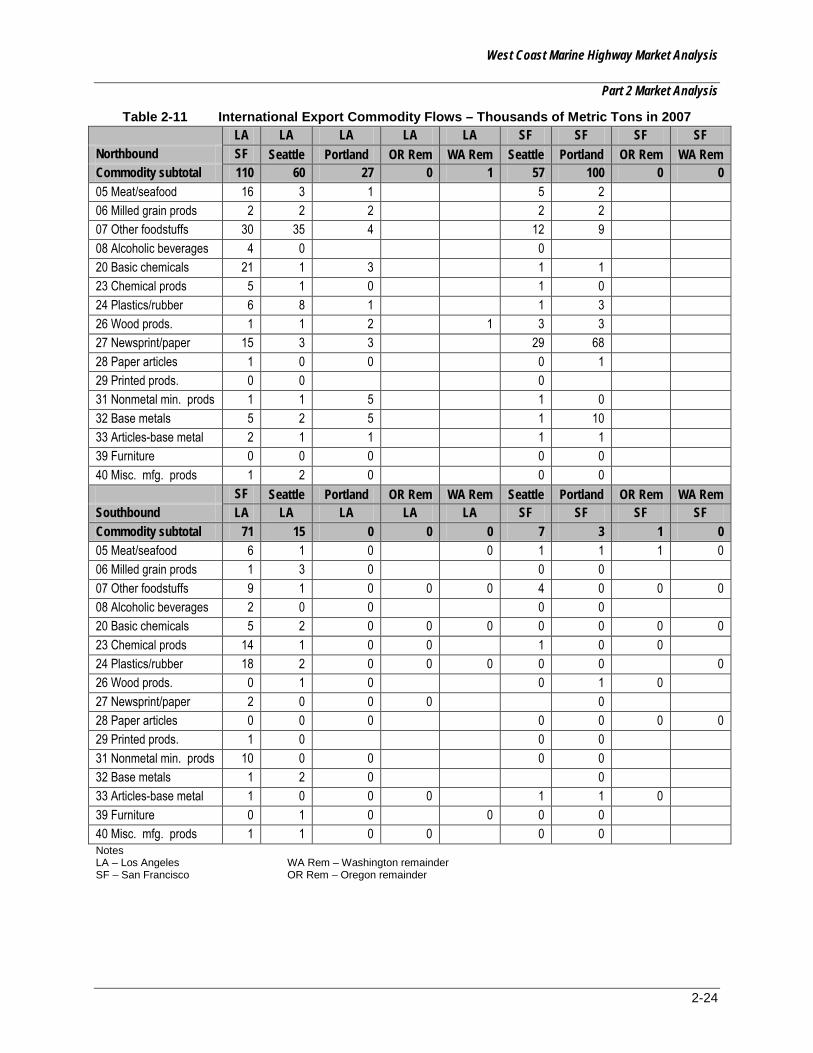
West Coast Marine Highway Market Analysis
Part 2 Market Analysis
2-24
Table 2-11 International Export Commodity Flows – Thousands of Metric Tons in 2007
LA LA LA LA LA SF SF SF SF Northbound SF Seattle Portland OR Rem WA Rem Seattle Portland OR Rem WA Rem Commodity subtotal 110 60 27 0 1 57 100 0 0 05 Meat/seafood 16 3 1 5 2 06 Milled grain prods 2 2 2 2 2 07 Other foodstuffs 30 35 4 12 9 08 Alcoholic beverages 4 0 0 20 Basic chemicals 21 1 3 1 1 23 Chemical prods 5 1 0 1 0 24 Plastics/rubber 6 8 1 1 3 26 Wood prods. 1 1 2 1 3 3 27 Newsprint/paper 15 3 3 29 68 28 Paper articles 1 0 0 0 1 29 Printed prods. 0 0 0 31 Nonmetal min. prods 1 1 5 1 0 32 Base metals 5 2 5 1 10 33 Articles-base metal 2 1 1 1 1 39 Furniture 0 0 0 0 0 40 Misc. mfg. prods 1 2 0 0 0 SF Seattle Portland OR Rem WA Rem Seattle Portland OR Rem WA Rem Southbound LA LA LA LA LA SF SF SF SF Commodity subtotal 71 15 0 0 0 7 3 1 0 05 Meat/seafood 6 1 0 0 1 1 1 0 06 Milled grain prods 1 3 0 0 0 07 Other foodstuffs 9 1 0 0 0 4 0 0 0 08 Alcoholic beverages 2 0 0 0 0 20 Basic chemicals 5 2 0 0 0 0 0 0 0 23 Chemical prods 14 1 0 0 1 0 0 24 Plastics/rubber 18 2 0 0 0 0 0 0 26 Wood prods. 0 1 0 0 1 0 27 Newsprint/paper 2 0 0 0 0 28 Paper articles 0 0 0 0 0 0 0 29 Printed prods. 1 0 0 0 31 Nonmetal min. prods 10 0 0 0 0 32 Base metals 1 2 0 0 33 Articles-base metal 1 0 0 0 1 1 0 39 Furniture 0 1 0 0 0 0 40 Misc. mfg. prods 1 1 0 0 0 0 Notes LA – Los Angeles WA Rem – Washington remainder SF – San Francisco OR Rem – Oregon remainder

West Coast Marine Highway Market Analysis
Part 2 Market Analysis
2-25
2.3.5.1 San Pedro Bay – San Francisco Bay The freight corridor between Los Angeles and San Francisco is by far the largest between West Coast regions in terms of volume and value. It is also a corridor with relatively long distances, at approximately 400 highway miles between Los Angeles/Long Beach ports to San Francisco. The shortest distance is approximately 200 miles from San Benito County in the south of the San Francisco CSA to Ventura County in the northern part of the Los Angeles CSA, although cargo flows between these counties do not represent a major portion of total inter-region volumes.
The largest northbound domestic volumes are in food products, non-metallic mineral products and chemical products but volumes are relatively large across all other product categories. Northbound domestic tonnage exceeds that of international imports by a factor of six to one but as noted previously these goods clearly originate at the ports. Imports through Los Angeles/Long Beach destined for the San Francisco region are concentrated in basic chemical products and base metal products.
Southbound domestic freight is smaller than northbound with a high concentration in other foodstuff (processed foods). However, as seen in Figure 2-6 the concentration of food product manufacturing in the San Francisco region is much less concentrated in regions near ports so the potential for use of Marine Highways is less than aggregate volumes would suggest. Imports through San Francisco region ports into the Los Angeles region are concentrated, like domestic flows, in other foodstuffs.
2.3.5.2 San Pedro Bay – Pacific Northwest The PNW includes the Seattle and Portland regions and Washington and Oregon state remainders. The freight corridor between the ports of San Pedro Bay (Los Angeles and Long Beach) and these four PNW regions has the longest distances on the West Coast with approximately 1,000 highway miles from Los Angeles to Portland and 1,200 miles to Seattle.
Northbound
Table 2-9 shows that northbound domestic cargo flows from Los Angeles to Seattle and Portland are the second and third largest flows after Los Angeles to San Francisco. These product flows are also concentrated in food products and alcoholic beverages. Articles of base metal to Seattle and
Figure 2-6 Los Angeles to San Francisco
Figure 2-7 Los Angeles to Pacific Northwest
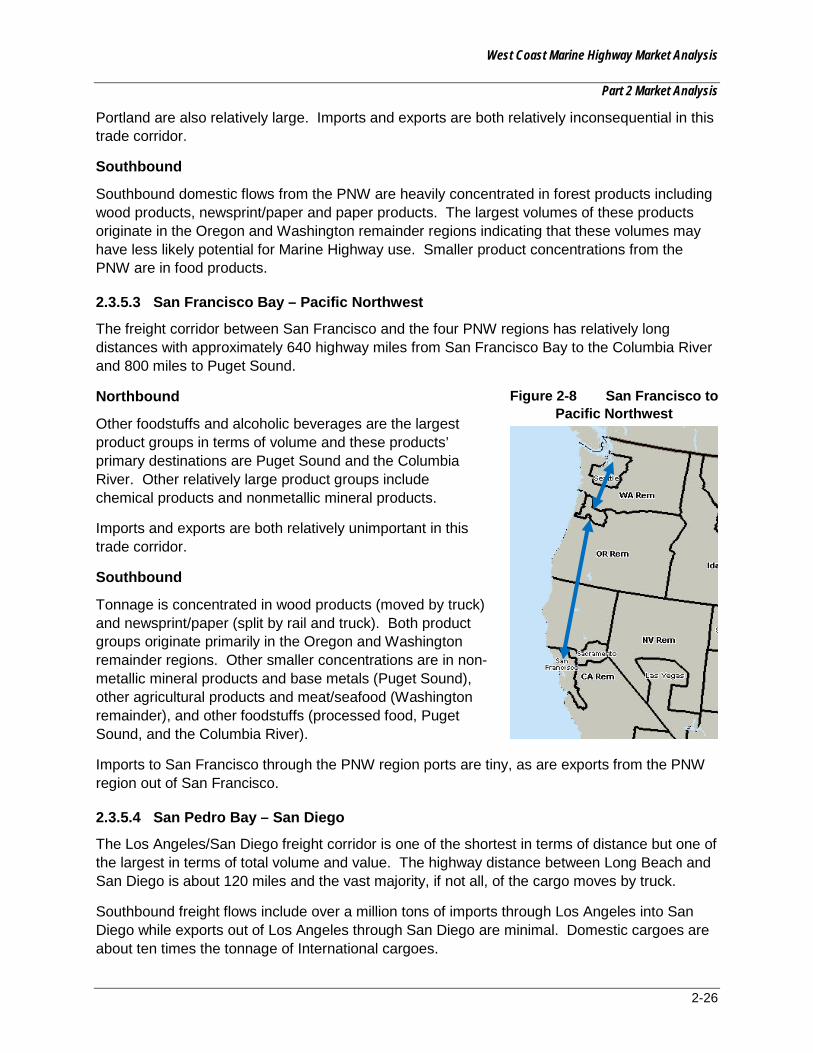
West Coast Marine Highway Market Analysis
Part 2 Market Analysis
2-26
Portland are also relatively large. Imports and exports are both relatively inconsequential in this trade corridor.
Southbound
Southbound domestic flows from the PNW are heavily concentrated in forest products including wood products, newsprint/paper and paper products. The largest volumes of these products originate in the Oregon and Washington remainder regions indicating that these volumes may have less likely potential for Marine Highway use. Smaller product concentrations from the PNW are in food products.
2.3.5.3 San Francisco Bay – Pacific Northwest
The freight corridor between San Francisco and the four PNW regions has relatively long distances with approximately 640 highway miles from San Francisco Bay to the Columbia River and 800 miles to Puget Sound.
Northbound
Other foodstuffs and alcoholic beverages are the largest product groups in terms of volume and these products’ primary destinations are Puget Sound and the Columbia River. Other relatively large product groups include chemical products and nonmetallic mineral products.
Imports and exports are both relatively unimportant in this trade corridor.
Southbound
Tonnage is concentrated in wood products (moved by truck) and newsprint/paper (split by rail and truck). Both product groups originate primarily in the Oregon and Washington remainder regions. Other smaller concentrations are in non-metallic mineral products and base metals (Puget Sound), other agricultural products and meat/seafood (Washington remainder), and other foodstuffs (processed food, Puget Sound, and the Columbia River).
Imports to San Francisco through the PNW region ports are tiny, as are exports from the PNW region out of San Francisco.
2.3.5.4 San Pedro Bay – San Diego
The Los Angeles/San Diego freight corridor is one of the shortest in terms of distance but one of the largest in terms of total volume and value. The highway distance between Long Beach and San Diego is about 120 miles and the vast majority, if not all, of the cargo moves by truck.
Southbound freight flows include over a million tons of imports through Los Angeles into San Diego while exports out of Los Angeles through San Diego are minimal. Domestic cargoes are about ten times the tonnage of International cargoes.
Figure 2-8 San Francisco to Pacific Northwest
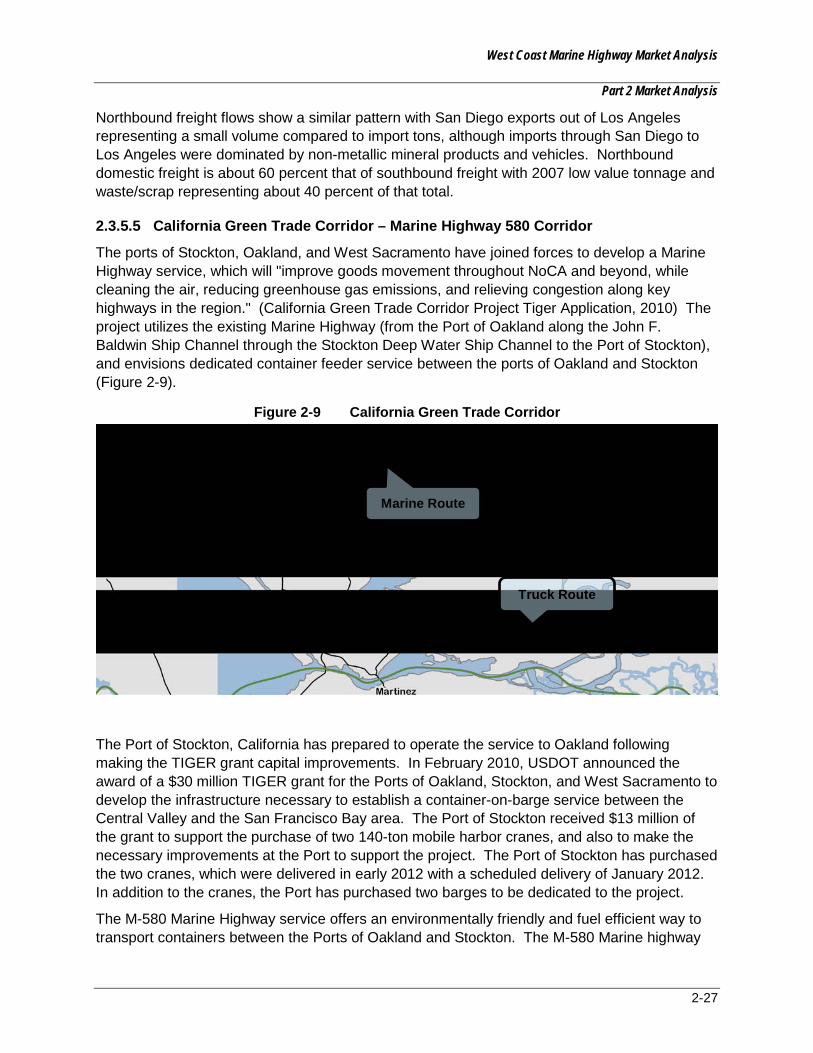
West Coast Marine Highway Market Analysis
Part 2 Market Analysis
2-27
Northbound freight flows show a similar pattern with San Diego exports out of Los Angeles representing a small volume compared to import tons, although imports through San Diego to Los Angeles were dominated by non-metallic mineral products and vehicles. Northbound domestic freight is about 60 percent that of southbound freight with 2007 low value tonnage and waste/scrap representing about 40 percent of that total.
2.3.5.5 California Green Trade Corridor – Marine Highway 580 Corridor
The ports of Stockton, Oakland, and West Sacramento have joined forces to develop a Marine Highway service, which will "improve goods movement throughout NoCA and beyond, while cleaning the air, reducing greenhouse gas emissions, and relieving congestion along key highways in the region." (California Green Trade Corridor Project Tiger Application, 2010) The project utilizes the existing Marine Highway (from the Port of Oakland along the John F. Baldwin Ship Channel through the Stockton Deep Water Ship Channel to the Port of Stockton), and envisions dedicated container feeder service between the ports of Oakland and Stockton (Figure 2-9).
Figure 2-9 California Green Trade Corridor
The Port of Stockton, California has prepared to operate the service to Oakland following making the TIGER grant capital improvements. In February 2010, USDOT announced the award of a $30 million TIGER grant for the Ports of Oakland, Stockton, and West Sacramento to develop the infrastructure necessary to establish a container-on-barge service between the Central Valley and the San Francisco Bay area. The Port of Stockton received $13 million of the grant to support the purchase of two 140-ton mobile harbor cranes, and also to make the necessary improvements at the Port to support the project. The Port of Stockton has purchased the two cranes, which were delivered in early 2012 with a scheduled delivery of January 2012. In addition to the cranes, the Port has purchased two barges to be dedicated to the project.
The M-580 Marine Highway service offers an environmentally friendly and fuel efficient way to transport containers between the Ports of Oakland and Stockton. The M-580 Marine highway
Truck Route
Marine Route

West Coast Marine Highway Market Analysis
Part 2 Market Analysis
2-28
will help reduce congestion along the M-580/I-5 corridors and the improve air quality and public safety in the region.
In addition to the environmental benefits, this project will also provide efficiencies and cost savings to potential M-580 customers. According to the Port of Stockton, the I-580 between the ports of Oakland and Stockton is one of the most congested highways in the state.
The M-580 will serve as an overweight corridor offering cost savings to exporters by allowing them to load containers to full capacity reducing the number of containers required and will mitigate wear and tear on roadways and bridges. The M-580 will be a cost competitive and effective long-term logistics solution offering great benefits to customers
The Port of Stockton has pointed to factors that are important in establishing the M-580 service and in securing a TIGER Grant that could prepare infrastructure in all three ports to support the operation:
• Tremendous growth in population in California’s Central Valley increasing demand for consumer goods,
• Establishment of warehousing, distribution, and other logistic related business,
• Low land value,
• Available work force,
• Transportation connections--rail (two class one yards in close proximity to the port) and interstates running east/west and north/south,
• Increasing congestion on the major interstates connecting the port of Oakland to distribution centers,
• The need to move overweight containers, and
• TIGER grant funding ($30 million total to the three ports).
The strong leg is on the export side where cargoes from the San Joaquin Valley include agricultural, as well as food and beverage products. On the inbound side, there is the potential for local consumer good consumption, as well as regional distribution, with increasing interest in distribution centers. One major importer (20000 boxes) has already been identified.
The 580 Corridor project may present a useful case study for future Marine Highway service opportunities. As the program is implemented, its operational and financial results, as well as its acceptance in the market place will be of keen interest to all Marine Highway stakeholders and prospective investors. Moreover, it will be useful to better understand to what extent the M-580 Marine Highway corridor has unique attributes, or it can be used as a model for other potential Marine Highway services.
2.4 CONCLUSION The Market Analysis chapter has pointed to a number of domestic and international cargo moves that potentially represent viable volumes for a prospective Marine Highway service. Interest in a Marine Highway service option may come from either the shipper or the carrier.

West Coast Marine Highway Market Analysis
Part 2 Market Analysis
2-29
For the movement of domestic cargoes, the shipper will largely determine whether or not a Marine Highway alternative is viable. For the transportation of international cargo between U.S. ports, both the carrier and the carrier's customers will determine if the Marine Highway presents attractive cost and service options. However, in the case of substituted service for international container moves, the economic interests of the ocean carrier could be the most important factor.
Market data necessary to identify and justify Marine Highway services is not ideal in terms of level of detail or predicting without question, specific commodities, and trade lanes that would directly lead to a successful Marine Highway service. However, when combined with an understanding of the competitive economics of existing surface transportation modes, which will be examined in Part 3, Operational Development, the high level market data obtained for this study can then be synthesized into discrete Marine Highway corridor options. That is, regardless of the potential market volumes, if the economics of a truck move (or the burden of the additional cost factors of a Marine Highway) present competitive hurdles that can't be cleared then more detailed market data will be irrelevant. The following chapter (Part 3-Operational Development) will outline the operational parameters required for a successful marine highway service and examine the operational costs of prospective marine highways indicated as potentially viable by the market data. This study also examines the operating characteristics including competitive pricing and service issues for the marine highway corridors identified in the RFP. The ensuing chapter, Part 4-Business Analysis, will take the results of Parts 2 and 3 (and the Part 5 Environmental Assessment) and synthesize them into conceptual business plans, including a gap analysis, to identify and prioritize prospective marine highway services on the west coast.
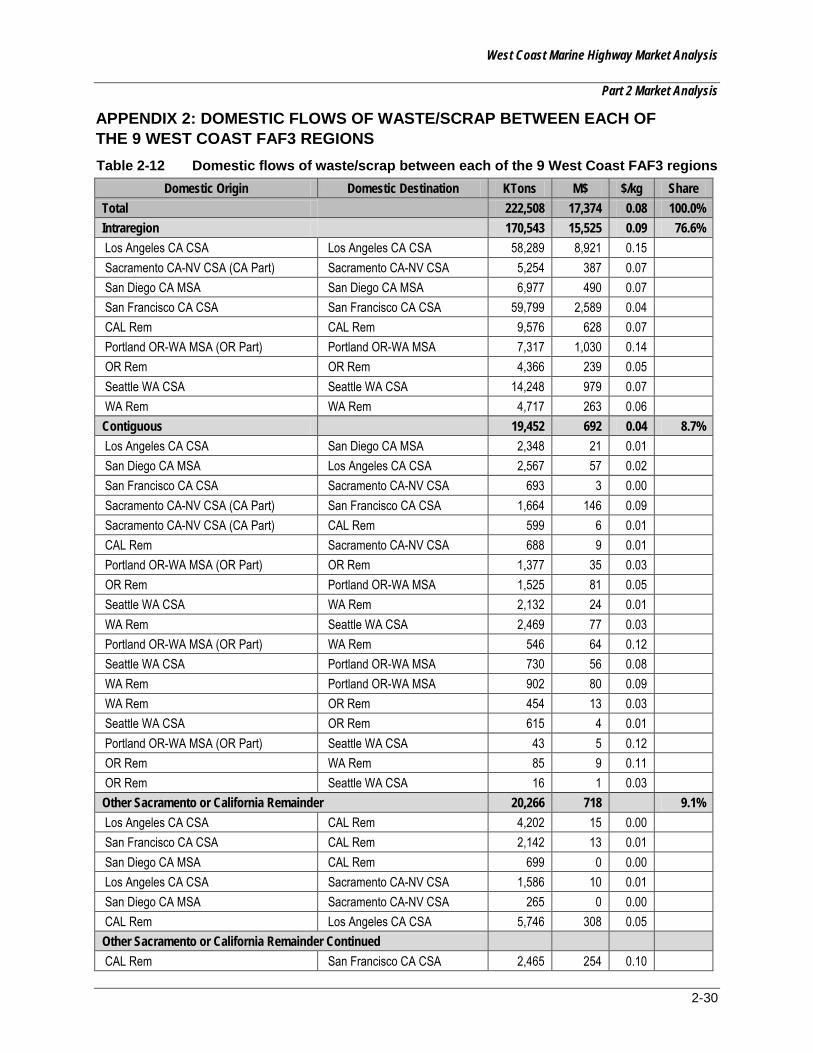
West Coast Marine Highway Market Analysis
Part 2 Market Analysis
2-30
APPENDIX 2: DOMESTIC FLOWS OF WASTE/SCRAP BETWEEN EACH OF THE 9 WEST COAST FAF3 REGIONS Table 2-12 Domestic flows of waste/scrap between each of the 9 West Coast FAF3 regions
Domestic Origin Domestic Destination KTons M$ $/kg Share Total
222,508 17,374 0.08 100.0%
Intraregion
170,543 15,525 0.09 76.6% Los Angeles CA CSA Los Angeles CA CSA 58,289 8,921 0.15
Sacramento CA-NV CSA (CA Part) Sacramento CA-NV CSA 5,254 387 0.07 San Diego CA MSA San Diego CA MSA 6,977 490 0.07 San Francisco CA CSA San Francisco CA CSA 59,799 2,589 0.04 CAL Rem CAL Rem 9,576 628 0.07 Portland OR-WA MSA (OR Part) Portland OR-WA MSA 7,317 1,030 0.14 OR Rem OR Rem 4,366 239 0.05 Seattle WA CSA Seattle WA CSA 14,248 979 0.07 WA Rem WA Rem 4,717 263 0.06 Contiguous
19,452 692 0.04 8.7%
Los Angeles CA CSA San Diego CA MSA 2,348 21 0.01 San Diego CA MSA Los Angeles CA CSA 2,567 57 0.02 San Francisco CA CSA Sacramento CA-NV CSA 693 3 0.00 Sacramento CA-NV CSA (CA Part) San Francisco CA CSA 1,664 146 0.09 Sacramento CA-NV CSA (CA Part) CAL Rem 599 6 0.01 CAL Rem Sacramento CA-NV CSA 688 9 0.01 Portland OR-WA MSA (OR Part) OR Rem 1,377 35 0.03 OR Rem Portland OR-WA MSA 1,525 81 0.05 Seattle WA CSA WA Rem 2,132 24 0.01 WA Rem Seattle WA CSA 2,469 77 0.03 Portland OR-WA MSA (OR Part) WA Rem 546 64 0.12 Seattle WA CSA Portland OR-WA MSA 730 56 0.08 WA Rem Portland OR-WA MSA 902 80 0.09 WA Rem OR Rem 454 13 0.03 Seattle WA CSA OR Rem 615 4 0.01 Portland OR-WA MSA (OR Part) Seattle WA CSA 43 5 0.12 OR Rem WA Rem 85 9 0.11 OR Rem Seattle WA CSA 16 1 0.03 Other Sacramento or California Remainder 20,266 718
9.1%
Los Angeles CA CSA CAL Rem 4,202 15 0.00 San Francisco CA CSA CAL Rem 2,142 13 0.01 San Diego CA MSA CAL Rem 699 0 0.00 Los Angeles CA CSA Sacramento CA-NV CSA 1,586 10 0.01 San Diego CA MSA Sacramento CA-NV CSA 265 0 0.00 CAL Rem Los Angeles CA CSA 5,746 308 0.05 Other Sacramento or California Remainder Continued
CAL Rem San Francisco CA CSA 2,465 254 0.10

West Coast Marine Highway Market Analysis
Part 2 Market Analysis
2-31
Domestic Origin Domestic Destination KTons M$ $/kg Share CAL Rem San Diego CA MSA 727 2 0.00
Sacramento CA-NV CSA (CA Part) Los Angeles CA CSA 1,559 1 0.00 Sacramento CA-NV CSA (CA Part) San Diego CA MSA 264 0 0.00 Sacramento CA-NV CSA (CA Part) Portland OR-WA MSA 335 75 0.22 Sacramento CA-NV CSA (CA Part) OR Rem 167 25 0.15 Sacramento CA-NV CSA (CA Part) Seattle WA CSA 0 0 0.09 Sacramento CA-NV CSA (CA Part) WA Rem 47 8 0.17 CAL Rem Portland OR-WA MSA 6 0 0.06 CAL Rem OR Rem 36 4 0.11 CAL Rem Seattle WA CSA 1 0 0.10 CAL Rem WA Rem 7 1 0.14 Portland OR-WA MSA (OR Part) Sacramento CA-NV CSA 0 0 0.03 Portland OR-WA MSA (OR Part) CAL Rem 0 0 0.07 OR Rem Sacramento CA-NV CSA 2 0 0.06 OR Rem CAL Rem 6 0 0.08 Seattle WA CSA Sacramento CA-NV CSA 0 0 0.06 Seattle WA CSA CAL Rem 2 1 0.40 WA Rem Sacramento CA-NV CSA 0 0 0.06 WA Rem CAL Rem 3 0 0.07 To Los Angeles - Coastal Long Distance 4,916 112
2.2%
San Francisco CA CSA Los Angeles CA CSA 4,834 9 0.00 Portland OR-WA MSA (OR Part) Los Angeles CA CSA 27 22 0.81 Seattle WA CSA Los Angeles CA CSA 20 70 3.48 WA Rem Los Angeles CA CSA 30 4 0.13 OR Rem Los Angeles CA CSA 5 7 1.49 To San Francisco - Coastal Long Distance 5,777 170
2.6%
Los Angeles CA CSA San Francisco CA CSA 4,941 164 0.03 San Diego CA MSA San Francisco CA CSA 820 3 0.00 Portland OR-WA MSA (OR Part) San Francisco CA CSA 0 0 0.06 OR Rem San Francisco CA CSA 3 0 0.09 Seattle WA CSA San Francisco CA CSA 9 2 0.22 WA Rem San Francisco CA CSA 3 1 0.31 To San Diego - Coastal Long Distance
819 0
0.4%
San Francisco CA CSA San Diego CA MSA 819 0 0.00 Portland OR-WA MSA (OR Part) San Diego CA MSA 0 0 0.00 OR Rem San Diego CA MSA 0 0 0.08 Seattle WA CSA San Diego CA MSA 0 0 0.09 WA Rem San Diego CA MSA 0 0 0.07 Other Coastal Long Distance - California to PNW 736 156
0.3%
Los Angeles CA CSA WA Rem 321 98 0.30 Los Angeles CA CSA OR Rem 325 45 0.14 Los Angeles CA CSA Portland OR-WA MSA 17 5 0.29

West Coast Marine Highway Market Analysis
Part 2 Market Analysis
2-32
Domestic Origin Domestic Destination KTons M$ $/kg Share Los Angeles CA CSA Seattle WA CSA 0 0 0.06
San Diego CA MSA Portland OR-WA MSA 2 0 0.00 San Diego CA MSA OR Rem 2 0 0.00 San Diego CA MSA Seattle WA CSA 0 0 0.09 San Diego CA MSA WA Rem 0 0 0.10 San Francisco CA CSA Portland OR-WA MSA 64 8 0.13 San Francisco CA CSA OR Rem 5 0 0.00 San Francisco CA CSA Seattle WA CSA 0 0 0.08 San Francisco CA CSA WA Rem 0 0 0.08 Notes:
KTons – kilotons M$ – mean value $/kg – dollars per kilogram
WA Rem – Washington remainder OR Rem – Oregon remainder CA Rem – California remainder
West Coast Marine Highway Market Analysis
Part 2 Market Analysis
2-33
[This page intentionally left blank.]
West Coast Marine Highway Market Analysis
Part 3 Operational Development
3-1
3.0 OPERATIONAL DEVELOPMENT
3.1 INTRODUCTION Part 2 identified several key parameters necessary for the foundation of a viable Marine Highway service. These factors included addressing a number of critical financial and operational requirements. This section, Part 3, examines realistic yet simplified cost structures derived from those key parameters and applies them with the Marine Highway port pairs the study team identified based on the market data generated for Part 2. The goal of Part 3 is to present a market-based analysis that will reveal a realistic platform for a viable Marine Highway service.
Part 4 expands on cost analysis and revenue opportunities for those services that “survive” the analysis in this section in order to develop a basic, rudimentary business plan. Part 4 will also address the costs and marginal impacts of certain key public policies on the economics of prospective Marine Highway services, including the extent that associated costs or inefficiencies affect the competitiveness of the Marine Highway service.
The potential Marine Highway service port-pairs that will be assessed in Part 3 are:
• San Diego – San Pedro Bay,
• San Pedro Bay – San Francisco Bay,
• San Pedro Bay – Pacific Northwest,
• San Francisco – Pacific Northwest,
• West Coast Hub – Feeder Service, and
• Golden State Marine Highway.
Most of these port pairs have the required minimum threshold of potential cargoes their service can attract, provided the economic factors do not present overwhelmingly uncompetitive conditions. The California Green Trade Corridor (the M-580 Corridor) will not be analyzed in Part 3 as a result of its timing, and the due diligence that was being conducted during the study period.
3.2 MARINE HIGHWAY SUCCESS FACTORS During the course of the evaluation of potentially viable Marine Highway services, a number of attributes for success in this business sector were identified. These factors are discussed below. They are germane to current market and policy conditions that individually and collectively can create a favorable climate for prospective Marine Highway services to succeed in the marketplace. It should be noted that factors that have been instrumental in the success of certain unique Marine Highway services will not be analyzed. Examples of such Marine Highways include the Alaskan coastwise trades now being plied by Totem Ocean Trailer Express (TOTE) and Northland Services, both of which have no viable surface transportation alternative. Additionally, in the case of Northland Barge the operation is nonunion, which runs counter to the assumptions made at the outset of this study.
West Coast Marine Highway Market Analysis
Part 3 Operational Development
3-2
The success factors identified are relevant to the long term business viability of a Marine Highway service, not just as a "startup”. While upfront public assistance might be available and appropriate to jump start a Marine Highway service and secure a position for it in the market, longer term public subsidies supporting operations are not considered relevant to this study’s goals. It is important to keep these attributes in mind in the discussion of prospective Marine Highway port pairs and the objective to identify realistic, viable business opportunities.
3.2.1 Marine Highway Vessel Characteristics
To the extent that the Marine Highway route will include transits in ocean waters, the vessel will need to be robust and of a size to support the rigors of this activity safely for both shipboard labor and cargo. Regardless of whether towed deck barges, tug/barge combinations, container vessels, Ro/Ro vessels or a combination of any of the above is utilized as a conveyance, the design and operational concerns associated with ocean voyages, even if coastwise, should be considered. For purely inland or river passages ("crossings"), such as the M-580 corridor, these concerns are obviously mitigated.
Further, the costs associated with these conveyances are not trivial and scale of operations is essential to spread cost factors over a broad potential freight population that can be competitively carried. This would generally indicate that Marine Highway vessels cannot and would not be able to stop in locations for relatively small amounts of cargo. The out of route cost of the conveyance, the time and cost for docking and preparing for cargo operations coupled with the cost of resuming the trip are substantial and should be realistically considered. Nonetheless, there may be opportunities to gain overall market share and eventual profitability maintaining service to multiple ports even where some of those legs are not individually viable. Such a "systems approach" needs to be assessed. The role of public support may need to be greater to support the specific lanes that need subsidy. With non-viable lanes and public subsidies, the risk to the private investor may also be greater given the vagaries of public support of non-compensatory business ventures.
The speed characteristics of various vessel types will be a major factor in costs considerations, as well as service factors. Fuel efficiency will be a prime concern. However, while barges and tug barge combinations may be the most efficient from a fuel consumption point of view, their relatively slow speed may create competitive concerns. Load line vessels, while providing more speed, have higher manning requirements as well as greater fuel consumption. As domestic routes must respect domestic vessel eligibility requirements, vessel availability is also a consideration. The engine technology aboard the existing container and Ro/Ro vessels eligible for domestic shipping is often less fuel-efficient than newer available technologies, and the capacity of those vessels is likely not right-sized for developing Marine Highway markets. The cost of the newer vessels, even with their greater fuel efficiencies, may not, however, be practical for Marine Highway service applications due to the cost of construction.
In most applications, deck barges are suitable only for inland waterways or relatively benign short-sea routes. At an average speed of six knots, any port-to-port distance over about 120 nautical miles creates the strong potential of a non-competitive commercial environment. Deck barges are just too slow to be competitive over the distances considered. Distances that can be covered by trucks in three or four hours will require 24 hours or more for deck barges.
West Coast Marine Highway Market Analysis
Part 3 Operational Development
3-3
For articulated tug and barge (ATB) technologies, the speed of the conveyance essentially doubles the deck barge unit to achieve approximately 12 knots. Moreover, seaworthiness is enhanced. As such, the distance that an ATB can cover competitively substantially expands the potential service range. However, there appears to be no container or Ro/Ro ATB assets in the U.S. domestic fleet at this time. Therefore, capital will be required to secure new builds or major modifications to existing barges.
Load line vessels with speeds between 14 and 24 knots provide the best service profile as well as sea keeping considerations for ocean voyages. However, vessel costs as well as fuel cost per mile at various speeds becomes a major concern. Vessel size and draft as well as operational characteristics to include cranes, thrusters, and crew size will all affect the cost parameters of a service using these vessels, as well.
Although a tug and barge operation is operationally feasible, the most commercially viable Marine Highway service vessel at this point in time would appear to be a modest sized cellular container vessel or a combination lift on/lift off (Lo/Lo) and roll on/roll off (Ro-Ro) vessel built to specifications that would include:
• Best in class fuel efficiency,
• Thrusters for maneuverability,
• Unattended engine room technology,
• Gearless and hatchless for landside operational efficiencies, and
• Some Ro/Ro space for trailers and over-sized cargoes.
Assets such as these would need to be constructed in United States yards in order to be eligible to carry U.S. domestic cargoes. The earliest any such tonnage could be available would likely be late 2014 or early 2015. In the interim, existing vessel capacity would need to be utilized.
3.2.2 Revenue Cargo
Marine Highway service routes will generally need to concentrate on ports and proximate regions with sufficient levels of available cargo that can move competitively considering transit time, price, and service requirements, specifically the issue of reliable vessel sailings.
These cargoes can be either international or domestic in nature, or a combination. There may be certain volumes of cargo that tend to utilize rail (considering the aggressive position Union Pacific is taking for longer north/south routes) that could shift to a Marine Highway but the majority of cargoes convertible to this new mode will shift from highways.
The first concern of any Marine Highway business should be to attract revenue-producing cargoes to support their operations. While this appears to be a simplistic statement, cargoes that will fit into Marine Highway service applications are not always obvious given price, transit time needs, and other service considerations.
The most obvious Marine Highway cargoes will be those already at the marine facilities. In most cases this will be international import and export freight. These cargoes will likely be loaded in 20, 40, or 45-foot international container assets. As these cargoes are already at a marine facility the costs of moving them to or from a marine facility may not be a major issue

West Coast Marine Highway Market Analysis
Part 3 Operational Development
3-4
depending on specific terminals served in the larger multi-terminal gateway ports such as the ports of Los Angeles and Long Beach. Furthermore, this freight is already loaded onto a Marine Highway container. On most Marine Highway routes, these cargoes, whether import or export, form a viable “base” cargo to be considered.
As these international container cargoes usually transit major marine facilities such as the ports of Los Angeles, Long Beach, Oakland, Seattle, Tacoma, and Vancouver, a viable Marine Highway application would likely include, at least on one end, one of these ports. While this freight category is already at a port, it may need to be relocated based upon actual terminal location, especially in the larger ports. This will add complexity and cost. Likewise these cargoes, based upon their specific characteristics will have price considerations versus competitive truck transport and require varying levels of service, including, in particular, transit time demands.
In general, a viable Marine Highway service will attract international cargoes (for overseas shipment) that are not time sensitive, are bulky or heavy, and load in 40-foot container assets. This pertains to both import and export cargoes. However, while many suggest that a Marine Highway service could provide an option to load containers heavy, care should be taken not to exceed safe container, crane and vessel design limits and the drayage weight limits as adding an overweight permit to the dray will be cost prohibitive. In addition, balancing container fleet types and container inventories can be a challenge and will need to be resolved for the Marine Highway service to be successful.
For Marine Highways that link major container ports, international container cargo will comprise the “base” cargo. It is likely, however, that substantial volumes of domestic cargo will be needed to make the service financially viable. Other Marine Highway services, for example, those that connect relatively smaller ports or one major container port and a smaller, may find the domestic market generating the majority of the cargo volume. In either case, it should be noted that the domestic markets are now fairly well standardized on 53-foot assets. Thus for Marine Highway services, unless some Ro/Ro space is available, domestic cargoes, unlike international cargoes, would need to be loaded into domestic 53-foot containers. As the North American intermodal markets continue to gravitate toward 53-foot domestic boxes, the supply will continue to increase so that Marine Highway service needs should be able to be accommodated in the medium to long term.
One concern for Marine Highway service operators will be the standards to which the relatively new 53-foot containers are manufactured and whether they comply with international Convention for Safe Containers (CSC) regulatory requirements. In general, the domestic 53-foot container equipment is lighter, has lower racking strength tolerances, and is not yet certified for sea transport. This is an area that needs further examination from a regulatory and international convention standpoint. However, considering the above statement, several carriers (ocean and rail) are now starting an aggressive roll out of sturdy 53-foot boxes that can be used on ocean trips, double stack rail and stacked more than three high in a terminal.
Price, service, and transit time are critical for Marine Highway services to attract domestic cargoes from existing highway and to a lesser degree rail routes. Targeted cargoes would include those currently moving over congested routes such as the I-5, I-710, and I-580. Furthermore, longer distance routes over congested interstates and secondary two or four lane

West Coast Marine Highway Market Analysis
Part 3 Operational Development
3-5
state highways may form a domestic cargo base. Normally, cargo origins and destinations relatively near the marine facilities will be favored from a cost perspective. In addition, locations that “extend or stretch” the Marine Highway on land will prove economically beneficial. For example, on a Marine Highway route between San Pedro and Oakland, cargo origins/destinations south of San Pedro and north of Oakland have higher probabilities of success due to the cost of local drayage to and from the marine facility and the added long haul trucking costs associated with the greater or “extended” distance. To compete effectively with truck or rail, the route should be “stretched” as opposed to compressed, especially for shorter distanced port pairs, as competing truck routes are generally mileage and time cost-based.
Other specialized over-the-road assets such as tanks, garbage or scrap haulers, cement trucks, or flatbeds will not be easily accommodated by Marine Highway services unless Ro/Ro ships or ATBs are constructed. In some cases, where volumes are exceptionally high for cargoes such as garbage and scrap, specialized services generally utilizing cheaper (and slower) deck barges may be appropriate. See below for additional discussion of these cargoes.
3.2.3 Marine Facilities
Marine Highway service applications will require marine terminal facilities to support the conveyance type chosen for the service. Berths should be available as necessary to accommodate Marine Highway vessels on a “just-in-time” basis. The transit time and service certainty provided by truck and rail will need to be matched as much as possible. Consistency of operations is a prime consideration as today’s sophisticated supply chains, even for less time sensitive cargoes, still demand a reliable, consistent service, day in day out. Stochastic (e.g., induced port calls) service offerings will not survive as the basis of any given Marine Highway service.
The marine terminal will need to have cranes or ramps to service the vessels. Ideally landside gantries would be available to enhance productivity. Mobile harbor cranes represent viable alternatives although productivity for these assets can be up to 30 percent lower than for fixed cranes.
The terminal also needs gates and staging areas to accommodate domestic and international Marine Highway cargoes. As the documentation for domestic is not as complex as international, some differentiation of process will be appropriate and desired from a cost and effort point of view.
The needs and expectations of the customer of Marine Highway services as a new entrant into the transportation market should be recognized in the operations of the marine terminal, especially for domestic cargoes. Cargo cut-offs, which in the international trades are normally a day prior to vessel sailing, will need to be compressed to an hour or so prior to sailing. This adds complexity, and commensurate costs, especially in larger ports. Domestic operations may also require extended terminal operating hours, which can represent an additional cost burden.
3.2.4 Port Loading and Unloading Costs
A primary cost for any Marine Highway service is the cost of loading and discharging the conveyance. Port loading and unloading costs are influenced by factors such as the cost of the capital equipment used to unload vessels (i.e., cranes) as well as port labor costs.

West Coast Marine Highway Market Analysis
Part 3 Operational Development
3-6
On the United States West Coast, port labor is primarily provided by the Pacific Maritime Association (PMA) using ILWU members. Work rules, pay, and benefit rates are specified by a Coastwise Master Contract between the PMA and the ILWU. The ILWU is responsible for almost all port related work between the United States/Canadian border and the United States/Mexican border. Marine Highway Service operators will therefore utilize ILWU labor (just as all the vessels will employ U.S. mariners).
Smaller ports are assumed to have slightly lower port costs than the larger ports such as Los Angeles/Long Beach, Oakland, Seattle, and Tacoma, but only marginally. The best hope for cost reduction may be at the gates, where Marine Highway operations may require greater flexibility and expanded hours than is generally the case for international traffic.
3.3 IMPACTS OF RELEVANT PUBLIC POLICIES The potential success of a Marine Highway service will be affected by costs incurred from a number of public policy issues that have been noted throughout this analysis. These include public fees that raise costs for shippers, such as the Harbor Maintenance Tax, and other federal government regulations governing vessel operations. Vessel availability and construction are also impacted by U.S. public policy, as previously discussed. These costs are all taken into account in the assumptions listed below.
3.3.1 Limitations on Vessel Eligibility for U.S. Domestic Maritime Service
Vessel eligibility requirements for participation in U.S. domestic maritime service means that there is a limited pool of vessels available to provide Marine Highway Service. These requirements are set in U.S. cabotage laws, as explained in the Maritime Administration's policy paper on United States cabotage law:8
"Cabotage laws date back to the earliest days of our history. In 1789, Congress imposed added duties on goods transported by foreign vessels. The Navigation Acts of 1817 barred foreign vessels from domestic commerce. In 1886, Congress extended cabotage laws to passenger vessels, and in 1905 Congress retained United States build requirements for domestic shipping. The [Jones Act] was enacted with the aim of maintaining a merchant marine of the best equipped and most suitable types of vessels owned and crewed by United States citizens, sufficient to carry the greater portion of United States commerce and serve as a naval or military auxiliary at time of war. Section 27 of that Act is known as The Jones Act Together with the Passenger Vessel Services Act of1886, it reserves marine transportation of freight and passengers to United States built, maintained, documented, owned, and crewed vessels. Similar laws cover dredging in United States waters and towing and salvage operations."
The majority of the Marine Highway services, by definition, must use vessels that are eligible for shipping cargo domestically under the requirements of the Jones Act, described above. The study team identified few eligible vessels that have Ro/Ro, Lo/Lo, or combination capability, and those vessels were not built with Marine Highway Service needs in mind.
8 www.marad.dot.gov/documents/cabotagelaws.pdf
West Coast Marine Highway Market Analysis
Part 3 Operational Development
3-7
While there are eligible deck barges and tugs available for use in U.S. coastal shipping, there are no known ATBs that are available for Ro/Ro, Lo/Lo, or combination deployment. Existing ATBs would require extensive modification to fill the roles contemplated.
Building new vessels seems to provide the best long-term opportunity to acquire vessels that meet the needs of potential Marine Highway Services. In light of the cost of vessel construction and the lead time necessary to build new vessels, this is a matter that might require additional consideration by the public and private sectors.
These matters are examined more closely in the business cases, but some level of public construction or financial assistance may be desired by some private sector interests that are considering building new vessel assets, whether load line or ATB, for Marine Highway application. To further explore opportunities for building vessels more suited to Marine Highway Services, the Maritime Administration published an AMH Design Project (October 2011) that explores options for building new dual-use vessels.
3.3.2 Shipping Cost Impacts of the Harbor Maintenance Tax
The HMT is an ad valorem tax established by Congress in the Water Resources Development Act of 1986 (PL 99-662) that took effect in 1987. Initially a charge of 0.04% on the value of international, export, and domestic cargo and cruise ship passenger tickets, the HMT’s current level of 0.125% of cargo value was set in 1991. The HMT is collected by Customs and Border Protection on commerce in coastal and certain river ports where United States Army Corps of Engineers (USACE) maintains channels that are not part of the inland waterway system.
The stated purpose of the user charge is to offset the cost of Federal channel maintenance dredging and related costs. Certain cargo (e.g., fish), types of vessels (e.g., ferries), and trade routes (e.g., Hawaii), are exempt from the HMT. In 1998 the Supreme Court found the HMT unconstitutional as it was applied to United States exports. At this time, most HMT receipts from domestic cargo are collected on bulk commodities (e.g., petroleum), which dominate domestic shipments. In fiscal year 2009, HMT collections on all domestic cargo amounted to 8% of total HMT receipts.
The cost of the HMT is determined by the value of the freight itself. For example, a container with $100,000 in cargo would have an additional $125.00 in transportation costs directly charged to the cargo owner. Payment of the HMT in the instance of domestic moves is made quarterly by the cargo owner. Imported cargo when transshipped to a second vessel pays first on the import move and a second time on the domestic move.
As an ad valorem tax, the HMT is predicated upon the value of the goods shipped and can therefore have a broad spectrum of effect on the transportation cost of all but the export and intra port moves. When this tax is applied to relatively short or medium haul Marine Highway transits of products with a release valuation over $50,000 per unit, it creates a potentially significant financial burden on the system. This is further intensified by the fact that there is no comparable tax on the truck or rail modes with which Marine Highway Services may compete.
West Coast Marine Highway Market Analysis
Part 3 Operational Development
3-8
3.3.3 Port Pricing Models
Public Port Authority Pricing
United States port authorities on the west coast are established by state law and serve as political divisions of municipalities (e.g., California) or as independent political jurisdictions (e.g., Washington and Oregon). In all cases, public port authorities are established to promote, protect, and enhance the public's interest in commerce. As public enterprises, they are tasked to operate in business-like fashion. Most port capital expenditures are sourced through debt and retained earnings. However, all major public port investment is supported to some degree by the public taxpayer, whether that takes the form of direct grants, tax exempt bonding authority, or exclusion from business taxes. As indicated above, a public port generates revenue through ground rents, dockage, and wharfage and other related fees.
The U.S. West Coast port industry is highly competitive. New business is coveted, especially for the medium to smaller ports. This analysis shows port dockage and wharfage charges can be an important component of overall Marine Highway service cost structure. The potential for port authorities to price their facilities and services in such a way to attract new Marine Highway services will be further discussed and analyzed in Part 4.
3.4 ASSUMPTIONS The following reflects the assumptions that were made as the work product for Part 3 was developed. These assumptions provide the basis for the review of each of the port pairs examined.
Modal alternatives –Marine Highway services operating along the M-5 Corridor would primarily supplement existing highway movements. To a lesser degree they would offer an alternative to rail routes now being developed, especially between longer distance port pairs, and more specifically the new service being provided by the Union Pacific from the PNW to SoCal. Several interviews with truckers and intermodal marketing companies (IMC) indicated that Union Pacific’s current rate structure appears to be aggressively targeting truck flows in the longer haul U.S. West Coast corridors, seeking to match truck rates and service along the I-5 corridor. The impact of this rail activity should be considered especially over the next five years. In general, the rail target market should be similar to the Marine Highway freight market, that is, low to medium value, non-time sensitive cargoes. However, rail service can increase delivery time by at least an extra day over trucking. In addition, there are incremental cost factors (drays, chassis, etc.) that will increase the all-in rail rate. Finally, rail rates are structured on a highly individual basis, with each corridor's rates developed based on the requirements of the route, competitive factors, and the needs of the route's shippers/IMCs.
On one hand, the Marine Highway service might be viewed as being in competition with these rail and truck flows. Alternatively, certain truckers or IMCs may wish to avail themselves of Marine Highway service to move their product intermodally and thus become a customer of the Marine Highway. Such decisions will depend on the operational model for trucking or rail transportation. It may, for example, be cost effective for a trucking company to move long haul cargoes via a Marine Highway operator, allowing the trucking company to focus on shorter hauls and better equipment utilization. Today, most of this long-haul activity utilizes rail as the
West Coast Marine Highway Market Analysis
Part 3 Operational Development
3-9
more competitive mode. In the future the Marine Highway service could function as an alternative to both truck and rail, or serve as a partner to either.
Proximity to port – For both international and domestic cargo moves, the cost of the dray from/to the port is a critical competitive factor. For international cargoes, the distance and complexity of the transfer move between international and domestic terminals within the port may also present additional costs and service inefficiencies. Therefore, the distance between the port and potential cargo origin or destination is an important factor in identifying prospective cargoes for any given Marine Highway service. It is preferable for cargo to originate or be destined close to the port, thereby reducing drayage costs. In most large ports this distance is generally assumed to be a 25-mile radius around a port complex. In smaller ports without terminal and road access congestion this distance may expand to 30 to 35 miles or even more. There is, however, no defined, universal distance beyond which a dray renders any given Marine Highway service option noncompetitive other than the drayage company is looking for a maximum number of turns per day per truck. The dray characteristics and costs for each Marine Highway should be analyzed in the context of that service and its modal options.
International versus domestic cargo – International cargo currently moving through a given marine terminal facility serves as potential “base” cargo for a Marine Highway application. As the cargo is already at a marine terminal it is generally simpler and easier to move international containers than domestic cargo, unless it needs to be drayed to another terminal with the same port complex as the Marine Highway service would not stop at every terminal to pick up or drop off cargo. The international cargo can move directly to the Marine Highway feeder service. Domestic cargoes should be drayed to the marine terminal and then received and processed prior to loading and movement. However, the larger volumes of low value, non-time sensitive cargoes moving domestically also provide attractive opportunities.
Port and labor charges – Port and labor charges used for this analysis were based on 2011 rates. In the larger ports (e.g., Los Angeles/Long Beach, Oakland, Seattle/Tacoma) an all-in stevedoring rate of $180 per lift was made as part of the assumptions for this study. This includes all equipment costs as well as labor. This number can vary by 10-20 percent either up or down depending upon actual terminal conditions, overtime percentage, manning considerations and any number of other factors, and is based on a number of interviews with terminals and individuals familiar with ILWU/PMA labor practices.
In smaller ports a benchmark stevedoring number of $150 per lift was used. Again local conditions can affect the actual number but only within certain tolerances, which is assumed to be between 10-20 percent either up or down.
Pricing Model – It is assumes that a successful Marine Highway Service will operate at a price point that is below comparable current truck and rail services. Without a price advantage it is assumed that market inertia would not likely be overcome by a new Marine Highway service. A 20 percent pricing advantage in favor of the Marine Highway Service was chosen for this study. This target, while somewhat arbitrary and slightly higher than the literature indicates, has been substantiated in interviews and discussions with potential Marine Highway users, who identified a discount in that range as necessary to try an unproven, startup service for lower value, less time sensitive cargoes. For the more “premium” cargo, where service reliability and time to market is more critical, the cost savings may need to be higher than 20 percent for the total
West Coast Marine Highway Market Analysis
Part 3 Operational Development
3-10
system costs. Over time, given the presence of service reliability, consistency and quality and the acceptance of the Marine Highway service option in the marketplace, pricing discounts would likely be able to be reduced where the service competes on service reliability, performance, and costs. However, such acceptance could take a number of years.
Revenue – Revenue assumptions are based on an optimal scenario considering the application of pricing at a point 20 percent below the competitive trucking rate with 100 percent vessel utilization unless there are operational constraints given the specific port pair, which will be noted in the analysis. In some cases, revenues assumptions are set at 90 percent with 80 percent vessel utilization. No assumptions have been made with regard to market share and modal shift. The utilization assumptions are optimistic. The intention is to take these best-case revenue scenarios and match them with associated, realistic cost structures in order to determine which Marine Highway port pairs and corridors come closest to meeting a market test in as positive an economic context as possible. Sensitivity analyses based on adjustments to the values of key variables will be discussed in Part 4.
Route length – No initial assumptions regarding the most appropriate route length for efficient and competitive feeder operations have been made. Potential routes that appear favorable from both an international and domestic cargo perspective were considered. However, as noted above, the distinction was made that drayage of more than about 25 miles to/from a marine terminal (especially if the dray runs back in the direction of the port of lading) will most likely make many of the Marine Highway opportunities less competitive or more difficult to price.
Vessel-type – No initial assumptions regarding the best or most appropriate vessel type have been made. Existing deck barges, ATB units, and container vessels were examined. No assumptions were made in Part 3 regarding new vessel types that may or may not be built in the future. These investment issues will be reviewed in the business plans in Part 4. It should be noted that cost data for load line vessels, whether fully containerized, Ro/Ro or combination Ro/Ro and Lo/Lo, are essentially the same given the capacity assumed. The so called “Sun Ship” Ro/Ro, which is often today a combination vessel, was assumed to be the generic type for analysis although the study team assumed all slots would be Lo/Lo for stevedoring pricing simplicity. The study team also normalized capacity at 600 TEUs or 300 FEU units. For simplicity, this study largely focused on 40 foot boxes. The "Sun Ship" operating costs, including fuel, are generally equivalent to full container vessels of like capacity.
• For a U.S.-flag tug/deck barge combination that meets the eligibility requirements to carry U.S. domestic cargoes, a daily base cost of $7,200 plus fuel when underway is assumed. A 7,000 horsepower (hp) tug at about six knots burning 1.5 gallons/hp per day was used. At $3.00 per gallon for fuel, the cost is $31,500 per day when the vessel is underway. (Given today's volatile fuel market, this cost will likely increase substantially over the near term. Alternative power and fuel options should be considered.) Cargo capacity of the deck barge was assumed to be 600 TEUs (300 FEUs).
• For a U.S.-flag ATB vessels that meets the eligibility requirements to carry U.S. domestic cargoes, the charter rate is assumed to be $12,000 per day plus fuel. At a speed of about 12 knots, fuel consumption is estimated to be in excess of 30 tons of marine diesel oil (MDO) per day. At a current price of $950 per ton (November 1, 2011), daily fuel

West Coast Marine Highway Market Analysis
Part 3 Operational Development
3-11
costs will exceed $28,500 per day. These rates are estimations as there are no eligible ATBs outfitted appropriately as container or Ro/Ro vessels. These rates would likely pertain to modified units but not for new, purpose built ATBs. These issues will be further explored in Part 4. The ATB cargo capacity was considered to be 600 TEUs or 300 40-foot container units
• The load line U.S.-flag vessel that meets the eligibility requirements to carry U.S. domestic cargoes is assumed to be a generic container or Ro/Ro vessel with characteristics and costs currently associated with the Sun Class combination ships operated by the American Shipping Group (ASG) and others. The capacity is 600 TEU or about 300 FEU container units. The basic charter rate is $25,000 per day. Fuel costs would be based upon the following:
Table 3-1 Ponce Class Fuel Consumption Speed BBLS/NM BBLS/Hour BBLS/Day Metric tons/Day
12 1.1 13.2 316.8 48.98 13 1.15 14.95 358.8 55.48 14 1.2 16.8 403.2 62.35 15 1.25 18.75 450 69.58 16 1.3 20.8 499.2 77.19 17 1.4 23.8 571.2 88.33 18 1.5 27 648 100.2 19 1.55 29.45 706.8 109.29 20 1.6 32 768 118.77 21 1.7 35.7 856.8 132.49 22 1.8 39.6 950.4 146.96 23 1.9 43.7 1048.8 162.17
Note: BBLS – barrels NM nautical mile
• The fuel costs appear high when benchmarked against vessels with new engines, but the fuel costs are representative of vessels currently eligible to carry U.S. domestic cargoes. As there are very few vessels idle and available for charter, a prospective Marine Highway venture will need to consider building new vessel(s) in the medium to long term. Fuel costs represent a critical variable cost, which will be highlighted in Part 4.
Market size – No minimum market size assumptions are made. Given the broad range of the U.S. West Coast market options, emphasis is placed on any given port’s ability to anchor a port pair route and the relative wider marketplace that might then be served as identified in Part 2. However, the greater the market size served by a port pair, the greater the chance for long term success of the Marine Highway service.
Port to port versus multiple port calls – The economic and logistical challenges for a service making many port calls on a single voyage is clear. Business challenges are heightened with the introduction of the following variables: greater mix of cargoes, more ports requiring additional cargoes in order to sail with optimal load factors, need for continued service reliability with more port calls. Nonetheless, potential services were considered that involve both multiple port calls and more limited point-to-point service. Two of the proposed Marine Highway service corridors cited in the RFP involve multiple port calls, with a number of smaller ports within the
West Coast Marine Highway Market Analysis
Part 3 Operational Development
3-12
itinerary. Such routing requires more of a systems analysis, as opposed to an assessment that is based on the profitability of each leg. For each type of service, the feasibility analysis factors include geography, cost, and cargo type and availability. There is also an aspect of a “bus stop” service for a grouping of ports and/or terminals (such as in the Bay Area, the lower Columbia River, Puget Sound and Southern California) that could eliminate or reduce the drayage cost/distance to and from the marine terminal and the point of origin/delivery. However, such service may add terminal and vessel operating costs due to multiple port calls.
Wharfage Charges – A major cost element in any maritime movement is wharfage, or the cost generated to utilize the maritime facility and compensate the facility investor, either public or private for the terminal development. Historically these charges were almost always paid to a port under terms of a port tariff because most maritime facilities were built and developed by public port authorities. This is still the case in many environments. However the advent of large privately held container terminals which are leased from port authorities has transferred many of the wharfage payments to the private operators. Consequently the wharfage costs are often hidden in the total terminal charge (throughput) together with gate, equipment, and labor costs. This study differentiates between stevedoring and equipment costs and wharfage costs. Wharfage costs at the public terminals were estimated and port tariff costs were used in locations where the study team believed a Marine Highway conveyance may be stevedored at a public terminal. It must be noted that these costs can fluctuate greatly between published tariffs and ultimate negotiated terms.
Dockage – Dockage charges against the vessel, per the port tariff.
Harbor Maintenance Tax - Interestingly, there is no definitive calculation on the average amount of HMT assessed on container imports. Estimates on the average HMT assessment per container varies but has been cited as being in the range of $12-$350 per container depending on the cargo value (Peter Leach, JOC, 10-3-11). Information received from the USACE, Waterborne Commerce Statistics Center, reveals that the past five year average value of United States containerized imports on all coasts is just under $30,000/TEU, which equates to $37.50/TEU in HMT fees. Major importers indicated that the fee is approximately $70/container. Recent information from the ports of Long Beach and Tacoma placed the fee at $55/TEU and $50/TEU, respectively. In consideration of all above, and in keeping with conservative pricing model, for the purposes of this study, an average HMT assessment was assumed to be $37.50/TEU, or $75/FEU.
PierPASS9 - PierPASS adds $60/TEU or $120/FEU (effective August 1, 2011). However, the percentage of potential Marine Highway cargo that will be subject to PierPASS can only be estimated. Consequently, PierPASS charges will be shown as “to be determined” in the tables of cost factors for cargoes that transit the San Pedro Bay ports.
9 PierPASS is a not-for-profit company created by marine terminal operators at the ports of Los Angeles and Long Beach in 2005 to address multi-terminal issues such as congestion, security, and air quality. PierPASS was initiated by San Pedro Bay ports terminal operators through their FMC approved industry association, the West Coast Marine Terminal Operators Association (WCMTOA). Under the program, all international container terminals in the two ports established five new shifts per week. PierPASS is specifically designed to pass the costs of extra gate hours to the BCOs and relieve congestion on port-connecting highways
West Coast Marine Highway Market Analysis
Part 3 Operational Development
3-13
3.5 PORT PAIR ANALYSIS
3.5.1 Introduction
This section examines the port pairs identified in Part 2 in depth and reviews cost and service options as compared to competing modal operations. Part 4 expands on this analysis for selected port pairs including a complete range of issues and critical success factors. The discussion will center on changes in the operating and cost areas that may be necessary to render some of these port pairs potentially viable from a cost and revenue perspective. The study will then move to the next level and develop conceptual business plans for potentially viable marine highway services. These plans will consider the longer term commercial viability of certain of the port pairs that appear to have possibilities from a cost and revenue perspective. As previously discussed in Part 2, the potential marine highway cargoes being analyzed, from a business viability perspective, have the ability to use competitive modes of transportation. Specialty cargoes such as hazardous materials, garbage, or captured bulk materials, including waste and scrap, have very specific economic drivers that should be addressed on an individual routing and business case analysis.
3.5.2 Methodology
The following describes the approach taken in analyzing each prospective port pair. Data is derived and checked based on personal knowledge or interviews with market stakeholders.
3.5.2.1 Vessel service scenarios:
• Vessel type—the port pair analysis will consider vessel types and operational options to serve the points noted. All relevant vessel types, including tug/barge operations, ATB combinations, Ro/Ro (if and when available), load line domestic container and comparable international vessels were considered but only the most appropriate options were priced. This was based on a number of factors including but not limited to vessel service reliability factors (e.g., winter sea state, draft requirements, deck barge incompatibility with open waters, etc.). Competitive transit times were also a factor as longer distances typically require greater speed.
• The analysis does not consider the availability of vessels, but assumed that a Marine Highway service will find an eligible vessel in order to begin its operations.
• Part 4 addresses possible investment scenarios for new-build vessels but the Part 3 analysis relies upon available resources at current costs.
3.5.2.2 Port and connecting infrastructure
• The analysis includes consideration of the marine terminal capabilities of the ports examined in the analysis, including berth characteristics, terminal size, equipment, commodities handled, and highway and rail access. A more detailed review of these port capabilities can be seen in Appendix 3.
West Coast Marine Highway Market Analysis
Part 3 Operational Development
3-14
• Landside operational costs to include time/distance data for relevant highway and rail links to/from origin/destination were considered here and in each specific business case (Part 4).
• Truck based competitive costs for the routes identified were considered to determine the potential viability of any port pair. Local drayage costs were also added where appropriate. While these costs can vary greatly based on many different service parameters, a local drayage cost of $150 per unit in the larger ports and of $125 in the smaller locations for drayage within about 25 miles of the terminal were assumed. The cost difference can be directly related to issues of congestion at the larger port - truck and driver should be compensated for waiting time. This cost was also used for international cargo being drayed between marine terminals.
• The analysis will identify any substantial marine terminal, navigation channel, and landside connecting infrastructure deficiencies.
• Where equipment, such as cranes, trucks, chassis or ramps, at marine terminals is an issue the study team will identify deficiencies and recommend solutions. The availability of functional and efficient equipment is an important cost consideration. Without productive assets labor costs can spiral upwards as productivity suffers. These type problems will also directly affect commercial viability as reliability and consistency of operations is critical to the success of Marine Highway service in the short, medium, and long term.
3.5.2.3 Cost and time/distance data:
The analysis compares fully loaded costs per mode across the potential market opportunities identified in Part 2.
• Competitive factors will be considered and discussed based on the route and potential cargoes, international or domestic. Where appropriate, commodity types can be considered for review.
• The competitive environment should always be considered. Time/cost differentials and critical service opportunities or constraints will be identified for targeted Marine Highway segments and confirmed in the interview process with potential Marine Highway users for both international and domestic freight. In general, transportation services today demand reliability, transparency and fixed date/time type scheduling. These factors were considered.
• Where deficiencies exist, the analysis will identify potential remedies, including possible public support (both subsidy and regulatory relief/penalty), that are needed to enhance the competitiveness of the target Marine Highway service over given time frames. These potential actions will be quantified as much as possible in Part 4 as to their potential magnitude and effect on the business viability of the Marine Highway service. Specific recommendations will be made in Part 6.

West Coast Marine Highway Market Analysis
Part 3 Operational Development
3-15
3.5.2.4 Potential Marine Highway Services
Based on Part 2 market assessments, the following Marine Highway services appear to provide opportunities for success. For each, a conceptual operational plan is developed. Each port pairing was initially based upon the area markets being served and the types of commodities being transported between those markets. This is fully described in Parts 1 and 2 of this report. Part 3 addresses the general parameters that need to be part of the analysis for business case viability for any port pair. The discussion on revenue rate levels, port and terminal costs, labor, routing patterns, vessel type and associated costs, as well as equipment, is critical to the determination of a marine corridor being potentially “viable”. The assumptions used in the analysis were discussed earlier in Part 3 but where a specific port pair has either a strength or weakness when compared against the general parameters, it is so noted. Thus this section becomes a filter that will allow for the business case review of any Marine Highway service to be on the same basis and foundation as are the other competing interests.
The port pairs evaluated for this study include:
• San Diego – San Pedro Bay,
• San Pedro Bay – San Francisco Bay,
• San Pedro Bay – PNW,
• San Francisco – PNW,
• West Coast Hub-Feeder Service,
• Golden State Marine Highway,
As noted earlier, the California Green Trade Corridor, which has recently announced an operator, will be assessed in terms of its relevance to this study in Part 6, Conclusions and Recommendations.
3.5.3 San Diego - San Pedro Bay
Figure 3-1 presents a graphic of the predominant highway route for this port pair, as well as an illustration of the marine route.
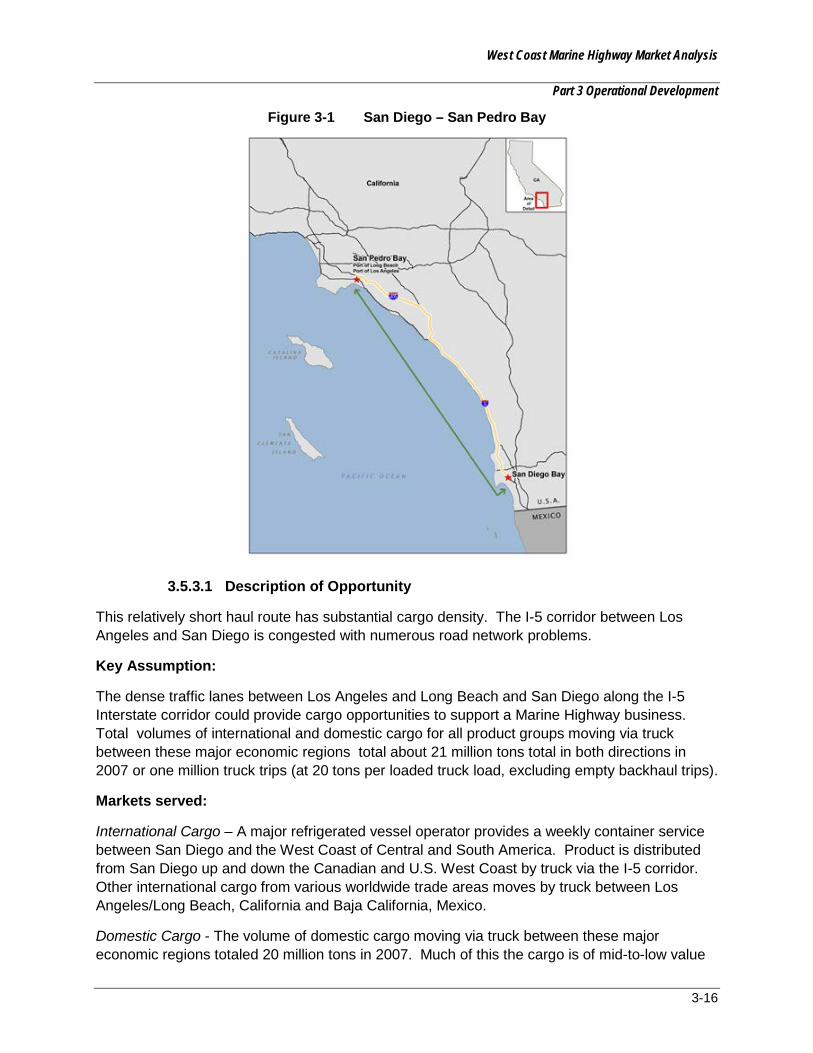
West Coast Marine Highway Market Analysis
Part 3 Operational Development
3-16
Figure 3-1 San Diego – San Pedro Bay
3.5.3.1 Description of Opportunity
This relatively short haul route has substantial cargo density. The I-5 corridor between Los Angeles and San Diego is congested with numerous road network problems.
Key Assumption:
The dense traffic lanes between Los Angeles and Long Beach and San Diego along the I-5 Interstate corridor could provide cargo opportunities to support a Marine Highway business. Total volumes of international and domestic cargo for all product groups moving via truck between these major economic regions total about 21 million tons total in both directions in 2007 or one million truck trips (at 20 tons per loaded truck load, excluding empty backhaul trips).
Markets served:
International Cargo – A major refrigerated vessel operator provides a weekly container service between San Diego and the West Coast of Central and South America. Product is distributed from San Diego up and down the Canadian and U.S. West Coast by truck via the I-5 corridor. Other international cargo from various worldwide trade areas moves by truck between Los Angeles/Long Beach, California and Baja California, Mexico.
Domestic Cargo - The volume of domestic cargo moving via truck between these major economic regions totaled 20 million tons in 2007. Much of this the cargo is of mid-to-low value
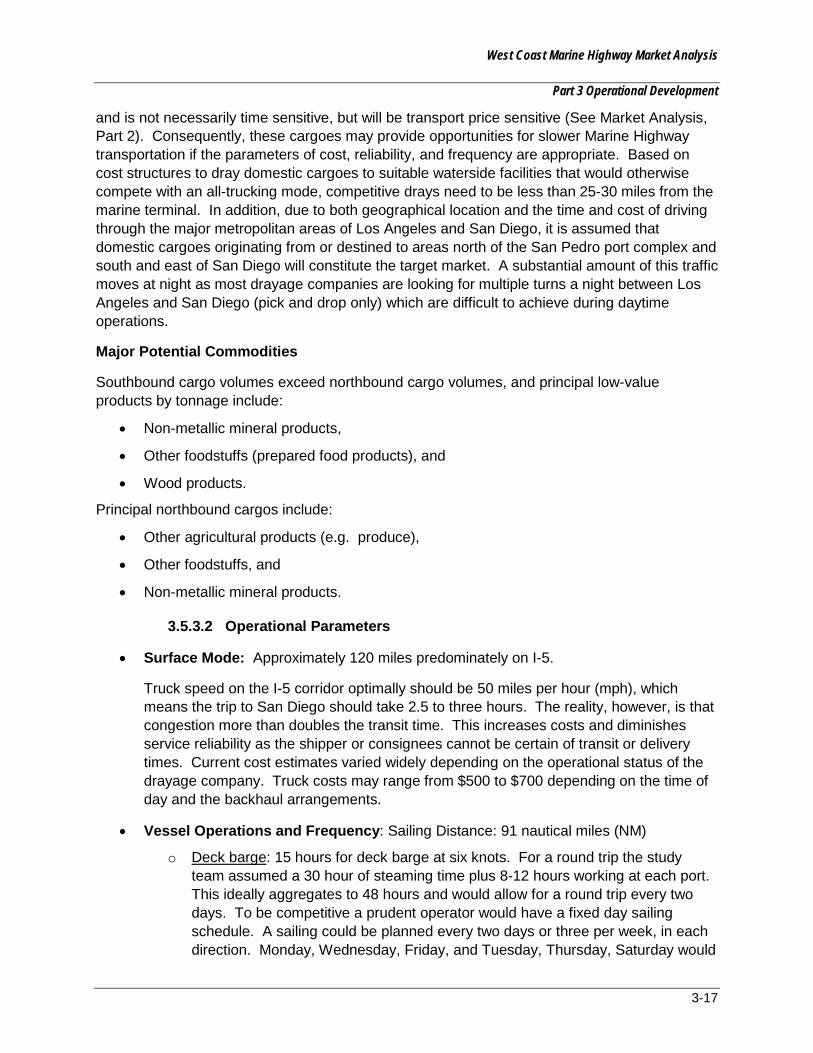
West Coast Marine Highway Market Analysis
Part 3 Operational Development
3-17
and is not necessarily time sensitive, but will be transport price sensitive (See Market Analysis, Part 2). Consequently, these cargoes may provide opportunities for slower Marine Highway transportation if the parameters of cost, reliability, and frequency are appropriate. Based on cost structures to dray domestic cargoes to suitable waterside facilities that would otherwise compete with an all-trucking mode, competitive drays need to be less than 25-30 miles from the marine terminal. In addition, due to both geographical location and the time and cost of driving through the major metropolitan areas of Los Angeles and San Diego, it is assumed that domestic cargoes originating from or destined to areas north of the San Pedro port complex and south and east of San Diego will constitute the target market. A substantial amount of this traffic moves at night as most drayage companies are looking for multiple turns a night between Los Angeles and San Diego (pick and drop only) which are difficult to achieve during daytime operations.
Major Potential Commodities
Southbound cargo volumes exceed northbound cargo volumes, and principal low-value products by tonnage include:
• Non-metallic mineral products,
• Other foodstuffs (prepared food products), and
• Wood products.
Principal northbound cargos include:
• Other agricultural products (e.g. produce),
• Other foodstuffs, and
• Non-metallic mineral products.
3.5.3.2 Operational Parameters
• Surface Mode: Approximately 120 miles predominately on I-5.
Truck speed on the I-5 corridor optimally should be 50 miles per hour (mph), which means the trip to San Diego should take 2.5 to three hours. The reality, however, is that congestion more than doubles the transit time. This increases costs and diminishes service reliability as the shipper or consignees cannot be certain of transit or delivery times. Current cost estimates varied widely depending on the operational status of the drayage company. Truck costs may range from $500 to $700 depending on the time of day and the backhaul arrangements.
• Vessel Operations and Frequency: Sailing Distance: 91 nautical miles (NM)
o Deck barge: 15 hours for deck barge at six knots. For a round trip the study team assumed a 30 hour of steaming time plus 8-12 hours working at each port. This ideally aggregates to 48 hours and would allow for a round trip every two days. To be competitive a prudent operator would have a fixed day sailing schedule. A sailing could be planned every two days or three per week, in each direction. Monday, Wednesday, Friday, and Tuesday, Thursday, Saturday would

West Coast Marine Highway Market Analysis
Part 3 Operational Development
3-18
appear appropriate. This would provide an open day, Sunday, to catch up, reset the system, perform maintenance and repair, etc.
o ATB: Transit time would be eight hours for an ATB at 12 knots. The ATB, being faster than deck barge could do more round trip voyages but the odd times create difficulty for fixed schedules, which are preferred by the trades. To illustrate, if the ATB sailed Los Angeles at 2300 hours Monday it would arrive San Diego to begin stevedoring at 0800 Tuesday with a 2000 sailing back north. It would then arrive at 0400 hours to begin work at 0800 hours with a 2000 or later sailing. When the schedules are actually developed, the study team will find that the added speed is wasted as the number of sailings will not really increase due to working times, trade requirements and customer wishes for outbound cargo cut offs and cargo delivery availability.
o Load line vessel: Five hours for load line at 20 knots (plus one to two hours for maneuvering in port). With a load line vessel, although there is more speed, on these short routes maneuvering in the port areas, speeding up and slowing again erode most of that advantage. As with the ATB, market requirements as well as labor working hours would likely restrict this route to three sailings per week in each direction.
• Service Recommendation and Summary: On this very short route and considering fuel costs, idle time and stevedoring windows a deck barge with three sailings in each direction per week is considered appropriate. The lift on the barge would need to be restricted to a maximum of 250 40' containers in each direction due to time available for stevedoring and anticipated ship to shore productivity of 20 moves per hour using mobile harbor cranes in San Diego. This restriction will obviously affect revenue. A pro forma might look like Table 3-1.
Table 3-1 San Diego to San Pedro Schedule Description Schedule Remarks
Sail San Pedro Bay 2000 Mon Arrive San Diego 0800 Tue Sail San Diego 2000 Tue Arrive San Pedro Bay 0800 Wed Sail San Pedro Bay 2000 Wed Arrive San Diego 0800 Thu Sail San Diego 2000 Thurs Arrive San Pedro Bay 0800 Fri Sail San Pedro Bay 2000 Fri Arrive San Diego 0800 Sat Sail San Diego 2000 Sat Arrive San Pedro Bay 0800 Sun Work Monday straight time
3.5.3.3 Marine Terminal Operations
San Pedro: There are numerous berths available in the San Pedro basin that could accommodate this type service. See figure below for an aerial photo of the San Pedro basin
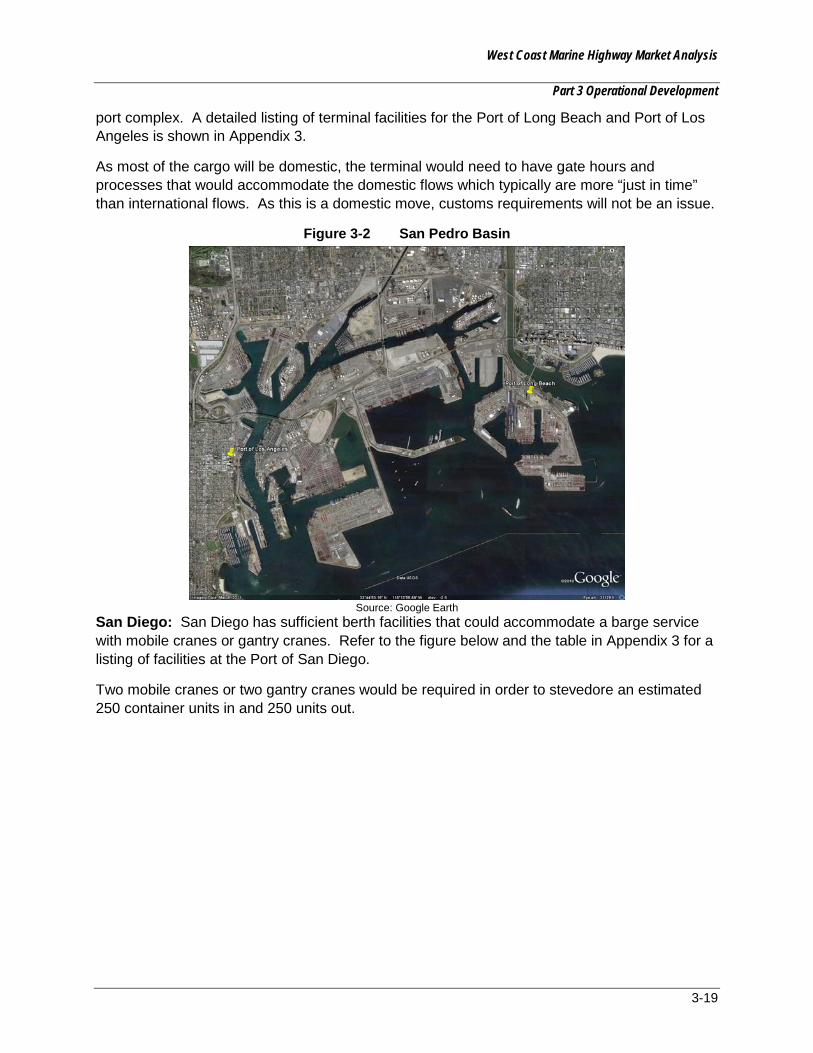
West Coast Marine Highway Market Analysis
Part 3 Operational Development
3-19
port complex. A detailed listing of terminal facilities for the Port of Long Beach and Port of Los Angeles is shown in Appendix 3.
As most of the cargo will be domestic, the terminal would need to have gate hours and processes that would accommodate the domestic flows which typically are more “just in time” than international flows. As this is a domestic move, customs requirements will not be an issue.
Figure 3-2 San Pedro Basin
Source: Google Earth
San Diego: San Diego has sufficient berth facilities that could accommodate a barge service with mobile cranes or gantry cranes. Refer to the figure below and the table in Appendix 3 for a listing of facilities at the Port of San Diego.
Two mobile cranes or two gantry cranes would be required in order to stevedore an estimated 250 container units in and 250 units out.
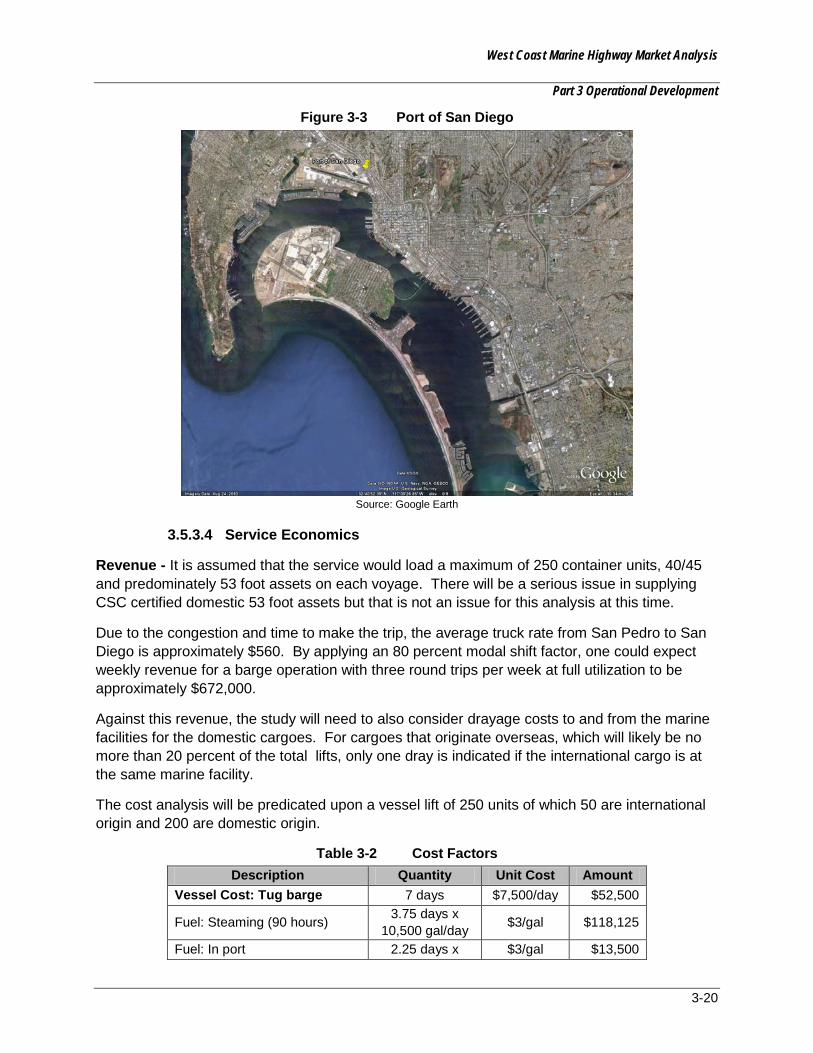
West Coast Marine Highway Market Analysis
Part 3 Operational Development
3-20
Figure 3-3 Port of San Diego
Source: Google Earth
3.5.3.4 Service Economics
Revenue - It is assumed that the service would load a maximum of 250 container units, 40/45 and predominately 53 foot assets on each voyage. There will be a serious issue in supplying CSC certified domestic 53 foot assets but that is not an issue for this analysis at this time.
Due to the congestion and time to make the trip, the average truck rate from San Pedro to San Diego is approximately $560. By applying an 80 percent modal shift factor, one could expect weekly revenue for a barge operation with three round trips per week at full utilization to be approximately $672,000.
Against this revenue, the study will need to also consider drayage costs to and from the marine facilities for the domestic cargoes. For cargoes that originate overseas, which will likely be no more than 20 percent of the total lifts, only one dray is indicated if the international cargo is at the same marine facility.
The cost analysis will be predicated upon a vessel lift of 250 units of which 50 are international origin and 200 are domestic origin.
Table 3-2 Cost Factors Description Quantity Unit Cost Amount
Vessel Cost: Tug barge 7 days $7,500/day $52,500
Fuel: Steaming (90 hours) 3.75 days x 10,500 gal/day $3/gal $118,125
Fuel: In port 2.25 days x $3/gal $13,500
West Coast Marine Highway Market Analysis
Part 3 Operational Development
3-21
Description Quantity Unit Cost Amount 2,000 gal/day
Pilotage at San Pedro Bay 6 trips $795/trip $4,770 Pilotage at San Diego 6 trips $795/trip $4,770 Dockage at San Pedro Bay 3 calls $2,000/call $6,000 Dockage at San Diego 3 calls $2,000/call $6,000
Subtotal – Vessel $205,665 Variable Costs Port to Port Stevedoring at San Pedro Bay 1,500 lifts/week $180/lifts $270,000 Stevedoring at San Diego 1,500 lifts/week $150/move $225,000 Wharfage at San Pedro Bay 1,200 lifts $62/lift $74,400 Wharfage at San Diego 1,200 lifts $62/lift $74,400 HMT 1,500 loads $75/load $112,500
Subtotal - Variable Cost $756,300 Total – Port to Port $961,965
With revenue of $672,000 on this relatively short route, the loss is already $289,965 per week before HMT and any consideration for drayage. These can be expected to increase the potential loss as follows:
Table 3-3 Additional Costs Description Quantity Unit Cost Amount
Drayage: Domestic 1,200 loads $300 $360,000 Drayage: International 300 loads $150 $45,000
PierPASS TBD TBD TBD Total $405,000
Note: TBD- to be determined
3.5.3.5 Conclusion
Given the relatively short distances travelled and the resultant low revenue per unit coupled with relatively high operating costs, this potential Marine Highway route will be challenged to have commercial viability in the short to mid –term future. However, a change in the market place such as ever increasing cargo volumes trucked to/from Baja California, Mexico along with improvements in the border crossings could make this route more viable in the long-term future.
3.5.4 San Pedro Bay – San Francisco Bay
Figure 3-4 presents a graphic of the predominant highway route for this port pair, as well as an illustration of the marine route.
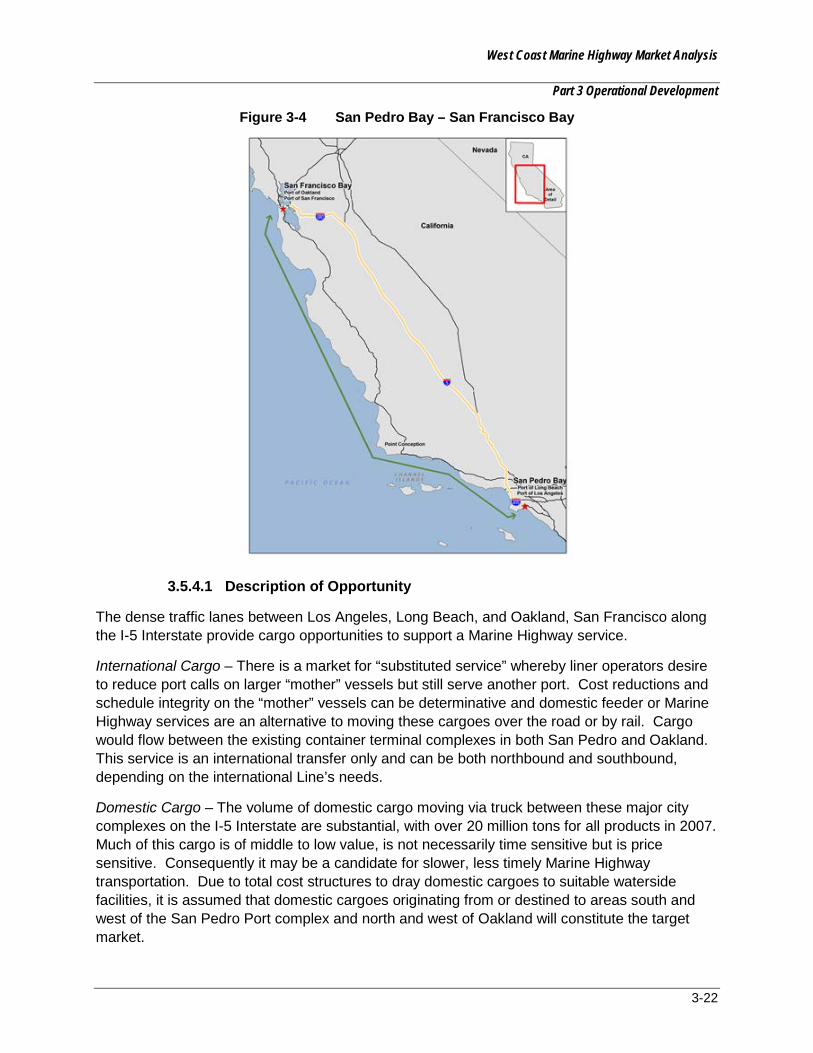
West Coast Marine Highway Market Analysis
Part 3 Operational Development
3-22
Figure 3-4 San Pedro Bay – San Francisco Bay
3.5.4.1 Description of Opportunity
The dense traffic lanes between Los Angeles, Long Beach, and Oakland, San Francisco along the I-5 Interstate provide cargo opportunities to support a Marine Highway service.
International Cargo – There is a market for “substituted service” whereby liner operators desire to reduce port calls on larger “mother” vessels but still serve another port. Cost reductions and schedule integrity on the “mother” vessels can be determinative and domestic feeder or Marine Highway services are an alternative to moving these cargoes over the road or by rail. Cargo would flow between the existing container terminal complexes in both San Pedro and Oakland. This service is an international transfer only and can be both northbound and southbound, depending on the international Line’s needs.
Domestic Cargo – The volume of domestic cargo moving via truck between these major city complexes on the I-5 Interstate are substantial, with over 20 million tons for all products in 2007. Much of this cargo is of middle to low value, is not necessarily time sensitive but is price sensitive. Consequently it may be a candidate for slower, less timely Marine Highway transportation. Due to total cost structures to dray domestic cargoes to suitable waterside facilities, it is assumed that domestic cargoes originating from or destined to areas south and west of the San Pedro Port complex and north and west of Oakland will constitute the target market.
West Coast Marine Highway Market Analysis
Part 3 Operational Development
3-23
Major Potential Commodities
Cargo volumes for low-value products are close to balanced northbound and southbound.
Cargo moving northbound from Los Angeles to the San Francisco region includes large flows for most low-value manufactured commodity categories with principal products including:
• Other foodstuffs (prepared foods),
• Non-metallic mineral products, and
• Chemical products.
Southbound cargo from San Francisco to Los Angeles has a heavy concentration of other foodstuffs but other primary products are:
• Base metals,
• Plastics/rubber products, and
• Chemical products.
3.5.4.2 Operational Parameters
• Surface Mode: The road distance from San Pedro to the San Francisco Bay area is about 400 miles. On normal truck service this distance should be covered in one driver’s legal working day assuming there was no major congestion on the I-5 route. Based on interviews, truck rates total $1,124 for one-way trip.
Rail is also an option but given costs and service levels, as well as drayage to rail heads in the San Pedro and San Francisco Bay basins, rail is not considered a competitive threat at this time. Current rail costing on this leg are in the area of $800 per 40/53 foot containers plus a fuel surcharge and drayage to/from the rail terminals.
• Vessel Operations
o Sailing distance: 368 NM from San Pedro to the Port of Oakland
o Sailing Times:
Deck barge at six knots = 62 hours or two days, 14 hours
ATB at 12 knots = 31 hours or one day seven hours
Load Line vessel at 20 knots = 19 hours
Load Line vessel at 14 knots = 27 hours or one day three hours
• Operational Frequency
o The deck barge could likely make one round trip per week. As long as there were no weather or high seas to disrupt the voyage. Alternatively a deck barge could make a round trip every six days and have a schedule that changes sailing times each week. This would not be competitive or acceptable to the marketplace

West Coast Marine Highway Market Analysis
Part 3 Operational Development
3-24
o ATB could theoretically make two voyages per week in each direction but there would be no fixed day service and the timing would be very tight.
o Load line vessel, an operator would also likely only have two sailings per week due to labor start stop times, and market demands for fixed time, fixed day service. The following table demonstrates this proposed schedule.
Table 3-4 San Pedro to San Francisco Schedule Description Schedule Remarks Sail San Pedro Bay 1800 Mon 19 hours transit at 20 knots Arrive Oakland 1300 Tue 11 hours stevedoring, requires 2 cranes and productivity Sail Oakland 2400 Tue Best case, required overtime Arrive San Pedro Bay 1900 Wed Commence discharge upon arrival on overtime Sail San Pedro Bay 1800 Thu Complete work on straight time, do not work 3rd shift Arrive Oakland 1300 Fri Commence stevedoring Sail Oakland 2400 Fri
Arrive San Pedro Bay Sat PM Commence stevedoring on Sunday and complete on straight time Monday
Given schedule times the vessels average speed would likely be slightly less than20 knots on one leg from Oakland back to San Pedro. However, there would be insufficient time to complete another sailing. Any other scheduling would lead to erratic scheduling, which would not be marketable. Therefore, the above pro forma schedule is not indicated.
To reduce labor costs and insure reliability, two sailings per week in each direction are indicated. Sailings on Monday and Thursday evening from San Pedro, with returns sailings on Tuesday and Friday evenings from Oakland would be planned.
Initially, it is estimated that 200 of the 40 foot containers and all 60 of the 20 foot containers would be international with 100-40/45/53 foot domestic units.
At a more economical 14 knots which requires about 27 hours steaming, start times are not as competitive as the 20 knot service which would result in a pro forma as follows:
West Coast Marine Highway Market Analysis
Part 3 Operational Development
3-25
Table 3-5 San Pedro to San Francisco Schedule Description Schedule Remarks Sail San Pedro 1800 Mon 19 hours transit at 20 knots Arrive Oakland 2100 Tue No labor start time, commence stevedoring at 0700 Wednesday Sail Oakland 1900 Wed Arrive San Pedro 2200 Thu No labor start time, commence stevedoring at 0700 Wednesday Sail San Pedro 1800 Fri Arrive Oakland 2100 Sat Stevedoring on Sunday, all overtime Sail Oakland 1800 Sun Arrive San Pedro 2100 Mon
3.5.4.3 Marine Terminal Operations
San Pedro: There are numerous berths available in the San Pedro basin that could accommodate this type service (Figure 3-2 above and Appendix 3). While the majority of the cargo will be international, the domestic cargo will require the terminal to have gate hours and processes that would accommodate the domestic flows which typically are more “just in time.” Customs' requirements would also be a major concern and would need to be available as the cargo demanded. Some exemption from export filing requirements will also be necessary as the 24-hour rule will be difficult, if not impossible, to comply with given the short duration of the trip.
San Francisco Bay: Oakland is the only terminal location with cranes and container density to make this port pair feasible. Further, on the domestic legs, most of the warehouse and distribution complexes are not on the San Francisco peninsula. Agricultural exports which would be an important product group for the leg back to San Pedro will all source from the eastern part of the Bay. Refer to the figures below for an aerial view of the Port of Oakland and Port of San Francisco, and the tables in Appendix 3 for a listing of facilities at each port.

West Coast Marine Highway Market Analysis
Part 3 Operational Development
3-26
Figure 3-5 Port of Oakland
Source: Google Earth
Figure 3-6 Port of San Francisco
Source: Google Earth

West Coast Marine Highway Market Analysis
Part 3 Operational Development
3-27
3.5.4.4 Service Economics
Revenue: As the truck will cover the distance in eight to 12 hours, or one duty day, the competitive time differentials will create a major impediment, even with a 20 percent price advantage. An average truck rate from the San Pedro area to the Oakland side of San Francisco Bay is $1,124. Using a benchmark modal transfer allowance of 20 percent, revenue of about $900 per 20/40/45/53 foot unit can be anticipated.
Based on container mix of 300 at 40-foot plus 60 at 20-foot at $900 each times four voyages per week, the total revenue at 100 percent capacity is approximately $1,296,000 per week
• At 80 percent capacity, the revenue is approximately $1,036,800 per week
• At 60 percent capacity, the revenue is approximately $776,600
Table 3-6 Cost Factors Description Quantity Unit Cost Amount
Vessel Cost 7 days $25,000/day $175,000
Fuel: Steaming 3.3 days x 140 tons/day $650/ton $277,200
Fuel: In port 4 days x 12 ton/day $950/ton $43,200
Pilotage at San Pedro Bay 4 trips $1,500/trip $6,000 Pilotage at Oakland 4 trips $1,500/trip $6,000 Dockage at San Pedro Bay 2 calls $2,000/call $4,000 Dockage at Oakland 2 calls $2,000/call $4,000
Subtotal – Vessel $515,400 Variable Costs Port to Port Stevedoring 1,440 lifts $180/lift $259,200 HMT 1,320 FEU $75/FEU $99,000 Wharfage 1,440 lifts $62/lift $89,280
Subtotal - Variable Cost $447,480 Total – Port to Port $962,880
Gross profit before administration and drayage (full utilization) $333,120
Gross profit before administration and drayage (80 percent utilization) $73,920
International containers at the origin marine terminal will only require one dray at point of delivery. Domestic cargo will require two drays, one to get to the origin terminal, and one for delivery at destination. Costs to equalize to truck rates would potentially be:

West Coast Marine Highway Market Analysis
Part 3 Operational Development
3-28
Table 3-7 Additional Costs Description Quantity Unit Cost Amount
Drayage: Domestic 400 Units $300/each $120,000 Drayage: International 1040 Units $150/each $156,000 PierPASS TBD TBD TBD Total Drayage Consideration $276,000
Note: TBD- to be determined
3.5.4.5 Conclusion
Under optimal conditions, the load line ship would make two complete rotations between San Pedro and Oakland. With a nominal capacity of 300 FEUs (or 600 TEUs) and utilization rates in excess of 90 percent, the service could be viable, even with the relatively high fuel consumption of the eligible vessel identified to provide this service. The major driver of such a service would be international operator(s) who want to avoid the costs of an additional port call at either Oakland or San Pedro and will utilize a Marine Highway service to “substitute service.” Associated terminal costs and intra-port drays to and from where the "mother ship" works would also be a consideration. It is assumed that the vessel would be "topped off" and filled to capacity with domestic cargoes that fit the marketing profile and could load into CSC certified container assets. These domestic service units would likely only be viable for cargo within a reasonable dray distance from the port. For example, cargoes between San Jose and Thousand Oaks would not likely utilize the Marine Highway service because of costs, time, and other service constraints.

West Coast Marine Highway Market Analysis
Part 3 Operational Development
3-29
3.5.5 San Pedro Bay – Pacific Northwest
Figure 3-7 presents a graphic of the predominant highway route for this port pair, as well as an illustration of the marine route.
Figure 3-7 San Pedro Bay – Pacific Northwest
3.5.5.1 Description of Opportunities
As with the corridor between San Pedro and San Francisco bays, the traffic lane between Los Angeles/Long Beach and the PNW ports along the I-5 corridor may provide international and domestic cargo opportunities to support a Marine Highway business. The volumes of both international and domestic cargo moving via truck or rail between these major economic regions on the I-5 total over three million tons in 2007.
Markets served:
International Cargo – For international cargo there is a market for “substituted service” whereby liner operators desire to reduce port calls via larger “mother” vessels but still maintain service to other important ports and cargo regions. Cost reductions and schedule integrity on the “mother” vessels can be important and alternative, domestic feeder services are an accepted method of moving these cargoes. Cargo would flow between the existing port complexes in both San Pedro Bay and PNW ports. This was a key factor driving the Matson service in the late 1990's.
Domestic Cargo – Much of the cargo moving along the I-5 Corridor cargo is of mid-to-low value and is not necessarily time sensitive, but will be transport price sensitive (See Market Analysis, Part 2). Consequently, these cargos may be a candidate for slower Marine Highway
West Coast Marine Highway Market Analysis
Part 3 Operational Development
3-30
transportation if the parameters of cost, reliability, and frequency are appropriate to the cargo. Because of both geographical location and the time and cost of driving through the major metropolitan areas of Los Angeles and the PNW region, domestic cargoes originating from or destined to areas south and east of the San Pedro Port complex and north and east of the PNW ports will present more favorable costs comparable to truck or rail.
Major Potential Commodities
Principal southbound products are concentrated in those related to forest products and food products including:
• wood products,
• newsprint/paper,
• paper products,
• other foodstuffs, and
• milled grain products.
Primary northbound products from Los Angeles to the Seattle region are in manufactured food and beverages including:
• other foodstuffs,
• alcoholic beverages, and
• milled grain products.
3.5.5.2 Operational Parameters
• Surface Mode: The distance from San Pedro Bay to the Port of Seattle is approximately 1,160 miles. At 50 miles per hour this represents 24 hours of driving time. Considering rest periods and hours of service considerations, truck service would be two days minimum. This could be accelerated with team drivers, but doing so would represent a large costs increase.
Rail service is becoming very competitive and 3rd morning service to and from the San Pedro area is a competitive product that needs to be considered on this longer route.
• Vessel Operations
o Sailing distance - 1146 nautical miles
o Sailing Time –
Deck barge at six knots = 191 hours or eight days
ATB at 12 knots = 96 hours or four days
Load Line vessel at 20 knots = 58 hours or two days 10 hours
Load line at 16 knots = 72 hours or three days
Load Line at 18 knots = 64 hours or two days 16 hours
• Operational Frequency: one round voyage per week minimum requirement with fixed day sailings.
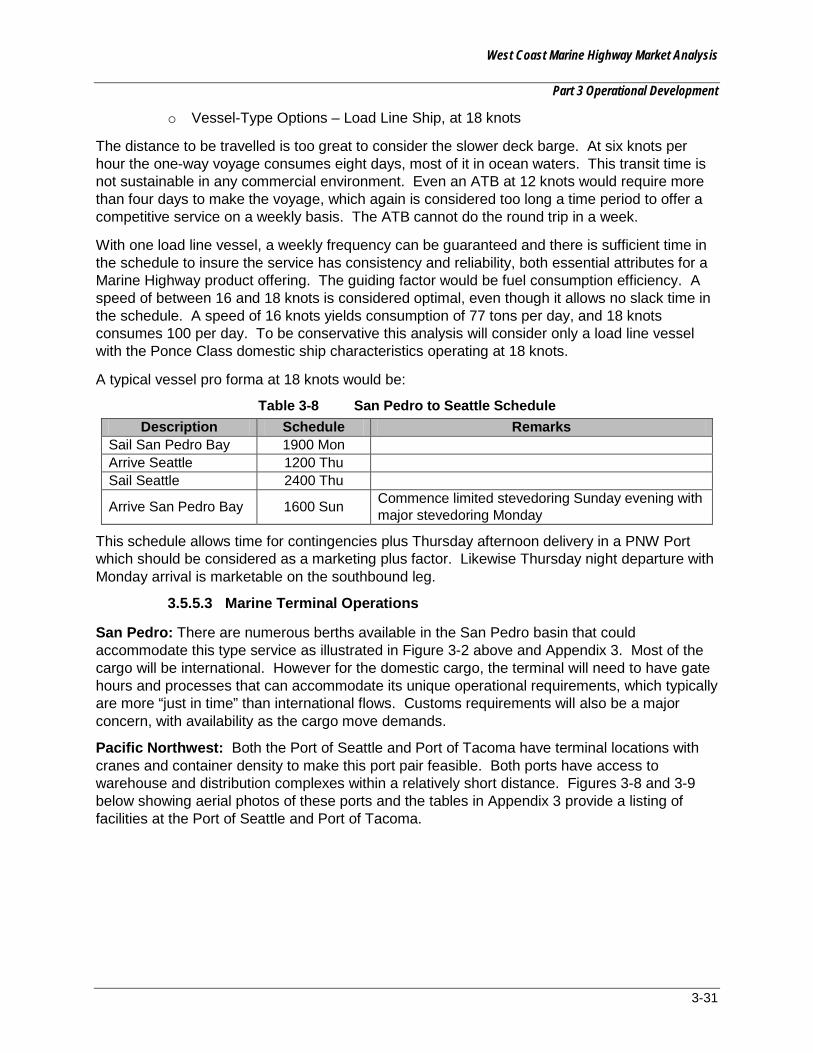
West Coast Marine Highway Market Analysis
Part 3 Operational Development
3-31
o Vessel-Type Options – Load Line Ship, at 18 knots
The distance to be travelled is too great to consider the slower deck barge. At six knots per hour the one-way voyage consumes eight days, most of it in ocean waters. This transit time is not sustainable in any commercial environment. Even an ATB at 12 knots would require more than four days to make the voyage, which again is considered too long a time period to offer a competitive service on a weekly basis. The ATB cannot do the round trip in a week.
With one load line vessel, a weekly frequency can be guaranteed and there is sufficient time in the schedule to insure the service has consistency and reliability, both essential attributes for a Marine Highway product offering. The guiding factor would be fuel consumption efficiency. A speed of between 16 and 18 knots is considered optimal, even though it allows no slack time in the schedule. A speed of 16 knots yields consumption of 77 tons per day, and 18 knots consumes 100 per day. To be conservative this analysis will consider only a load line vessel with the Ponce Class domestic ship characteristics operating at 18 knots.
A typical vessel pro forma at 18 knots would be:
Table 3-8 San Pedro to Seattle Schedule Description Schedule Remarks
Sail San Pedro Bay 1900 Mon Arrive Seattle 1200 Thu Sail Seattle 2400 Thu
Arrive San Pedro Bay 1600 Sun Commence limited stevedoring Sunday evening with major stevedoring Monday
This schedule allows time for contingencies plus Thursday afternoon delivery in a PNW Port which should be considered as a marketing plus factor. Likewise Thursday night departure with Monday arrival is marketable on the southbound leg.
3.5.5.3 Marine Terminal Operations
San Pedro: There are numerous berths available in the San Pedro basin that could accommodate this type service as illustrated in Figure 3-2 above and Appendix 3. Most of the cargo will be international. However for the domestic cargo, the terminal will need to have gate hours and processes that can accommodate its unique operational requirements, which typically are more “just in time” than international flows. Customs requirements will also be a major concern, with availability as the cargo move demands.
Pacific Northwest: Both the Port of Seattle and Port of Tacoma have terminal locations with cranes and container density to make this port pair feasible. Both ports have access to warehouse and distribution complexes within a relatively short distance. Figures 3-8 and 3-9 below showing aerial photos of these ports and the tables in Appendix 3 provide a listing of facilities at the Port of Seattle and Port of Tacoma.
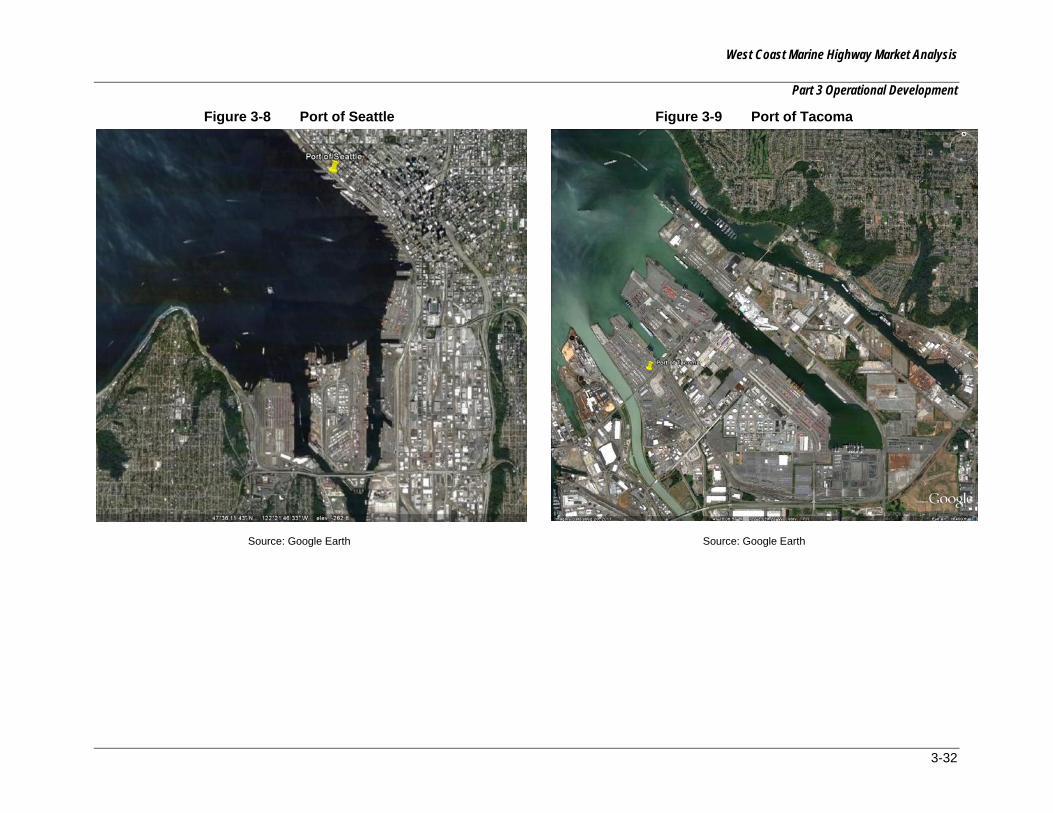
West Coast Marine Highway Market Analysis
Part 3 Operational Development
3-32
Figure 3-8 Port of Seattle
Source: Google Earth
Figure 3-9 Port of Tacoma
Source: Google Earth
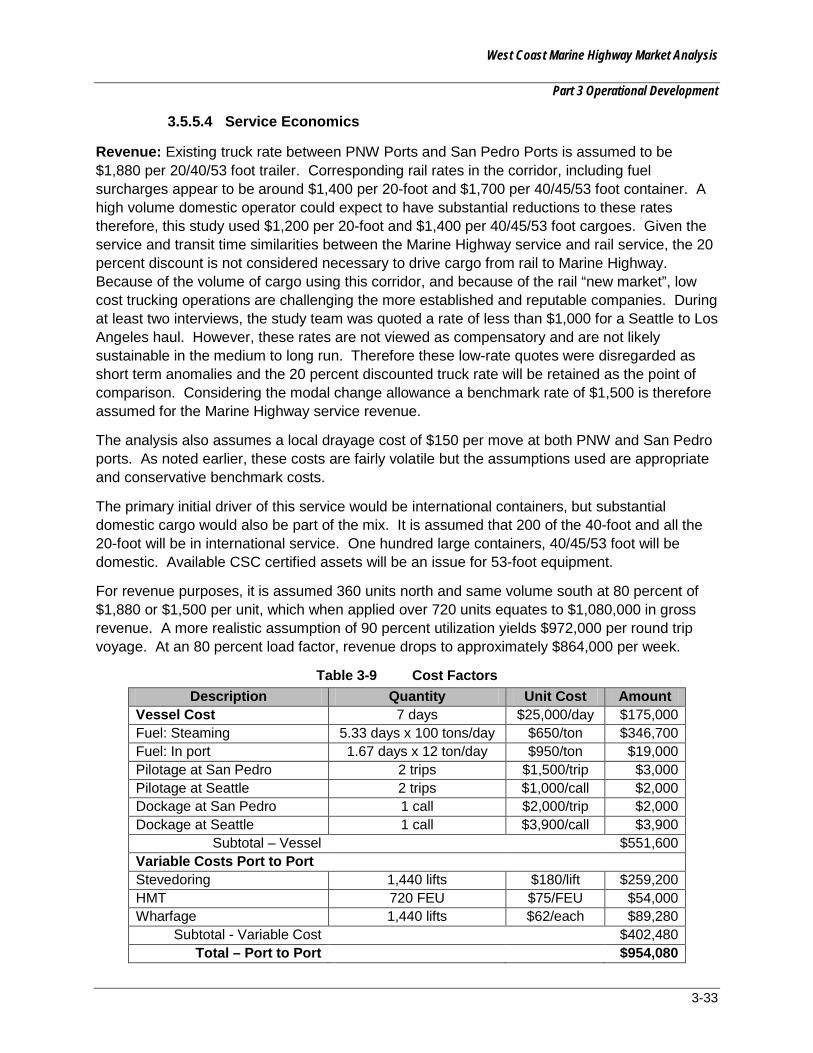
West Coast Marine Highway Market Analysis
Part 3 Operational Development
3-33
3.5.5.4 Service Economics
Revenue: Existing truck rate between PNW Ports and San Pedro Ports is assumed to be $1,880 per 20/40/53 foot trailer. Corresponding rail rates in the corridor, including fuel surcharges appear to be around $1,400 per 20-foot and $1,700 per 40/45/53 foot container. A high volume domestic operator could expect to have substantial reductions to these rates therefore, this study used $1,200 per 20-foot and $1,400 per 40/45/53 foot cargoes. Given the service and transit time similarities between the Marine Highway service and rail service, the 20 percent discount is not considered necessary to drive cargo from rail to Marine Highway. Because of the volume of cargo using this corridor, and because of the rail “new market”, low cost trucking operations are challenging the more established and reputable companies. During at least two interviews, the study team was quoted a rate of less than $1,000 for a Seattle to Los Angeles haul. However, these rates are not viewed as compensatory and are not likely sustainable in the medium to long run. Therefore these low-rate quotes were disregarded as short term anomalies and the 20 percent discounted truck rate will be retained as the point of comparison. Considering the modal change allowance a benchmark rate of $1,500 is therefore assumed for the Marine Highway service revenue.
The analysis also assumes a local drayage cost of $150 per move at both PNW and San Pedro ports. As noted earlier, these costs are fairly volatile but the assumptions used are appropriate and conservative benchmark costs.
The primary initial driver of this service would be international containers, but substantial domestic cargo would also be part of the mix. It is assumed that 200 of the 40-foot and all the 20-foot will be in international service. One hundred large containers, 40/45/53 foot will be domestic. Available CSC certified assets will be an issue for 53-foot equipment.
For revenue purposes, it is assumed 360 units north and same volume south at 80 percent of $1,880 or $1,500 per unit, which when applied over 720 units equates to $1,080,000 in gross revenue. A more realistic assumption of 90 percent utilization yields $972,000 per round trip voyage. At an 80 percent load factor, revenue drops to approximately $864,000 per week.
Table 3-9 Cost Factors Description Quantity Unit Cost Amount
Vessel Cost 7 days $25,000/day $175,000 Fuel: Steaming 5.33 days x 100 tons/day $650/ton $346,700 Fuel: In port 1.67 days x 12 ton/day $950/ton $19,000 Pilotage at San Pedro 2 trips $1,500/trip $3,000 Pilotage at Seattle 2 trips $1,000/call $2,000 Dockage at San Pedro 1 call $2,000/trip $2,000 Dockage at Seattle 1 call $3,900/call $3,900
Subtotal – Vessel $551,600 Variable Costs Port to Port Stevedoring 1,440 lifts $180/lift $259,200 HMT 720 FEU $75/FEU $54,000 Wharfage 1,440 lifts $62/each $89,280
Subtotal - Variable Cost $402,480 Total – Port to Port $954,080
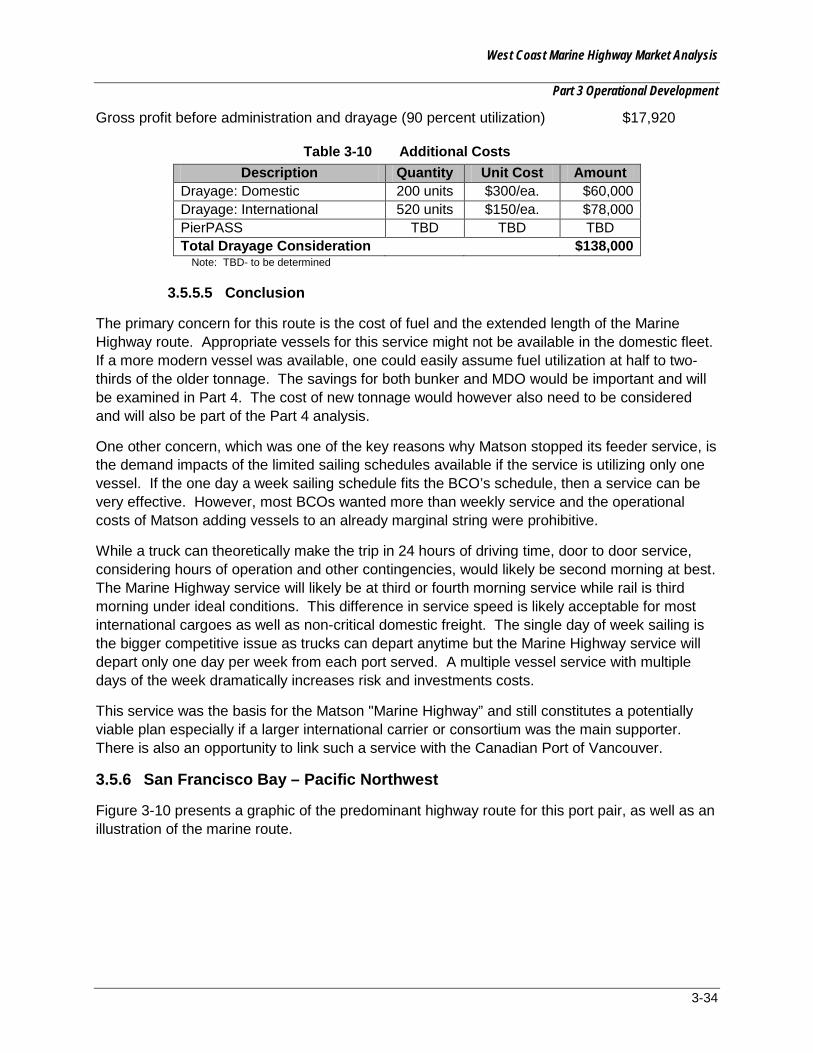
West Coast Marine Highway Market Analysis
Part 3 Operational Development
3-34
Gross profit before administration and drayage (90 percent utilization) $17,920
Table 3-10 Additional Costs Description Quantity Unit Cost Amount
Drayage: Domestic 200 units $300/ea. $60,000 Drayage: International 520 units $150/ea. $78,000 PierPASS TBD TBD TBD Total Drayage Consideration $138,000
Note: TBD- to be determined
3.5.5.5 Conclusion
The primary concern for this route is the cost of fuel and the extended length of the Marine Highway route. Appropriate vessels for this service might not be available in the domestic fleet. If a more modern vessel was available, one could easily assume fuel utilization at half to two-thirds of the older tonnage. The savings for both bunker and MDO would be important and will be examined in Part 4. The cost of new tonnage would however also need to be considered and will also be part of the Part 4 analysis.
One other concern, which was one of the key reasons why Matson stopped its feeder service, is the demand impacts of the limited sailing schedules available if the service is utilizing only one vessel. If the one day a week sailing schedule fits the BCO’s schedule, then a service can be very effective. However, most BCOs wanted more than weekly service and the operational costs of Matson adding vessels to an already marginal string were prohibitive.
While a truck can theoretically make the trip in 24 hours of driving time, door to door service, considering hours of operation and other contingencies, would likely be second morning at best. The Marine Highway service will likely be at third or fourth morning service while rail is third morning under ideal conditions. This difference in service speed is likely acceptable for most international cargoes as well as non-critical domestic freight. The single day of week sailing is the bigger competitive issue as trucks can depart anytime but the Marine Highway service will depart only one day per week from each port served. A multiple vessel service with multiple days of the week dramatically increases risk and investments costs.
This service was the basis for the Matson "Marine Highway” and still constitutes a potentially viable plan especially if a larger international carrier or consortium was the main supporter. There is also an opportunity to link such a service with the Canadian Port of Vancouver.
3.5.6 San Francisco Bay – Pacific Northwest
Figure 3-10 presents a graphic of the predominant highway route for this port pair, as well as an illustration of the marine route.

West Coast Marine Highway Market Analysis
Part 3 Operational Development
3-35
Figure 3-10 San Francisco Bay – Pacific Northwest
3.5.6.1 Description of Opportunities
This traffic lane between the San Francisco Bay and the PNW ports along the I-5 corridor, is much like the other two major coastwise lanes between San Pedro and San Francisco and San Pedro and the PNW, and may provide cargo opportunities to support a Marine Highway business. The volume of domestic cargo moving via truck or rail between these major economic regions on the I-5 corridor totaled over one million tons in 2007.
Markets served:
International Cargo – For international cargo there is a market for “substituted service” whereby liner operators desire to reduce port calls via larger “mother” vessels but still maintain service to other important ports and cargo regions. Cost reductions and schedule integrity on the “mother” vessels can be important and alternative, domestic feeder services are an accepted method of moving these cargoes. Alternatively, international containers discharged to distributions centers in Oakland and or the PNW ports ultimately destined for the other port could be loaded on to this service. Cargo would flow between the existing port complexes in both Oakland and PNW Ports. This cargo would initially form the majority of the cargo moved.
Domestic Cargo – Much of the cargo moving along the I-5 Corridor cargo is of mid-to-low value and is not necessarily time sensitive, but will be transport price sensitive (See Market Analysis,
West Coast Marine Highway Market Analysis
Part 3 Operational Development
3-36
Part 2). Consequently, these cargos may be a candidate for slower Marine Highway transportation if the parameters of cost, reliability, and frequency are appropriate to the cargo
3.5.6.2 Major Potential Commodities
Concentrations of southbound domestic cargos are in:
• Non-metallic mineral products
• Base metals
• Other foodstuffs (processed food)
Northbound domestic cargos have concentrations in:
• Other foodstuffs
• Alcoholic beverages
• Chemical products
3.5.6.3 Operational Parameters
• Surface Mode: The truck distance from Oakland to the Port of Seattle is approximately 800 miles. The distance to Tacoma is a bit shorter due to its location south of Seattle and directly on the I-5. At an average truck speed of 50 mph, without congestion or stops, this trip would require 16 hours or more of driving time. Given hours of service, this requires more than one day’s transit unless a sleeper team was utilized at higher costs.
• Vessel Operations
o Sailing Distance – 804 nm to Seattle. Tacoma would add 23 nm.
o Sailing Time
Deck barge at six knots would equal 134 hours or over 5.5 days. To Tacoma would add another four hours of steaming time.
ATB at 12 knots would complete the transit to Seattle in about 67 hours or two days and 19 hours. Tacoma would add an additional two hours. As these type container vessels are not readily available, this option has been discounted for this analysis.
Load Line vessels at 20 knots would transit in approximately 40 hours or one day, 16 hours.
At a more economical speed of 14 knots, the transit would be almost 58 hours or two days, 10 hours.

West Coast Marine Highway Market Analysis
Part 3 Operational Development
3-37
• Service Frequency
o The tug barge combination is just too slow to represent a viable option. It can only do one directional trip per week so any weekly service, considered a commercial minimum would require two tug barges. The slow speed when gauged against truck and rail competition would not represent a viable alternative.
o Vessel-Type Options – Load Line Ship
o With the fuel consumption being a major factor, a pro forma schedule that provided regular and reliable service while containing energy costs is important. At 20 knots the fuel consumption is almost 120 tons of bunker fuel per day. At 14 knots the consumption is 62 tons per day, or half. Further, the distances are such that even at a faster speed, a vessel cannot make two trips per week. Considering all the factors, the following vessel pro forma, at 14 knots will result in one round trip per week with fixed day, reliable service:
Table 3-11 San Francisco to Pacific Northwest Schedule Description Schedule Remarks
Sail Oakland 1900 Mon Arrive Seattle 0500 Thu Commence stevedoring at 0700 Sail Seattle 1900 Thu Arrive Oakland 0500 Sun Partial stevedoring Sunday, most work Monday
3.5.6.4 Marine Terminal Operations
San Francisco Bay: As noted above, Oakland is the only terminal location with cranes and container density to make this port pair feasible. Further, on the domestic legs, most of the warehouse and distribution complexes are not on the San Francisco peninsula (Figures 3-6 and 3-7 above and Appendix 3).
Pacific Northwest: Both the Port of Seattle and Port of Tacoma have terminal locations with cranes and container density to make this port pair feasible (Figures 3-8 and 3-9 above and Appendix 3). Both ports have access to warehouse and distribution complexes within a relatively short distance.
3.5.6.5 Service Economics
Revenue: The existing one way truck rate between PNW Ports and Oakland is about $1,120 per 20/40/53 foot trailer. As noted earlier, these costs are fairly volatile but the assumptions used are appropriate and conservative benchmark costs.
The current rail rate for this route appears to be quoted in the area of $800 per 20 foot and $1,000 per 40/45/53 foot. These are not volume rates and one should assume that there would be rate reductions for shippers or IMCs who had substantial volumes to offer. A 53 rate could then be as low as $700 per unit but to be consistent with truck, drayage costs need to be added on both sides of the move. The result is a competitive price for a Marine Highway service with comparable service considerations.
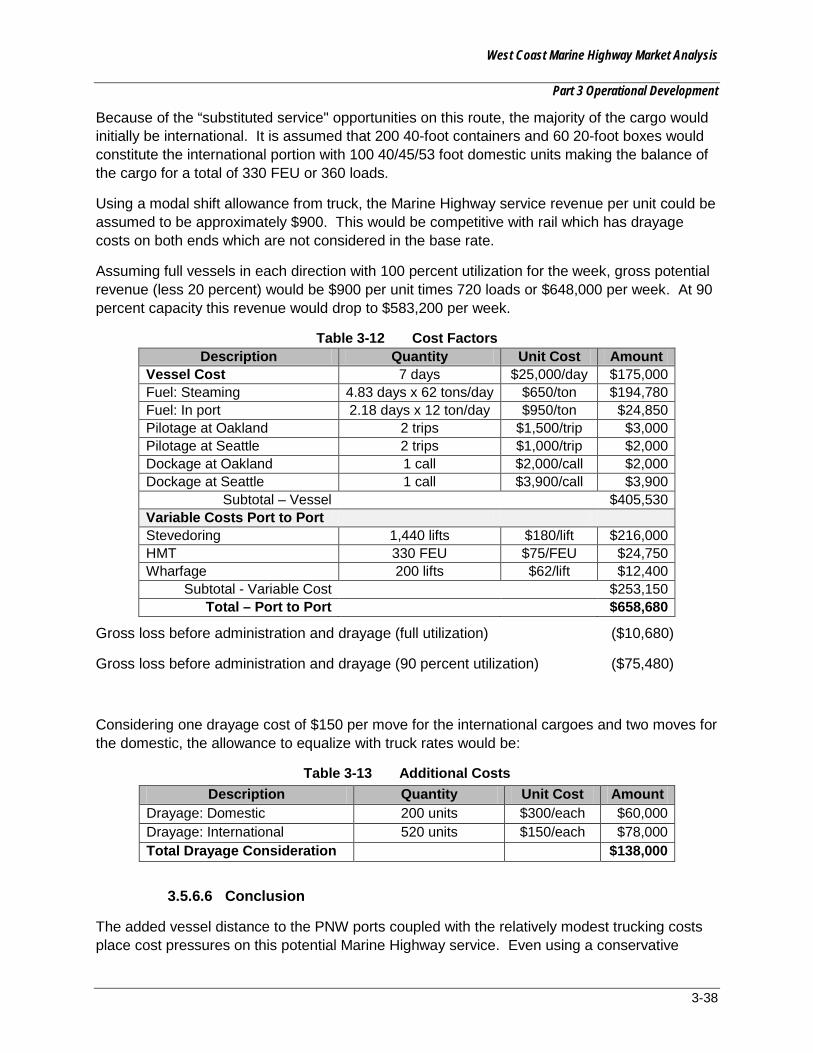
West Coast Marine Highway Market Analysis
Part 3 Operational Development
3-38
Because of the “substituted service" opportunities on this route, the majority of the cargo would initially be international. It is assumed that 200 40-foot containers and 60 20-foot boxes would constitute the international portion with 100 40/45/53 foot domestic units making the balance of the cargo for a total of 330 FEU or 360 loads.
Using a modal shift allowance from truck, the Marine Highway service revenue per unit could be assumed to be approximately $900. This would be competitive with rail which has drayage costs on both ends which are not considered in the base rate.
Assuming full vessels in each direction with 100 percent utilization for the week, gross potential revenue (less 20 percent) would be $900 per unit times 720 loads or $648,000 per week. At 90 percent capacity this revenue would drop to $583,200 per week.
Table 3-12 Cost Factors Description Quantity Unit Cost Amount
Vessel Cost 7 days $25,000/day $175,000 Fuel: Steaming 4.83 days x 62 tons/day $650/ton $194,780 Fuel: In port 2.18 days x 12 ton/day $950/ton $24,850 Pilotage at Oakland 2 trips $1,500/trip $3,000 Pilotage at Seattle 2 trips $1,000/trip $2,000 Dockage at Oakland 1 call $2,000/call $2,000 Dockage at Seattle 1 call $3,900/call $3,900
Subtotal – Vessel $405,530 Variable Costs Port to Port Stevedoring 1,440 lifts $180/lift $216,000 HMT 330 FEU $75/FEU $24,750 Wharfage 200 lifts $62/lift $12,400
Subtotal - Variable Cost $253,150 Total – Port to Port $658,680
Gross loss before administration and drayage (full utilization) ($10,680)
Gross loss before administration and drayage (90 percent utilization) ($75,480)
Considering one drayage cost of $150 per move for the international cargoes and two moves for the domestic, the allowance to equalize with truck rates would be:
Table 3-13 Additional Costs Description Quantity Unit Cost Amount
Drayage: Domestic 200 units $300/each $60,000 Drayage: International 520 units $150/each $78,000 Total Drayage Consideration $138,000
3.5.6.6 Conclusion
The added vessel distance to the PNW ports coupled with the relatively modest trucking costs place cost pressures on this potential Marine Highway service. Even using a conservative

West Coast Marine Highway Market Analysis
Part 3 Operational Development
3-39
stevedoring rate of $150 per move and assuming the gate charges would be inside of that cost yields a negative margin.
Were ATBs available, their slightly lower fuel costs might make a difference but although their consumption is lower than load line, they burn MDO which is higher cost.
A new-build vessel with improved fuel economics would also provide positive change in this port pair, which will be discussed in Part 4.
3.5.7 West Coast Hub-Feeder Service
Figure 3-15 presents a graphic of the predominant highway route for this corridor, as well as an illustration of the marine route.
Figure 3-11 West Coast Hub-Feeder
3.5.7.1 Description of Opportunity
As described in the RFP and supporting documents, the West Coast Hub Feeder Service plans to call on five ports: Los Angeles or Long Beach, Oakland or Stockton, Humboldt Bay, Coos Bay, and Longview. The choice of port between Los Angeles and Long Beach is not important, either is acceptable. However, the service schedule will be challenged if it is to transit the inland channel to Stockton. Given the emerging development of the Stockton/Oakland Marine Highway, this service should call at Oakland to pick up/drop off cargo destined for Stockton and the interior, while keeping the potential for a substituted service at Oakland.

West Coast Marine Highway Market Analysis
Part 3 Operational Development
3-40
While the market assessment indicates that the San Pedro Bay/Columbia River domestic cargo flows are not as large as other corridors there still may be sufficient cargo opportunities to support a Marine Highway business. As mentioned above, a detailed freight analysis, including origin and destination of cargo flows, would need to be undertaken to confirm the market realities on these specific routes. That detailed study is outside the scope of this endeavor.
Markets Served:
International Cargo – There could be a market for “substituted service” on the Long Beach to Oakland portion of the highway. This was described in the San Pedro to Oakland port pair analysis. In this type feeder operation liner operators desire to reduce port calls via larger “mother” vessels but still maintain service to other important ports and cargo regions. Cost reductions and schedule integrity on the “mother” vessels can be important and alternative, domestic feeder services are an accepted method of moving these cargoes. Alternatively, international containers discharged to distributions centers ultimately destined for the other port could be loaded on to this service.
Domestic Cargo – Much of the cargo moving along the I-5 corridor cargo is of mid-to-low value and is not necessarily time sensitive, but will be transport price sensitive (See Market Analysis, Part 2). The volume of domestic cargo moving via truck or rail between the end points of this service is potentially sufficient, though not as great as San Pedro/San Francisco or San Pedro/PNW. Moreover, it is difficult to determine how much cargo flows between the individual ports within this multiple port service. Some of the ports in this itinerary don't have substantial population densities to drive consumer product demand. There are manufacturing/industrial centers that generate freight but based upon the Market Analysis section the density of manufacturing, industrial and distribution facilities located at the smaller, non-international ports, is low requiring additional drays and handling with reduced numbers based on population and other economic factors that would indicate very little volume could be economically shifted to a Marine Highway transportation system. As with the other potential Marine Highway corridors, this study identifies and compares the cost of trucking with the cost of the most efficient Marine Highway service to determine if such a modal shift made economic and logistical sense, notwithstanding the presence or lack of freight.
Major Potential Commodities
The potential for cargo moving on a Marine Highway service is primarily for low value products moving relatively long distances. Therefore, for the shorter legs of the West Coast Hub Feeder Marine Highway there is little potential cargo that is likely to move between port pairs that are relatively close to one another. The exception could be very heavy low-value goods for which transit times are unimportant and which may have restrictions for highway transportation (such as garbage or other waste products). The value in a service with many port calls is not in the local ‘next-door’ cargo moves, rather in the combinations of long distance moves between smaller ports that could make the entire service feasible.
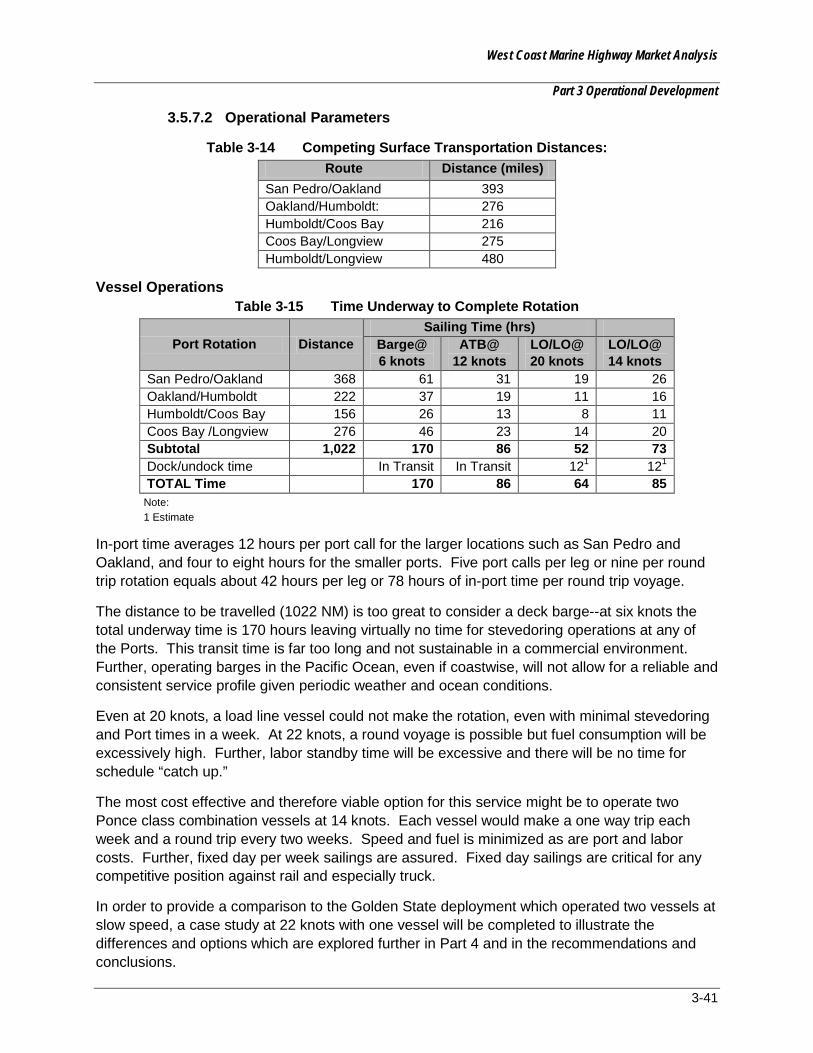
West Coast Marine Highway Market Analysis
Part 3 Operational Development
3-41
3.5.7.2 Operational Parameters
Table 3-14 Competing Surface Transportation Distances: Route Distance (miles)
San Pedro/Oakland 393 Oakland/Humboldt: 276 Humboldt/Coos Bay 216 Coos Bay/Longview 275 Humboldt/Longview 480
Vessel Operations Table 3-15 Time Underway to Complete Rotation
Port Rotation Distance Sailing Time (hrs)
Barge@ 6 knots
ATB@ 12 knots
LO/LO@ 20 knots
LO/LO@ 14 knots
San Pedro/Oakland 368 61 31 19 26 Oakland/Humboldt 222 37 19 11 16 Humboldt/Coos Bay 156 26 13 8 11 Coos Bay /Longview 276 46 23 14 20 Subtotal 1,022 170 86 52 73 Dock/undock time In Transit In Transit 121 121 TOTAL Time 170 86 64 85
Note: 1 Estimate
In-port time averages 12 hours per port call for the larger locations such as San Pedro and Oakland, and four to eight hours for the smaller ports. Five port calls per leg or nine per round trip rotation equals about 42 hours per leg or 78 hours of in-port time per round trip voyage.
The distance to be travelled (1022 NM) is too great to consider a deck barge--at six knots the total underway time is 170 hours leaving virtually no time for stevedoring operations at any of the Ports. This transit time is far too long and not sustainable in a commercial environment. Further, operating barges in the Pacific Ocean, even if coastwise, will not allow for a reliable and consistent service profile given periodic weather and ocean conditions.
Even at 20 knots, a load line vessel could not make the rotation, even with minimal stevedoring and Port times in a week. At 22 knots, a round voyage is possible but fuel consumption will be excessively high. Further, labor standby time will be excessive and there will be no time for schedule “catch up.”
The most cost effective and therefore viable option for this service might be to operate two Ponce class combination vessels at 14 knots. Each vessel would make a one way trip each week and a round trip every two weeks. Speed and fuel is minimized as are port and labor costs. Further, fixed day per week sailings are assured. Fixed day sailings are critical for any competitive position against rail and especially truck.
In order to provide a comparison to the Golden State deployment which operated two vessels at slow speed, a case study at 22 knots with one vessel will be completed to illustrate the differences and options which are explored further in Part 4 and in the recommendations and conclusions.
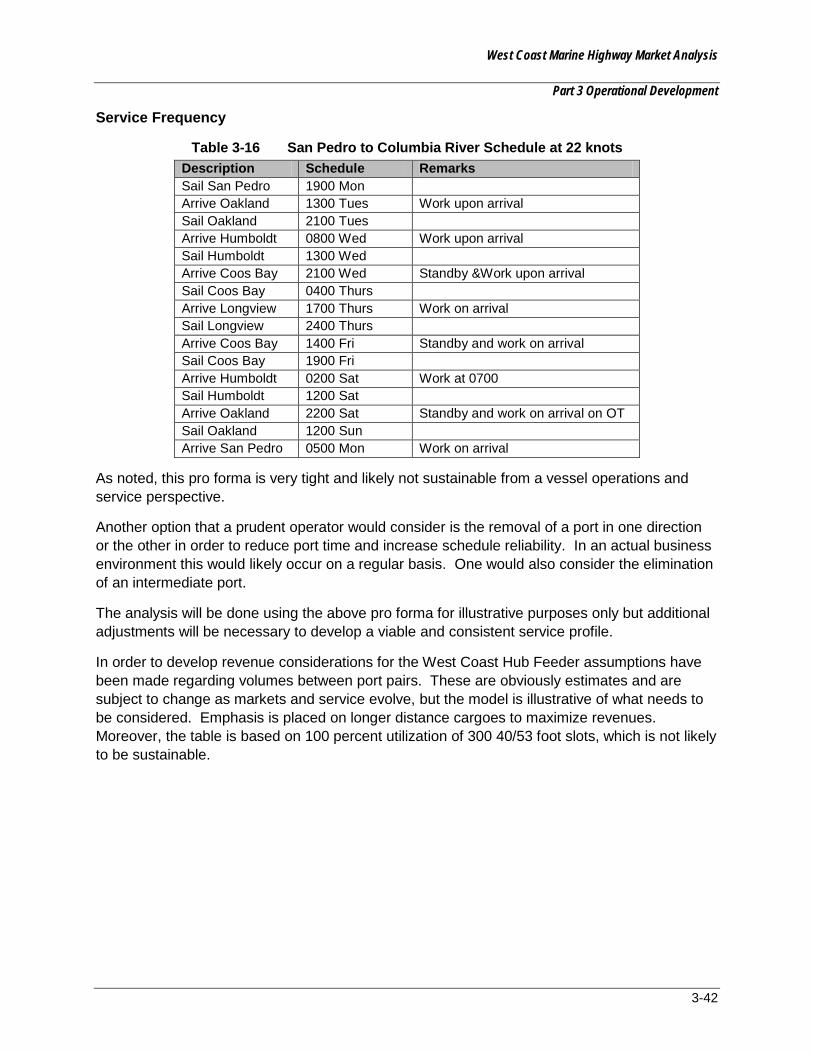
West Coast Marine Highway Market Analysis
Part 3 Operational Development
3-42
Service Frequency
Table 3-16 San Pedro to Columbia River Schedule at 22 knots Description Schedule Remarks Sail San Pedro 1900 Mon Arrive Oakland 1300 Tues Work upon arrival Sail Oakland 2100 Tues Arrive Humboldt 0800 Wed Work upon arrival Sail Humboldt 1300 Wed Arrive Coos Bay 2100 Wed Standby &Work upon arrival Sail Coos Bay 0400 Thurs Arrive Longview 1700 Thurs Work on arrival Sail Longview 2400 Thurs Arrive Coos Bay 1400 Fri Standby and work on arrival Sail Coos Bay 1900 Fri Arrive Humboldt 0200 Sat Work at 0700 Sail Humboldt 1200 Sat Arrive Oakland 2200 Sat Standby and work on arrival on OT Sail Oakland 1200 Sun Arrive San Pedro 0500 Mon Work on arrival
As noted, this pro forma is very tight and likely not sustainable from a vessel operations and service perspective.
Another option that a prudent operator would consider is the removal of a port in one direction or the other in order to reduce port time and increase schedule reliability. In an actual business environment this would likely occur on a regular basis. One would also consider the elimination of an intermediate port.
The analysis will be done using the above pro forma for illustrative purposes only but additional adjustments will be necessary to develop a viable and consistent service profile.
In order to develop revenue considerations for the West Coast Hub Feeder assumptions have been made regarding volumes between port pairs. These are obviously estimates and are subject to change as markets and service evolve, but the model is illustrative of what needs to be considered. Emphasis is placed on longer distance cargoes to maximize revenues. Moreover, the table is based on 100 percent utilization of 300 40/53 foot slots, which is not likely to be sustainable.
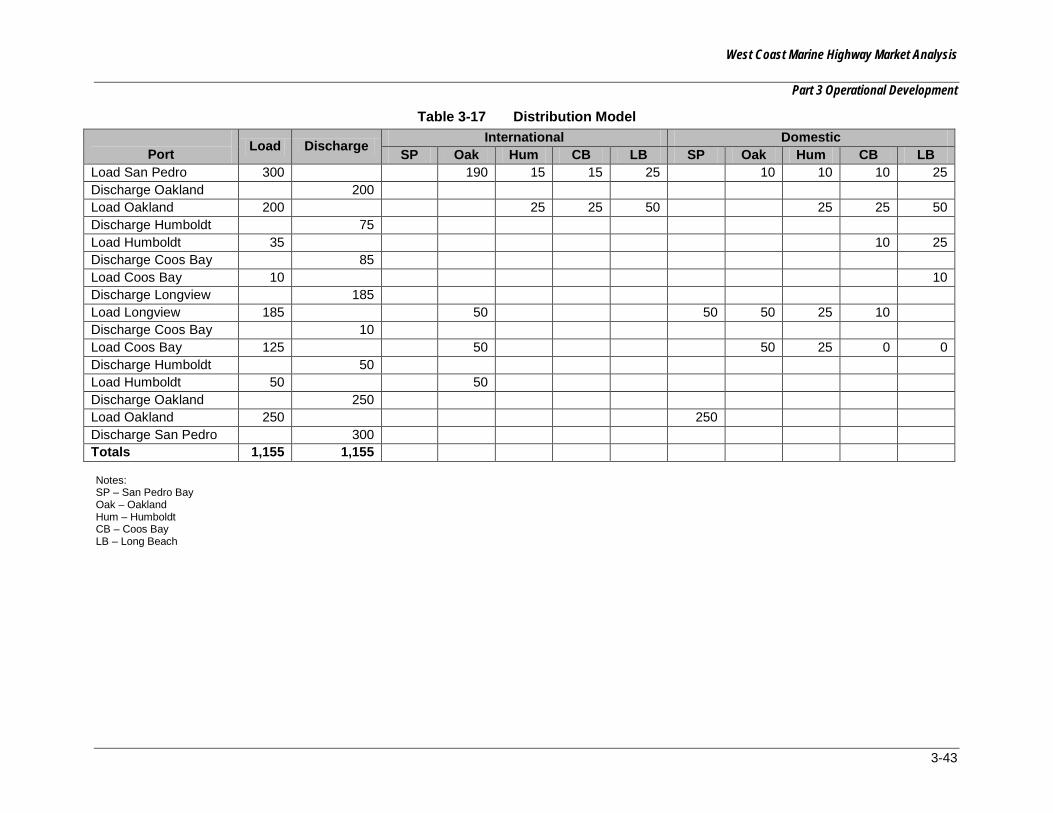
West Coast Marine Highway Market Analysis
Part 3 Operational Development
3-43
Table 3-17 Distribution Model
Port Load Discharge International Domestic SP Oak Hum CB LB SP Oak Hum CB LB
Load San Pedro 300 190 15 15 25 10 10 10 25 Discharge Oakland 200 Load Oakland 200 25 25 50 25 25 50 Discharge Humboldt 75 Load Humboldt 35 10 25 Discharge Coos Bay 85 Load Coos Bay 10 10 Discharge Longview 185 Load Longview 185 50 50 50 25 10 Discharge Coos Bay 10 Load Coos Bay 125 50 50 25 0 0 Discharge Humboldt 50 Load Humboldt 50 50 Discharge Oakland 250 Load Oakland 250 250 Discharge San Pedro 300 Totals 1,155 1,155 Notes: SP – San Pedro Bay Oak – Oakland Hum – Humboldt CB – Coos Bay LB – Long Beach

West Coast Marine Highway Market Analysis
Part 3 Operational Development
3-44
Table 3-18 Total Moves Northbound and Southbound Port Pair
San Pedro/Oakland 450 San Pedro/Humboldt 25 San Pedro/Coos Bay 25 San Pedro/Longview 100 Oakland/Humboldt 100 Oakland/Coos Bay 150 Oakland/Longview 200 Humboldt/Coos Bay 35 Humboldt/Longview 50 Coos Bay/Longview 20 TOTAL 1,155
Recommended Service Parameters: As noted service would be provided by Ponce-class combination vessels between the terminals noted at 22 knots with minimal stevedoring time and overtime and nonproductive standby. For international relay type cargoes, it was assumed the cargo would be available at the terminal where the Marine Highway vessel would berth and discharge at another Marine Highway terminal location at the other end of the deployment. No allowances were made for drayage of cargoes between terminal complexes. However the model does assume a truck dray at the ports to an end-location outside of the gate, or a pick up for export cargoes. This is an important concern as the Market Analysis indicated that the density of cargo handling facilities near the non-international ports is low thus requiring a dray to/from the port. The Analysis indicated a cost of at least $125-$150 per container (regardless of size) for a 25 mile radius of the port. Longer drays would cost more.
3.5.7.3 Service Economics
Revenue: Revenue calculations will be based on the revenue assumption, that is, gross potential revenue per unit will be capped at 80 percent of the existing trucking rates. The rates are then considered against the cargo distribution assumed above. It should be noted that many of the Port to Port volume assumption are very aggressive. Further, the assumption that the vessel will fill to capacity on a sustained, week to week basis is also very aggressive and does not account for the normal ebb and flow of international and domestic cargoes on a seasonal basis. The numbers are used to illustrate a best case scenario.
The table below shows how the revenue assumption applies between each port pair. As noted earlier, these costs are fairly volatile but the assumptions used are appropriate and conservative benchmark costs.
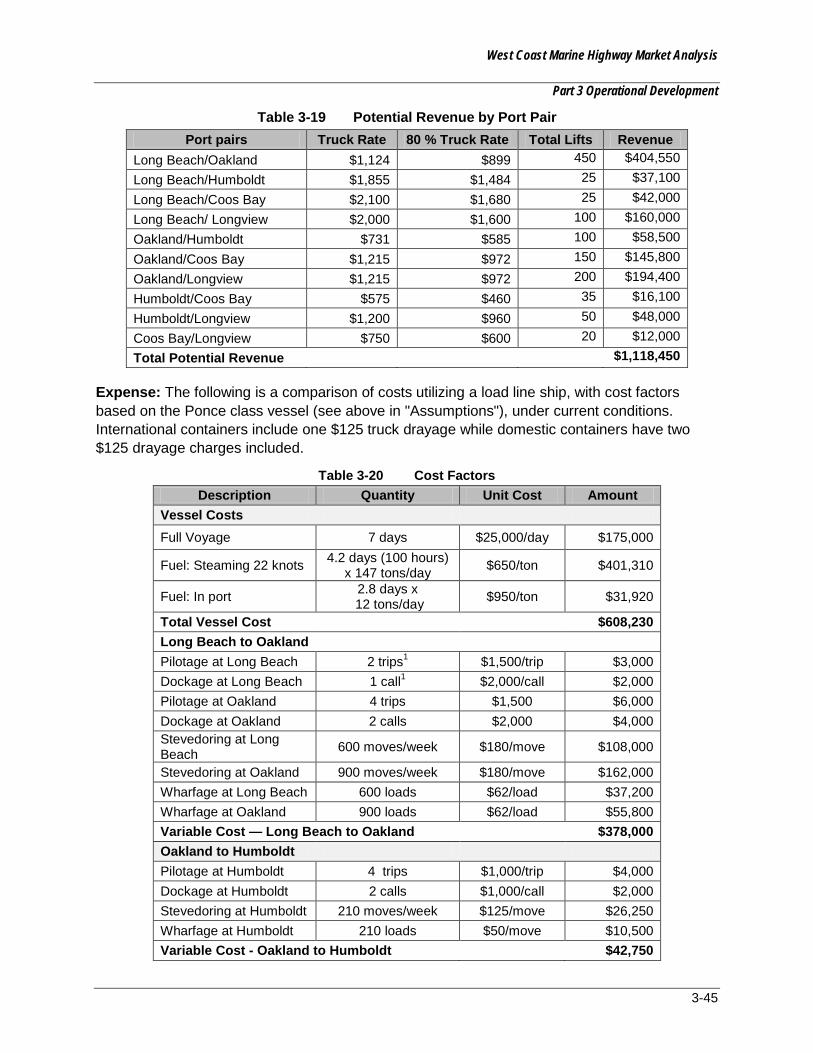
West Coast Marine Highway Market Analysis
Part 3 Operational Development
3-45
Table 3-19 Potential Revenue by Port Pair Port pairs Truck Rate 80 % Truck Rate Total Lifts Revenue
Long Beach/Oakland $1,124 $899 450 $404,550
Long Beach/Humboldt $1,855 $1,484 25 $37,100
Long Beach/Coos Bay $2,100 $1,680 25 $42,000 Long Beach/ Longview $2,000 $1,600 100 $160,000 Oakland/Humboldt $731 $585 100 $58,500
Oakland/Coos Bay $1,215 $972 150 $145,800
Oakland/Longview $1,215 $972 200 $194,400
Humboldt/Coos Bay $575 $460 35 $16,100
Humboldt/Longview $1,200 $960 50 $48,000 Coos Bay/Longview $750 $600 20 $12,000 Total Potential Revenue $1,118,450
Expense: The following is a comparison of costs utilizing a load line ship, with cost factors based on the Ponce class vessel (see above in "Assumptions"), under current conditions. International containers include one $125 truck drayage while domestic containers have two $125 drayage charges included.
Table 3-20 Cost Factors Description Quantity Unit Cost Amount
Vessel Costs Full Voyage 7 days $25,000/day $175,000
Fuel: Steaming 22 knots 4.2 days (100 hours) x 147 tons/day $650/ton $401,310
Fuel: In port 2.8 days x 12 tons/day $950/ton $31,920
Total Vessel Cost $608,230 Long Beach to Oakland Pilotage at Long Beach 2 trips1 $1,500/trip $3,000 Dockage at Long Beach 1 call1 $2,000/call $2,000 Pilotage at Oakland 4 trips $1,500 $6,000 Dockage at Oakland 2 calls $2,000 $4,000 Stevedoring at Long Beach 600 moves/week $180/move $108,000
Stevedoring at Oakland 900 moves/week $180/move $162,000 Wharfage at Long Beach 600 loads $62/load $37,200 Wharfage at Oakland 900 loads $62/load $55,800 Variable Cost — Long Beach to Oakland $378,000 Oakland to Humboldt Pilotage at Humboldt 4 trips $1,000/trip $4,000 Dockage at Humboldt 2 calls $1,000/call $2,000 Stevedoring at Humboldt 210 moves/week $125/move $26,250 Wharfage at Humboldt 210 loads $50/move $10,500 Variable Cost - Oakland to Humboldt $42,750
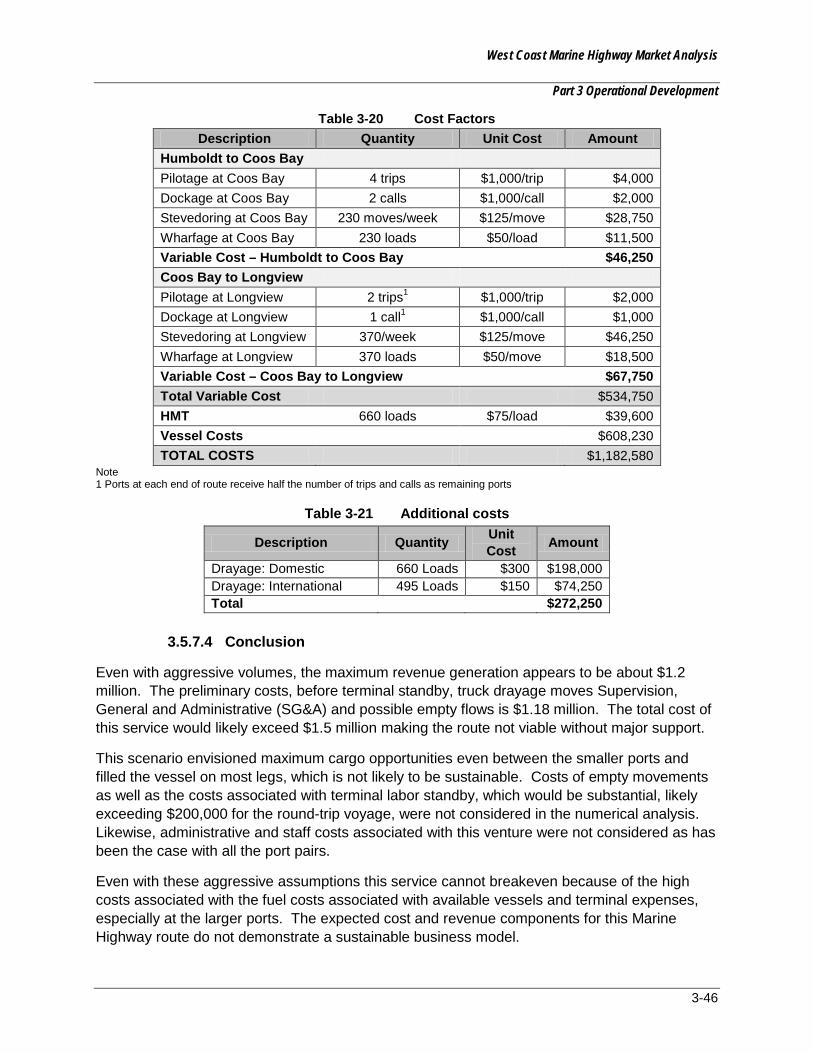
West Coast Marine Highway Market Analysis
Part 3 Operational Development
3-46
Table 3-20 Cost Factors Description Quantity Unit Cost Amount
Humboldt to Coos Bay Pilotage at Coos Bay 4 trips $1,000/trip $4,000 Dockage at Coos Bay 2 calls $1,000/call $2,000 Stevedoring at Coos Bay 230 moves/week $125/move $28,750 Wharfage at Coos Bay 230 loads $50/load $11,500 Variable Cost – Humboldt to Coos Bay $46,250 Coos Bay to Longview Pilotage at Longview 2 trips1 $1,000/trip $2,000 Dockage at Longview 1 call1 $1,000/call $1,000 Stevedoring at Longview 370/week $125/move $46,250 Wharfage at Longview 370 loads $50/move $18,500 Variable Cost – Coos Bay to Longview $67,750 Total Variable Cost $534,750 HMT 660 loads $75/load $39,600 Vessel Costs $608,230 TOTAL COSTS $1,182,580
Note 1 Ports at each end of route receive half the number of trips and calls as remaining ports
Table 3-21 Additional costs
Description Quantity Unit Cost Amount
Drayage: Domestic 660 Loads $300 $198,000 Drayage: International 495 Loads $150 $74,250 Total $272,250
3.5.7.4 Conclusion
Even with aggressive volumes, the maximum revenue generation appears to be about $1.2 million. The preliminary costs, before terminal standby, truck drayage moves Supervision, General and Administrative (SG&A) and possible empty flows is $1.18 million. The total cost of this service would likely exceed $1.5 million making the route not viable without major support.
This scenario envisioned maximum cargo opportunities even between the smaller ports and filled the vessel on most legs, which is not likely to be sustainable. Costs of empty movements as well as the costs associated with terminal labor standby, which would be substantial, likely exceeding $200,000 for the round-trip voyage, were not considered in the numerical analysis. Likewise, administrative and staff costs associated with this venture were not considered as has been the case with all the port pairs.
Even with these aggressive assumptions this service cannot breakeven because of the high costs associated with the fuel costs associated with available vessels and terminal expenses, especially at the larger ports. The expected cost and revenue components for this Marine Highway route do not demonstrate a sustainable business model.
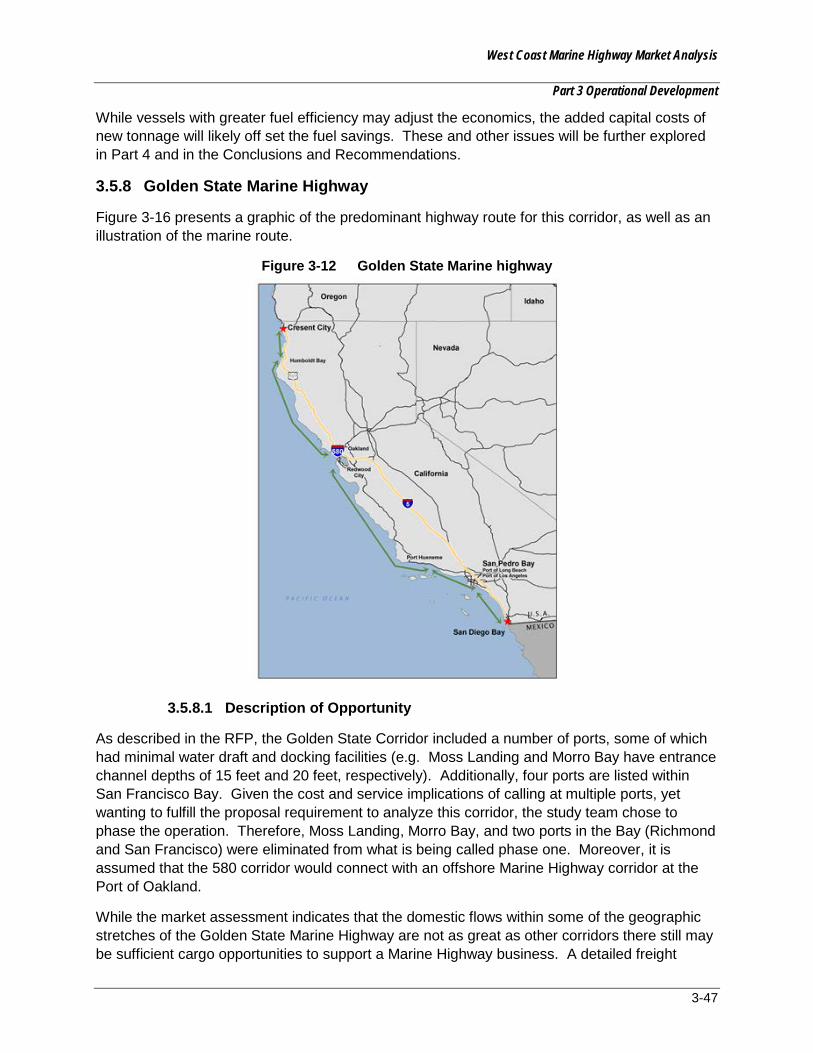
West Coast Marine Highway Market Analysis
Part 3 Operational Development
3-47
While vessels with greater fuel efficiency may adjust the economics, the added capital costs of new tonnage will likely off set the fuel savings. These and other issues will be further explored in Part 4 and in the Conclusions and Recommendations.
3.5.8 Golden State Marine Highway
Figure 3-16 presents a graphic of the predominant highway route for this corridor, as well as an illustration of the marine route.
Figure 3-12 Golden State Marine highway
3.5.8.1 Description of Opportunity
As described in the RFP, the Golden State Corridor included a number of ports, some of which had minimal water draft and docking facilities (e.g. Moss Landing and Morro Bay have entrance channel depths of 15 feet and 20 feet, respectively). Additionally, four ports are listed within San Francisco Bay. Given the cost and service implications of calling at multiple ports, yet wanting to fulfill the proposal requirement to analyze this corridor, the study team chose to phase the operation. Therefore, Moss Landing, Morro Bay, and two ports in the Bay (Richmond and San Francisco) were eliminated from what is being called phase one. Moreover, it is assumed that the 580 corridor would connect with an offshore Marine Highway corridor at the Port of Oakland.
While the market assessment indicates that the domestic flows within some of the geographic stretches of the Golden State Marine Highway are not as great as other corridors there still may be sufficient cargo opportunities to support a Marine Highway business. A detailed freight
West Coast Marine Highway Market Analysis
Part 3 Operational Development
3-48
analysis, including origin and destination of cargo flows, would need to be undertaken to confirm the market realities on some of these shorter routes especially as between smaller population centers. That detailed study is outside the scope of this endeavor.
Markets Served:
International Cargo – There could be a market for “substituted service” on the San Pedro to San Francisco Bay portion of the Golden State Marine Highway. In this type feeder operation liner operators desire to reduce port calls via larger “mother” vessels but still maintain service to other important ports and cargo regions. Cost reductions and schedule integrity on the “mother” vessels can be important and alternative, domestic feeder services are an accepted method of moving these cargoes. Alternatively, international containers discharged to distributions centers ultimately destined for the other port could be loaded on to this service. Substituted service opportunities will exist only for major container ports, however. Most of the ports included within this Marine Highway service do not service deep sea international vessels and would not be marketable for such a substituted service. In addition, there will be cargo opportunities coming out of the 580 corridor, especially on the outbound leg. The market for imports that will utilize the 580 corridor remains to be proven.
Domestic Cargo – Much of the cargo moving along the I-5 corridor cargo is of mid-to-low value and is not necessarily time sensitive, but will be transport price sensitive (See Market Analysis Section). The volume of domestic cargo moving via truck or rail between the end points of this service is potentially sufficient, though not as great as San Pedro/San Francisco or San Pedro/Pacific Northwest. Clearly, many of these ports don't have substantial population densities to drive consumer product demand. There are manufacturing/industrial centers that generate freight but this study’s scope does not allow detailed examination of the size or specific origin/destinations of those facilities to determine how much volume could be economically shifted to marine transportation. The weekly nature of the contemplated Marine Highway service also creates competitive difficulties with land based modes that operate daily.
A key component of this analysis, based upon the Market Analysis, is that the manufacturing, industrial and distribution facilities are not typically within a short distance of the non-international port complex. Thus an additional dray is required to deliver the cargo to its final destination. Based on earlier investigations, a typical dray of 25 miles will cost an additional $125 per container (regardless of size).
Major Potential Commodities
The potential for cargo moving on a Marine Highway is primarily for low value products moving relatively long distances. Therefore, for the shorter legs of the Golden State Marine Highway there is little potential cargo that is likely to move between port pairs that are relatively close to one another. The exception could be very heavy low-value goods for which transit times are unimportant and which may have restrictions for highway transportation. The value in a service with many port calls is not in the local ‘next-door’ cargo moves, but rather in the combinations of long distance moves between smaller ports that could make the entire service feasible.

West Coast Marine Highway Market Analysis
Part 3 Operational Development
3-49
3.5.8.2 Vessel Operational Parameters
Table 3-22 Competing Surface Transportation Distances
Route Distance (miles)
San Diego/San Pedro 115 San Pedro/Hueneme 85 Hueneme/San Francisco Bay 384 San Francisco/Humboldt 276 Humboldt/Crescent City 83
Vessel Operations
Table 3-23 Time Underway to Complete Rotation
Port Rotation Distance Sailing Time (hours)
Barge@ 6 knots
ATB@ 12 knots
Lo/Lo@ 14 knots
Lo/Lo@ 20 knots
San Diego/San Pedro 91 15 7.5 6.5 4.5 San Pedro/Hueneme 50 8 4 3.5 2.5 Hueneme/Oakland 318 53 26.5 23 16 Oakland/Redwood City 20 3 1.5 1.5 1 Redwood City/Humboldt 222 37 18.5 16 11 Humboldt/Crescent City 90 15 7.5 6.5 4.5 Subtotal 791 132 66 56 40 Dock/undock time In Transit In Transit 121 121 TOTAL Time 132 66 68 52 1 Estimate
In-port time averages 12 hours per port call for the larger locations such as San Diego, San Pedro, and Oakland and four to eight hours for the smaller ports. Seven port calls per leg or 13 per round trip rotation equals about 60 hours per leg or 114 hours of in-port time on a round voyage.
A deck barge would then take about 192 hours, or a week and a day to make a single leg. This is not competitive- and would not provide necessary service levels. The ATB would need about 126 hours or 51/2 days. The Lo/Lo at 20 knots would need 112 hours or five days which would generally pro forma as follows:

West Coast Marine Highway Market Analysis
Part 3 Operational Development
3-50
Service Frequency
Table 3-24 Golden State Schedule with load-line vessel at 20 knots Description Schedule Remarks
Sail San Diego 2100 Mon Arrive San Pedro 0400 Tues Commence stevedoring at 0700 Sail San Pedro 1900 Tues Arrive Hueneme 2400 Tues Commence stevedoring at 0700 Sail Hueneme 1200 Wed Limited work Arrive Oakland 0400 Thurs Commence stevedoring at 0700 Sail Oakland 1900 Thurs Arrive Redwood City 2400 Thurs Commence stevedoring at 0700 Sail Redwood City 1200 Fri Limited work Arrive Humboldt 0400 Sat Commence stevedoring at 0700 Sail Humboldt 1900 Sat Arrive Crescent City 0300 Sun Idle Sunday, commence stevedoring at 0700
Monday Sail Crescent City 1200 Mon Arrive Humboldt 1800 Mon Sail Humboldt 2400 Mon Arrive Redwood City 1200 Tues Sail Redwood City 1800 Tues Arrive Oakland PM Tuesday Lay idle and work Wed AM Sail Oakland 1900 Wed Arrive Hueneme 1300 Thurs Sail Hueneme 1900 Thurs Arrive San Pedro PM Thurs Lay idle and work Fri Sail San Pedro Fri 1900 Arrive San Diego Sat Idle to sail again Monday
Given the extra days available, the vessel could make a trip to Ensenada on the weekend or an extra trip to SP if cargo demanded. This would utilize the slack time. Alternatively the vessel could slow steam to/from certain ports to save fuel and overtime costs associated with stevedoring operations.
Slow steaming at 14 knots is likely the most cost effective operating mode as even at 20 knots a round voyage is not possible within a week and multiple vessels are required to assure fixed day service.
A pro forma at 14 knots might have the following attributes as shown in Table 3-31.

West Coast Marine Highway Market Analysis
Part 3 Operational Development
3-51
Table 3-25 Golden State Schedule with load-line vessel at 14 knots Description Schedule Remarks
Sail San Diego 2300 Mon Arrive San Pedro 0700 Tues Sail San Pedro 2300 Tues Arrive Hueneme 0700 Wed Sail Hueneme 1200 Wed Arrive Oakland 1200 Thurs Sail Oakland 2300 Thurs Arrive Redwood 0700 Fri Sail redwood 1200 Fri Arrive Humboldt 0700 Sat Sail Humboldt 1200 Sat Arrive Crescent City 2100 Sat Idle until Sunday Sail Crescent City 1300 Sun Arrive Humboldt 2200 Sun Sail Humboldt 1200 Mon Arrive Redwood 0700 Tuesday Sail Redwood 1200 Tues Arrive Oakland 1900 Tues Sail Oakland 1200 Wed Arrive Hueneme 1300 Wed Sail Hueneme 1900 Wed Arrive San Pedro 0700 Thur Sail San Pedro 1900 Thur Or later
Arrive San Diego 0700 Fri Sit in San Diego or make extra round trip to San Pedro
To provide weekly service to support international carriers and the domestic market, a two ship rotation would be required. Considering fuel consumption, a Lo/Lo or combination vessel operating at about 14 knots is the most obvious choice. Were ATBs available in the inventory, and if they operated at lower costs, they would be considered. However, none are known in the inventory.
The distribution model is based upon international containers moving to and from the larger ports of San Pedro, and Oakland. Domestic cargoes would move between all port pairs as economics and service requirements dictated. As the ship completes the last two port calls, Humboldt and Crescent City, the size of the market leads to a nearly empty vessel which creates an important cost issue. The vessel is sized for the larger port pairs and the lesser volumes between these smaller ports do not support the expenses. In addition, please refer to the additional costs for inland dray as discussed in Section 3.4 and identified in Table 3-7.
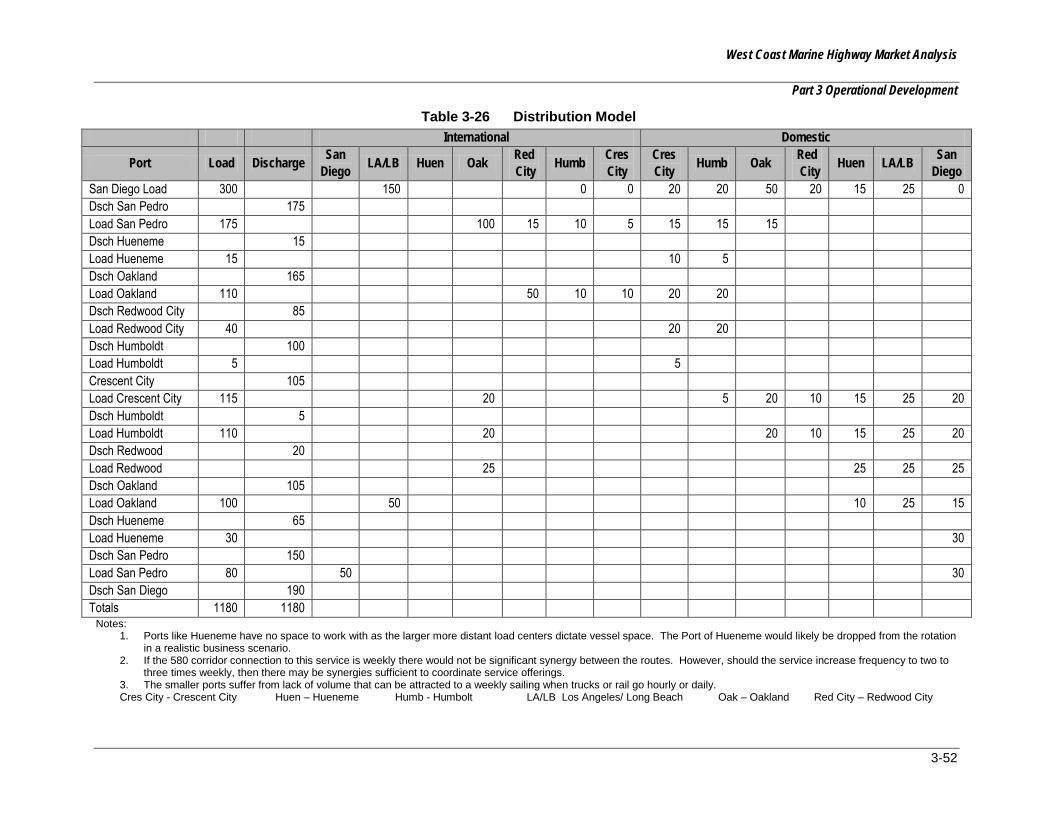
West Coast Marine Highway Market Analysis
Part 3 Operational Development
3-52
Table 3-26 Distribution Model International Domestic
Port Load Discharge San Diego LA/LB Huen Oak Red
City Humb Cres City
Cres City Humb Oak Red
City Huen LA/LB San Diego
San Diego Load 300 150 0 0 20 20 50 20 15 25 0 Dsch San Pedro 175 Load San Pedro 175 100 15 10 5 15 15 15 Dsch Hueneme 15 Load Hueneme 15 10 5 Dsch Oakland 165 Load Oakland 110 50 10 10 20 20 Dsch Redwood City 85 Load Redwood City 40 20 20 Dsch Humboldt 100 Load Humboldt 5 5 Crescent City 105 Load Crescent City 115 20 5 20 10 15 25 20 Dsch Humboldt 5 Load Humboldt 110 20 20 10 15 25 20 Dsch Redwood 20 Load Redwood 25 25 25 25 Dsch Oakland 105 Load Oakland 100 50 10 25 15 Dsch Hueneme 65 Load Hueneme 30 30 Dsch San Pedro 150 Load San Pedro 80 50 30 Dsch San Diego 190 Totals 1180 1180
Notes: 1. Ports like Hueneme have no space to work with as the larger more distant load centers dictate vessel space. The Port of Hueneme would likely be dropped from the rotation
in a realistic business scenario. 2. If the 580 corridor connection to this service is weekly there would not be significant synergy between the routes. However, should the service increase frequency to two to
three times weekly, then there may be synergies sufficient to coordinate service offerings. 3. The smaller ports suffer from lack of volume that can be attracted to a weekly sailing when trucks or rail go hourly or daily. Cres City - Crescent City Huen – Hueneme Humb - Humbolt LA/LB Los Angeles/ Long Beach Oak – Oakland Red City – Redwood City

West Coast Marine Highway Market Analysis
Part 3 Operational Development
3-53
Table 3-27 Total Moves Northbound and Southbound Port Pairs Loads
San Diego – San Pedro 255 San Diego – Hueneme 45 San Diego – Oakland 65 San Diego – Redwood City 45 San Diego – Humboldt 40 San Diego – Crescent City 40 San Pedro – Hueneme 0 San Pedro – Oakland 190 San Pedro – Redwood City 40 San Pedro – Humboldt 50 San Pedro – Crescent City 45 Hueneme – Oakland 10 Hueneme – Redwood City 25 Hueneme – Humboldt 20 Hueneme – Crescent City 25 Oakland – Redwood City 75 Oakland – Humboldt 70 Oakland – Crescent City 70 Redwood City – Humboldt 30 Redwood City – Crescent City 30 Humboldt – Crescent City 10 TOTAL Moves (one round trip or two weeks)
= 1,180
Recommended Service Parameters: Service would be provided by Ponce class combination Ro/Ro Lo/Lo vessels. Two ships could provide a round trip between the noted port pairs and insure fixed day sailings per the schedule pro forma. With 14 knot service speed fuel consumption would be minimized and terminal overtime would be reduced as there was time in the schedule. For international relay type cargoes, it was assumed the cargo would be available at the terminal where the Marine Highway vessel would berth and discharge at another Marine Highway terminal location at the other end of the deployment. No allowances were made for drayage of international cargoes between terminal complexes within San Pedro or San Francisco Bay. However the model does assume a truck dray at the ports to an end-location outside of the gate, or a pick up for export cargoes.
3.5.8.3 Service Economics
Revenue: Revenue calculations will be based on the revenue assumption, that is, gross potential revenue per unit will be capped at 80 percent of the existing trucking rates.
The table below shows how the revenue assumption applies between each port pair. As noted earlier, these costs are fairly volatile but the assumptions used are appropriate and conservative benchmark costs.

West Coast Marine Highway Market Analysis
Part 3 Operational Development
3-54
Table 3-28 Potential Revenue by Port Pair
Port Pair Truck Rate 80% Truck Rate Total Lifts Revenue
San Diego/San Pedro $562 $450 255 $114,750 San Diego/Hueneme $738 $590 45 $26,550 San Diego/Oakland $1,686 $1,349 65 $87,685 San Diego/Redwood City $1,686 $1,349 45 $60,705 San Diego/Humboldt $2,417 $1,934 40 $77,360 San Diego/Crescent City $2,585 $2,068 40 $82,720 San Pedro/Hueneme $176 $141 0 $0 San Pedro/Oakland $1,124 $899 190 $170,810 San Pedro/Redwood City $1,124 $899 40 $35,960 San Pedro/Humboldt $1,498 $1,198 50 $59,900 San Pedro/Crescent City $1,656 $1,325 45 $59,625 Hueneme/Oakland $948 $758 10 $7,580 Hueneme/Redwood City $948 $758 25 $18,125 Hueneme/Humboldt $1,679 $1,343 20 $26,860 Hueneme/Crescent City $1,847 $1,478 25 $36,950 Oakland/Redwood City $100 $80 75 $6,000 Oakland/Humboldt $731 $585 70 $40,950 Oakland/Crescent City $899 $719 70 $50,330 Redwood City/Humboldt $731 $585 30 $17,550 Redwood City/Crescent City $899 $719 30 $21,570 Humboldt/Crescent City $168 $134 10 $1,340 Total 1180 $1,003,320
Vessel – The Ponce class combination vessel is the preferred ship to use for this service. Its main advantage over the ATB is speed and cost per container. However, the decreasing volume of containers onboard as the vessel progresses through its port rotation south to north (large ports to small ports), keeps the cost per container high. Nonetheless, the Ponce class provides an opportunity to use both load optimizing lift on/lift off capabilities, with the roll on/roll off capabilities which can more easily accommodate 53 foot domestic and other trailering equipment. This will be important for domestic cargoes primarily into the smaller ports.
Expense : The following is a comparison of costs utilizing a load line ship, with cost factors based on the Ponce class vessel (see above in "Assumptions"), under current conditions. As additional charges, the model assumes one dray at about $125 for each International load and two drays at $125 each for domestic cargoes to move the freight to and from the Marine Highway facilities.
Table 3-29 Cost Factors
Description Quantity Unit Cost Amount Vessel Cost

West Coast Marine Highway Market Analysis
Part 3 Operational Development
3-55
Table 3-29 Cost Factors Description Quantity Unit Cost Amount
Full Voyage 14 days 25,000/day $350,000
Fuel: Steaming 5.7 days (136 hrs) x 62 tons/day $650/ton $229,710
Fuel: In port 8.3 days x 12 tons/day $950/ton $94,620 Total Vessel Cost $674,330 San Diego to San Pedro Pilotage at San Diego 2 trips1 $1,500/trip $3,000 Dockage at San Diego 1 calls1 $2,000/call $2,000 Pilotage at San Pedro 4 trips $1,500/trip $6,000 Dockage at San Pedro 2 calls $2,000/call $4,000 Stevedoring at San Diego 490 moves/route $150/move $73,500 Stevedoring at San Pedro 580 moves/route $180/move $104,400 Wharfage at San Diego 490 units $62/unit $30,380 Wharfage at San Pedro 580 units $62/unit $35,960
Variable Cost $259,240 San Pedro to Hueneme Pilotage at Hueneme 4 trips $1,500/trip $6,000 Dockage at Hueneme 2 calls $2,000/call $4,000 Stevedoring at Hueneme 125 moves/route $150/move $18,750 Wharfage at Hueneme 125 units $50/unit $6,250
Variable Cost $35,000 Hueneme to Oakland Pilotage at Oakland 4 trips $1,500/trip $6,000 Dockage at Oakland 2 calls $2,000/call $4,000 Stevedoring at Oakland 485 moves/route $180/move $87,300 Wharfage at Oakland 485 units $62/unit $30,070
Variable Cost $127,370 Oakland to Redwood City Pilotage at Redwood City 4 trips $1,500/trip $6,000 Dockage at Redwood City 2 calls $1,500/call $3,000 Stevedoring at Redwood City 245 moves/rt $150/move $36,750 Wharfage at Redwood City 245 units $50/unit $12,250
Variable Cost $58,000 Redwood City to Humboldt Pilotage at Humboldt 4 trips $1,000/trip $4,000 Dockage at Humboldt 2 calls $1,000/call $2,000 Stevedoring at Humboldt 220 moves/route $125/move $27,500 Wharfage at Humboldt 220 units $50/unit $11,000
Variable Cost $44,500 Humboldt to Crescent City Pilotage at Crescent City 2 trips1 $1,000/trip $2,000 Dockage at Crescent City 1 calls1 $1,000/call $1,000 Stevedoring at Crescent City 220 moves/route $125/move $27,500 Wharfage at Crescent City 220 units of cargo $50unit $11,000
Variable Cost $41,500
Total Variable Costs $565,610 HMT (domestic only) 665 loads $75/load $49,875
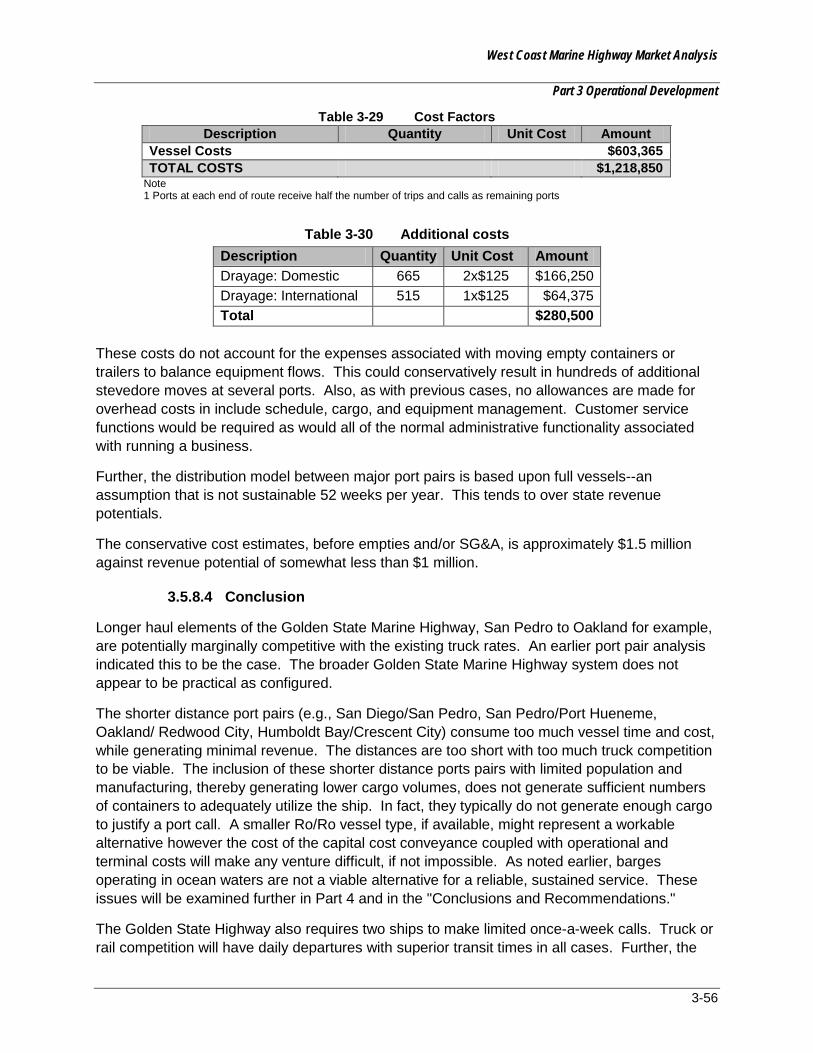
West Coast Marine Highway Market Analysis
Part 3 Operational Development
3-56
Table 3-29 Cost Factors Description Quantity Unit Cost Amount
Vessel Costs $603,365 TOTAL COSTS $1,218,850
Note 1 Ports at each end of route receive half the number of trips and calls as remaining ports
Table 3-30 Additional costs Description Quantity Unit Cost Amount Drayage: Domestic 665 2x$125 $166,250 Drayage: International 515 1x$125 $64,375 Total $280,500
These costs do not account for the expenses associated with moving empty containers or trailers to balance equipment flows. This could conservatively result in hundreds of additional stevedore moves at several ports. Also, as with previous cases, no allowances are made for overhead costs in include schedule, cargo, and equipment management. Customer service functions would be required as would all of the normal administrative functionality associated with running a business.
Further, the distribution model between major port pairs is based upon full vessels--an assumption that is not sustainable 52 weeks per year. This tends to over state revenue potentials.
The conservative cost estimates, before empties and/or SG&A, is approximately $1.5 million against revenue potential of somewhat less than $1 million.
3.5.8.4 Conclusion
Longer haul elements of the Golden State Marine Highway, San Pedro to Oakland for example, are potentially marginally competitive with the existing truck rates. An earlier port pair analysis indicated this to be the case. The broader Golden State Marine Highway system does not appear to be practical as configured.
The shorter distance port pairs (e.g., San Diego/San Pedro, San Pedro/Port Hueneme, Oakland/ Redwood City, Humboldt Bay/Crescent City) consume too much vessel time and cost, while generating minimal revenue. The distances are too short with too much truck competition to be viable. The inclusion of these shorter distance ports pairs with limited population and manufacturing, thereby generating lower cargo volumes, does not generate sufficient numbers of containers to adequately utilize the ship. In fact, they typically do not generate enough cargo to justify a port call. A smaller Ro/Ro vessel type, if available, might represent a workable alternative however the cost of the capital cost conveyance coupled with operational and terminal costs will make any venture difficult, if not impossible. As noted earlier, barges operating in ocean waters are not a viable alternative for a reliable, sustained service. These issues will be examined further in Part 4 and in the "Conclusions and Recommendations."
The Golden State Highway also requires two ships to make limited once-a-week calls. Truck or rail competition will have daily departures with superior transit times in all cases. Further, the
West Coast Marine Highway Market Analysis
Part 3 Operational Development
3-57
need to dray cargoes, whether in containers or loaded aboard trailering equipment adds cost and complexity to the system. Ports are also typically not open 24/7 due in part to union considerations, increasing costs and further impeding the ability of such service to provide the market with a competitive service, even if costs were competitive with truck.

West Coast Marine Highway Market Analysis
Part 4 Business Plan
4-1
4.0 BUSINESS CASE ANALYSES
4.1 INTRODUCTION
Part 4 takes the most promising port pair combinations for potential Marine Highway services for the short to mid-term future that emerged from the cost analysis in Part 3 and subjects them to a more rigorous business investment analysis. Thus, the study projects revenue and applies operating cost factors based on several different models employing various cost conditions. These include a base case without any cost reductions, a model that projects the elimination of HMT for domestic United States Marine Highway moves and an all-in model that forecasts multiple reductions along various cost elements. Title XI financing terms were projected only for one marine corridor, the one that exhibits the most favorable financial performance, the San Pedro/Oakland Marine Highway. In addition, an LNG fueled vessel model was run for a new build operating on the San Pedro/Oakland Marine Highway.
The case studies that according to the analysis in Part 3 presented the most economical and viable operating costs are the following:
• San Pedro – Oakland,
• San Pedro – PNW, and
• Oakland – PNW.
The new build scenario is based on a composite vessel derived from the designs produced by the AMH Design Project for MARAD (October 2011).10 Because existing tonnage is not optimally suited to the needs of the trade, new vessels will be required as soon as they can be built.
The AMH Design Project identified a number of interesting Marine Highway conveyance designs that the team considered in the Part 4 analysis. These included:
• The combination Ro/Ro and container ship (RoCon) ATB design carrying 376 containers in Lo/Lo configuration and 50 trailers in Ro/Ro decks. This design had a speed of 14 knots and was powered by medium speed (MS) diesel technology burning about 40 tons of marine gas oil (MGO) per day. New build cost is estimated to be in the range of $120 million.
• The medium Ro/Ro vessel carrying 160 containers on deck and 154 trailers on Ro/Ro decks. This design has a speed of 20 knots again using a MS diesel burning about 70 tons of MGO per day. New build cost is estimated to be in the range of $168 million.
• The large RoCon design with 289 containers and 125 Ro/Ro spaces for trailers. This design had a speed of 18 knots using MS diesel technology burning about 62 tons of MGO per day. New build cost is estimated to be in the range of $163 million.
• The small Ro/Ro with some container capacity at a speed of 18 knots. This ship would carry about 80 containers as well as 71 trailers. At 18 knots with a MS diesel burning
10 http://www.marad.dot.gov/documents/AMH_Report_Final_Report_10282011_updated.pdf
West Coast Marine Highway Market Analysis
Part 4 Business Plan
4-2
MGO consumption is estimated at 40 tons per day. The new build costs are in the area of $122 Million making the cost almost equivalent to the ATB but providing better speed and better sea keeping abilities in open waters.
Finally, it should be again noted that with substituted service options, there will be port winners and losers. Though no port will lose service, the loss of a line haul port call will likely be viewed as a competitive disadvantage by a major port. There may be as a consequence a somewhat lukewarm receptiveness to the prospect of a Marine Highway substituted service call at a gateway port.
4.2 SAN PEDRO TO OAKLAND
4.2.1 Description of Opportunity
The dense traffic lanes between Los Angeles, Long Beach and Oakland, San Francisco along the I-5 Interstate provide cargo opportunities sufficient to support a Marine Highway service. The distances are also long enough to support a combination Ro/Ro Lo/Lo vessel option. There is also an ample supply of maritime terminals in both Port complexes to support operations.
International Cargo – There is a market for “substituted service” whereby liner operators desire to reduce port calls on larger “mother” vessels but still serve another port. Cost reductions and schedule integrity on the “mother” vessels can be important and domestic feeder or Marine Highway services are an alternative to moving these cargoes over the road or by rail. Cargo would flow between the existing container terminal complexes in both San Pedro and Oakland. This service is an international transfer only and can be both northbound and southbound, depending on the international Line’s needs.
Domestic Cargo – The volume of domestic cargo moving via truck between these major city complexes on the I-5 Interstate totaled over 20 million tons for all products in 2007. Much of this cargo is of mid to low value, is not necessarily time sensitive but is price sensitive. Consequently it may be a candidate for slower, less timely Marine Highway transportation. Due to total cost structures to dray domestic cargoes to suitable waterside facilities, it is assumed that domestic cargoes originating from or destined to areas south and west of the San Pedro Port complex and north and west of Oakland will constitute the target market.
4.2.2 Business Opportunity
The road distance from San Pedro to the San Francisco Bay area is about 400 miles. On normal truck service this distance should be covered in one driver’s legal working day assuming there was no major congestion on the I-5 route. Rail is also an option but given costs and service levels, as well as drayage to rail heads in the San Pedro and San Francisco Bay basins, rail is not considered a competitive threat at this time. As noted in Part 3, deck barges and ATBs are not appropriate conveyance choices due to time and speed as well as the one day service offered by the competition, trucks.
In this case the 18-20 knot Ro/Ro Lo/Lo combination vessel appears the appropriate choice for a viable, reliable, and competitive business option.
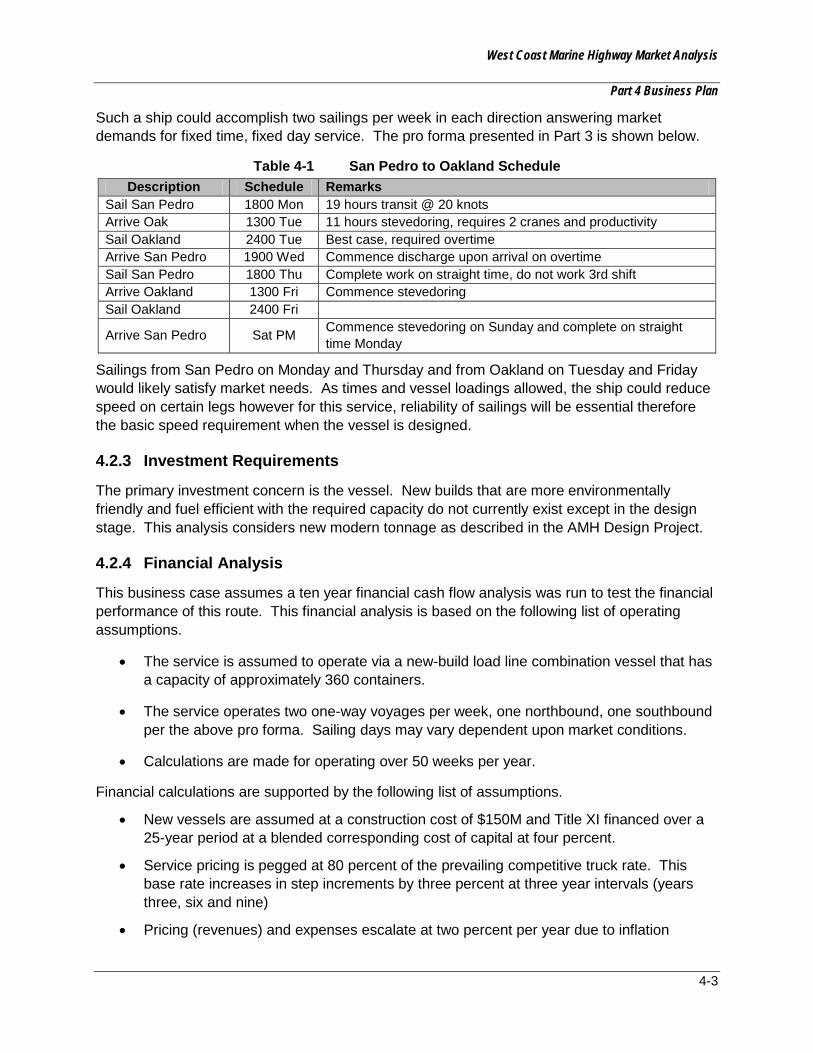
West Coast Marine Highway Market Analysis
Part 4 Business Plan
4-3
Such a ship could accomplish two sailings per week in each direction answering market demands for fixed time, fixed day service. The pro forma presented in Part 3 is shown below.
Table 4-1 San Pedro to Oakland Schedule Description Schedule Remarks
Sail San Pedro 1800 Mon 19 hours transit @ 20 knots Arrive Oak 1300 Tue 11 hours stevedoring, requires 2 cranes and productivity Sail Oakland 2400 Tue Best case, required overtime Arrive San Pedro 1900 Wed Commence discharge upon arrival on overtime Sail San Pedro 1800 Thu Complete work on straight time, do not work 3rd shift Arrive Oakland 1300 Fri Commence stevedoring Sail Oakland 2400 Fri
Arrive San Pedro Sat PM Commence stevedoring on Sunday and complete on straight time Monday
Sailings from San Pedro on Monday and Thursday and from Oakland on Tuesday and Friday would likely satisfy market needs. As times and vessel loadings allowed, the ship could reduce speed on certain legs however for this service, reliability of sailings will be essential therefore the basic speed requirement when the vessel is designed.
4.2.3 Investment Requirements
The primary investment concern is the vessel. New builds that are more environmentally friendly and fuel efficient with the required capacity do not currently exist except in the design stage. This analysis considers new modern tonnage as described in the AMH Design Project.
4.2.4 Financial Analysis
This business case assumes a ten year financial cash flow analysis was run to test the financial performance of this route. This financial analysis is based on the following list of operating assumptions.
• The service is assumed to operate via a new-build load line combination vessel that has a capacity of approximately 360 containers.
• The service operates two one-way voyages per week, one northbound, one southbound per the above pro forma. Sailing days may vary dependent upon market conditions.
• Calculations are made for operating over 50 weeks per year.
Financial calculations are supported by the following list of assumptions.
• New vessels are assumed at a construction cost of $150M and Title XI financed over a 25-year period at a blended corresponding cost of capital at four percent.
• Service pricing is pegged at 80 percent of the prevailing competitive truck rate. This base rate increases in step increments by three percent at three year intervals (years three, six and nine)
• Pricing (revenues) and expenses escalate at two percent per year due to inflation
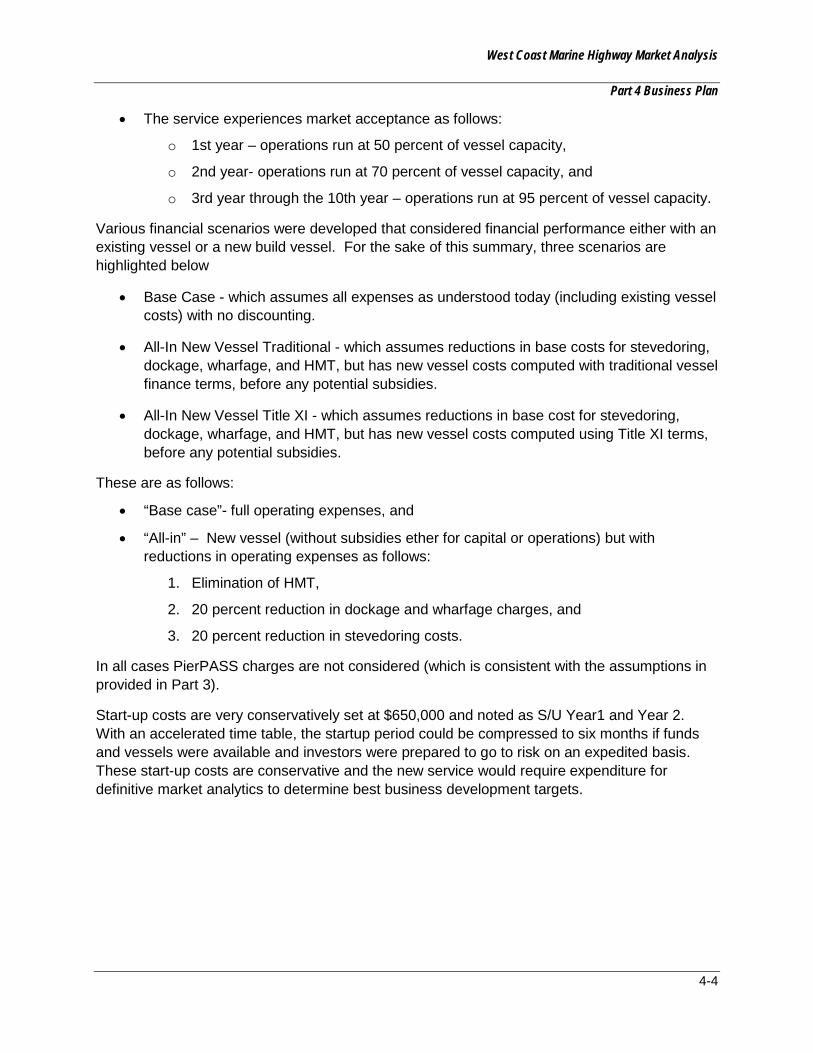
West Coast Marine Highway Market Analysis
Part 4 Business Plan
4-4
• The service experiences market acceptance as follows:
o 1st year – operations run at 50 percent of vessel capacity,
o 2nd year- operations run at 70 percent of vessel capacity, and
o 3rd year through the 10th year – operations run at 95 percent of vessel capacity.
Various financial scenarios were developed that considered financial performance either with an existing vessel or a new build vessel. For the sake of this summary, three scenarios are highlighted below
• Base Case - which assumes all expenses as understood today (including existing vessel costs) with no discounting.
• All-In New Vessel Traditional - which assumes reductions in base costs for stevedoring, dockage, wharfage, and HMT, but has new vessel costs computed with traditional vessel finance terms, before any potential subsidies.
• All-In New Vessel Title XI - which assumes reductions in base cost for stevedoring, dockage, wharfage, and HMT, but has new vessel costs computed using Title XI terms, before any potential subsidies.
These are as follows:
• “Base case”- full operating expenses, and
• “All-in” – New vessel (without subsidies ether for capital or operations) but with reductions in operating expenses as follows:
1. Elimination of HMT,
2. 20 percent reduction in dockage and wharfage charges, and
3. 20 percent reduction in stevedoring costs.
In all cases PierPASS charges are not considered (which is consistent with the assumptions in provided in Part 3).
Start-up costs are very conservatively set at $650,000 and noted as S/U Year1 and Year 2. With an accelerated time table, the startup period could be compressed to six months if funds and vessels were available and investors were prepared to go to risk on an expedited basis. These start-up costs are conservative and the new service would require expenditure for definitive market analytics to determine best business development targets.
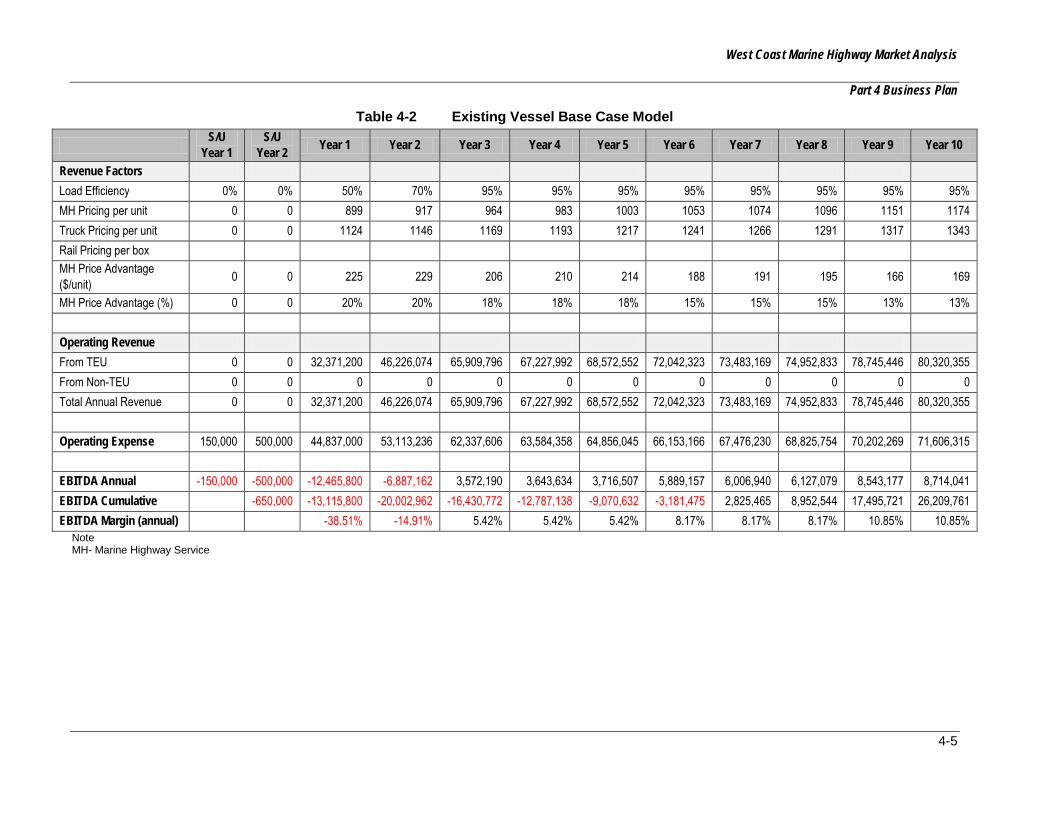
West Coast Marine Highway Market Analysis
Part 4 Business Plan
4-5
Table 4-2 Existing Vessel Base Case Model
S/U Year 1
S/U Year 2 Year 1 Year 2 Year 3 Year 4 Year 5 Year 6 Year 7 Year 8 Year 9 Year 10
Revenue Factors Load Efficiency 0% 0% 50% 70% 95% 95% 95% 95% 95% 95% 95% 95% MH Pricing per unit 0 0 899 917 964 983 1003 1053 1074 1096 1151 1174 Truck Pricing per unit 0 0 1124 1146 1169 1193 1217 1241 1266 1291 1317 1343 Rail Pricing per box MH Price Advantage ($/unit) 0 0 225 229 206 210 214 188 191 195 166 169
MH Price Advantage (%) 0 0 20% 20% 18% 18% 18% 15% 15% 15% 13% 13% Operating Revenue From TEU 0 0 32,371,200 46,226,074 65,909,796 67,227,992 68,572,552 72,042,323 73,483,169 74,952,833 78,745,446 80,320,355 From Non-TEU 0 0 0 0 0 0 0 0 0 0 0 0 Total Annual Revenue 0 0 32,371,200 46,226,074 65,909,796 67,227,992 68,572,552 72,042,323 73,483,169 74,952,833 78,745,446 80,320,355 Operating Expense 150,000 500,000 44,837,000 53,113,236 62,337,606 63,584,358 64,856,045 66,153,166 67,476,230 68,825,754 70,202,269 71,606,315 EBITDA Annual -150,000 -500,000 -12,465,800 -6,887,162 3,572,190 3,643,634 3,716,507 5,889,157 6,006,940 6,127,079 8,543,177 8,714,041 EBITDA Cumulative -650,000 -13,115,800 -20,002,962 -16,430,772 -12,787,138 -9,070,632 -3,181,475 2,825,465 8,952,544 17,495,721 26,209,761 EBITDA Margin (annual) -38.51% -14.91% 5.42% 5.42% 5.42% 8.17% 8.17% 8.17% 10.85% 10.85%
Note MH- Marine Highway Service
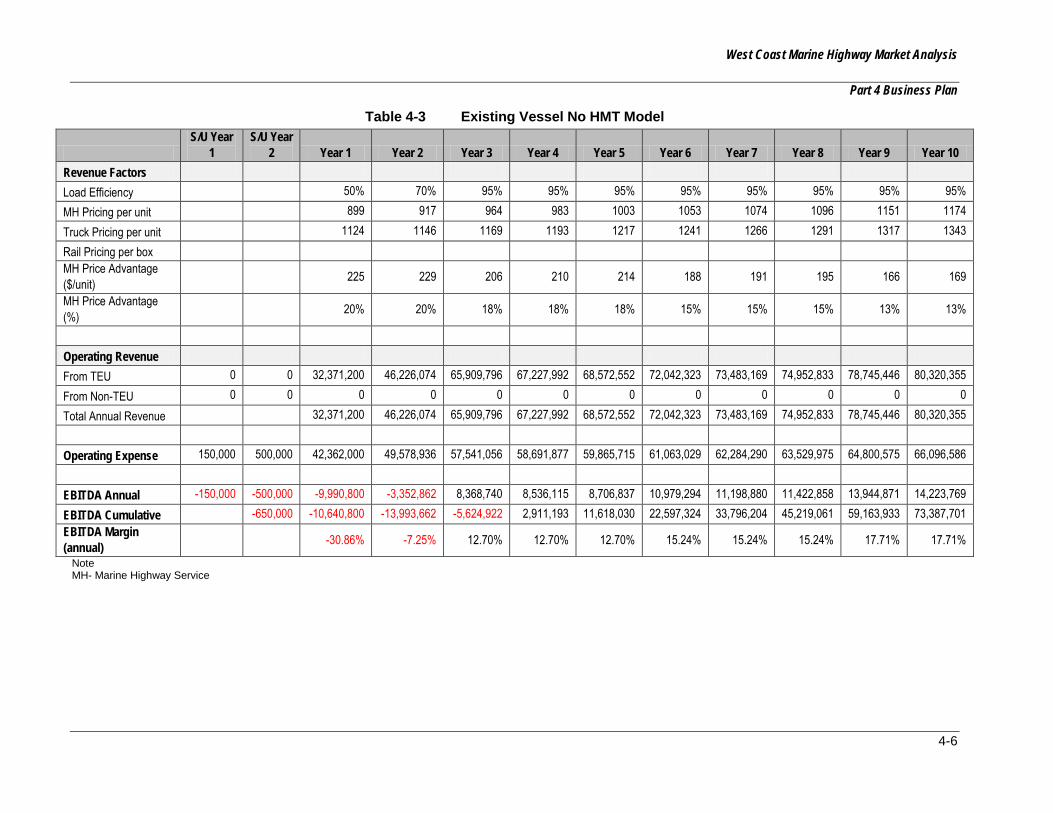
West Coast Marine Highway Market Analysis
Part 4 Business Plan
4-6
Table 4-3 Existing Vessel No HMT Model
S/U Year
1 S/U Year
2 Year 1 Year 2 Year 3 Year 4 Year 5 Year 6 Year 7 Year 8 Year 9 Year 10 Revenue Factors Load Efficiency 50% 70% 95% 95% 95% 95% 95% 95% 95% 95% MH Pricing per unit 899 917 964 983 1003 1053 1074 1096 1151 1174 Truck Pricing per unit 1124 1146 1169 1193 1217 1241 1266 1291 1317 1343 Rail Pricing per box MH Price Advantage ($/unit) 225 229 206 210 214 188 191 195 166 169
MH Price Advantage (%) 20% 20% 18% 18% 18% 15% 15% 15% 13% 13%
Operating Revenue From TEU 0 0 32,371,200 46,226,074 65,909,796 67,227,992 68,572,552 72,042,323 73,483,169 74,952,833 78,745,446 80,320,355 From Non-TEU 0 0 0 0 0 0 0 0 0 0 0 0 Total Annual Revenue 32,371,200 46,226,074 65,909,796 67,227,992 68,572,552 72,042,323 73,483,169 74,952,833 78,745,446 80,320,355 Operating Expense 150,000 500,000 42,362,000 49,578,936 57,541,056 58,691,877 59,865,715 61,063,029 62,284,290 63,529,975 64,800,575 66,096,586 EBITDA Annual -150,000 -500,000 -9,990,800 -3,352,862 8,368,740 8,536,115 8,706,837 10,979,294 11,198,880 11,422,858 13,944,871 14,223,769 EBITDA Cumulative -650,000 -10,640,800 -13,993,662 -5,624,922 2,911,193 11,618,030 22,597,324 33,796,204 45,219,061 59,163,933 73,387,701 EBITDA Margin (annual) -30.86% -7.25% 12.70% 12.70% 12.70% 15.24% 15.24% 15.24% 17.71% 17.71%
Note MH- Marine Highway Service
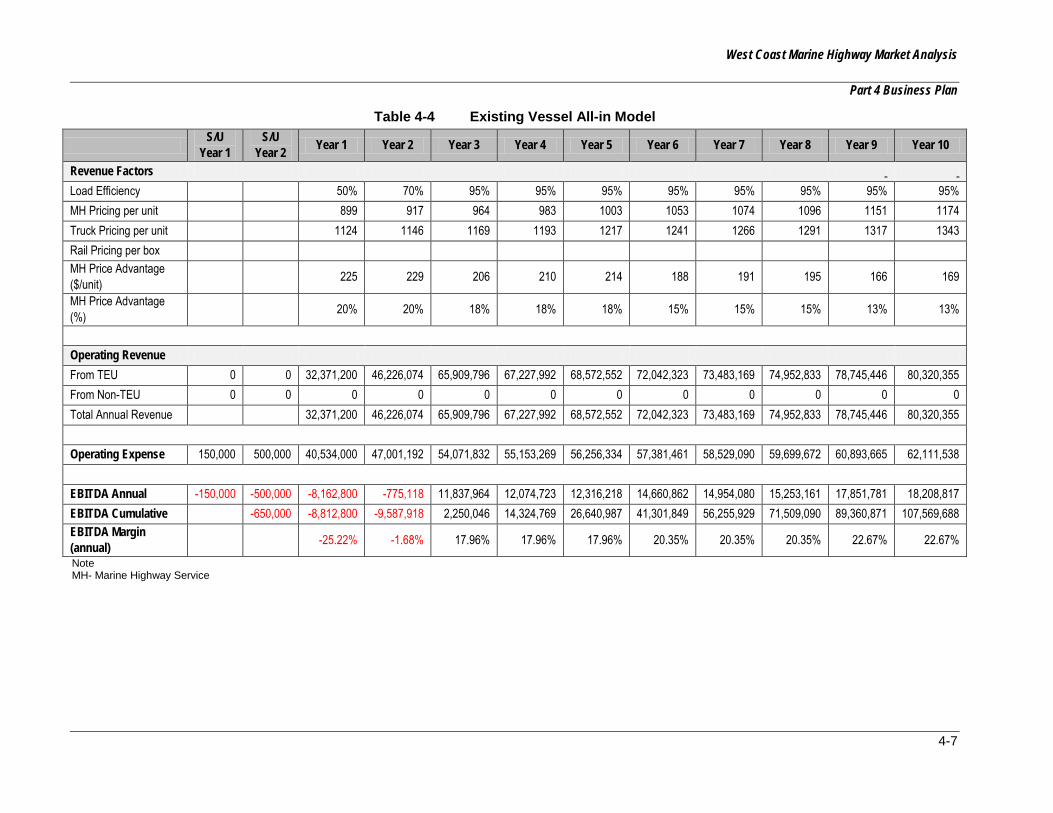
West Coast Marine Highway Market Analysis
Part 4 Business Plan
4-7
Table 4-4 Existing Vessel All-in Model
S/U Year 1
S/U Year 2 Year 1 Year 2 Year 3 Year 4 Year 5 Year 6 Year 7 Year 8 Year 9 Year 10
Revenue Factors Load Efficiency 50% 70% 95% 95% 95% 95% 95% 95% 95% 95% MH Pricing per unit 899 917 964 983 1003 1053 1074 1096 1151 1174 Truck Pricing per unit 1124 1146 1169 1193 1217 1241 1266 1291 1317 1343 Rail Pricing per box MH Price Advantage ($/unit) 225 229 206 210 214 188 191 195 166 169
MH Price Advantage (%) 20% 20% 18% 18% 18% 15% 15% 15% 13% 13%
Operating Revenue From TEU 0 0 32,371,200 46,226,074 65,909,796 67,227,992 68,572,552 72,042,323 73,483,169 74,952,833 78,745,446 80,320,355 From Non-TEU 0 0 0 0 0 0 0 0 0 0 0 0 Total Annual Revenue 32,371,200 46,226,074 65,909,796 67,227,992 68,572,552 72,042,323 73,483,169 74,952,833 78,745,446 80,320,355 Operating Expense 150,000 500,000 40,534,000 47,001,192 54,071,832 55,153,269 56,256,334 57,381,461 58,529,090 59,699,672 60,893,665 62,111,538 EBITDA Annual -150,000 -500,000 -8,162,800 -775,118 11,837,964 12,074,723 12,316,218 14,660,862 14,954,080 15,253,161 17,851,781 18,208,817 EBITDA Cumulative -650,000 -8,812,800 -9,587,918 2,250,046 14,324,769 26,640,987 41,301,849 56,255,929 71,509,090 89,360,871 107,569,688 EBITDA Margin (annual) -25.22% -1.68% 17.96% 17.96% 17.96% 20.35% 20.35% 20.35% 22.67% 22.67%
Note MH- Marine Highway Service
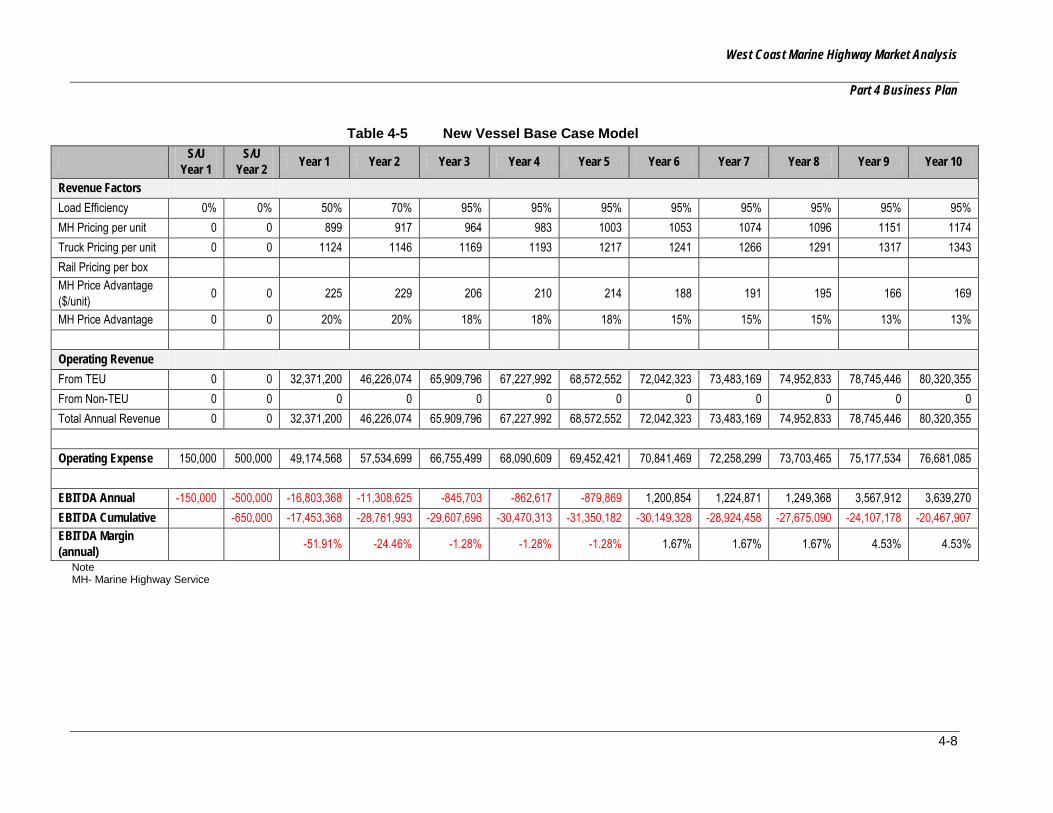
West Coast Marine Highway Market Analysis
Part 4 Business Plan
4-8
Table 4-5 New Vessel Base Case Model
S/U Year 1
S/U Year 2 Year 1 Year 2 Year 3 Year 4 Year 5 Year 6 Year 7 Year 8 Year 9 Year 10
Revenue Factors Load Efficiency 0% 0% 50% 70% 95% 95% 95% 95% 95% 95% 95% 95% MH Pricing per unit 0 0 899 917 964 983 1003 1053 1074 1096 1151 1174 Truck Pricing per unit 0 0 1124 1146 1169 1193 1217 1241 1266 1291 1317 1343 Rail Pricing per box MH Price Advantage ($/unit) 0 0 225 229 206 210 214 188 191 195 166 169
MH Price Advantage 0 0 20% 20% 18% 18% 18% 15% 15% 15% 13% 13% Operating Revenue From TEU 0 0 32,371,200 46,226,074 65,909,796 67,227,992 68,572,552 72,042,323 73,483,169 74,952,833 78,745,446 80,320,355 From Non-TEU 0 0 0 0 0 0 0 0 0 0 0 0 Total Annual Revenue 0 0 32,371,200 46,226,074 65,909,796 67,227,992 68,572,552 72,042,323 73,483,169 74,952,833 78,745,446 80,320,355 Operating Expense 150,000 500,000 49,174,568 57,534,699 66,755,499 68,090,609 69,452,421 70,841,469 72,258,299 73,703,465 75,177,534 76,681,085 EBITDA Annual -150,000 -500,000 -16,803,368 -11,308,625 -845,703 -862,617 -879,869 1,200,854 1,224,871 1,249,368 3,567,912 3,639,270 EBITDA Cumulative -650,000 -17,453,368 -28,761,993 -29,607,696 -30,470,313 -31,350,182 -30,149,328 -28,924,458 -27,675,090 -24,107,178 -20,467,907 EBITDA Margin (annual) -51.91% -24.46% -1.28% -1.28% -1.28% 1.67% 1.67% 1.67% 4.53% 4.53%
Note MH- Marine Highway Service
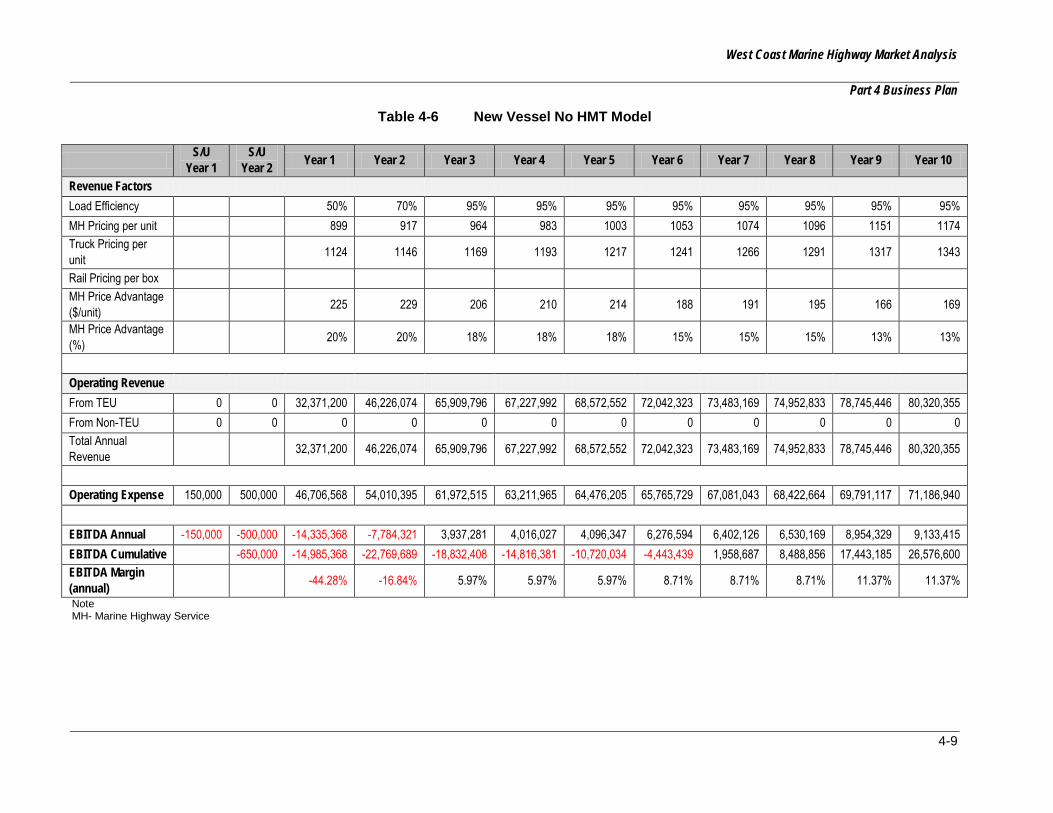
West Coast Marine Highway Market Analysis
Part 4 Business Plan
4-9
Table 4-6 New Vessel No HMT Model
S/U Year 1
S/U Year 2 Year 1 Year 2 Year 3 Year 4 Year 5 Year 6 Year 7 Year 8 Year 9 Year 10
Revenue Factors Load Efficiency 50% 70% 95% 95% 95% 95% 95% 95% 95% 95% MH Pricing per unit 899 917 964 983 1003 1053 1074 1096 1151 1174 Truck Pricing per unit 1124 1146 1169 1193 1217 1241 1266 1291 1317 1343
Rail Pricing per box MH Price Advantage ($/unit) 225 229 206 210 214 188 191 195 166 169
MH Price Advantage (%) 20% 20% 18% 18% 18% 15% 15% 15% 13% 13%
Operating Revenue From TEU 0 0 32,371,200 46,226,074 65,909,796 67,227,992 68,572,552 72,042,323 73,483,169 74,952,833 78,745,446 80,320,355 From Non-TEU 0 0 0 0 0 0 0 0 0 0 0 0 Total Annual Revenue 32,371,200 46,226,074 65,909,796 67,227,992 68,572,552 72,042,323 73,483,169 74,952,833 78,745,446 80,320,355
Operating Expense 150,000 500,000 46,706,568 54,010,395 61,972,515 63,211,965 64,476,205 65,765,729 67,081,043 68,422,664 69,791,117 71,186,940 EBITDA Annual -150,000 -500,000 -14,335,368 -7,784,321 3,937,281 4,016,027 4,096,347 6,276,594 6,402,126 6,530,169 8,954,329 9,133,415 EBITDA Cumulative -650,000 -14,985,368 -22,769,689 -18,832,408 -14,816,381 -10,720,034 -4,443,439 1,958,687 8,488,856 17,443,185 26,576,600 EBITDA Margin (annual) -44.28% -16.84% 5.97% 5.97% 5.97% 8.71% 8.71% 8.71% 11.37% 11.37%
Note MH- Marine Highway Service

West Coast Marine Highway Market Analysis
Part 4 Business Plan
4-10
Table 4-7 New Vessel All-in Model
S/U Year 1
S/U Year 2 Year 1 Year 2 Year 3 Year 4 Year 5 Year 6 Year 7 Year 8 Year 9 Year 10
Revenue Factors Load Efficiency 50% 70% 95% 95% 95% 95% 95% 95% 95% 95% MH Pricing per unit 899 917 964 983 1003 1053 1074 1096 1151 1174
Truck Pricing per unit 1124 1146 1169 1193 1217 1241 1266 1291 1317 1343
Rail Pricing per box
MH Price Advantage ($/unit)
225 229 206 210 214 188 191 195 166 169
MH Price Advantage 20% 20% 18% 18% 18% 15% 15% 15% 13% 13%
Operating Revenue From TEU 0 0 32,371,200 46,226,074 65,909,796 67,227,992 68,572,552 72,042,323 73,483,169 74,952,833 78,745,446 80,320,355 From Non-TEU 0 0 0 0 0 0 0 0 0 0 0 0 Total Annual Revenue 32,371,200 46,226,074 65,909,796 67,227,992 68,572,552 72,042,323 73,483,169 74,952,833 78,745,446 80,320,355
Operating Expense 150,000 500,000 44,878,568 51,432,651 58,503,291 59,673,357 60,866,824 62,084,160 63,325,844 64,592,360 65,884,208 67,201,892
EBITDA Annual -150,000 -500,000 -12,507,368 -5,206,577 7,406,505 7,554,635 7,705,728 9,958,163 10,157,326 10,360,472 12,861,239 13,118,463 EBITDA Cumulative -650,000 -13,157,368 -18,363,945 -10,957,440 -3,402,804 4,302,924 14,261,086 24,418,412 34,778,885 47,640,123 60,758,586
EBITDA Margin (annual) -38.64% -11.26% 11.24% 11.24% 11.24% 13.82% 13.82% 13.82% 16.33% 16.33%
Note MH- Marine Highway Service

West Coast Marine Highway Market Analysis
Part 4 Business Plan
4-11
Table 4-8 New Vessel All-in Model (Title XI)
S/U Year 1
S/U Year 2 Year 1 Year 2 Year 3 Year 4 Year 5 Year 6 Year 7 Year 8 Year 9 Year 10
Revenue Factors Load Efficiency 50% 70% 95% 95% 95% 95% 95% 95% 95% 95% MH Pricing per unit 899 917 964 983 1003 1053 1074 1096 1151 1174 Truck Pricing per unit 1124 1146 1169 1193 1217 1241 1266 1291 1317 1343 Rail Pricing per box MH Price Advantage ($/unit) 225 229 206 210 214 188 191 195 166 169
MH Price Advantage (%) 20% 20% 18% 18% 18% 15% 15% 15% 13% 13%
Operating Revenue From TEU 0 0 32,371,200 46,226,074 65,909,796 67,227,992 68,572,552 72,042,323 73,483,169 74,952,833 78,745,446 80,320,355 From Non-TEU 0 0 0 0 0 0 0 0 0 0 0 0 Total Annual Revenue 32,371,200 46,226,074 65,909,796 67,227,992 68,572,552 72,042,323 73,483,169 74,952,833 78,745,446 80,320,355 Operating Expense 150,000 500,000 41,335,495 47,818,717 54,889,357 55,987,144 57,106,887 58,249,025 59,414,006 60,602,286 61,814,331 63,050,618 EBITDA Annual -150,000 -500,000 -8,964,295 -1,592,644 11,020,439 11,240,848 11,465,665 13,793,298 14,069,164 14,350,547 16,931,115 17,269,737 EBITDA Cumulative -650,000 -9,614,295 -11,206,939 -186,500 11,054,347 22,520,012 36,313,310 50,382,474 64,733,021 81,664,136 98,933,873 EBITDA Margin (annual) -27.69% -3.45% 16.72% 16.72% 16.72% 19.15% 19.15% 19.15% 21.50% 21.50%
Note MH- Marine Highway service
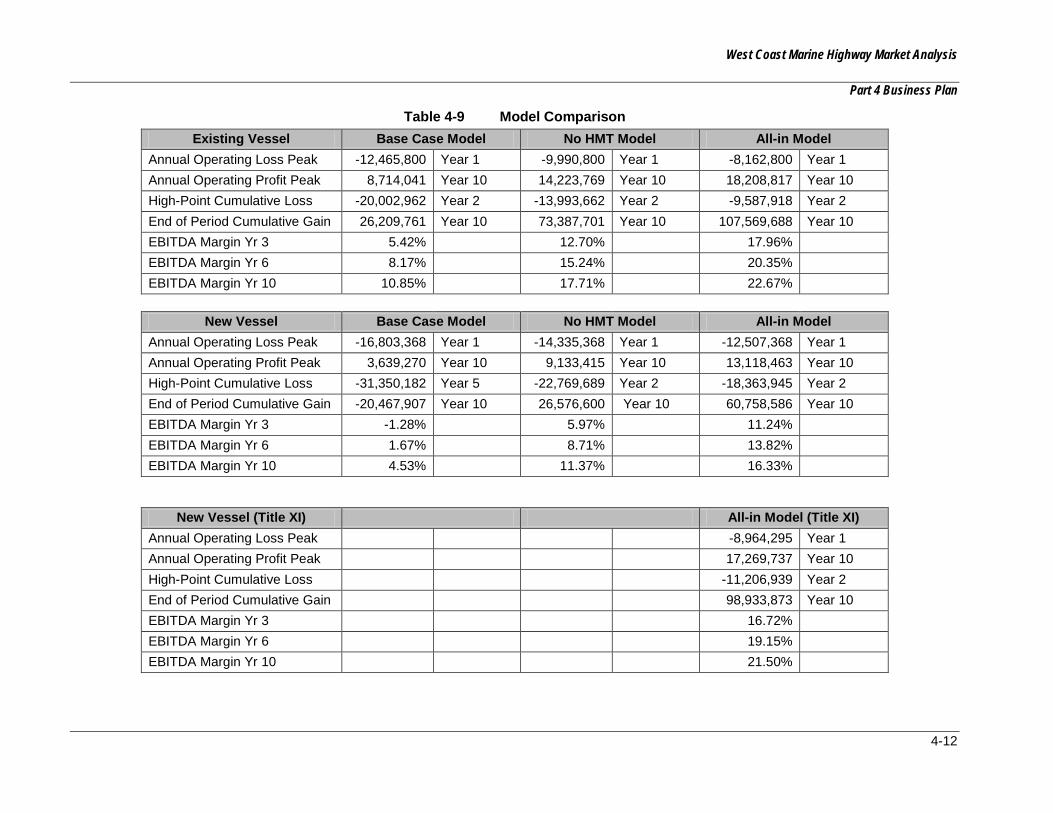
West Coast Marine Highway Market Analysis
Part 4 Business Plan
4-12
Table 4-9 Model Comparison Existing Vessel Base Case Model No HMT Model All-in Model
Annual Operating Loss Peak -12,465,800 Year 1 -9,990,800 Year 1 -8,162,800 Year 1 Annual Operating Profit Peak 8,714,041 Year 10 14,223,769 Year 10 18,208,817 Year 10 High-Point Cumulative Loss -20,002,962 Year 2 -13,993,662 Year 2 -9,587,918 Year 2 End of Period Cumulative Gain 26,209,761 Year 10 73,387,701 Year 10 107,569,688 Year 10 EBITDA Margin Yr 3 5.42% 12.70% 17.96% EBITDA Margin Yr 6 8.17% 15.24% 20.35% EBITDA Margin Yr 10 10.85% 17.71% 22.67%
New Vessel Base Case Model No HMT Model All-in Model Annual Operating Loss Peak -16,803,368 Year 1 -14,335,368 Year 1 -12,507,368 Year 1 Annual Operating Profit Peak 3,639,270 Year 10 9,133,415 Year 10 13,118,463 Year 10 High-Point Cumulative Loss -31,350,182 Year 5 -22,769,689 Year 2 -18,363,945 Year 2 End of Period Cumulative Gain -20,467,907 Year 10 26,576,600 Year 10 60,758,586 Year 10 EBITDA Margin Yr 3 -1.28% 5.97% 11.24% EBITDA Margin Yr 6 1.67% 8.71% 13.82% EBITDA Margin Yr 10 4.53% 11.37% 16.33%
New Vessel (Title XI) All-in Model (Title XI) Annual Operating Loss Peak -8,964,295 Year 1 Annual Operating Profit Peak 17,269,737 Year 10 High-Point Cumulative Loss -11,206,939 Year 2 End of Period Cumulative Gain 98,933,873 Year 10 EBITDA Margin Yr 3 16.72% EBITDA Margin Yr 6 19.15% EBITDA Margin Yr 10 21.50%
West Coast Marine Highway Market Analysis
Part 4 Business Plan
4-13
4.2.5 Performance Summary Under the assumptions used in this analysis, this route demonstrates very modest performance under the “base case scenario” using existing tonnage, while under the “all-in” scenario, even with new tonnage, the route shows promise. The fact that a vessel can make four revenue trips per week is an important consideration. The assumption that over time a 95 percent load factor is attainable across a year is aggressive but serves to set a target that will yield reasonable returns.
In the “base case” scenario assuming existing tonnage, the route produces negative cash flows in the first two years of operation, creating a cumulative deficit of more than $20M. Thereafter, notwithstanding operating at 95 percent of capacity, annual cash flows go positive but are not sufficient to offset the early deficits until Year 7. The associated Earnings Before Interest, Taxes, Depreciation, Amortization (EBITDA) margins are modest and are probably not attractive enough to attract risk capital, especially when carrying a deficit balance for six years. The existing vessels utilized in this base premise will likely not be able to sustain service for 10 years given their current age; the case is essentially theoretical but does serve to point out why HMT is an issue. It also demonstrates the essential need for cost reductions from current operating conditions and why productivity enhancements are so critical
On the other hand, under the “all-in new vessel traditional” scenario, the route performs fairly well. Though producing a cumulative deficit of $18M at the end of Year 2, subsequent positive cash flows are sufficient to yield cumulative net cash of $4M by Year 5 and about $61M through Year 10. This scenario offers EBITDA margins of about 11 percent in Year 3, 14 percent in Year 6 and over 16 percent in Year 10. Investors will show some interest in the projected rates of return, but will probably show concern that market acceptance will occur as modeled. If early year market penetration were to be less successful that modeled, this route would face difficulty recovering early enough to sustain itself.
For the “all-in new vessel Title XI” scenario, the route performs very well. Essentially, Title XI support reduces the annual vessel expense by approximately $3.5M per year and increases annual EBITDA returns by about five percent over the scenario using traditional vessel financing terms. Importantly, cumulative deficits reverse to positive territory at or about the end of Year 3 instead of Year 5, which is critical to start-up risk mitigation. Using Title XI terms generates 63 percent more cumulative profit over the 10-year period as compared with the “all-in” traditional scenario. Fundamental to operators and investors, under Title XI this route yields almost 17 percent returns in Year 3, rising to over 21 percent in Year 10.
4.3 SAN PEDRO TO PACIFIC NORTHWEST
4.3.1 Description of Opportunity
The traffic lane between the San Pedro Basin (Los Angeles/ Long Beach) and the PNW ports of either Tacoma or Seattle along the I-5 corridor may provide international and domestic cargo opportunities sufficient to support a Marine Highway business. The analysis in Part 3 indicated some opportunities for a viable operation if certain cost, business, and policy changes could be affected. The volumes of both international and domestic cargo moving via truck or rail between these major economic regions on the I-5 total over three million tons in 2007.
West Coast Marine Highway Market Analysis
Part 4 Business Plan
4-14
Markets served: International Cargo – For international cargo there is a market for “substituted service” whereby liner operators desire to reduce port calls via larger “mother” vessels but still maintain service to other important ports and cargo regions. Cost reductions and schedule integrity on the “mother” vessels can be important and alternative, domestic feeder services are an accepted method of moving these cargoes. Cargo would flow between the existing port complexes in both San Pedro Bay and PNW Ports. This was a key factor driving the Matson service in the late '90's.
Domestic Cargo – Much of the cargo moving along the I-5 Corridor is of mid-to-low value and is not time sensitive, but is price sensitive (See Part 2, Market Analysis). Consequently, these cargoes may support a Marine Highway service if the parameters of cost, reliability, and frequency are appropriate to the cargo. Due to both geographical location and the time and cost of driving through the major metropolitan areas of Los Angeles and the PNW region, domestic cargoes originating from or destined to areas south and east of the San Pedro Port complex and north and east of the PNW ports will present more favorable costs comparable to truck or rail.
4.3.2 The Business Opportunity A Marine Highway service between ports in San Pedro and the PNW will require a load line Ro/Ro-Lo/Lo combination vessel capable of an 18 knot service speed. The distance to be travelled is too great to consider the cheaper but slower deck barge. At six knots per hour service speed the conveyance is impractical and non-competitive. Even an ATB at 12 knots would require more than four days to complete the voyage which again is considered too long a time period to offer a competitive service on a weekly basis. Further, the ATB cannot do the round trip in a week.
With one load line vessel capable of 18 knots, a weekly frequency can be guaranteed and there is sufficient time in the schedule to insure the service has consistency and reliability, both essential attributes for a Marine Highway product offering. The Part 3 analysis considered an aging Ponce class combination vessel. In this business case a new domestic vessel build is also considered. While a Ponce class type vessel could operate this Marine Highway service for a number of years, the age of the vessel demands that a replacement be ordered for delivery as soon as possible to maintain the Marine Highway service.
The additional cost of a new vessel, estimated to be approximately $150 million, will obviously affect the economics of the Marine Highway service and is a critical subject that needs to be addressed if private equity and commercial interests are to provide risk capital to a Marine Highway business venture. Modern tonnage will have much better fuel efficiencies, especially if LNG is also considered as a future marine fuel source. Nonetheless, the cost of new tonnage is not totally offset by increased fuel efficiency.
A typical vessel pro-forma at 18 knots would be:
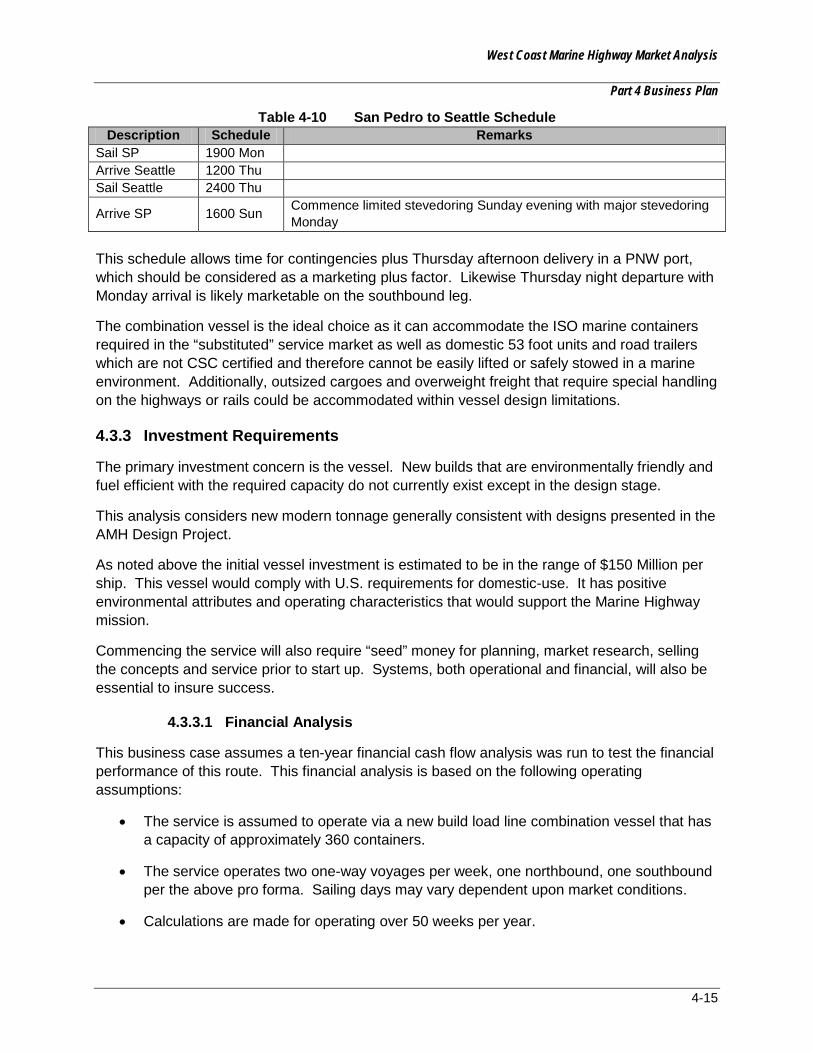
West Coast Marine Highway Market Analysis
Part 4 Business Plan
4-15
Table 4-10 San Pedro to Seattle Schedule Description Schedule Remarks
Sail SP 1900 Mon Arrive Seattle 1200 Thu Sail Seattle 2400 Thu
Arrive SP 1600 Sun Commence limited stevedoring Sunday evening with major stevedoring Monday
This schedule allows time for contingencies plus Thursday afternoon delivery in a PNW port, which should be considered as a marketing plus factor. Likewise Thursday night departure with Monday arrival is likely marketable on the southbound leg.
The combination vessel is the ideal choice as it can accommodate the ISO marine containers required in the “substituted” service market as well as domestic 53 foot units and road trailers which are not CSC certified and therefore cannot be easily lifted or safely stowed in a marine environment. Additionally, outsized cargoes and overweight freight that require special handling on the highways or rails could be accommodated within vessel design limitations.
4.3.3 Investment Requirements
The primary investment concern is the vessel. New builds that are environmentally friendly and fuel efficient with the required capacity do not currently exist except in the design stage.
This analysis considers new modern tonnage generally consistent with designs presented in the AMH Design Project.
As noted above the initial vessel investment is estimated to be in the range of $150 Million per ship. This vessel would comply with U.S. requirements for domestic-use. It has positive environmental attributes and operating characteristics that would support the Marine Highway mission.
Commencing the service will also require “seed” money for planning, market research, selling the concepts and service prior to start up. Systems, both operational and financial, will also be essential to insure success.
4.3.3.1 Financial Analysis
This business case assumes a ten-year financial cash flow analysis was run to test the financial performance of this route. This financial analysis is based on the following operating assumptions:
• The service is assumed to operate via a new build load line combination vessel that has a capacity of approximately 360 containers.
• The service operates two one-way voyages per week, one northbound, one southbound per the above pro forma. Sailing days may vary dependent upon market conditions.
• Calculations are made for operating over 50 weeks per year.

West Coast Marine Highway Market Analysis
Part 4 Business Plan
4-16
Financial calculations are supported by the following assumptions:
• The new build vessel would cost $150 million to construct and would be conventionally financed over 18 years and a blended cost of capital of six percent,
• Service pricing is pegged at 80 percent of the prevailing competitive truck rate. This base rate increases in step increments by three percent at three year intervals (years three, six, and nine),
• Pricing (revenues) and expenses escalate at two percent per year due to inflation, and
• The service experiences market acceptance as follows,
o 1st year – operations run at 50 percent of vessel capacity,
o 2nd year- operations run at 70 percent of vessel capacity, and
o 3rd year through the 10th year – operations run at 95 percent of vessel capacity.
Various financial scenarios were developed that considered financial performance either with an existing vessel or a new build vessel. For the sake of this summary, highlight two scenarios shall be highlighted: one (base case) which assumes all expenses as understood today (including existing vessel costs) with no discounting and the other (all-in) which assumes reductions in base cost for stevedoring, dockage, wharfage and HMT, but has new vessel costs, before any potential subsidies. These are as follows:
• “Base case”- full operating expenses
• “All-in” – New vessel (without subsidies either for capital or operations) but with reductions in operating expenses as follows:
4. Elimination of HMT
5. 20 percent reduction in dockage and wharfage charges, and
6. 20 percent reduction in stevedoring costs.
In all cases PierPASS charges are not considered (which is consistent with the assumptions in Part 3).
Start-up costs are conservatively set at $650,000 and noted as start-up (S/U) Year1 and Year 2. With an accelerated time table, the start-up period could be compressed to about six months if funds and vessels were available, and investors were prepared to go to risk on an expedited basis.
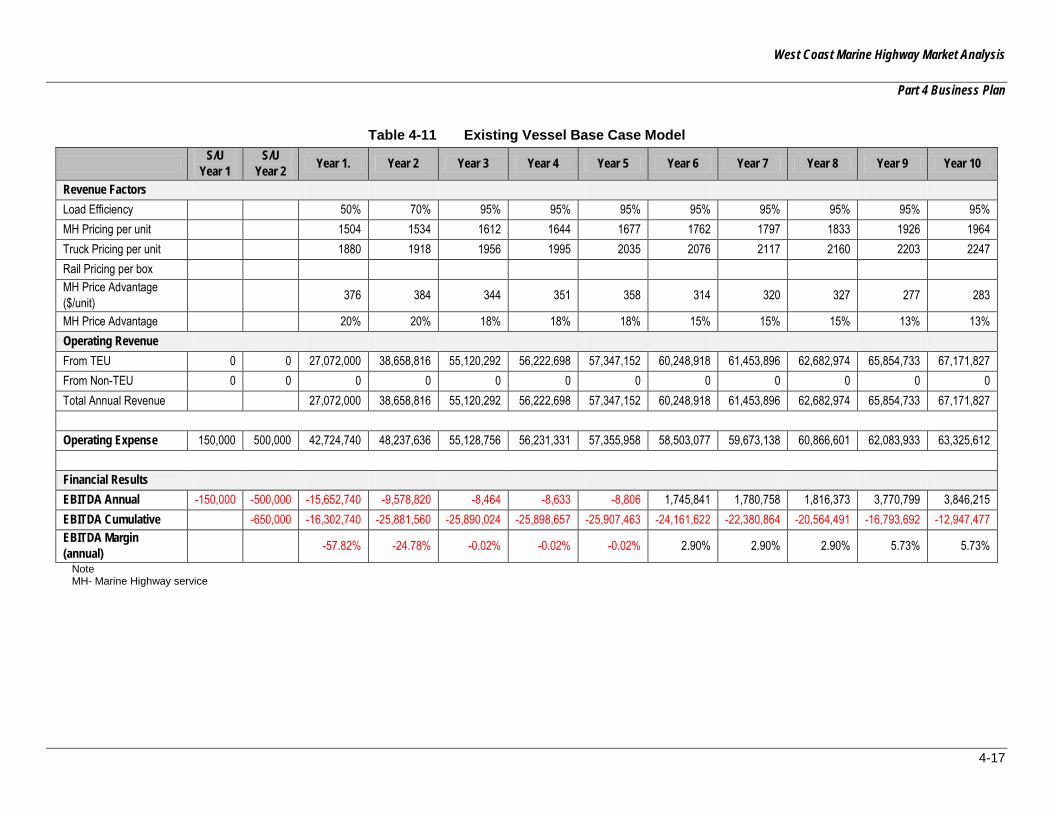
West Coast Marine Highway Market Analysis
Part 4 Business Plan
4-17
Table 4-11 Existing Vessel Base Case Model
S/U Year 1
S/U Year 2 Year 1. Year 2 Year 3 Year 4 Year 5 Year 6 Year 7 Year 8 Year 9 Year 10
Revenue Factors Load Efficiency 50% 70% 95% 95% 95% 95% 95% 95% 95% 95% MH Pricing per unit 1504 1534 1612 1644 1677 1762 1797 1833 1926 1964 Truck Pricing per unit 1880 1918 1956 1995 2035 2076 2117 2160 2203 2247 Rail Pricing per box MH Price Advantage ($/unit) 376 384 344 351 358 314 320 327 277 283
MH Price Advantage 20% 20% 18% 18% 18% 15% 15% 15% 13% 13% Operating Revenue From TEU 0 0 27,072,000 38,658,816 55,120,292 56,222,698 57,347,152 60,248,918 61,453,896 62,682,974 65,854,733 67,171,827 From Non-TEU 0 0 0 0 0 0 0 0 0 0 0 0 Total Annual Revenue 27,072,000 38,658,816 55,120,292 56,222,698 57,347,152 60,248,918 61,453,896 62,682,974 65,854,733 67,171,827 Operating Expense 150,000 500,000 42,724,740 48,237,636 55,128,756 56,231,331 57,355,958 58,503,077 59,673,138 60,866,601 62,083,933 63,325,612 Financial Results EBITDA Annual -150,000 -500,000 -15,652,740 -9,578,820 -8,464 -8,633 -8,806 1,745,841 1,780,758 1,816,373 3,770,799 3,846,215 EBITDA Cumulative -650,000 -16,302,740 -25,881,560 -25,890,024 -25,898,657 -25,907,463 -24,161,622 -22,380,864 -20,564,491 -16,793,692 -12,947,477 EBITDA Margin (annual) -57.82% -24.78% -0.02% -0.02% -0.02% 2.90% 2.90% 2.90% 5.73% 5.73%
Note MH- Marine Highway service

West Coast Marine Highway Market Analysis
Part 4 Business Plan
4-18
Table 4-12 Existing Vessel No HMT Model
S/U Year 1
S/U Year 2 Year 1 Year 2 Year 3 Year 4 Year 5 Year 6 Year 7 Year 8 Year 9 Year 10
Revenue Factors Load Efficiency 50% 70% 95% 95% 95% 95% 95% 95% 95% 95% MH Pricing per unit 1504 1534 1612 1644 1677 1762 1797 1833 1926 1964 Truck Pricing per unit 1880 1918 1956 1995 2035 2076 2117 2160 2203 2247 Rail Pricing per box MH Price Advantage ($/unit) 376 384 344 351 358 314 320 327 277 283
MH Price Advantage (%) 20% 20% 18% 18% 18% 15% 15% 15% 13% 13% Operating Revenue From TEU 0 0 27,072,000 39,431,992 56,222,698 57,347,152 58,494,095 61,453,896 62,682,974 63,936,634 67,171,827 68,515,264 From Non-TEU 0 0 0 0 0 0 0 0 0 0 0 0 Total Annual Revenue 27,072,000 39,431,992 56,222,698 57,347,152 58,494,095 61,453,896 62,682,974 63,936,634 67,171,827 68,515,264 Operating Expense 150,000 500,000 40,537,000 46,309,836 52,512,456 53,562,705 54,633,959 55,726,638 56,841,171 57,977,995 59,137,554 60,320,306 Financial Results EBITDA Annual -150,000 -500,000 -13,465,000 -6,877,844 3,710,242 3,784,447 3,860,136 5,727,258 5,841,803 5,958,639 8,034,273 8,194,958 EBITDA Cumulative -650,000 -14,115,000 -20,992,844 -17,282,602 -13,498,155 -9,638,019 -3,910,761 1,931,042 7,889,680 15,923,953 24,118,911 EBITDA Margin (annual) -49.74% -17.44% 6.60% 6.60% 6.60% 9.32% 9.32% 9.32% 11.96% 11.96% Note MH- Marine Highway service
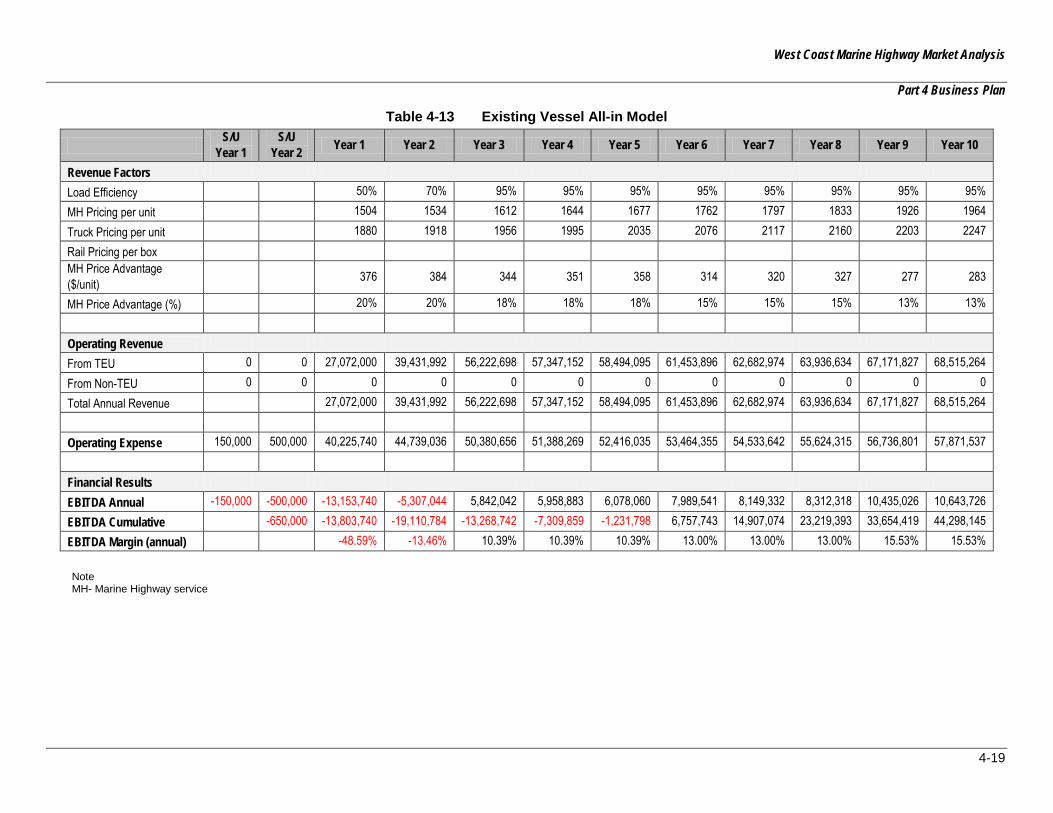
West Coast Marine Highway Market Analysis
Part 4 Business Plan
4-19
Table 4-13 Existing Vessel All-in Model
S/U Year 1
S/U Year 2 Year 1 Year 2 Year 3 Year 4 Year 5 Year 6 Year 7 Year 8 Year 9 Year 10
Revenue Factors Load Efficiency 50% 70% 95% 95% 95% 95% 95% 95% 95% 95% MH Pricing per unit 1504 1534 1612 1644 1677 1762 1797 1833 1926 1964 Truck Pricing per unit 1880 1918 1956 1995 2035 2076 2117 2160 2203 2247 Rail Pricing per box MH Price Advantage ($/unit) 376 384 344 351 358 314 320 327 277 283
MH Price Advantage (%) 20% 20% 18% 18% 18% 15% 15% 15% 13% 13% Operating Revenue From TEU 0 0 27,072,000 39,431,992 56,222,698 57,347,152 58,494,095 61,453,896 62,682,974 63,936,634 67,171,827 68,515,264 From Non-TEU 0 0 0 0 0 0 0 0 0 0 0 0 Total Annual Revenue 27,072,000 39,431,992 56,222,698 57,347,152 58,494,095 61,453,896 62,682,974 63,936,634 67,171,827 68,515,264 Operating Expense 150,000 500,000 40,225,740 44,739,036 50,380,656 51,388,269 52,416,035 53,464,355 54,533,642 55,624,315 56,736,801 57,871,537 Financial Results EBITDA Annual -150,000 -500,000 -13,153,740 -5,307,044 5,842,042 5,958,883 6,078,060 7,989,541 8,149,332 8,312,318 10,435,026 10,643,726 EBITDA Cumulative -650,000 -13,803,740 -19,110,784 -13,268,742 -7,309,859 -1,231,798 6,757,743 14,907,074 23,219,393 33,654,419 44,298,145 EBITDA Margin (annual) -48.59% -13.46% 10.39% 10.39% 10.39% 13.00% 13.00% 13.00% 15.53% 15.53% Note MH- Marine Highway service
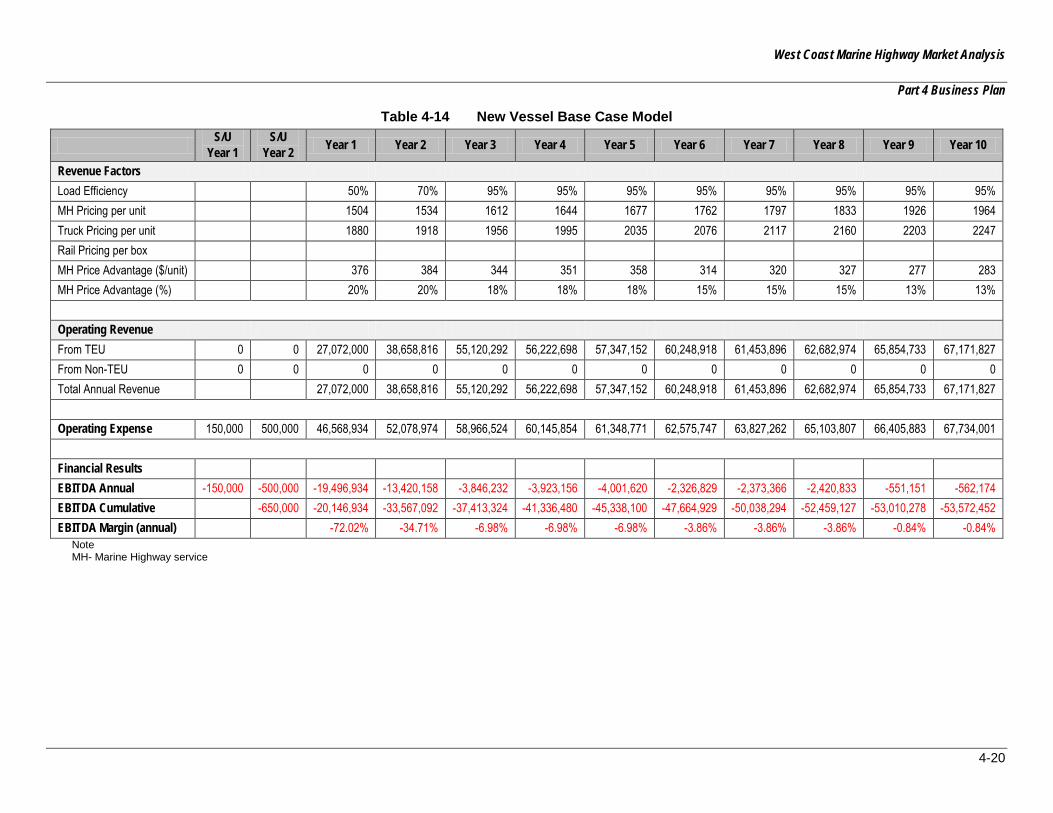
West Coast Marine Highway Market Analysis
Part 4 Business Plan
4-20
Table 4-14 New Vessel Base Case Model
S/U Year 1
S/U Year 2 Year 1 Year 2 Year 3 Year 4 Year 5 Year 6 Year 7 Year 8 Year 9 Year 10
Revenue Factors Load Efficiency 50% 70% 95% 95% 95% 95% 95% 95% 95% 95% MH Pricing per unit 1504 1534 1612 1644 1677 1762 1797 1833 1926 1964 Truck Pricing per unit 1880 1918 1956 1995 2035 2076 2117 2160 2203 2247 Rail Pricing per box MH Price Advantage ($/unit) 376 384 344 351 358 314 320 327 277 283 MH Price Advantage (%) 20% 20% 18% 18% 18% 15% 15% 15% 13% 13% Operating Revenue From TEU 0 0 27,072,000 38,658,816 55,120,292 56,222,698 57,347,152 60,248,918 61,453,896 62,682,974 65,854,733 67,171,827 From Non-TEU 0 0 0 0 0 0 0 0 0 0 0 0 Total Annual Revenue 27,072,000 38,658,816 55,120,292 56,222,698 57,347,152 60,248,918 61,453,896 62,682,974 65,854,733 67,171,827 Operating Expense 150,000 500,000 46,568,934 52,078,974 58,966,524 60,145,854 61,348,771 62,575,747 63,827,262 65,103,807 66,405,883 67,734,001 Financial Results EBITDA Annual -150,000 -500,000 -19,496,934 -13,420,158 -3,846,232 -3,923,156 -4,001,620 -2,326,829 -2,373,366 -2,420,833 -551,151 -562,174 EBITDA Cumulative -650,000 -20,146,934 -33,567,092 -37,413,324 -41,336,480 -45,338,100 -47,664,929 -50,038,294 -52,459,127 -53,010,278 -53,572,452 EBITDA Margin (annual) -72.02% -34.71% -6.98% -6.98% -6.98% -3.86% -3.86% -3.86% -0.84% -0.84%
Note MH- Marine Highway service
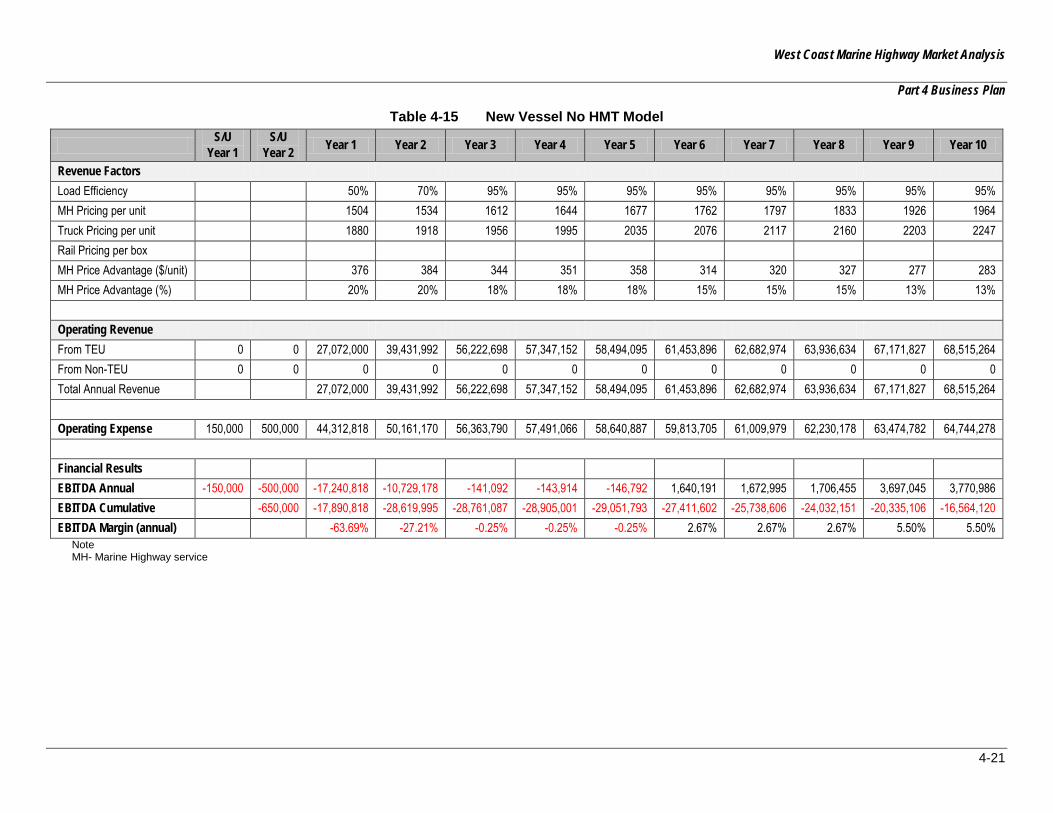
West Coast Marine Highway Market Analysis
Part 4 Business Plan
4-21
Table 4-15 New Vessel No HMT Model
S/U Year 1
S/U Year 2 Year 1 Year 2 Year 3 Year 4 Year 5 Year 6 Year 7 Year 8 Year 9 Year 10
Revenue Factors Load Efficiency 50% 70% 95% 95% 95% 95% 95% 95% 95% 95% MH Pricing per unit 1504 1534 1612 1644 1677 1762 1797 1833 1926 1964 Truck Pricing per unit 1880 1918 1956 1995 2035 2076 2117 2160 2203 2247 Rail Pricing per box MH Price Advantage ($/unit) 376 384 344 351 358 314 320 327 277 283 MH Price Advantage (%) 20% 20% 18% 18% 18% 15% 15% 15% 13% 13% Operating Revenue From TEU 0 0 27,072,000 39,431,992 56,222,698 57,347,152 58,494,095 61,453,896 62,682,974 63,936,634 67,171,827 68,515,264 From Non-TEU 0 0 0 0 0 0 0 0 0 0 0 0 Total Annual Revenue 27,072,000 39,431,992 56,222,698 57,347,152 58,494,095 61,453,896 62,682,974 63,936,634 67,171,827 68,515,264 Operating Expense 150,000 500,000 44,312,818 50,161,170 56,363,790 57,491,066 58,640,887 59,813,705 61,009,979 62,230,178 63,474,782 64,744,278 Financial Results EBITDA Annual -150,000 -500,000 -17,240,818 -10,729,178 -141,092 -143,914 -146,792 1,640,191 1,672,995 1,706,455 3,697,045 3,770,986 EBITDA Cumulative -650,000 -17,890,818 -28,619,995 -28,761,087 -28,905,001 -29,051,793 -27,411,602 -25,738,606 -24,032,151 -20,335,106 -16,564,120 EBITDA Margin (annual) -63.69% -27.21% -0.25% -0.25% -0.25% 2.67% 2.67% 2.67% 5.50% 5.50%
Note MH- Marine Highway service
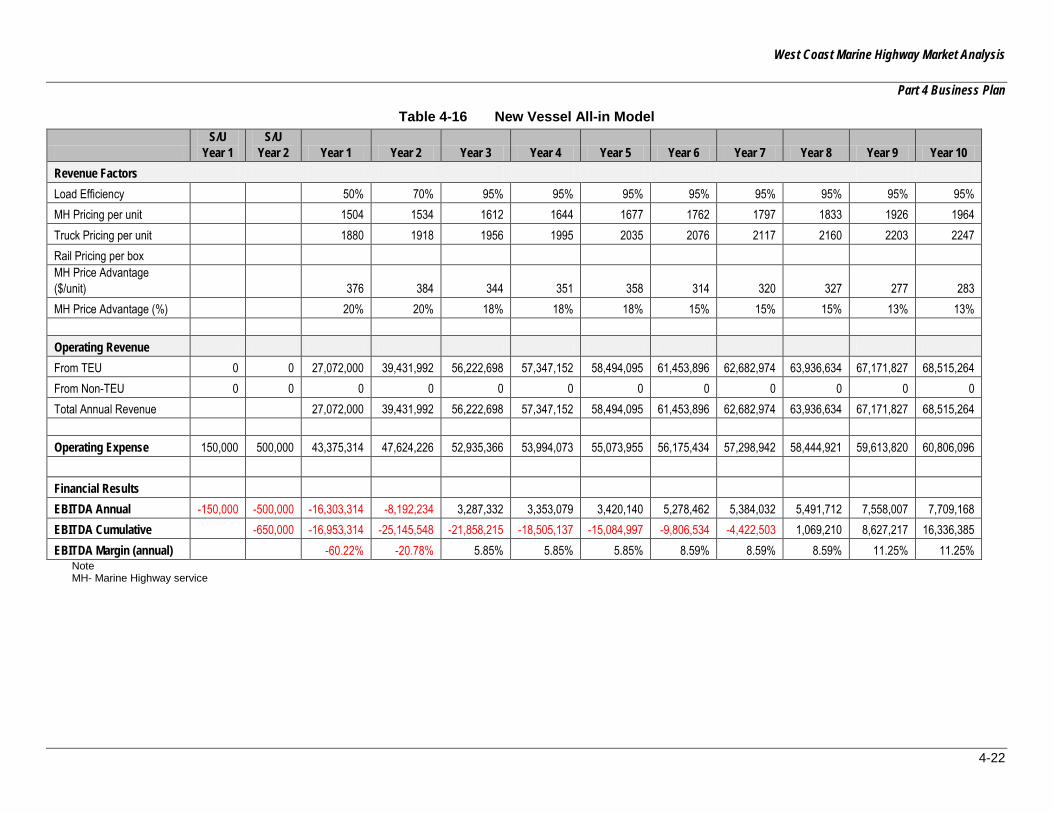
West Coast Marine Highway Market Analysis
Part 4 Business Plan
4-22
Table 4-16 New Vessel All-in Model
S/U
Year 1 S/U
Year 2 Year 1 Year 2 Year 3 Year 4 Year 5 Year 6 Year 7 Year 8 Year 9 Year 10 Revenue Factors Load Efficiency 50% 70% 95% 95% 95% 95% 95% 95% 95% 95% MH Pricing per unit 1504 1534 1612 1644 1677 1762 1797 1833 1926 1964 Truck Pricing per unit 1880 1918 1956 1995 2035 2076 2117 2160 2203 2247 Rail Pricing per box MH Price Advantage ($/unit) 376 384 344 351 358 314 320 327 277 283 MH Price Advantage (%) 20% 20% 18% 18% 18% 15% 15% 15% 13% 13% Operating Revenue From TEU 0 0 27,072,000 39,431,992 56,222,698 57,347,152 58,494,095 61,453,896 62,682,974 63,936,634 67,171,827 68,515,264 From Non-TEU 0 0 0 0 0 0 0 0 0 0 0 0 Total Annual Revenue 27,072,000 39,431,992 56,222,698 57,347,152 58,494,095 61,453,896 62,682,974 63,936,634 67,171,827 68,515,264 Operating Expense 150,000 500,000 43,375,314 47,624,226 52,935,366 53,994,073 55,073,955 56,175,434 57,298,942 58,444,921 59,613,820 60,806,096 Financial Results EBITDA Annual -150,000 -500,000 -16,303,314 -8,192,234 3,287,332 3,353,079 3,420,140 5,278,462 5,384,032 5,491,712 7,558,007 7,709,168 EBITDA Cumulative -650,000 -16,953,314 -25,145,548 -21,858,215 -18,505,137 -15,084,997 -9,806,534 -4,422,503 1,069,210 8,627,217 16,336,385 EBITDA Margin (annual) -60.22% -20.78% 5.85% 5.85% 5.85% 8.59% 8.59% 8.59% 11.25% 11.25%
Note MH- Marine Highway service
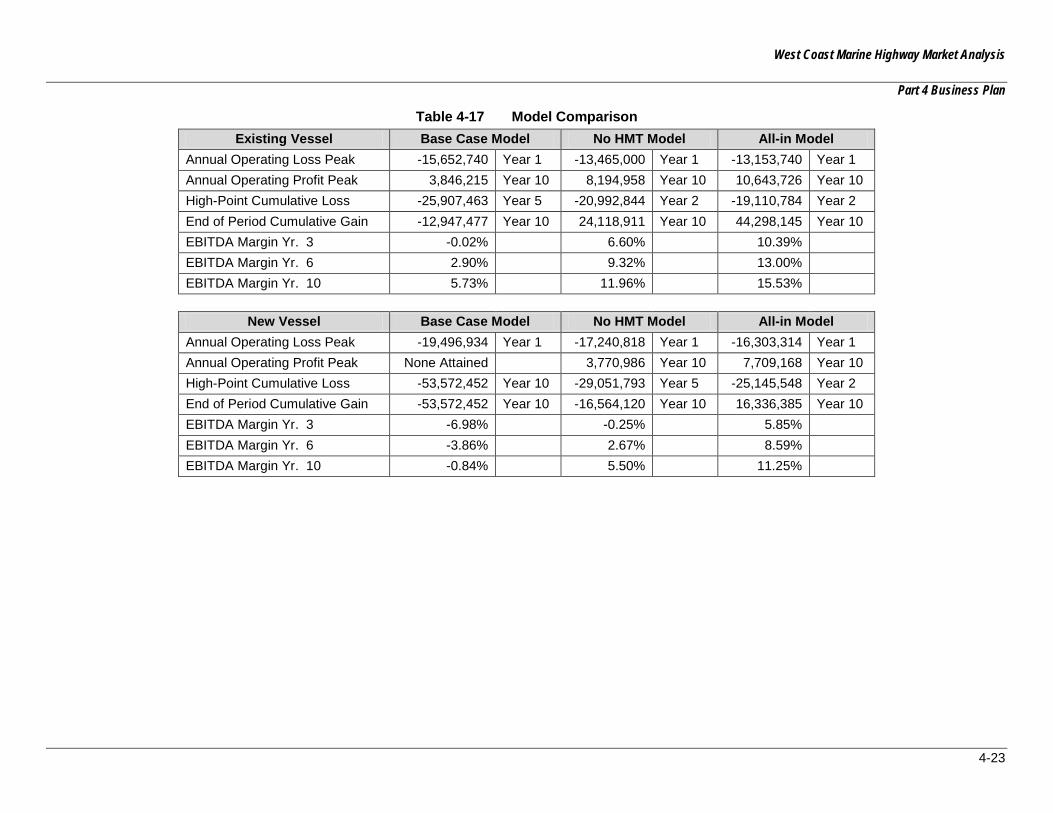
West Coast Marine Highway Market Analysis
Part 4 Business Plan
4-23
Table 4-17 Model Comparison Existing Vessel Base Case Model No HMT Model All-in Model
Annual Operating Loss Peak -15,652,740 Year 1 -13,465,000 Year 1 -13,153,740 Year 1 Annual Operating Profit Peak 3,846,215 Year 10 8,194,958 Year 10 10,643,726 Year 10 High-Point Cumulative Loss -25,907,463 Year 5 -20,992,844 Year 2 -19,110,784 Year 2 End of Period Cumulative Gain -12,947,477 Year 10 24,118,911 Year 10 44,298,145 Year 10 EBITDA Margin Yr. 3 -0.02% 6.60% 10.39% EBITDA Margin Yr. 6 2.90% 9.32% 13.00% EBITDA Margin Yr. 10 5.73% 11.96% 15.53%
New Vessel Base Case Model No HMT Model All-in Model Annual Operating Loss Peak -19,496,934 Year 1 -17,240,818 Year 1 -16,303,314 Year 1 Annual Operating Profit Peak None Attained 3,770,986 Year 10 7,709,168 Year 10 High-Point Cumulative Loss -53,572,452 Year 10 -29,051,793 Year 5 -25,145,548 Year 2 End of Period Cumulative Gain -53,572,452 Year 10 -16,564,120 Year 10 16,336,385 Year 10 EBITDA Margin Yr. 3 -6.98% -0.25% 5.85% EBITDA Margin Yr. 6 -3.86% 2.67% 8.59% EBITDA Margin Yr. 10 -0.84% 5.50% 11.25%

West Coast Marine Highway Market Analysis
Part 4 Business Plan
4-24
4.3.4 Performance Summary
Under the assumptions used in this analysis, this route demonstrates marginal performance under the “base case” scenario using existing tonnage only after major cost reductions, exemption from HMT, and aggressive 95 percent load factors sustained over 50 weeks. In the “all-in” scenario, utilizing new, more modern vessel tonnage and applying the cost reductions and strong load factors, the route shows some promise. The risks associated with attaining the sustained revenue levels and load factors are high. Likewise, the modeled cost reductions may be difficult to attain. The issues related to HMT are beyond the scope of this study but do represent a major expense category that needs to be dealt with if Marine Highway services are to be commercially profitable in the long term.
In the “base case” scenario (existing tonnage) , the route produces substantial negative cash flows in the first two years of operation, creating a cumulative deficit of $26M. From Year 6, annual cash flows go positive but are not sufficient to offset the early deficits. The associated EBITDA margins in Years 6-10 are modest and are not considered attractive enough to attract risk capital.
Under the “all-in” scenario (new build), the route performs reasonably well. Though the route produces a cumulative deficit of $25M by Year 2, subsequent positive cash flows are sufficient to yield cumulative net cash of $16M in Year 10. This scenario offers EBITDA margins of about six percent in Year 3, nine percent in Year 6 and 11 percent in year 10. Investors will show modest levels interest in the projected rates of return and will probably also show high concern about early year performance. If early year market penetration were to be less successful than modeled, this route would face difficulty recovering early enough to sustain it. Again, as noted, the load factor estimates are aggressive as are the cost reductions and labor productivity improvements. Title XI financing would improve the financial attractiveness of this Marine Highway service.
4.4 SAN FRANCISCO TO PACIFIC NORTHWEST
4.4.1 Description of Opportunity
This traffic lane between the San Francisco Bay and the PNW ports of Tacoma and Seattle along the I-5 corridor, much like the other two major coastwise lanes between San Pedro and San Francisco, and San Pedro and the PNW, will likely provide cargo opportunities sufficient to support a Marine Highway business. The volume of domestic cargo moving via truck or rail between these major economic regions on the I-5 corridor totaled over one million tons in 2007.
Markets served:
International Cargo – For international cargo there is a market for “substituted service” whereby liner operators desire to reduce port calls via larger “mother” vessels but still maintain service to other important ports and cargo regions. Cost reductions and schedule integrity on the “mother” vessels can be important and alternative, domestic feeder services are an accepted method of moving these cargoes. Alternatively, international containers discharged to distributions centers in Oakland and or the PNW ports ultimately destined for the other port could be loaded on to
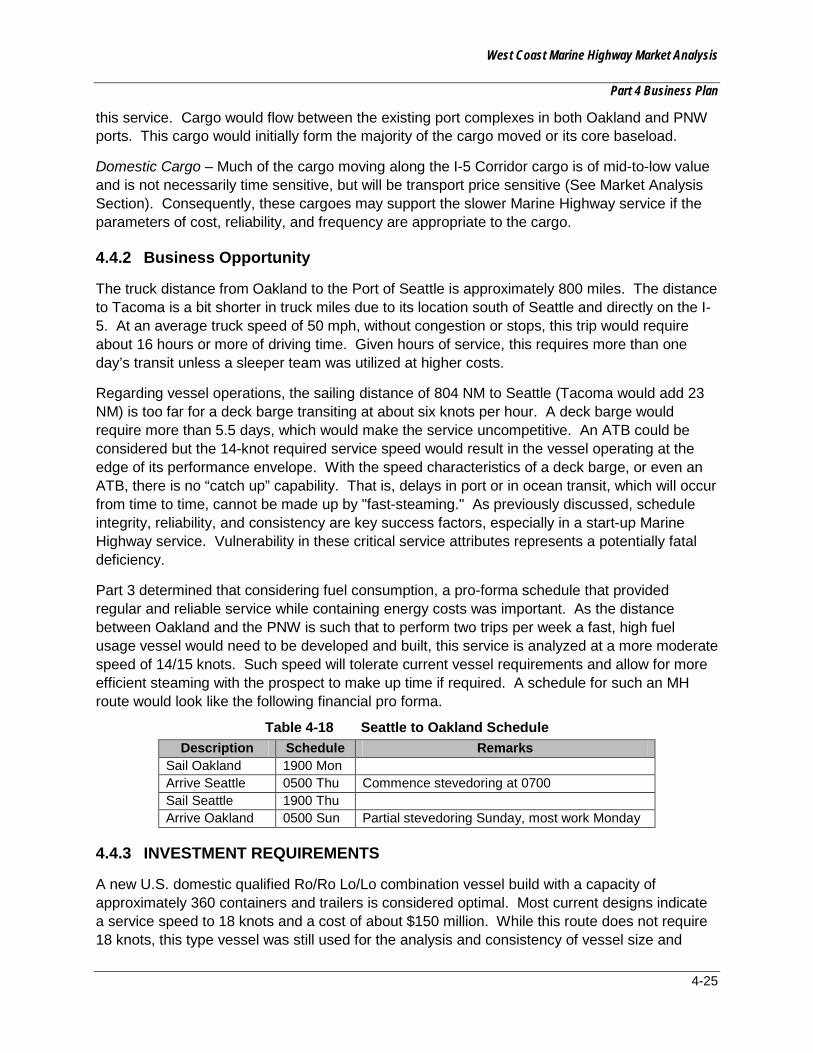
West Coast Marine Highway Market Analysis
Part 4 Business Plan
4-25
this service. Cargo would flow between the existing port complexes in both Oakland and PNW ports. This cargo would initially form the majority of the cargo moved or its core baseload.
Domestic Cargo – Much of the cargo moving along the I-5 Corridor cargo is of mid-to-low value and is not necessarily time sensitive, but will be transport price sensitive (See Market Analysis Section). Consequently, these cargoes may support the slower Marine Highway service if the parameters of cost, reliability, and frequency are appropriate to the cargo.
4.4.2 Business Opportunity
The truck distance from Oakland to the Port of Seattle is approximately 800 miles. The distance to Tacoma is a bit shorter in truck miles due to its location south of Seattle and directly on the I-5. At an average truck speed of 50 mph, without congestion or stops, this trip would require about 16 hours or more of driving time. Given hours of service, this requires more than one day’s transit unless a sleeper team was utilized at higher costs.
Regarding vessel operations, the sailing distance of 804 NM to Seattle (Tacoma would add 23 NM) is too far for a deck barge transiting at about six knots per hour. A deck barge would require more than 5.5 days, which would make the service uncompetitive. An ATB could be considered but the 14-knot required service speed would result in the vessel operating at the edge of its performance envelope. With the speed characteristics of a deck barge, or even an ATB, there is no “catch up” capability. That is, delays in port or in ocean transit, which will occur from time to time, cannot be made up by "fast-steaming." As previously discussed, schedule integrity, reliability, and consistency are key success factors, especially in a start-up Marine Highway service. Vulnerability in these critical service attributes represents a potentially fatal deficiency.
Part 3 determined that considering fuel consumption, a pro-forma schedule that provided regular and reliable service while containing energy costs was important. As the distance between Oakland and the PNW is such that to perform two trips per week a fast, high fuel usage vessel would need to be developed and built, this service is analyzed at a more moderate speed of 14/15 knots. Such speed will tolerate current vessel requirements and allow for more efficient steaming with the prospect to make up time if required. A schedule for such an MH route would look like the following financial pro forma.
Table 4-18 Seattle to Oakland Schedule Description Schedule Remarks
Sail Oakland 1900 Mon Arrive Seattle 0500 Thu Commence stevedoring at 0700 Sail Seattle 1900 Thu Arrive Oakland 0500 Sun Partial stevedoring Sunday, most work Monday
4.4.3 INVESTMENT REQUIREMENTS
A new U.S. domestic qualified Ro/Ro Lo/Lo combination vessel build with a capacity of approximately 360 containers and trailers is considered optimal. Most current designs indicate a service speed to 18 knots and a cost of about $150 million. While this route does not require 18 knots, this type vessel was still used for the analysis and consistency of vessel size and
West Coast Marine Highway Market Analysis
Part 4 Business Plan
4-26
design has a value and would provide a potential operator with alternatives and flexibility of vessel deployment, especially if more than one route is considered in a broad Marine Highway business plan.
4.4.4 FINANCIAL ANALYSIS
A ten year financial cash flow analysis was run to test the financial performance of this route. This financial analysis is based on the following operating assumptions:
• The service is assumed to operate via a load line vessel that has a capacity of 360 containers. This vessel would operate at relatively slow 14 knots to enhance fuel savings.
• The service operates one round trip per week. Calculations are made for operating over 50 weeks per year.
Financial calculations are supported by the following assumptions:
• Conventional financing for a vessel costing $150 million, financed over 18 years at a rate of six percent.
• Service pricing is pegged at 80 percent of the prevailing competitive truck rate. This base rate increases in step increments by three percent at three year intervals (years 3, 6 and 9)
• Pricing (revenues) and expenses escalate at two percent per year due to inflation
• The service experiences market acceptance as follows:
o 1st year – operations run at 50 percent of capacity
o 2nd year- operations run at 70 percent of capacity
o 3rd year through the 10th year – operations run at 95 percent of capacity
Various financial scenarios were developed that considered financial performance either with an existing vessel or a new build vessel. For the sake of this summary, two scenarios are highlighted: one (base case) which assumes all expenses as understood today using existing but aged vessel assets with no discounting and the other (all-in) which assumes reductions in base cost for stevedoring, dockage and wharfage and Harbor Maintenance Tax. These are as follows:
• “Base case”- full operating expenses
• “All-in” – reductions in operating expenses as follows:
1. Elimination of HMT
2. 20 percent reduction in dockage and wharfage charges, and
3. 20 percent reduction in stevedoring costs.

West Coast Marine Highway Market Analysis
Part 4 Business Plan
4-27
The cases are then repeated using new tonnage with an investment of about $150 million but more efficient fuel usage.
In both cases the model assumes start-up costs aggregating $650,000 over two years to prepare the business for full-scale operations. These costs are very conservative, as a detailed marketing study would need to be conducted with a corresponding sales and advertising plan. Personnel would need to be employed in advance of any commencement of sailing and most importantly, operating, control and financial systems would need to be purchased and prepared for implementation. Additionally funds would need to be available to pay for initial vessel charter and fuel costs.
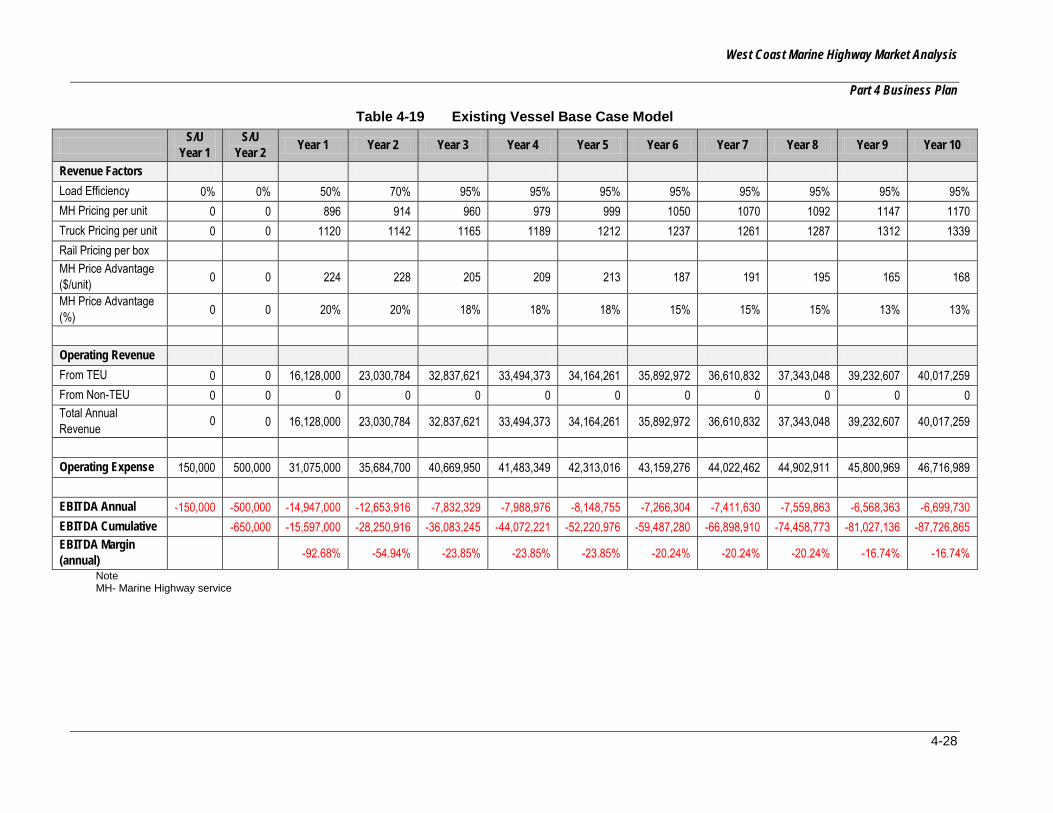
West Coast Marine Highway Market Analysis
Part 4 Business Plan
4-28
Table 4-19 Existing Vessel Base Case Model
S/U Year 1
S/U Year 2 Year 1 Year 2 Year 3 Year 4 Year 5 Year 6 Year 7 Year 8 Year 9 Year 10
Revenue Factors Load Efficiency 0% 0% 50% 70% 95% 95% 95% 95% 95% 95% 95% 95% MH Pricing per unit 0 0 896 914 960 979 999 1050 1070 1092 1147 1170 Truck Pricing per unit 0 0 1120 1142 1165 1189 1212 1237 1261 1287 1312 1339 Rail Pricing per box MH Price Advantage ($/unit) 0 0 224 228 205 209 213 187 191 195 165 168
MH Price Advantage (%) 0 0 20% 20% 18% 18% 18% 15% 15% 15% 13% 13%
Operating Revenue From TEU 0 0 16,128,000 23,030,784 32,837,621 33,494,373 34,164,261 35,892,972 36,610,832 37,343,048 39,232,607 40,017,259 From Non-TEU 0 0 0 0 0 0 0 0 0 0 0 0 Total Annual Revenue 0 0 16,128,000 23,030,784 32,837,621 33,494,373 34,164,261 35,892,972 36,610,832 37,343,048 39,232,607 40,017,259
Operating Expense 150,000 500,000 31,075,000 35,684,700 40,669,950 41,483,349 42,313,016 43,159,276 44,022,462 44,902,911 45,800,969 46,716,989 EBITDA Annual -150,000 -500,000 -14,947,000 -12,653,916 -7,832,329 -7,988,976 -8,148,755 -7,266,304 -7,411,630 -7,559,863 -6,568,363 -6,699,730 EBITDA Cumulative -650,000 -15,597,000 -28,250,916 -36,083,245 -44,072,221 -52,220,976 -59,487,280 -66,898,910 -74,458,773 -81,027,136 -87,726,865 EBITDA Margin (annual) -92.68% -54.94% -23.85% -23.85% -23.85% -20.24% -20.24% -20.24% -16.74% -16.74%
Note MH- Marine Highway service

West Coast Marine Highway Market Analysis
Part 4 Business Plan
4-29
Table 4-20 Existing Vessel No HMT Model
S/U Year 1
S/U Year 2 Year 1 Year 2 Year 3 Year 4 Year 5 Year 6 Year 7 Year 8 Year 9 Year 10
Revenue Factors Load Efficiency 50% 70% 95% 95% 95% 95% 95% 95% 95% 95% MH Pricing per unit 896 914 960 979 999 1050 1070 1092 1147 1170 Truck Pricing per unit 1120 1142 1165 1189 1212 1237 1261 1287 1312 1339 Rail Pricing per box MH Price Advantage ($/unit) 224 228 205 209 213 187 191 195 165 168
MH Price Advantage (%) 20% 20% 18% 18% 18% 15% 15% 15% 13% 13%
Operating Revenue From TEU 0 0 16,128,000 23,030,784 32,837,621 33,494,373 34,164,261 35,892,972 36,610,832 37,343,048 39,232,607 40,017,259 From Non-TEU 0 0 0 0 0 0 0 0 0 0 0 0 Total Annual Revenue 16,128,000 23,030,784 32,837,621 33,494,373 34,164,261 35,892,972 36,610,832 37,343,048 39,232,607 40,017,259 Operating Expense 150,000 500,000 30,450,000 34,792,200 39,458,700 40,247,874 41,052,831 41,873,888 42,711,366 43,565,593 44,436,905 45,325,643 EBITDA Annual -150,000 -500,000 -14,322,000 -11,761,416 -6,621,079 -6,753,501 -6,888,571 -5,980,916 -6,100,534 -6,222,545 -5,204,298 -5,308,384 EBITDA Cumulative -650,000 -14,972,000 -26,733,416 -33,354,495 -40,107,996 -46,996,567 -52,977,482 -59,078,017 -65,300,561 -70,504,860 -75,813,244 EBITDA Margin (annual) -88.80
percent -51.07% -20.16% -20.16% -20.16% -16.66% -16.66% -16.66% -13.27% -13.27%
Note MH- Marine Highway service
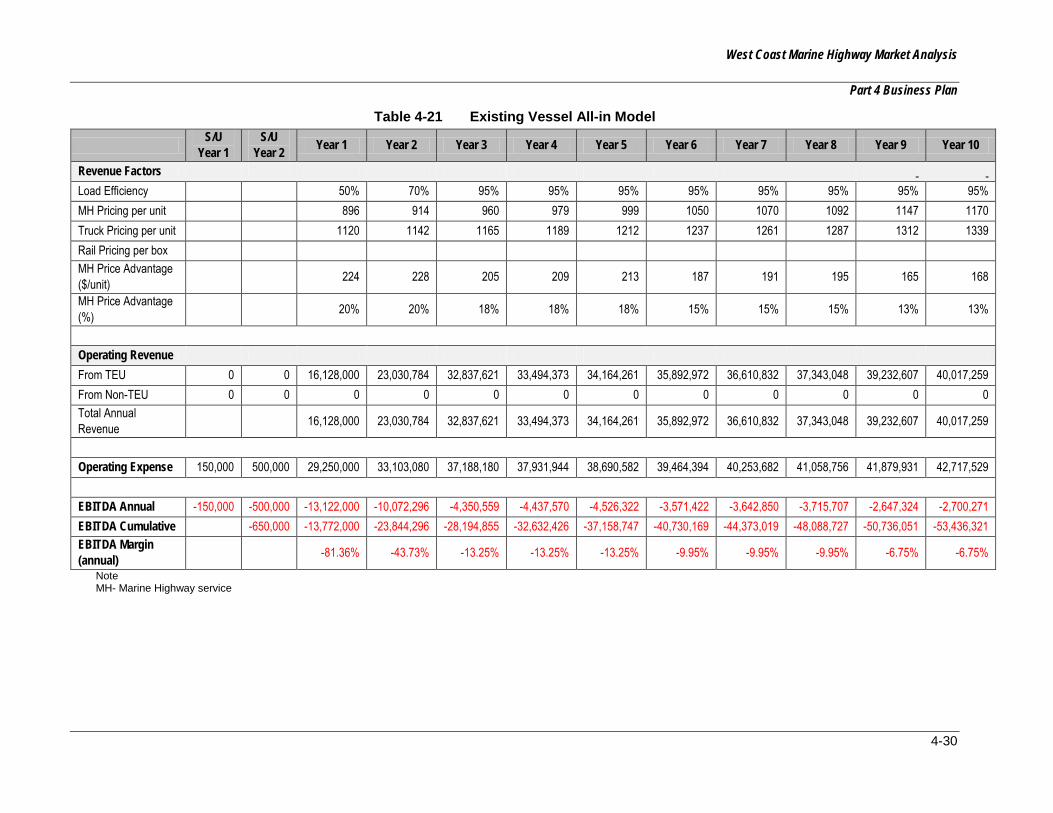
West Coast Marine Highway Market Analysis
Part 4 Business Plan
4-30
Table 4-21 Existing Vessel All-in Model
S/U Year 1
S/U Year 2 Year 1 Year 2 Year 3 Year 4 Year 5 Year 6 Year 7 Year 8 Year 9 Year 10
Revenue Factors Load Efficiency 50% 70% 95% 95% 95% 95% 95% 95% 95% 95% MH Pricing per unit 896 914 960 979 999 1050 1070 1092 1147 1170 Truck Pricing per unit 1120 1142 1165 1189 1212 1237 1261 1287 1312 1339 Rail Pricing per box MH Price Advantage ($/unit) 224 228 205 209 213 187 191 195 165 168
MH Price Advantage (%) 20% 20% 18% 18% 18% 15% 15% 15% 13% 13%
Operating Revenue From TEU 0 0 16,128,000 23,030,784 32,837,621 33,494,373 34,164,261 35,892,972 36,610,832 37,343,048 39,232,607 40,017,259 From Non-TEU 0 0 0 0 0 0 0 0 0 0 0 0 Total Annual Revenue 16,128,000 23,030,784 32,837,621 33,494,373 34,164,261 35,892,972 36,610,832 37,343,048 39,232,607 40,017,259
Operating Expense 150,000 500,000 29,250,000 33,103,080 37,188,180 37,931,944 38,690,582 39,464,394 40,253,682 41,058,756 41,879,931 42,717,529 EBITDA Annual -150,000 -500,000 -13,122,000 -10,072,296 -4,350,559 -4,437,570 -4,526,322 -3,571,422 -3,642,850 -3,715,707 -2,647,324 -2,700,271 EBITDA Cumulative -650,000 -13,772,000 -23,844,296 -28,194,855 -32,632,426 -37,158,747 -40,730,169 -44,373,019 -48,088,727 -50,736,051 -53,436,321 EBITDA Margin (annual) -81.36% -43.73% -13.25% -13.25% -13.25% -9.95% -9.95% -9.95% -6.75% -6.75%
Note MH- Marine Highway service
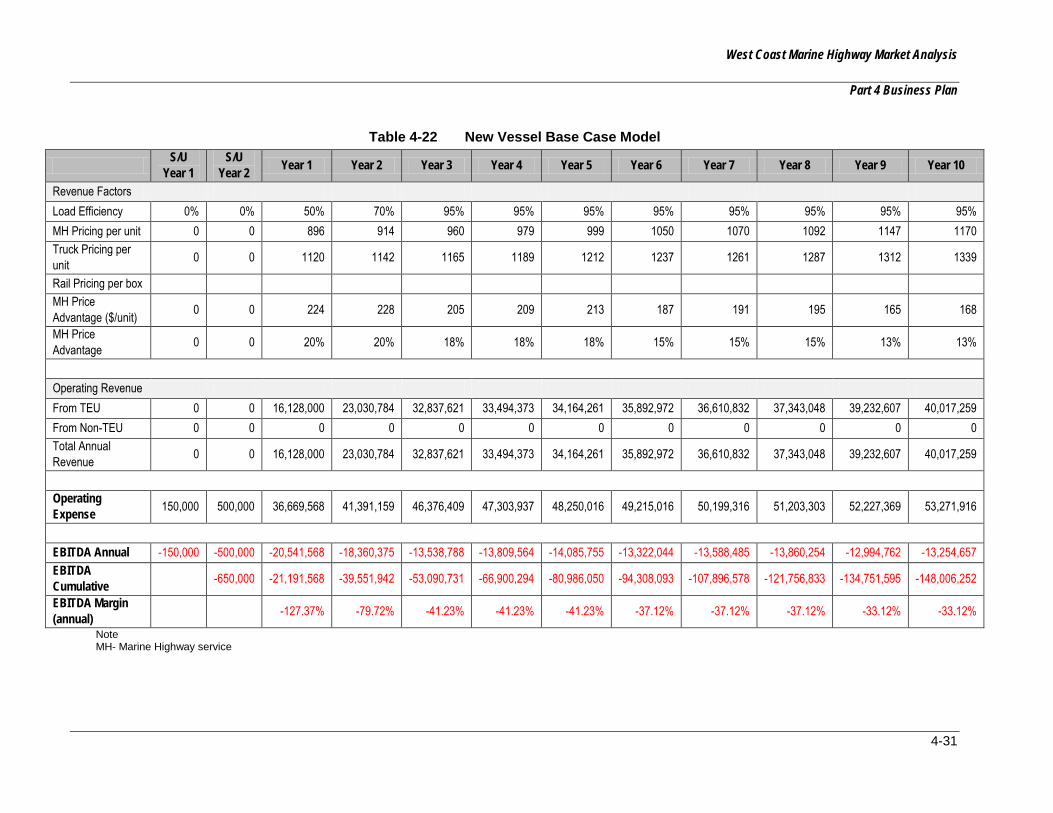
West Coast Marine Highway Market Analysis
Part 4 Business Plan
4-31
Table 4-22 New Vessel Base Case Model
S/U Year 1
S/U Year 2 Year 1 Year 2 Year 3 Year 4 Year 5 Year 6 Year 7 Year 8 Year 9 Year 10
Revenue Factors Load Efficiency 0% 0% 50% 70% 95% 95% 95% 95% 95% 95% 95% 95% MH Pricing per unit 0 0 896 914 960 979 999 1050 1070 1092 1147 1170 Truck Pricing per unit 0 0 1120 1142 1165 1189 1212 1237 1261 1287 1312 1339
Rail Pricing per box MH Price Advantage ($/unit) 0 0 224 228 205 209 213 187 191 195 165 168
MH Price Advantage 0 0 20% 20% 18% 18% 18% 15% 15% 15% 13% 13%
Operating Revenue From TEU 0 0 16,128,000 23,030,784 32,837,621 33,494,373 34,164,261 35,892,972 36,610,832 37,343,048 39,232,607 40,017,259 From Non-TEU 0 0 0 0 0 0 0 0 0 0 0 0 Total Annual Revenue 0 0 16,128,000 23,030,784 32,837,621 33,494,373 34,164,261 35,892,972 36,610,832 37,343,048 39,232,607 40,017,259
Operating Expense 150,000 500,000 36,669,568 41,391,159 46,376,409 47,303,937 48,250,016 49,215,016 50,199,316 51,203,303 52,227,369 53,271,916
EBITDA Annual -150,000 -500,000 -20,541,568 -18,360,375 -13,538,788 -13,809,564 -14,085,755 -13,322,044 -13,588,485 -13,860,254 -12,994,762 -13,254,657 EBITDA Cumulative -650,000 -21,191,568 -39,551,942 -53,090,731 -66,900,294 -80,986,050 -94,308,093 -107,896,578 -121,756,833 -134,751,595 -148,006,252
EBITDA Margin (annual) -127.37% -79.72% -41.23% -41.23% -41.23% -37.12% -37.12% -37.12% -33.12% -33.12%
Note MH- Marine Highway service
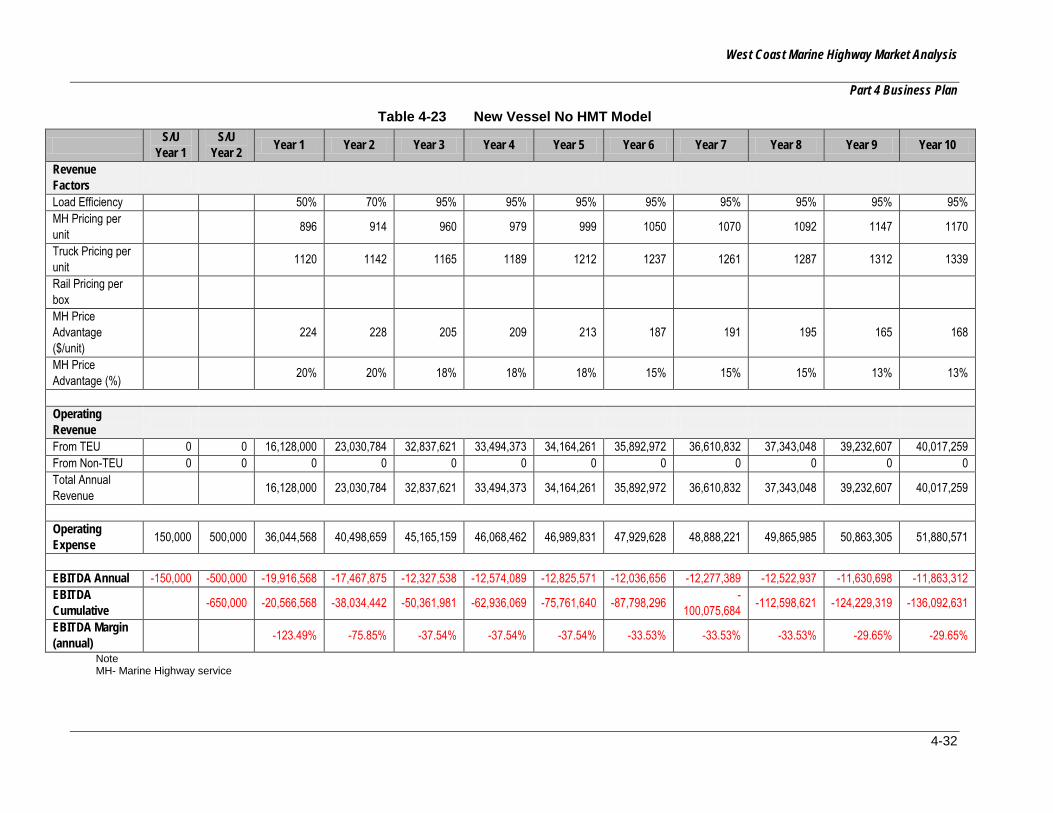
West Coast Marine Highway Market Analysis
Part 4 Business Plan
4-32
Table 4-23 New Vessel No HMT Model
S/U Year 1
S/U Year 2 Year 1 Year 2 Year 3 Year 4 Year 5 Year 6 Year 7 Year 8 Year 9 Year 10
Revenue Factors
Load Efficiency 50% 70% 95% 95% 95% 95% 95% 95% 95% 95% MH Pricing per unit 896 914 960 979 999 1050 1070 1092 1147 1170
Truck Pricing per unit 1120 1142 1165 1189 1212 1237 1261 1287 1312 1339
Rail Pricing per box
MH Price Advantage ($/unit)
224 228 205 209 213 187 191 195 165 168
MH Price Advantage (%) 20% 20% 18% 18% 18% 15% 15% 15% 13% 13%
Operating Revenue
From TEU 0 0 16,128,000 23,030,784 32,837,621 33,494,373 34,164,261 35,892,972 36,610,832 37,343,048 39,232,607 40,017,259 From Non-TEU 0 0 0 0 0 0 0 0 0 0 0 0 Total Annual Revenue 16,128,000 23,030,784 32,837,621 33,494,373 34,164,261 35,892,972 36,610,832 37,343,048 39,232,607 40,017,259
Operating Expense 150,000 500,000 36,044,568 40,498,659 45,165,159 46,068,462 46,989,831 47,929,628 48,888,221 49,865,985 50,863,305 51,880,571
EBITDA Annual -150,000 -500,000 -19,916,568 -17,467,875 -12,327,538 -12,574,089 -12,825,571 -12,036,656 -12,277,389 -12,522,937 -11,630,698 -11,863,312 EBITDA Cumulative -650,000 -20,566,568 -38,034,442 -50,361,981 -62,936,069 -75,761,640 -87,798,296 -
100,075,684 -112,598,621 -124,229,319 -136,092,631
EBITDA Margin (annual) -123.49% -75.85% -37.54% -37.54% -37.54% -33.53% -33.53% -33.53% -29.65% -29.65%
Note MH- Marine Highway service
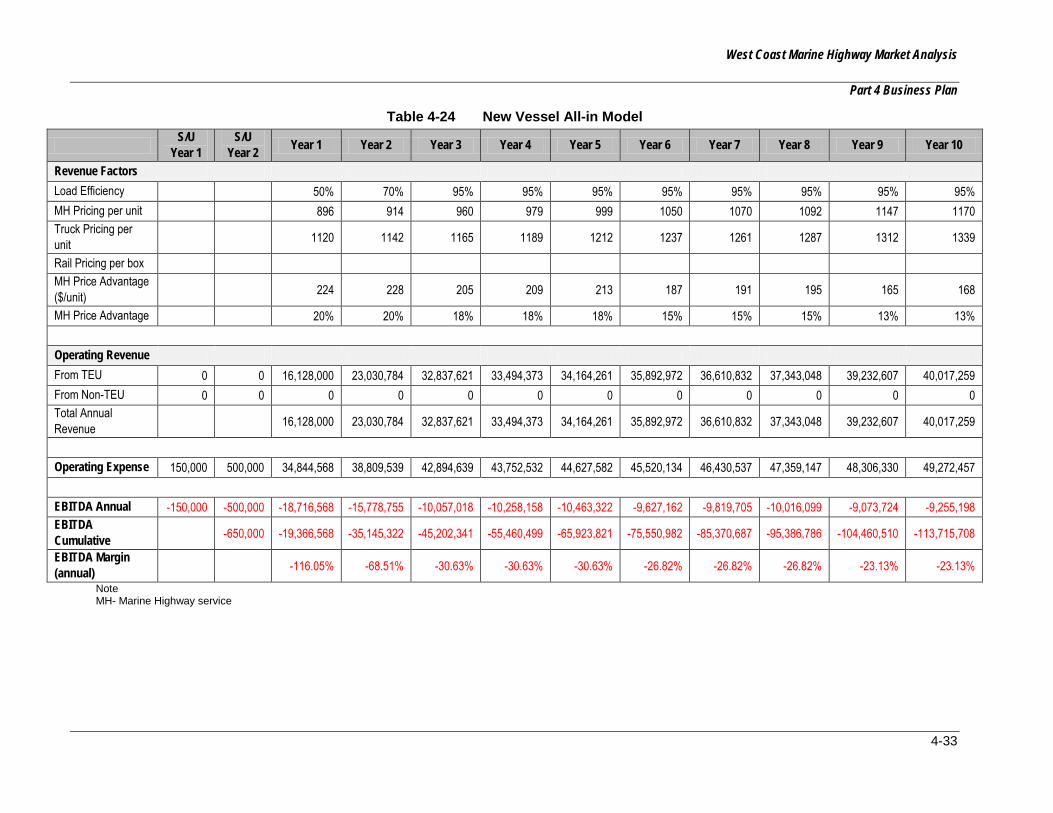
West Coast Marine Highway Market Analysis
Part 4 Business Plan
4-33
Table 4-24 New Vessel All-in Model
S/U Year 1
S/U Year 2 Year 1 Year 2 Year 3 Year 4 Year 5 Year 6 Year 7 Year 8 Year 9 Year 10
Revenue Factors Load Efficiency 50% 70% 95% 95% 95% 95% 95% 95% 95% 95% MH Pricing per unit 896 914 960 979 999 1050 1070 1092 1147 1170 Truck Pricing per unit 1120 1142 1165 1189 1212 1237 1261 1287 1312 1339
Rail Pricing per box MH Price Advantage ($/unit) 224 228 205 209 213 187 191 195 165 168
MH Price Advantage 20% 20% 18% 18% 18% 15% 15% 15% 13% 13% Operating Revenue From TEU 0 0 16,128,000 23,030,784 32,837,621 33,494,373 34,164,261 35,892,972 36,610,832 37,343,048 39,232,607 40,017,259 From Non-TEU 0 0 0 0 0 0 0 0 0 0 0 0 Total Annual Revenue 16,128,000 23,030,784 32,837,621 33,494,373 34,164,261 35,892,972 36,610,832 37,343,048 39,232,607 40,017,259
Operating Expense 150,000 500,000 34,844,568 38,809,539 42,894,639 43,752,532 44,627,582 45,520,134 46,430,537 47,359,147 48,306,330 49,272,457 EBITDA Annual -150,000 -500,000 -18,716,568 -15,778,755 -10,057,018 -10,258,158 -10,463,322 -9,627,162 -9,819,705 -10,016,099 -9,073,724 -9,255,198 EBITDA Cumulative -650,000 -19,366,568 -35,145,322 -45,202,341 -55,460,499 -65,923,821 -75,550,982 -85,370,687 -95,386,786 -104,460,510 -113,715,708
EBITDA Margin (annual) -116.05% -68.51% -30.63% -30.63% -30.63% -26.82% -26.82% -26.82% -23.13% -23.13%
Note MH- Marine Highway service

West Coast Marine Highway Market Analysis
Part 4 Business Plan
4-34
Table 4-25 Model Comparison
Existing Vessel Base Case Model No HMT Model All-in Model Annual Operating Loss Peak -14,947,000 Year 1 -14,322,000 Year 1 -13,122,000 Year 1 Annual Operating Profit Peak Not Attained Not Attained Not Attained High-Point Cumulative Loss -87,726,865 Year 10 -75,813,244 Year 10 -53,436,321 Year 10 End of Period Cumulative Gain -87,726,865 thru Year 10 -75,813,244 thru Year 10 -53,436,321 thru Year 10 EBITDA Margin Yr. 3 -23.85% -20.16% -13.25% EBITDA Margin Yr. 6 -20.24% -16.66% -9.95% EBITDA Margin Yr. 10 -16.74% -13.27% -6.75%
New Vessel Base Case Model No HMT Model All-in Model Annual Operating Loss Peak -20,541,568 Year 1 -19,916,568 Year 1 -18,716,568 Year 1 Annual Operating Profit Peak Not Attained Not Attained Not Attained High-Point Cumulative Loss -148,006,252 Year 10 -136,092,631 Year 10 -113,715,708 Year 10 End of Period Cumulative Gain -148,006,252 thru Year 10 -136,092,631 thru Year 10 -113,715,708 thru Year 10 EBITDA Margin Yr. 3 -41.23% -37.54% -30.63% EBITDA Margin Yr. 6 -37.12% -33.53% -26.82% EBITDA Margin Yr. 10 -33.12% -29.65% -23.13%
West Coast Marine Highway Market Analysis
Part 4 Business Plan
4-35
4.4.5 Performance Summary
This route performs very poorly under the “base case” scenario and under the “all-in” scenario. In the “base case” scenario, the route severely underperforms and experiences substantial annual negative cash flows throughout the pro forma period. This scenario yields deep negative cash flow margins and would not attract any interest from investors. In the “all-in” scenario, the route still performs poorly producing no annual positive cash flows with the best performing year still showing substantial deficits. There would need to be structural expense reduction and revenue enhancement for this route to be considered commercially viable.
Because of the distance involved, only one round trip per week is indicated. While this is at a very fuel efficient speed, the lack of additional voyages and corresponding revenue seen in the San Pedro to Oakland case does not compensate for the higher systems costs. In order to perform two round trips per week, a vessel would need a service speed of about 27 knots that would probably more than double the price of new build. Further, horsepower to propel such a vessel at these speeds would increase fuel consumption.
Even with Title XI financing it is likely that operating and construction subsidies would be needed for an extended time (e.g., five years), in order for this service to be commercially viable.
4.5 CONCLUSION
The analysis conducted on the three port pair combinations designated in the short to mid-term future as potentially viable Marine Highway services illustrates a high-level conceptual business plan. The conclusions reached for each corridor should provide a real-world indication of the business prospects for that service. As such, investors may find an interest in these opportunities. One in particular, San Pedro – Oakland, stands out as particularly attractive. Follow up market analysis and interest from ocean carriers, for substituted service, and modal shift opportunities for domestic cargoes, will need to be undertaken.
West Coast Marine Highway Market Analysis
Part 5 Environmental Analysis
5-1
5.0 ENVIRONMENTAL ANALYSIS
5.1 OVERVIEW
The purpose of this section is to identify the regulatory agencies, regulatory requirements, and project specific documents that would need to be addressed in a programmatic NEPA analysis for the implementation of one or more segments of the WCMH Program. When environmental documentation is prepared, compliance with all the following rules and regulations should be followed. The information provided below identifies port-specific issues that need to be addressed; however, this document does not provide a comprehensive environmental analysis (i.e., air quality analysis, traffic studies, socio-economic analysis, etc.).
The purpose of the proposed Marine Highway service is to advance the America’s Marine Highway program. The Marine Highway service is needed to divert trucks, predominantly from Interstate 5, to reduce traffic congestion, lower road maintenance and repair costs, and to reduce greenhouse gas (GHG) emissions and oil consumption.
The study areas for this environmental overview include the marine environment of the Pacific Coast of the United States and the Puget Sound with a focus on ports in the states of California, Oregon and Washington,. International, Federal, and state laws that may be applicable to the proposed Marine Highway service include marine operations, certain types of cargoes, and any future port-specific capital improvements. General reviews of environmental regulations and permits that may be associated with port-specific capital improvements are provided in this analysis for informational purposes and to facilitate future planning efforts.
5.2 SUMMARY OF KEY INTERNATIONAL ENVIRONMENTAL COMPLIANCE REQUIREMENTS
5.2.1 Executive Order 12114 – Environmental Effects Abroad of Major Federal Actions
Executive Order (EO) 12114 requires that considerations to the impact of major actions on the environment are addressed by federal agencies with facilities located outside the United States in consultation with the Department of State and the Council on Environmental Quality (CEQ). Consistent with the foreign policy and national security policy of the United States, with respect to the environment outside the United States, its territories, and possessions, EO 12114 represents the procedural actions to be taken by federal agencies to further the purpose of the NEPA, the Marine Protection Research and Sanctuaries Act, and the Deepwater Port Act. This EO establishes four categories of “major” actions including the following:
• Major federal actions significantly affecting the environment of the global commons outside the jurisdiction of any nation (e.g., the oceans or Antarctica);
• Major federal actions significantly affecting the environment of a foreign nation not participating with the United States and not otherwise involved in the action;
• Major federal actions significantly affecting the environment of a foreign nation which provide to that nation:
West Coast Marine Highway Market Analysis
Part 5 Environmental Analysis
5-2
− A product, or physical project producing a principal product or an emission or effluent, which is prohibited or strictly regulated by Federal law because its toxic effects on the environment create a serious public health risk; or
− A physical project which in the United States is prohibited or strictly regulated by federal law to protect the environment against radioactive substances; and
• Major federal actions outside the United States, its territories and possessions which significantly affect natural or ecological resources of global importance designated for protection under this subsection by the president, or, in the case of such a resource protected by international agreement binding on the United States, by the Secretary of State. Recommendations to the President under this subsection shall be accompanied by the views of the CEQ and the Secretary of State.
As stated in EO 12114, the proposed Marine Highway service project would require documentation of the following:
• Environmental Impact Statements (EIS) (including generic, program and specific statements);
• Bilateral or multilateral environmental studies, relevant or related to the proposed action, by the United States and one or more foreign nations, or by an international body or organization in which the United States is a member or participant; or
• Concise reviews of the environmental issues involved, including Environmental Assessments (EA), summary environmental analyses or other appropriate documents.
5.2.2 North American Agreement on Environmental Cooperation (Side Treaty of the North American Free Trade Agreement)
In coordination with the NAFTA, the North American Agreement on Environmental Cooperation (NAAEC) was enacted in 1994 as a North American regional effort promoting environmental law and enforcement. NAAEC requires high levels of environmental protection by each Party (i.e., Canada, the United States, and Mexico) and establishes a range of procedures and actions taken by a state and its competent authorities to ensure compliance with laws or regulations, and where compliance is not met, ensures the enforcement of appropriate remedies for violations. With regards to the proposed Marine Highway service, NAAEC requires that environmental impacts be assessed throughout the region to ensure compliance with the NAAEC, Article 2 provisions, whereby each Party has made the following commitments (CEC 1993):
1. Each Party shall, with respect to its territory:
• Periodically prepare and make publicly available reports on the state of the environment,
• Develop and review environmental emergency preparedness measures,
• Promote education in environmental matters, including environmental law,
West Coast Marine Highway Market Analysis
Part 5 Environmental Analysis
5-3
• Further scientific research and technology development in respect of environmental matters,
• Assess, as appropriate, environmental impacts, and
• Promote the use of economic instruments for the efficient achievement of environmental goals.
2. Each Party shall consider implementing in its law any recommendation developed by the Commission for Environmental Cooperation (CEC) Council under Article 10(5)(b).
3. Each Party shall consider prohibiting the export to the territories of the other Parties of a pesticide or toxic substance whose use is prohibited within the Party's territory. When a Party adopts a measure prohibiting or severely restricting the use of a pesticide or toxic substance in its territory, it shall notify the other Parties of the measure, either directly or through an appropriate international organization.
The NAAEC also established the CEC as an international organization to “address regional environmental concerns, help prevent potential trade and environmental conflicts, and promote the effective enforcement of environmental law” (CEC 2011). The CEC advises on any matter within the scope of the NAAEC. The CEC is comprised of a Council, with representatives from each country, a Secretariat, which includes technical, administrative, and operational support, and a Joint Public Advisory Committee comprised of five citizen representatives from each country (CEC 2011).
5.2.3 International Convention for the Prevention of Pollution from Ships
The International Convention for the Prevention of Pollution from Ships (MARPOL) 73/78 is the international treaty regulating disposal of wastes generated by normal operation of vessels. MARPOL 73/78 is implemented in the United States by the Act to Prevent Pollution from Ships, under the lead of the USCG. 161 countries are parties as of December 2001.The IMO in London performs Secretariat functions. Within the IMO, environmental issues are responsibility of Marine Environment Protection Committee. MARPOL was designed to minimize pollution of the seas, including dumping, oil, and exhaust pollution. The objective of the treaty is to preserve the marine environment through the complete elimination of pollution by oil and other harmful substances and the minimization of accidental discharge of such substances. All ships flagged under countries that are signatories to MARPOL are subject to its requirements, regardless of where they sail.
5.3 SUMMARY OF KEY FEDERAL ENVIRONMENTAL COMPLIANCE REQUIREMENTS
5.3.1 National Environmental Policy Act (42 USC § 4321 et seq.)
NEPA requires federal agencies to take into consideration the potential environmental consequences of proposed actions in their decision-making process. The intent of NEPA is to consider impacts on the environment through informed federal decision making. The CEQ was established under NEPA to implement and oversee federal processes and through Regulations
West Coast Marine Highway Market Analysis
Part 5 Environmental Analysis
5-4
for Implementing Procedural Provisions of the National Environmental Policy Act (40 CFR 1500-1508). These regulations specify that an EA:
• Briefly provide sufficient evidence and analysis for determining whether to prepare an EIS or a Finding of No Significant Impact (FONSI);
• Aid in an agency’s compliance with NEPA when no EIS is necessary; and
• Facilitate the preparation of an EIS when one is necessary.
Under customary international law, United States territory generally extends out into the ocean for a distance of three NM (5.6 kilometers [km]) from the coastline. By Presidential Proclamation 5928, issued 27 December 1988, the United States extended its exercise of sovereignty and jurisdiction under international law to 12 NM (22 km). However, the Proclamation expressly provides that it does not extend or otherwise alter existing federal law or any associated jurisdiction, rights, legal interests, or obligations. The Proclamation thus did not alter existing legal obligations under NEPA.
In 1983, Presidential Proclamation 5030 established the 200- NM (370 km) zone off all United States coasts as the Exclusive Economic Zone (EEZ), declaring, “…to the extent permitted by international law…sovereign rights for the purpose of exploring, exploiting, conserving, and managing natural resources, both living and non-living, of the seabed and subsoil and the super adjacent waters.” The assertion of jurisdiction) over the EEZ of the United States altered the legal basis for economic exploration and exploitation, scientific research, and protection of the environment by the United States As a matter of policy, National Oceanic Atmospheric Administration (NOAA) has elected to apply NEPA to the 200 NM (370 km) EEZ of the United States Therefore, should NOAA become a cooperating agency in the preparation of a NEPA document, potential impacts to areas within the 200 NM (370 km) boundary of the EEZ are subjected to analysis under NEPA.
5.3.2 Act to Prevent Pollution from Ships (33 USCS 1901)
The Act to Prevent Pollution from Ships is a United States federal law that was enacted to implement the provisions of MARPOL and the annexes to which the United States is a party. The Act applies to all United States flagged ships all across the globe and to all foreign flagged vessels operating in navigable waters of the United States or while at port under United States jurisdiction.
Regulations needed to implement the Act are primarily prescribed and enforced by the USCG. The regulatory mechanism established in the Act to implement MARPOL is separate and distinct from the Clean Water Act (CWA) and other federal environmental laws.
5.3.3 Nonindigenous Aquatic Nuisance Prevention and Control Act of 1990 (33 CFR 151.2035(a))
The Nonindigenous Aquatic Nuisance Prevention and Control Act of 1990 is intended to identify and implement ways to prevent the unintentional introduction and spread of invasive species into waters of the United States, to work toward minimizing economic and ecological impacts of established nonindigenous species, and to establish a program to assist states in the management and removal of such species. The Act directs the USCG to issue regulations to

West Coast Marine Highway Market Analysis
Part 5 Environmental Analysis
5-5
prevent the introduction and spread of aquatic invasive species into the Great Lakes and other United States waters through ballast water.
The USCG has issued the following voluntary guidelines (summarized below) for all vessels with ballast tanks operating in United States waters within the EEZ. Additional guidelines exist for those vessels traveling outside of the EEZ and are provided below.
• Avoid ballast operations in or near marine sanctuaries, marine preserves, marine parks, or coral reefs.
• Avoid taking on ballast water:
o with harmful organisms and pathogens, such as toxic algal blooms,
o near sewage outfalls,
o near dredging operations,
o where tidal flushing is poor or when a tidal stream is known to be more turbid,
o in darkness when organisms may rise up in the water column, and
o in shallow water or where propellers may stir up the sediment.
• Clean ballast tanks regularly.
• Discharge minimal amounts of ballast water in coastal and internal waters.
• Rinse anchors during retrieval to remove organisms and sediments at their place of origin.
• Remove fouling organisms from hull, piping, and tanks on a regular basis and dispose of any removed substances in accordance with local, state, and federal regulations.
• Maintain a vessel-specific ballast water management plan.
• Train vessel personnel in ballast water management and treatment procedures.
5.3.4 Coastal Zone Management Act (16 USC § 1451 et seq.)
The Coastal Zone Management Act (CZMA) requires that “any federal activity within or outside of the coastal zone that affects any land or water use or natural resource of the coastal zone” shall be “consistent to the maximum extent practicable with the enforceable policies” of a state’s coastal zone management plan. Federal agencies, prior to carrying out activities, must comply with the “consistency” regulations of the CZMA promulgated by the Secretary of Commerce. These regulations set forth the procedures that federal agencies must follow to coordinate with coastal states prior to carrying out activities that are reasonably likely to affect coastal uses or resources within a state’s coastal zone.
5.3.5 Clean Water Act, Sections 401 and 404 (33 USC § 1251 et seq.)
The CWA is the primary federal law that protects the nation’s waters, including lakes, rivers, aquifers, and coastal areas. The primary objective of the CWA is to restore and maintain the integrity of the nation’s waters. Jurisdictional waters of the United States are regulated resources and are subject to federal authority under Section 404 of the CWA. This term is
West Coast Marine Highway Market Analysis
Part 5 Environmental Analysis
5-6
broadly defined to include navigable waters (including intermittent streams), impoundments, tributary streams, and wetlands. Areas meeting the waters of the United States definition are under the jurisdiction of the USACE. Anyone proposing to conduct a project that requires a federal permit or involves dredging or fill activities that may result in a discharge to United States surface waters and/or waters of the United States is required to obtain a CWA Section 401 Water Quality Certification, verifying that the project activities would comply with state water quality standards.
5.3.6 Clean Air Act, Sections 101-131 (USC §§ 7401-7431)
The CAA is the primary federal law that regulates airborne contaminants to protect the general public as well as the environment from exposure to harmful pollutants and promote healthy air quality. The USEPA has the authority under the CAA to implement and enforce regulations reducing air pollutant emissions, including setting limits on how much can be in the air anywhere in the United States Individual states or tribes typically take the lead in carrying out the CAA by often imposing more stringent limits, but they may not have weaker pollution limits than those set by USEPA. Each state develops a State Implementation Plan (SIP) that outlines how they will control air pollution under the CAA. While states and local agencies are responsible for all CAA requirements, tribes may develop and implement only those parts of the CAA that are appropriate for their lands.
In addition to land-based mobile and stationary sources of emissions, ships are also significant contributors to mobile-source emissions. International standards were established regarding Emission Control Areas (ECAs) that require reduction in emissions of nitrogen oxides (NOx), sulfur oxides (SOx), and fine particulate matter (PM). ECAs are currently in place for the North Sea and the Baltic Sea. A Northern American ECA was adopted that will begin in August 2012. The North American ECA requires ships to switch fuels when operating within up to 200 NM (370 km) of the majority of United States and Canadian Atlantic and Pacific coastal waters, French territories off the Canadian Atlantic coast, the United States Gulf Coast, and the main, populated islands of Hawaii. The IMO amended the MARPOL designating the North American ECA.
United States Environmental Protection Agency Actions – Engine and Fuel Standards
As of April 2010, the USEPA adopted Category 3 (C3) engine standards applying to United States vessels and to marine diesel fuels produced and distributed in the United States (USEPA 2012). Two new tiers of engine standards were added to C3 engines with the USEPA ruling, including (USEPA 2012): Tier 2 standards that begin in 2011 and Tier 3 standards that begin in 2016. The Tier 2 standards that will be applied in 2011 require that more efficient use of engine technologies be applied to reduce NOx and SOx emissions including engine timing, cooling and advanced computer controls (USEPA 2012). In 2016, Tier 3 standards will apply that “require the use of high efficiency emission control technology such as selective catalytic reduction to achieve NOx reductions 80 percent below the current levels” (USEPA 2012). In addition, this ruling establishes the inclusion of a regulatory program to the MARPOL to implement Annex VI which includes engine and fuel sulfur limits and extends the ECA. Currently the USEPA is adopting revisions to the CAA diesel fuel program for C3 marine diesel engines registered or flagged in the United States including NOx emission limits and standards for hydrocarbons and carbon monoxide emissions from new C3 engines (USEPA 2012). The operation of vessels

West Coast Marine Highway Market Analysis
Part 5 Environmental Analysis
5-7
used in the proposed Marine Highway service will be subject to the USEPAs rulings on engine and fuel standards.
5.3.7 Rivers and Harbors Act, Section 10 (33 USC § 401 et seq.)
Section 10 of the Rivers and Harbors Act of 1899 regulates structures or work in or affecting navigable waters of the United States Structures include any pier, wharf, bulkhead, etc. Work includes dredging, filling, excavation, or other modifications to navigable waters of the United States. The USACE is authorized to issue permits for work or structures in navigable waters of the United States.
5.3.8 Magnuson-Stevens Act (16 USC §§ 1801-1882)
The Magnuson-Stevens Fishery Conservation and Management Act (MGS) established United States jurisdiction from the seaward boundary of the coastal states out to 200 NM (370 km) for the purpose of managing fisheries resources. The MSA is the principal federal statute that provides for the management of marine fisheries in the United States. The purposes of the MSA include:
1. Conservation and management of the fishery resources of the United States,
2. Support and encouragement of international fishery agreements,
3. Promotion of domestic commercial and recreational fishing,
4. Preparation and implementation of Fishery Management Plans (FMPs),
5. Establishment of Regional Fishery Management Councils (FMCs),
6. Development of fisheries which are underutilized or not utilized, and
7. Protection of Essential Fish Habitat (EFH).
Federal agencies that authorize, fund, or undertake actions that may adversely affect EFH must consult with the Secretary of Commerce, through the National Marine Fisheries Service (NMFS), regarding potential effects to EFH, and NMFS must provide conservation recommendations.
5.3.9 Marine Mammal Protection Act (16 USC § 1361 et seq.)
The Marine Mammal Protection Act (MMPA) of 1972 protects marine mammals by strictly limiting their “taking” in waters or on lands under United States jurisdiction, and on the high seas by vessels or persons under United States jurisdiction. The term “take,” as defined in Section 3 (16 USC § 1362) of the MMPA and its implementing regulations, means “to harass, hunt, capture, or kill, or attempt to harass, hunt, capture, or kill any marine mammal.” The term “harassment” was further defined in the 1994 amendments to the MMPA as any act of pursuit, torment, or annoyance, at two distinct levels:
• Level A Harassment – potential to injure a marine mammal or marine stock in the wild, and
West Coast Marine Highway Market Analysis
Part 5 Environmental Analysis
5-8
• Level B Harassment – potential to disturb a marine mammal or marine mammal stock in the wild by causing disruption of natural behavior patterns including, but not limited to, migration, breathing, nursing, breeding, feeding, or sheltering.
The incidental, but not intentional, taking of marine mammals by United States citizens is allowed if certain findings are made and regulations are issued. The MMPA is administered and enforced by the NMFS and the United States Fish and Wildlife Service (USFWS).
5.3.10 Marine Protected Areas
EO 13158 defines Marine Protected Areas (MPAs) as areas where natural and/or cultural resources are given greater protection than the surrounding waters. In the United States, MPAs span a range of habitats including the open ocean, coastal areas, inter-tidal zones, estuaries, and the Great Lakes. They also vary widely in purpose, legal authorities, agencies, management approaches, level of protection, and restrictions on human uses. The “official definition of an MPA as presented EO 13158 is, "...any area of the marine environment that has been reserved by federal, state, territorial, tribal, or local laws or regulations to provide lasting protection for part or all of the natural and cultural resources therein."
The Department of Commerce/NOAA and the Department of the Interior are the primary managers of federal MPAs. The Department of Commerce/NOAA manages national marine sanctuaries, fishery management zones, and, in partnership with states, national estuarine research reserves. The Department of the Interior manages MPAs through national parks and national wildlife refuges. States, territories, and commonwealths also establish MPAs for various purposes. Each state and territory has various bureaus, departments, and divisions that regulate the environment, manage fisheries, manage lands, and regulate commerce.
5.3.11 Endangered Species Act (16 USC § 1531 et seq.)
The United States Endangered Species Act (USESA) of 1973 and subsequent amendments provide for the conservation of threatened and endangered species of animals (including some marine mammals) and plants, and the habitats in which they are found. The USESA prohibits jeopardizing endangered and threatened species or adversely modifying critical habitats essential to their survival. Section 7 of the USESA requires consultation with NMFS and the USFWS to determine whether any endangered or threatened species under their jurisdiction may be affected by a proposed action. Generally, the USFWS manages land and freshwater species while NMFS manages marine species, including anadromous salmon. However, the USFWS has responsibility for some marine animals such as nesting sea turtles, walruses, polar bears, sea otters, and manatees.
5.3.12 National Marine Sanctuaries Act (16 USC § 1431 et seq.)
The National Marine Sanctuaries Act (NMSA) authorizes the Secretary of Commerce to designate and protect areas of the marine environment with special national significance as national marine sanctuaries. Sanctuaries are administered by the NOAA Office of National Marine Sanctuaries. Regulations at 15 CFR Part 922 further implement the NMSA and regulate the conduct of certain activities within sanctuaries; activities prohibited by regulation can only be undertaken by obtaining a permit. Section 304(d) of the NMSA further requires federal agencies
West Coast Marine Highway Market Analysis
Part 5 Environmental Analysis
5-9
to consult with NOAA before taking actions, including authorization of private activities, “likely to destroy, cause the loss of, or injure a sanctuary resource.”
5.3.13 Executive Order 13547—Stewardship of the Ocean, Our Coasts, and the Great Lakes
The National Ocean Council (NOC) established the Interagency Ocean Policy Task Force (Task Force), led by the Chair of the CEQ, to develop recommendations to enhance the nation’s ability to maintain healthy, resilient, and sustainable oceans, coasts, and Great Lakes resources. In response to the Task Force recommendations, EO 13547 was signed on July 19, 2010. The recommendations included the following (CEQ 2010):
• Provide the Nation’s first ever national policy for the Stewardship of the Ocean, Our Coasts, and the Great Lakes (National Policy),
• Provide a strengthened governance structure to provide sustained, high-level, and coordinated attention to ocean, coastal, and Great Lakes issues,
• Provide a targeted implementation strategy that identifies and prioritizes nine categories for action that the United States should pursue:
1. Ecosystem-Based Management.
2. Coastal and Marine Spatial Planning (CSMP),
3. Inform Decisions and Improve Understanding,
4. Coordinate and Support federal, state, tribal, local, and regional management of the ocean, our coasts, and the Great Lakes,
5. Resiliency and Adaptation to Climate Change and Ocean Acidification,
6. Regional Ecosystem Protection and Restoration,
7. Water Quality and Sustainable Practices on Land,
8. Changing Conditions in the Arctic, and
9. Ocean, Coastal, and Great Lakes Observations, Mapping, and Infrastructure.
• Provide a framework for effective CSMP that establishes a comprehensive, integrated, ecosystem-based approach to address conservation, economic activity, user conflict, and sustainable use of ocean, coastal, and Great Lakes resources.
EO 13547 supports the enhanced sustainability of ocean and coastal economies, preserves our maritime heritage, supports sustainable uses and access, provides for adaptive management to enhance our understanding of and capacity to respond to climate change and ocean acidification, and coordinates with our national security and foreign policy interests. EO 13547 provides for the development of coastal and marine spatial plans that build upon existing federal, state, tribal, local, and regional decision making and planning process. The proposed
West Coast Marine Highway Market Analysis
Part 5 Environmental Analysis
5-10
Marine Highway service should comply with Council certified coastal and marine spatial plans, as described in the Final Recommendations and subsequent guidance from NOC.
5.3.14 California Coastal National Monument
The California Coastal National Monument (CCNM) was established in 2000 by a Presidential Proclamation and is managed by the Bureau of Land Management (BLM) under the Secretary of the Interior. The CCNM is along California’s coast comprising 1,100 miles (1,770 km) and extends 12 NM (22 km) from the coast. The CCNM also includes more than 20,000 rocks and islands, excluding the eight Channel Islands, the Farallon Islands, or the islands in San Francisco Bay. The CCNM is under federal ownership and is managed by the United States Bureau of Land Management (BLM). However, continued partnership the California Department of Fish and Game (DFG) and the California Department of Parks and Recreation has been established to improve coordination efforts across the entire CCNM.
The CCNM Regional Management Plan (RMP) was established in 2005 through a public planning process which included the development of a federal EIS. The management plan focuses on a multi-agency partnership with the local communities, cities, and towns to protect the “geologic formations and habitats for seabirds, sea lions, seals, and plant life” (BLM 2009). The proposed Marine Highway service would need to consult the CCNM RMP and agencies to determine appropriate land use authorizations and permitting requirements. Provided that the CCNM serves as a breeding, feeding, and habitat area for a number of bird species and special-status marine mammals, surveys of affected areas would need to be conducted to determine the impacts on these species. Although surveying in the area is dated, the special-status species that exist within the CCNM include federally-listed endangered species, state-listed endangered species, California fully protected species, BLM sensitive species, and state candidate for listing as a threatened species.
A comprehensive inventory of vegetation in areas of the CCNM has not been conducted and the presence of federally or state-listed species is unknown. Focused botanical studies are needed to make determine if the proposed Marine Highway service will impact vegetated islets, rocks, and shoreline cliffs within the CCNM (BLM 2009).
5.3.15 Migratory Bird Treaty Act
The Migratory Bird Treaty Act (MBTA) of 1918, as amended (16 USC § 703 et seq.), is the main regulatory mechanism for protecting migratory birds in the United States. Migratory birds generally include all native birds in the United States, except non-migratory species such as quail and turkey. Under the provisions of the MBTA, it is unlawful “by any means or manner to pursue, hunt, take, capture [or] kill” any migratory birds except as permitted by regulations issued by the USFWS.
EO 13186 - Responsibilities of Federal Agencies to Protect Migratory Birds, dated January 10, 2001, directs executive departments and agencies to take certain actions to advance the provisions of the MBTA. The United States recognized the critical importance of this shared resource by ratifying international, bilateral conventions for the conservation of migratory birds. These migratory bird conventions impose substantive obligations on the United States for the conservation of migratory birds and their habitats. Through the MBTA, the United States has

West Coast Marine Highway Market Analysis
Part 5 Environmental Analysis
5-11
implemented these domestic obligations under these migratory bird conventions. The main issue associated with the proposed Marine Highway service is the potential for accidents and associated spills, depending on cargo and ships along the route due to the presence of extensive breeding colonies of birds located on offshore islands along the entire Pacific coast.
5.3.16 Executive Order 12898 – Environmental Justice in Minority Populations and Low-Income Populations
EO 12898, Federal Actions to Address Environmental Justice in Minority and Low-Income Populations, was issued to focus the attention of federal agencies on human health and environmental conditions in minority and low-income communities so that these populations are not disproportionately affected by federal actions.
5.3.17 Executive Order 13045 – Protection of Children from Environmental Health Risks and Safety Risks
EO 13045, Protection of Children from Environmental Health Risks and Safety Risks, was issued to ensure the protection of children. Federal agencies are required to identify and assess environmental health risks and safety risks that may disproportionably affect children.
5.4 SUMMARY OF KEY STATE ENVIRONMENTAL COMPLIANCE REQUIREMENTS
5.4.1 California Environmental Quality Act
The California Environmental Quality Act (CEQA) (Pub. Res. Code §21000 et seq.) applies to the proposed “projects” of a public agency or private party. A project is defined as an activity that requires discretionary approval from a government agency which may cause either a direct physical impact in the environment or a reasonably foreseeable indirect change in the environment, including the enactment of zoning ordinances, the issuance of conditional use permits, and general/community plans. Unless an exemption applies, all development projects requiring discretionary government approval require some form of environmental review pursuant to CEQA. CEQA requires that California's state and local public agencies meet the following:
• Identify the significant environmental effects of their actions; and, either
• Avoid those significant environmental effects, where feasible; or
• Mitigate those significant environmental effects, where feasible.
Under CEQA, one agency is usually identified as the “lead agency” for a specific proposal. The lead agency for public projects is the agency proposing the project. The lead agency for most private projects is the city or county where the project is located. For the proposed Marine Highway service, the lead agency may be MARAD, a state agency, or one of the affected ports. The environmental review process includes the following basic steps (CERES 2005):
1. Determine if the activity is a “project" subject to CEQA;
2. Determine if the "project" is exempt from CEQA; and
West Coast Marine Highway Market Analysis
Part 5 Environmental Analysis
5-12
3. Perform an Initial Study to identify the environmental impacts of the project and determine whether the identified impacts are "significant."
The lead agency is usually required to complete a CEQA Environmental Checklist. The checklist includes questions about the proposal and its potential impacts on the environment. The elements of the environment that will be evaluated include air quality, biological resources, greenhouse gas emissions, hydrology/water quality, land use/planning, noise, transportation/traffic, and utilities/service systems.
Following completion of the checklist, if the proposal is likely to have a significant adverse environmental impact, the lead agency will be directed to prepare one of the following environmental review documents: Environmental Impact Report (EIR), EIS, Negative Declaration, or EA. According to CEQA Article 19, Section 15300, the proposed Marine Highway service and associated development projects would not be considered “Categorically Exempt” from CEQA review and thus the applicant, MARAD, a state agency, or one of the affected ports, would need to fill out a CEQA Environmental Checklist to determine if an EIR, EIS, or EA is necessary. Federal, state and local agencies may process CEQA and NEPA documents together to ensure that agencies are aware of each other's actions, analyses, and concerns.
5.4.2 California Air Resources Board
The California Air Resources Board (ARB) is an organization responsible for reporting on California air quality to the Governor’s Office in the Executive Branch of the state of California and is a part of the California Environmental Protection Agency. The mission of ARB is to promote effective and efficient methods for reducing air pollutants; therefore, promoting public health and the preservation of ecological resources (California Environmental Protection ARB 2010). The ARB air pollution control regulations underlying goals are (California Environmental Protection ARB 2010):
• Provide safe, clean air to all Californians,
• Protect the public from exposure to toxic air contaminants,
• Reduce California's emission of greenhouse gases,
• Provide leadership in implementing and enforcing air pollution control rules and regulations,
• Provide innovative approaches for complying with air pollution rules and regulations,
• Base decisions on best possible scientific and economic information, and
• Provide quality customer service to all ARB clients.
Pursuant to Assembly Bill 32 – Global Warming Solutions Act of 2006, mandatory GHG emissions reporting requirements have been implemented by ARB effective January 2009 (California Environmental Protection ARB 2011a). As required by ARB, permits and certifications are required for equipment associated with port development including cranes, power generation, pumps, diesel pile-driving hammers, welding, dredging on boats or barges, compressors, and commercial harbor craft including towboats or push boats, tug boats, and
West Coast Marine Highway Market Analysis
Part 5 Environmental Analysis
5-13
work boats. A rule was adopted in November 2007 and became effective in January 2009 pertaining to regulatory activities of commercial marine vessels to reduce diesel particulate matter (DPM), NOx, and reactive organic gases (ROG) (California Environmental Protection ARB 2011b).
Amendments enacted on July 20, 2011 to the California Code of Regulations (CCR) titles 13 and 17 included sections pertaining to ARB’s air management program. Amendments to title 13, Chapter 5.1, Standards for Fuels for Non-vehicular Sources, Section 2299.5, require that ocean-going tugboats or towboats must comply with the low sulfur fuel use requirement in section 93118.5(e)(1) and other requirements in section 93118.5, title 17, CCR when operating the craft within Regulated California Waters. Amendments to title 17, Subchapter 7.2, Airborne Toxic Control Measures, Section 93118.5, address additional reductions to PM, SOx, and NOx from diesel propulsion and auxiliary engines on harbor craft, requiring the eventual replacement or cleanup of engines in the fleet of in-use ferries, excursion vessels, tugboats, towboats, push boats, crew and supply vessels, and multipurpose harbor craft barge and dredge vessels, that operate in Regulated California Waters. The amendments aim to reduce emissions and health risk from ports and the movement of goods in California. The proposed Marine Highway service would be subject to ARBs permitting and certification requirements.
5.4.3 California Coastal Act of 1976
The California Coastal Act of 1976 (CCA) recognizes that coastal-dependent development, including ports, may have significant adverse effects on coastal resources or coastal access and that it may be necessary to locate such developments in the coastal zone. CCA, Chapter 8, Sections 30700 and 30701 (2010), states that existing port districts within the state of California “should be encouraged to modernize and construct necessary facilities within their boundaries in order to minimize or eliminate the necessity for future dredging and filling to create new ports in new areas of the state.” The coastal zone is defined as the land and water areas of the state of California from the Oregon border to the border of the United Mexican States. Regulation of development in California’s coastal zone, as directed in the CCA, specifically Sections 30230, 30231, 30233, 30236, and 30240, which directly apply to the preservation and protection of wetlands and other environmentally sensitive areas, are enforced by the California Coastal Commission. Environmentally sensitive areas are defined in the CCA, Section 30107.5 (2010), as "any area in which plant or animal life or their habitats are either rare or especially valuable because of their special nature or role in an ecosystem, and which could be easily disturbed or degraded by human activities and developments.”
On land, in or underwater development is defined in the CCA, Section 30106 (2010), as “the placement or erection of any solid material or structure; discharge or disposal of any dredged material or of any gaseous, liquid, solid, or thermal waste; grading, removing, dredging, mining, or extraction of any materials; change in the density or intensity of use of land, including, but not limited to, subdivision pursuant to the Subdivision Map Act (commencing with Section 66410 of the Government Code), and any other division of land, including lot splits, except where the land division is brought about in connection with the purchase of such land by a public agency for public recreational use; change in the intensity of use of water, or of access thereto: construction, reconstruction, demolition, or alteration of the size of any structure, including any facility of any private, public, or municipal utility.” As the CCA relates to the proposed Marine
West Coast Marine Highway Market Analysis
Part 5 Environmental Analysis
5-14
Highway service, coastal development permitting requirements are primarily regulated in Sections 30233(a) and 30235 of the CCA.
California Coastal Act, Section 30233:
The diking, filling, or dredging of open coastal waters, wetlands, estuaries, and lakes shall be permitted in accordance with other applicable provisions of this division, where there is no feasible less environmentally damaging alternative, and where feasible mitigation measures have been provided to minimize adverse environmental effects, and shall be limited to the following:
• New or expanded port, energy, and coastal-dependent industrial facilities, including commercial fishing facilities.
• Maintaining existing, or restoring previously dredged, depths in existing navigational channels, turning basins, vessel berthing and mooring areas, and boat launching ramps.
• In wetland areas only, entrance channels for new or expanded boating facilities; and in a degraded wetland, identified by the Department of Fish and Game pursuant to subdivision (b) of Section 30411, for boating facilities if, in conjunction with such boating facilities, a substantial portion of the degraded wetland is restored and maintained as a biologically productive wetland. The size of the wetland area used for boating facilities, including berthing space, turning basins, necessary navigation channels, and any necessary support service facilities, shall not exceed 25 percent of the degraded wetland.
• In open coastal waters, other than wetlands, including streams, estuaries, and lakes, new or expanded boating facilities and the placement of structural pilings for public recreational piers that provide public access and recreational opportunities.
• Incidental public service purposes, including but not limited to, burying cables and pipes or inspection of piers and maintenance of existing intake and outfall lines.
• Mineral extraction, including sand for restoring beaches, except in environmentally sensitive areas.
• Restoration purposes.
• Nature study, aquaculture, or similar resource dependent activities.
California Coastal Act, Section 30235:
Revetments, breakwaters, groins, harbor channels, seawalls, cliff retaining walls, and other such construction that alters natural shoreline processes shall be permitted when required to serve coastal-dependent uses or to protect existing structures or public beaches in danger from erosion, and when designed to eliminate or mitigate adverse impacts on local shoreline sand supply. Existing marine structures causing water stagnation contributing to pollution problems and fish kills should be phased out or upgraded where feasible.
West Coast Marine Highway Market Analysis
Part 5 Environmental Analysis
5-15
5.4.4 Assembly Bill 2125 (Ruskin) Public Resources: Marine spatial planning Chapter 544, Statutes of 2010
Sections 35620 and 35621 of Assembly Bill 2125 direct the cooperation of state coastal/marine planning, management or regulatory agencies to cooperate with the Ocean Protection Council’s (OPC) to gather and share relevant coastal and marine spatial planning scientific information and tools (California Coastal Commission 2011). In addition, the bill authorizes the OPC to provide grants to public agencies and nonprofit groups to facilitate their participation in marine spatial planning efforts. The marine spatial planning actions that are directly influenced by the proposed Marine Highway project include:
• The effects of climate change,
• The cumulative effects of human-caused and natural sources of stress,
• Existing and predicted patterns of human activities, including activities that present conflicting or compatible demands on coastal and ocean ecosystems or those that require the use of a precautionary approach,
• Other physical, biological, economic, social, and cultural information that the council determines is relevant to marine spatial planning, and
• Support public agencies' collaborative management and use of scientific and geospatial information relevant to ecosystem-based management.
5.4.5 California Department of Fish and Game – Marine Region
The DFG Marine Region “extends along the entire California coastline from border to border and approximately three NM (six km) out to sea, including offshore islands” (California DFG 2011). Through 14 development specific projects, the Marine Region provides statewide fisheries and habitat management, environmental review, and water quality monitoring (California DFG 2011). Of these projects, the MPAs Project implements the state-wide network of planning and implementation measures supporting the Marine Life Protection Act (MLPA). In addition, the Marine Region oversees the implementation of the Marine Life Management Act (MLMA) requiring the management and conservation of California’s marine living resources.
Marine Life Protection Act
The MLPA directs the state of California to reevaluate and redesign California’s system of specific regional approaches to MPAs to increase coherence and effectiveness in protecting marine life and habitats and marine ecosystems. MPAs are defined in the MLPA (1999) as “discrete geographic marine or estuarine area seaward of the mean high tide line or the mouth of a coastal river, including any area of intertidal or subtidal terrain, together with its overlying water and associated flora and fauna that has been designated by law, administrative action, or voter initiative to protect or conserve marine life and habitat.” The reevaluation and redesign of MPAs may establish or alter marine life reserve areas which may prohibit or influence the operation and activities of the proposed Marine Highway service.
West Coast Marine Highway Market Analysis
Part 5 Environmental Analysis
5-16
Marine Life Management Act
The MLMA applies to not only fish and shellfish, but to all marine wildlife requiring that demonstration that fisheries and other activities are sustainable. The MLMA authorizes greater management to the Fish and Game Commission and the DFG to develop an ecosystem perspective including the whole environment, rather than focused/single fisheries management systems and emphasizes science-based management principles. With regards to the proposed development of the Marine Highway service the MLMA should be considered, specifically in the areas of ecosystem conservation and identification of habitat conservation measures.
5.4.6 Oregon Department of Environmental Quality
Oregon Department of Environmental Quality (ODEQ) is the main regulatory agency responsible for protecting and enhancing the state’s water and air quality, for cleaning up spills and releases of hazardous materials, for managing the proper disposal of hazardous and solid wastes, and for enforcing Oregon’s environmental laws. In addition, the USEPA delegates authority to ODEQ to operate federal environmental programs within the state such as the Federal CAA, CWA, and Resources and Conservation Acts.
Permits issued through ODEQ that may be required for the proposed Marine Highway service include a National Pollutant Discharge Elimination System (NPDES) permit, water quality permit, and Air Contamination Discharge Permit (ACDP). Potential elements of the Marine Highway service that would trigger each of these permits are described below.
National Pollutant Discharge Permit
Construction activities that disturb an acre or more (including clearing, grading and excavation) are required to have a NPDES general permit. The permit is required for “point source” discharges of pollutants to surface waters. The term “point source” refers to a natural or human-made conveyance (i.e., piles, culverts, ditches, catch basins, or any type of channel). The purpose of this permit is to control any erosion from the site that may enter waters of the state. An Erosion and Sediment Control Plan would also need to be submitted for approval by ODEQ prior to construction.
Water Quality Permit
A water quality permit is required whenever there is a discharge of pollutants to waters of the state or to the ground. Waters of the state include surface waters (wetlands, ponds, lakes, streams, rivers, etc.) and groundwater. Other activities requiring a permit include wastewater discharge and potentially stormwater runoff.
Air Contamination Discharge Permit
An ACDP is used to regulate minor sources of air contamination emissions, but is also required for any new major source or major modification at a major source. There are six types of ACDPs. The types of sources requiring a permit are listed in ODEQ 2011.
West Coast Marine Highway Market Analysis
Part 5 Environmental Analysis
5-17
5.4.7 Oregon - Department of State Lands
Removal/Fill Permit
To support a proposed Marine Highway service a Removal/Fill Permit may be required. Fill and/or removal (cumulative) of 50 cubic yards (1350 cubic feet) of material within the jurisdictional boundary of most “Waters of the State” will require a permit under Oregon’s Removal-Fill Law (Oregon Revised State [ORS] 196.795-990). Removal means taking rock, gravel, sand, silt and other inorganic substances from the bed or banks of a waterway, or their movement by artificial means within the bed or banks, including channel relocation. Fill means the deposit by artificial means of any material (organic or inorganic) at any one location in the bed or banks. “Waters of the State” include wetlands on private and public land.
Types of “Waters of the State” and Jurisdictional Limits:
• Pacific Ocean: extreme low tide to three miles (five km) out,
• Tidal Bays and Estuaries: highest measured tide or upper edge of wetland,
• Perennial Streams, Lakes and Ponds: to ordinary high water,
• Intermittent Streams: to ordinary high water,
• Wetlands: wetland boundary,
• Artificial Ponds and Ditches: ordinary high water,
• Artificial wetlands: wetland boundary, and
• Reservoirs: normal operating pool level or upper edge of adjacent wetland.
For activities in Essential Salmon Habitat streams, State Scenic Waterways and compensatory mitigation sites, a Removal/Fill Permit is required for any amount of removal or fill that would be required for the proposed Marine Highway service.
State Land and Waterway Easement
The purpose of an easement is to allow the holder the right to use state-owned land for a specific purpose and length of time. Uses include: gas, electric and communication lines; water supply pipelines, ditches, canals and flumes; conduits for cables; water lines; bridges, skylines and logging lines; roads and trails; and railroad tracks. There are two sets of rules governing the granting of easements:
1. OAR 141-083-0800 through 141-083-0860 is for easements within state-owned submerged and submersible land within the Territorial Sea (i.e., use of fiber optic and other cables).
2. OAR 141-122-0010 through 141-122-0110 is for easements and temporary use permits on Trust and Non-Trust Land.
West Coast Marine Highway Market Analysis
Part 5 Environmental Analysis
5-18
This permit may be required for the proposed Marine Highway service should use of additional land or Territorial Sea (not currently available through existing ports) be needed to successfully facilitate the port pairs within the state.
5.4.8 Oregon - Department of Land Conservation and Development
Oregon Coastal Zone Management Program
The federal consistency provisions of the CZMA (as described in Section 5.2.2) require that any federal action occurring in or outside of Oregon’s coastal zone that affects coastal land or water uses or natural resources must be consistent with the Oregon Coastal Management Program. The Department of Land Conservation and Development (DLCD) is the state’s designated coastal management agency and is responsible for reviewing projects for consistency with the program. The consistency decisions are called “coastal concurrences” (approvals) and “coastal objections” (denials).
The state of Oregon’s coastal zone lies between the Washington and California borders on the north and south, bound on the west by the extent of the state’s territorial sea jurisdiction (three NM offshore), and extending east to the crest of the Coast Range except at:
1. The Columbia River where the coastal zone extends to the downstream end of Puget Island,
2. The Umpqua River where the coastal zone extends to Scottsburg, and
3. The Rogue River where the coastal zone extends to Agness.
Under the state’s coastal zone management program, Federal consistency potentially applies to any project having effects on land and water uses or natural resources of the Oregon coastal zone, but DLCD review are generally only required for projects located west of the Coast Range boundary.
The proposed Marine Highway service should seek a federal consistency from the state’s Coastal Management Program through DLCD for any elements of the project that may potentially affect coastal land, water uses, or natural resources.
Oregon Parks and Recreation Department
Oregon Parks and Recreation Department is responsible for protecting and preserving the recreation, scenic and natural resource values found on Oregon’s ocean shore. For any proposed alteration to the ocean shore, in support of Marine Highway services, an Ocean Shore Alteration Permit would be required.
Ocean Shore Alteration Permit
Ocean shore alterations include the construction of shoreline protective structures, beach access ways, dune grading and other sand alterations, the routing of pipelines and cables beneath the ocean shore, marine algae collection, and natural product removal. Applications are reviewed by Oregon Department of Fish and Wildlife, DLCD, Department of State Lands (DSL), and Department of Geology and Mineral Industries.
West Coast Marine Highway Market Analysis
Part 5 Environmental Analysis
5-19
5.4.9 Oregon Land Use Act of 1973, Oregon Revised Statue 197
The Oregon Land Use Act of 1973 created an institutional structure for statewide planning, requiring every city and county in the state to prepare a comprehensive plan in accordance with a set of general state goals. ORS 197.030 established the Land Conservation and Development Commission which is composed of unpaid citizen volunteers that are appointed by the Governor and confirmed by the Senate. The Commission, assisted by DLCD, adopts state land-use goals and implements rules, assures local plan compliance with the goals, coordinates state and local planning, and manages the coastal zone program.
5.4.10 Washington - State Environmental Policy Act
The Washington State Environmental Policy Act (SEPA) provides a way to identify possible environmental impacts that may result from governmental decisions. These decisions may be related to issuing permits for private projects, constructing public facilities, or adopting regulations, policies or plans.
SEPA applies to the decisions by every state and local agency within Washington state, including state agencies, counties, cities, ports, and special districts (i.e., school, water district). One agency is usually identified as the “lead agency” for a specific proposal. The lead agency for most private projects is the city or county where the project is located. For public projects, the lead agency is the agency proposing the project. For a proposed Marine Highway service, the lead agency may be MARAD, a state agency, or one of the affected ports.
The lead agency is responsible for identifying and evaluating the potential adverse environmental impacts of a proposal. This evaluation is documented and, in most cases, sent to other agencies and the public for review and comment. SEPA review starts when the following occurs:
• Someone submits an application to an agency for a license to construct a private project, such as an office building, a grocery store, or an apartment building,
• An agency is considering construction of a public project such as a new school, a highway, or water pipeline, or
• An agency is developing a regulation, policy, or plan, such as a county or city comprehensive plan, a critical area ordinance, or a state water quality regulation.
Information provided during the SEPA review process helps agency decision-makers, applicants, and the public understand how a proposal will affect the environment and what changes to the proposal might be required (if any) to reduce likely impacts. The information can also be used to condition or deny a proposal when adverse environmental impacts are identified.
Some minor projects do not require environmental review, thus the lead agency will need to determine if environmental review is needed. If the proposed project is the type of project that has been “categorically exempt” from SEPA review, no further environmental review is needed.
If the proposed project is not exempt, the applicant will usually be asked to fill out an “environmental checklist” (Ecology 2011a). This checklist asks questions about the proposal

West Coast Marine Highway Market Analysis
Part 5 Environmental Analysis
5-20
and its potential impacts on the environment. The elements of the environment that will be evaluated include earth, air, water, plants, animals, energy, environmental health, land use, transportation, public services, and utilities.
After the checklist has been completed, the lead agency will review the checklist and other information about the proposal. If the lead agency needs additional information to evaluate the proposal, they may ask the applicant to conduct studies, such as a traffic study, or a study to determine if there are wetlands on the project site, etc. The lead agency and applicant may also work together to change the proposal to reduce likely impacts.
If the lead agency has enough information to determine that the proposal is unlikely to have a significant adverse environmental impact, the agency will issue a determination of non-significance (DNS). If the information indicates that the proposal is likely to have a significant adverse environmental impact, the lead agency will require the preparation of an EIS. The EIS will include an evaluation of alternatives to the proposal and measures that would eliminate or reduce the likely environmental impacts of the proposal.
The DNS or EIS prepared by the lead agency will provide information to all agencies that must approve the proposal. The environmental information will be considered along with the technical, economic, and other information about the proposal by agency decision-makers as they decide whether or not to issue a license for the proposal.
According to Washington Administrative Code (WAC) 197-11-800, the proposed Marine Highway service would not be considered “Categorically Exempt” from SEPA review and thus the applicant (MARAD, state agency, or port) would need to fill out an “environmental checklist” to determine either a DNS or if preparation of an EIS is warranted. Local agencies that must approve the proposed project include; Washington Department of Fish and Wildlife (WDFW), Washington State Department of Natural Resources (DNR), USACE, and Washington Department of Ecology (Ecology).
Washington Department of Fish and Wildlife
The WDFW is legally responsible for preserving, protecting, and perpetuating all fish and shellfish resources of the state. To assist in achieving that goal, the state Legislature passed a state law in 1943 now known as the Hydraulic Code (Chapter 77.55 RCW). Although the law has been occasionally amended since it was originally enacted, the basic authority has been retained.
Any construction that affects the bed or flow of the waters of the state has the potential to cause habitat damage. Damage or loss of fish and shellfish habitat results in the direct loss of fish and shellfish production. Therefore, the lead agency must apply for a Hydraulic Project Approval (HPA) if the proposed project will use, divert, obstruct, or change the natural flow or bed of state waters. State waters include all marine waters and fresh waters of the state, except those watercourses that are entirely artificial, such as irrigation ditches, canals, and storm water run-off devices.
The form to apply for a HPA is called a Joint Aquatic Resources Permit Application (JARPA). The JARPA application consolidates fourteen permit application forms for federal, state, and

West Coast Marine Highway Market Analysis
Part 5 Environmental Analysis
5-21
local permits. The JARPA is used to apply for the following permits that are likely to be required in support of a Marine Highway service:
• HPA – issued by WDFW;
• Section 10 Permit (as described in Section 5.2.5) – issued by USACE;
• Shoreline Substantial Development, Conditional Use, Variance Permit or Exemption – Local governments issue these, and they are required for work or activity in the 100-yr flood plain, or within 200 feet (61 m) of the Ordinary High Water mark of certain waters;
• Section 404 Permit (as described in Section 5.2.3) – issued by USACE;
• Section 401 Water Quality Certification (as described in Section 5.2.3) – issued by Ecology; and
• NPDES Permit – issued by Ecology for projects that include the discharge of fluid on or into surface water.
Notice of SEPA determination (refer to Section 5.3.8) MUST be included with the JARPA.
Washington State Department of Natural Resources – Aquatic Land Easements
DNR manages 5.6 million acres (2.3 million hectares [ha]) of forest, range, agriculture, aquatic, and commercial lands for the people of Washington. They also manage lands to provide fish and wildlife habitat, clean and abundant water, and public access. Further, DNR is the acting authority to ensure balance of benefits for Washington state citizens from the use of aquatic lands. These include: commerce and navigation; public use and access; use of renewable resources; protection of the environment (the health of these aquatic lands); and generate an economic return to citizens (when appropriate).
In order to apply for authorization to use state-owned aquatic lands, an application must be submitted for review (WDNR 2011). Other relevant regulatory permits should not be applied for until the proposal is discussed with a DNR land manager as specific terms and conditions may be required. DNR may also require submittal of a JARPA (as described in Section 5.3.8.1).
5.4.11 Washington Shoreline Management Act of 1971
The Shoreline Management Act (SMA) applies to all 39 counties and more than 200 towns and cities that have shorelines of the state within their boundaries. Shorelines are defined as:
• All marine waters,
• Streams and rivers with greater than 20 cubic feet per second (cfs) mean annual flow,
• Lakes 20 acres (8 hectares [ha]) or larger,
• Upland areas called shorelands that extend 200 feet (61 meters) landward from the edge of these waters, and
• The following areas when they are associated with one of the above:
o Biological wetlands and river deltas, and

West Coast Marine Highway Market Analysis
Part 5 Environmental Analysis
5-22
o Some or all of the 100-year floodplain including all wetlands within the 100-year floodplain.
Additionally, the act states that “the interests of all the people shall be paramount in the management of shorelines of statewide significance” (Ecology 2011b). These special shorelines include:
• Pacific coast, Hood Canal and certain Puget Sound shorelines,
• All waters of Puget Sound and the Strait of Juan de Fuca,
• Lakes or reservoirs with a surface acreage of 1,000 acres (405 ha) or more,
• Larger rivers (1,000 cfs or greater for rivers in Western Washington, 200 cfs and greater east of the Cascade crest), and
• Wetlands associated with all of the above.
The act is intended to protect shoreline natural resources, including the land and its vegetation and wildlife, and the water of the state and their aquatic life against adverse effects. All allowed uses are required to mitigate adverse environmental impacts to the maximum extent feasible and preserve the natural character and aesthetics of the shoreline.
Each city and county with “shorelines of the state” prepare and adopt a Shoreline Master Program (SMP) that is based on state laws and rules but is tailored to the specific geographic, economic, and environmental needs of the community. The local SMP is a shoreline-specific combined comprehensive plan, zoning ordinance, and development permit system with a majority of plans originally written in the mid-1970s. The towns, cities, and counties are the primary regulators with technical assistance provided by Ecology.
Substantial Development Permit
The Substantial Development Permit is required for all development (unless specifically exempt) that meet the legal definition of “substantial development”. Substantial development is defined in WAC 173-27-040 (2007) as “any development of which the total cost or fair market value exceeds five thousand dollars, or any development which materially interferes with the normal public use of the water or shorelines of the state…” This permit would likely be required in support of Marine Highway services if substantial development is needed. The lead agency (MARAD, state agency, or port) would need to submit the permit application to the local regulatory agency and have it reviewed by Ecology.
5.4.12 Washington State Coastal Zone Management Program
Washington State, through Ecology, participates in the nation-wide Coastal Zone Management (CZM) Program (as described in Section 5.2.2). Any public federal project carried out by a federal agency, or private project licensed or permitted by a federal agency, or carried out with a federal grant, must be determined to be consistent with the state’s CZM Program.
Under Washington’s program, federal activities that affect any land use, water use, or natural resource of the coastal zone must comply with the enforceable policies within the six laws identified in the program document. The six state laws are:

West Coast Marine Highway Market Analysis
Part 5 Environmental Analysis
5-23
• SMA,
• SEPA,
• CWA,
• CAA,
• Energy Facility Site Evaluation Council – only applicable if siting, construction, or operation of an energy project, and
• Ocean Resource Management Act – Washington state has primary jurisdiction over the management of coastal and ocean natural resources within three miles (five km) of the coastline. From three miles (five km) seaward to the boundary of the 200 mile (322 km) United States EEZ, the United States government has primary jurisdiction.
The following categories of activities trigger a federal consistency review:
• Activities undertaken by a Federal agency,
• Activities which require Federal approval, and
• Activities which use Federal funding.
If a project falls into one of these categories and is either in the coastal zone or impacts coastal uses or resources, then the federal consistency process is triggered.
The applicant prepares a Coastal Consistency Determination that describes the activity and whether the activity impacts coastal resources. If the activity impacts coastal resources, a statement must be provided that the activity is “consistent to the maximum extent practicable with the enforceable policies in the six laws” (Ecology 2011c). Ecology has up to 60 days to concur with or object to, in writing, with the determination.
5.4.13 Ballast Water Management Act of 2000 (Chapter 77.120 RCW)
Ballast water from ships is one of the largest pathways for the introduction and spread of aquatic invasive species. An estimated 10,000 non-indigenous aquatic species travel around the globe each day in the ballast water of cargo ships (PSAT 2007). The USCG manages ballast water at the national level. Under this program, operators of vessels that arrive at American ports from outside the EEZ or 200 NM (370 km) offshore must report ballast water management practices to the National Water Information Clearinghouse (NBIC), and implement on-board plans from managing ballast water. Operators must also conduct a mid-ocean exchange before entering the EEZ; or retain ballast water on board, use alternative environmentally sound methods of managing ballast approved by the USCG, or discharge to an approved reception facility.
Washington state’s program for managing ballast water is administered by WDFW. WDFW regulates vessels that arrive at Washington ports. Vessels originating from ports on the Columbia River or from ports south of 50 degrees north are exempt from these requirements. Masters of vessels are required to exchange ballast water at least 50 NM (93 km) offshore or use treatment systems approved by the state before they discharge ballast water to state waters. No permits are required but all vessel operators must report ballast management
West Coast Marine Highway Market Analysis
Part 5 Environmental Analysis
5-24
practices to WDFW and the NBIC and be prepared to allow state inspectors on board to collect samples and review logs and other documents to confirm reported exchange practices.
5.4.14 Washington State Air Quality Permits
The USEPA, Ecology, and local clean air agencies all regulate air quality (as described in Section 5.2.4).
Construction of a new facility or installation or/modifying equipment that generates or emits air pollution requires an air quality permit. Permits are issued by Ecology. The local agencies within Washington State should also be coordinated with directly. The local agencies include the following:
• Benton Clean Air Agency – Benton County,
• Northwest Clean Air Agency – Whatcom, Island, and Skagit counties,
• Olympic Region Clean Air Agency – Thurston, Mason, Pacific, Grays Harbor, Jefferson, and Clallam counties,
• Puget Sound Clean Air Agency – King, Snohomish, Pierce, and Kitsap counties,
• Southwest Clean Air Agency – Lewis, Skamania, Clark, Cowlitz, and Wahkiakum counties,
• Spokane Regional Clean Air Agency – Spokane County, and
• Yakima Regional Clean Air Agency – Yakima County.
5.4.15 Washington State Archaeological Excavation Permit
The Washington State Archaeological Excavation Permit is issued by the Department of Archaeology and Historic Preservation and must be obtained prior to any excavation that will alter, dig into, deface, or remove archaeological resources, Native Indian graves, cairns, or glyptic records. A historic/archaeological excavation assessment may be required. In addition, the status of any sites or structures listed in or eligible for listing in the State or National Register of Historic Places or Local Landmark designation may need to be determined. Plans for protection or mitigation measures may be a condition of any permit issued.
5.5 ENVIRONMENTAL ISSUES – SPECIFIC TO PORTS
5.5.1 Port of San Diego
The San Diego Unified Port District (Port of San Diego [POSD]) has established a Green Port Policy and has instituted a Green Port Program to support those policy goals. The policy areas pertinent to future development of the Marine Highway service are primarily related to biological resources, air quality, water resources, and socioeconomic and environmental justice as described below.
West Coast Marine Highway Market Analysis
Part 5 Environmental Analysis
5-25
Biological Resources
Throughout the POSD jurisdictional areas, including the cities of San Diego and Chula Vista, National City Imperial Beach and Coronado, the management of biological resources is addressed in the City of San Diego’s Multiple Species Conservation Plan (MSCP). The MSCP is a region-wide conservation plan focused on the protection of multiple species and their habitats through the identification of an interconnected habitat preserve system (POSD District and NAVFAC SW 1999). Consideration of the MSCP is necessary where considering issues associated with biological resources at the POSD.
Air Quality
To ensure air emissions from port operations are proactively addressed, the POSD has voluntarily developed a Clean Air Program (CAP) that applies to the Cruise Ship Terminal, Tenth Avenue Marine Terminal and National City Marine Terminal. An air emissions inventory was conducted with the baseline year of 2006 and determined the two main Port contributions to air pollution were from cruise and cargo ships, as well as truck transport for port operations and goods movement. The CAP objectives are broken into two scopes, initial objectives for 2007 and then those for 2008 going forward.
The initial objectives for 2007 were to identify the most feasible local control measures to be developed for future adoption by the Port. Four candidate local control measures were selected for further development:
• Shore power (“cold ironing”) for ocean-going vessels,
• Truck replacement/retrofits,
• Replacement/retrofits of cargo handling equipment, and
• Vessel speed reduction for Ocean-Going Vessels.
In the years following, the longer term goals of the CAP need to be considered in the proposed Marine Highway service. These long-term goals include the following: provide a framework to examine future projects to minimize air quality impacts while maximizing economic growth; prioritize implementation of the above local control measures; identify monitoring, evaluation and reporting methods to track the progress of these measures and other activities and make adjustments as needed; and incorporate continued stakeholder involvement in future actions.
Water Resources
Water quality is a key attribute requiring protection in the habitat areas of the POSD. The San Diego Bay Integrated Natural Resources Management Plan (INRMP) developed in conjunction with the United States Navy (Navy) and the POSD, addresses restoration, conservation and management planning for a Bay-wide Water Quality Monitoring Program. The proposed Marine Highway service is subject to the requirements of the INRMP as well as the Comprehensive Management Plan for San Diego Bay and the San Diego Regional Water Quality Control Board requirements and guidance. The INRMP identifies issues associated with ship and boat Maintenance, whereby vessels associated with the proposed Marine Highway project would be subject to requirements established in the INRMP aimed at improving water and sediment
West Coast Marine Highway Market Analysis
Part 5 Environmental Analysis
5-26
quality through pollution prevention programs. Contaminants from toxic coatings and discharges from ships have been mitigated for the most part, with the exception of contaminants that may come from ship and boat hulls and potential accident related contaminants. In addition, the INRMP addresses surface water use by advocating for seasonal restrictions for watercraft operations in priority bird-use areas, speed reductions, noise, and light reduction/shielding, and the protection of sensitive bird populations through avoidance of bird assemblages and habitat disturbance (POSD District and NAVFAC SW 1999). Increased shipping through the POSD has the potential to expand the rate of ballast-water introductions of exotic species.
Socioeconomic and Environmental Justice
Socioeconomic and Environmental Justice issues are a concern at the POSD and are addressed in the Green Port Policy. The proposed Marine Highway service and associated infrastructure projects would be subject to the criteria established in the Green Port Policy. The mandates of the Green Port Policy are to establish an integrated overarching environmental sustainability policy which guides “business decisions, development and operations within the San Diego Unified Port District's jurisdiction” (POSD 2008). The District is responsible for administering the Green Port Policy to ensure that the following objectives are achieved (POSD 2008):
• Minimize, to the extent practicable, environmental impacts directly attributable to operations on San Diego Bay and the tidelands,
• Strengthen the District's financial position by maximizing the long-term benefits of energy and resource conservation,
• Prevent pollution and improve personal, community, and environmental health,
• When possible, exceed applicable environmental laws, regulations and other industry standards,
• Ensure a balance of environmental, social, and economic concerns are considered during planning, development, and operational decisions,
• Define and establish performance-driven environmental sustainability objectives, targets and programs,
• Monitor key environmental indicators and consistently improve performance,
• Foster socially and environmentally responsible behavior through communications with employees, tenants, stakeholders and the community, and
• Collaborate with tenants to develop an integrated, measurable, bay-wide environmental sustainability effort.
5.5.2 San Pedro Bay Ports
The San Pedro Bay Ports consist of the Ports of Los Angeles and Long Beach (LA/LB Ports). The LA/LB Ports have policies, plans, and general operating practices that are driven by

West Coast Marine Highway Market Analysis
Part 5 Environmental Analysis
5-27
environmental protection programs. These should be considered when development or changes to existing operations are implemented as a result of the Marine Highway service. Significant general resources areas of the San Pedro Bay Ports include air quality, water resources, and socioeconomic and environmental justice.
Air Quality
Air quality is an issue for the San Pedro Bay Ports and both the LA/LB Ports have collaborated to develop a plan to promote improved air quality and reductions to the health risks associated with the Port industry. The San Pedro Bay Clean Air Action Plan (CAAP) was developed to address these air quality issues. The proposed Marine Highway service will have to be consistent with the CAAP. Further information on the CAAP is provided below.
The CAAP is a joint action between the LA/LB Ports with the cooperation of the South Coast Air Quality Management District (CARB) and the USEPA to improve air quality in the South Coast Air Basin. The CAAP is aimed at reducing the health risks posed by air pollution from port-related ships, trains, trucks, terminal equipment and harbor craft (POLA and POLB 2011). The CAAP has initiated anti-air pollution strategies including the Clean Trucks Programs, vessel pollution reduction programs, and advanced new technology, including the procurement of the world’s first hybrid tugboat. In 2010 the CAAP was updated to include the development of the San Pedro Bay Standards which establishes planning goals through the end of 2013 and health risk reduction goals for 2020. In addition, the CAAP update aligns target emissions reduction goals with state and federal regulatory agencies in years 2014 and 2023 (POLA and POLB 2011). Annual emissions inventories are required to track the Ports’ progress in achieving the CAAP standards. Included in the annual GHG emissions inventories are estimated quantities of PM (10-micron, 2.5-micron), DPMNOx, SOx, Hydrocarbons (HC), Carbon monoxide (CO), Carbon dioxide (CO2), Methane (CH4), and Nitrous oxide (N2O); and are inventoried from five source categories:
• Ocean-going vessels,
• Harbor craft,
• Cargo handling equipment,
• Railroad locomotives, and
• Heavy-duty vehicles
The CAAP Update establishes long-term goals for emissions and health-risk reductions across the two Ports with milestones, potential emissions reduction forecasts, and budgetary commitments (POLA and POLB 2011). Relative to baseline year 2005, the following milestones have been established (POLA and POLB 2011):
• By 2014, reduce port-related emissions by 22 percent for NOx, 93 percent for SOx, and 72 percent for DPM;
• By 2023, reduce port-related emissions by 59 percent for NOx, 92 percent for SOx and 77 percent for DPM; and

West Coast Marine Highway Market Analysis
Part 5 Environmental Analysis
5-28
• Development of a 2020 “health-risk reduction standard” aimed at lowering the diesel particulate pollution caused cancer risks by 85 percent in the port region and adjacent communities.
Infrastructure improvement and redevelopment projects at the Ports depend upon their ability to reduce air pollution caused by DPM, NOx and SOx. The CAAP focuses on the development and implementation of Port projects that promote economic development and improved air quality and emission inventory improvements to identify source types and monitor reduction developments. Port development and transit associated with the proposed Marine Highway service would need to consider the requirements of the CAAP and the potential effect on the Ports’ emissions inventories and planning goals.
Water Resources
Water resources are an issue for the San Pedro Bay Ports and the LA/LB Ports have collaborated to develop a plan to promote improved water quality caused by Port actions. The Water Resources Action Plan (WRAP) is a shared initiative between the ports to address the past, present, and future impacts of port operations on harbor waters and sediments. The proposed Marine Highway service and associated infrastructure projects would be subject to the requirements of the WRAP and the potential effect of the ports’ impacts on the water quality throughout the San Pedro Bay. In an effort to prevent the degradation of existing water and sediment quality, the WRAP aims to protect and improve water and sediment quality through the impending need to monitor harbor waters for Total Maximum Daily Loads (TMDLs), as established by the USEPA, the Los Angeles Regional Water Quality Control Board and CWA permits. In conjunction with the Green Port Policies of both Ports, the WRAP establishes objectives for developing programs and mechanisms necessary to meet the established goals and targets of TMDLs associated with construction activities. Areas of concern identified in the WRAP include:
• Land Use Discharges: Cargo terminals, cargo handling areas, maintenance and fueling areas, landscaping and maintenance area activities, industrial facilities, roads and rail lines/facilities, parking lots, and construction sites,
• On-Water Discharges: Cargo vessels, in-water structures, and marine construction activities,
• Watershed Discharges: Stormwater, and
• Contaminated sediments: Contaminated sediments that are disrupted during construction activities serve as a repository for releasing contaminants into the water.
Socioeconomic and Environmental Justice
Port of Long Beach
Socioeconomic and Environmental Justice issues are a concern at the Port of Long Beach (POLB) and are addressed in the Green Port Policy, and are separate from the Port of Los Angeles’ (POLA) Green Port Policy. The proposed Marine Highway service and associated infrastructure projects would be subject to the criteria established in the Green Port Policy. The

West Coast Marine Highway Market Analysis
Part 5 Environmental Analysis
5-29
mandates of the Green Port Policy are to establish environmentally responsible decision making frameworks to reduce the negative impacts of Port operations in an aggressive and comprehensive manner. Through the protection of the community from harmful environmental impacts, stewardship, support of sustainability, use of technology, and community education, the Green Port Policy services the environment and the community by considering all Port related operations. The Green Port Policy’s five guiding principles are:
1. Protect the community from harmful environmental impacts of Port operations,
2. Distinguish the Port as a leader in environmental stewardship and compliance,
3. Promote sustainability,
4. Employ best available technology to avoid or reduce environmental impacts,
5. Engage and educate the community.
To facilitate the organization, implementation, and reporting of Green Port programs and projects, six Green Port Policy program elements were established:
1. Wildlife – Protect, maintain or restore aquatic ecosystems and marine habitats,
2. Air – Reduce harmful air emissions from Port activities,
3. Water – Improve the quality of Long Beach Harbor waters,
4. Soils/Sediments – Remove, treat, or render suitable for beneficial reuse contaminated soils and sediments in the Harbor District,
5. Community Engagement – Interact with and educate the community regarding Port operations and environmental programs, and
6. Sustainability – Implement sustainable practices in design and construction, operations, and administrative practices throughout the POLB
The Green Port Policy has significantly reduced the POLB’s impact on the environment and community through programs and initiatives such as the Green Flag vessel speed reduction program for air quality, Green Leases promoting environmental covenants, and the CAAP.
5.5.3 Port of Oakland
The Port of Oakland consists of a container port, an airport, an array of retail and commercial buildings, and acres of recreational and open space. The Port encompasses 19 miles (31 km) of waterfront along the City of Oakland. The Port has in place, policies, plans, and general operating practices that have a strong focus on environmental practices. The policy areas pertinent to the proposed development of the Marine Highway services are primarily related to biological resources, air quality, and water resources as described below.
Biological Resources
The Port of Oakland is committed to environmental restoration as part of its development and operations. The Port has completed a number of wetland projects around San Francisco Bay. The projects include the Martin Luther King, Jr. Regional Shoreline Wetland Restoration and Park Expansion, the Sonoma Baylands, the Middle Harbor Enhancement Area, the Middle

West Coast Marine Highway Market Analysis
Part 5 Environmental Analysis
5-30
Harbor Shoreline Park, and Hamilton Air Force Base Wetland Restoration. Consideration of the Port of Oakland’s commitment to biological resources would be necessary when associated with the proposed Marine Highway service.
Air Quality
The Port has developed the Maritime Air Quality Improvement Plan (MAQIP) to guide its efforts to reduce criteria pollutants, DPM, associated with maritime activities at the Port. The MAQIP supports current and future state and local emission requirements, but enhances these requirements, through early implementation goals and by targeting emission reductions that exceed legally mandated requirements. The proposed Marine Highway service will have to be consistent with the MAQIP. Further information about the MAQIP is provided below.
The MAQIP builds upon the Port Maritime Air Quality Policy Statement, which was adopted by the Port’s commissioners in March of 2008. The Statement sets the goal of reducing the reducing the exposure of DPM emissions associated with the Port’s maritime activities by 85 percent from 2005 to 2020, through all practicable and feasible means. The MAQIP is the guide to implement the air quality improvement initiatives through 2020. The MAQIP is built upon the cooperative efforts between the Port and regulatory, enforcement and funding agencies, tenants, business and community stakeholders will play in achieving the plan’s air emissions and health reduction goals.
The MAQIP Task Force is comprised of 35 stakeholders and was created in 2007 to develop goals and actions to guide air quality improvement efforts undertaken at the Port. The focus of the MAQIP is the reduction of DPM because of the link between DPM and human health risk. Other criteria pollutants include NOx and SOx. The MAQIP will likely be revised in the future to address greenhouse gases after such emissions have been calculated in an emission inventory. Baseline emissions were inventoried in 2005 (completed in 2007 and revised in 2008) and the human health assessments were performed in 2008 to set emission goals. The MAQIP sets aggressive interim (2012) and long-term (2020) goals for both on/near-shore and off-shore emission reductions as shown in Table 5-1.
Table 5-1 Port of Oakland On/Near-shore and Off-shore Emission Reductions
Pollutant 2012 Forecast/Goals 2020 Goals 2020
Forecast Additional Reductions
to meet 2020 Goals PM Emissions On and Near Shore -65% -85% -81% 4% Off-Shore +2% -85% -67% 18% SOx Emissions On and Near Shore -85% -85% -96% Exceeds Goals Off-Shore -3% -94% -92% 2% NOx Emissions On and Near Shore +1% -34% -31% 3% Off-Shore +12% TBD +46% TBD
To achieve these air quality goals, the MAQIP commits the Port to implement a three-pronged strategy including the targeting of early emissions reductions to meet regulatory requirements, enforcement support of regulations, and target emissions reductions above and beyond those required by regulations. The MAQIP requires the Port to periodically monitor the effectiveness of the initiatives to reduce air emissions from seaport sources. It commits the Port to prepare

West Coast Marine Highway Market Analysis
Part 5 Environmental Analysis
5-31
periodic reports to the Board of Port Commissioners and stakeholders to report on progress towards meeting the interim and long-term emission reduction goals. As a living plan, it is foreseen that the MAQIP will be updated and amended over time to respond to a number of factors, including the results of strategies and changes to the regulatory, economic, and technological environment of maritime operations at the Port.
Port development and transit associated with the proposed Marine Highway service would need to consider the requirements of the MAQIP and the potential effects on the Port’s emissions inventories and planning goals.
Water Resources
The Port of Oakland is committed to conducting its operations in the most sustainable and environmentally sensitive manner possible. Since 1992, the Port has collaborated with over 40 of its tenant industrial facilities to raise awareness about water pollution problems and to ensure specific measures are used to prevent these problems. The Port of Oakland works with tenants to conduct pollution prevention training sessions, perform regular inspections at the Port and tenant facilities, and test and monitor stormwater flow to assure no contaminants reach the bay. The Port must also follow the Comprehensive Conservation and Management Plan that addresses the decline of biological resources, increased pollutants, freshwater diversion and altered flow regime, dredging and waterway modification, and intensified land use. The Management Plan contains over 140 recommended actions with the San Francisco Bay Regional Water Quality Control Board serving as the lead agency. The Port has also adopted the Ballast Water Management Act of 2000; initiatives requiring that ships berthing at the Port of Oakland exchange ballast water in the ocean prior to entering San Francisco Bay. This requirement will reduce the intrusion of invasive aquatic species into the Bay ecosystem. The proposed Marine Highway service is subject to the requirements of the Port of Oakland Clean Water Program, San Francisco Bay Regional Water Quality Control Board, Ballast Water Management Ac t of 2000, and the Comprehensive Conservation and Management Plan.
5.5.4 Pacific Northwest Ports
Port of Seattle
The Port of Seattle operates and maintains approximately 1,500 acres of marine terminals, marinas, parks, and shoreline public access area, as well as manages aquatic areas adjacent to port facilities (POS 2007). The Port has in place, policies, plans, and general operating practices that have a strong focus on environmental conservation practices. These should be considered should development or changes to existing operations be implemented as a result of the Marine Highway service. General resources areas the Port of Seattle continues to focus on for conservation includes biological resources, air quality, and water quality.
Biological Resources
Puget Sound is a migration corridor for many sensitive as well as federally protected species. Because development and operations can impact biological resources that utilize shoreline and nearshore areas, the Port has in place the Seaport Shoreline Plan to assist in future planning for Port development. The plan is discussed in more detail below.
West Coast Marine Highway Market Analysis
Part 5 Environmental Analysis
5-32
Seaport Shoreline Plan
As a requirement under Ecology, the Port prepared a shoreline plan for its 17 properties that are located within and adjacent to sensitive nearshore and aquatic habitats, significant tribal and recreational fishing areas, and migration routes for sensitive aquatic species. The Seaport Shoreline Plan (the plan) identifies existing and future sites for port facilities and development as well as potential mitigation that may be required as a result of development. The plan is a comprehensive plan used to provide agencies and the public with a general outlook for development and operations that may affect shoreline areas. Individual projects contained within the document would need to go through the regulatory process including public review under SEPA.
The Port implements environmental restoration, cleanup, and habitat enhancement as part of its capital improvement programs. Examples of these include:
• Removing hundreds of thousands of tons of historically contaminated soil and sediments from upland and marine locations.
• Creating jobs through project development to improve the region’s economy
• Management and preservation of more than 47 acres (19 ha) of fish and wildlife habitat on the lower Duwamish River and in Elliott Bay.
• Created 20 pubic shoreline access points for residents and visitors.
Any development or facility improvements required for the Marine Highway service would need to consult the Seaport Shoreline Plan and verify what has been covered in the plan and what mitigation, if any, would be necessary to offset required activity.
Air Quality
Reducing emission of hazardous pollutants into the air is a top priority of the ports. Marine diesel engines are significant generators of toxic air pollutants that can contribute to increased rates of lung cancer, chronic respiratory and cardiovascular disease, as well as other health effects. Diesel emissions have also contributed to acid deposition, climate change and impaired visibility. The following are a brief summary of studies, policies, plans, and general procedures that the Ports have done or have in place to be proactive in reducing dangerous air pollutants from their operations. Understanding the importance of this issue in the Northwest is instrumental to the planning process for the Marine Highway service. Specific plans and procedures are described below.
Puget Sound Maritime Air Emissions Inventory
The Puget Sound Maritime Air Emissions Inventory was a study that identified and quantified pollutants emitted from maritime-related diesel equipment operating within the greater Puget Sound/Georgia Basin International Airshed region. The study was conducted voluntarily and in cooperation with members of the Puget Sound Air Forum. The Puget Sound region currently meets federal, state, and local air quality standards, but with potential future growth at the Ports, the inventory was a proactive approach to assist in future emissions control. The area covered by the inventory encompassed approximately 140 miles) south to north and 160 miles west to
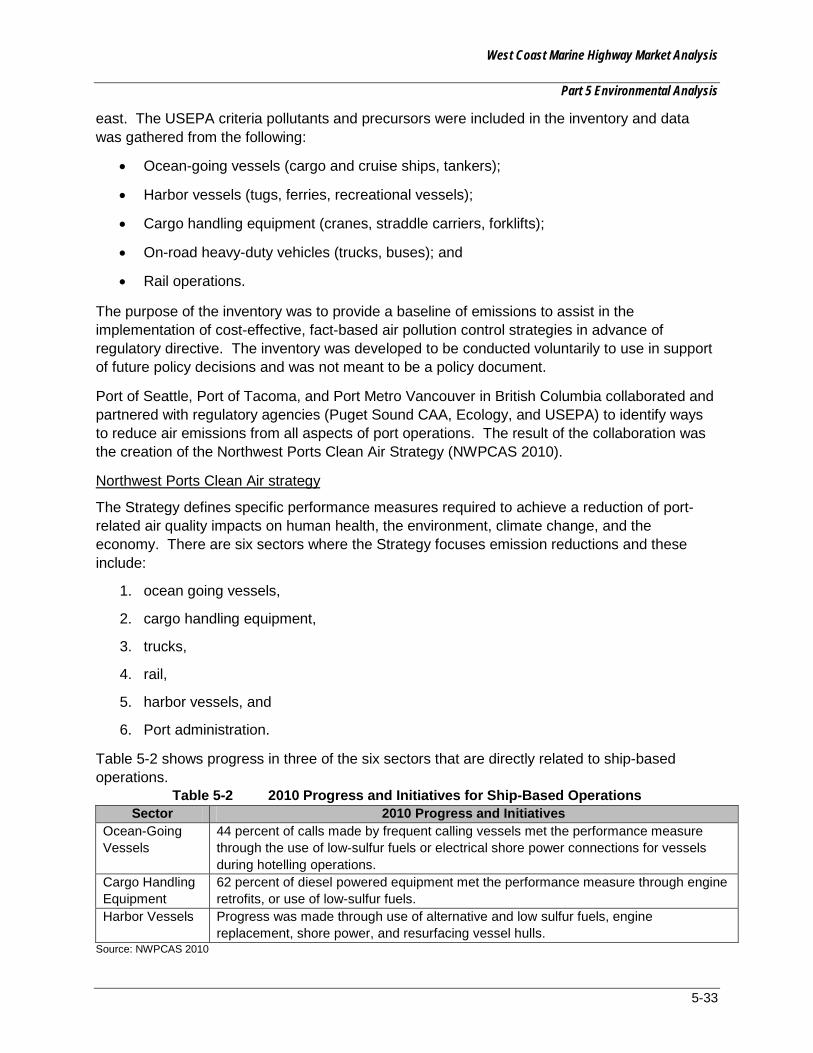
West Coast Marine Highway Market Analysis
Part 5 Environmental Analysis
5-33
east. The USEPA criteria pollutants and precursors were included in the inventory and data was gathered from the following:
• Ocean-going vessels (cargo and cruise ships, tankers);
• Harbor vessels (tugs, ferries, recreational vessels);
• Cargo handling equipment (cranes, straddle carriers, forklifts);
• On-road heavy-duty vehicles (trucks, buses); and
• Rail operations.
The purpose of the inventory was to provide a baseline of emissions to assist in the implementation of cost-effective, fact-based air pollution control strategies in advance of regulatory directive. The inventory was developed to be conducted voluntarily to use in support of future policy decisions and was not meant to be a policy document.
Port of Seattle, Port of Tacoma, and Port Metro Vancouver in British Columbia collaborated and partnered with regulatory agencies (Puget Sound CAA, Ecology, and USEPA) to identify ways to reduce air emissions from all aspects of port operations. The result of the collaboration was the creation of the Northwest Ports Clean Air Strategy (NWPCAS 2010).
Northwest Ports Clean Air strategy
The Strategy defines specific performance measures required to achieve a reduction of port-related air quality impacts on human health, the environment, climate change, and the economy. There are six sectors where the Strategy focuses emission reductions and these include:
1. ocean going vessels,
2. cargo handling equipment,
3. trucks,
4. rail,
5. harbor vessels, and
6. Port administration.
Table 5-2 shows progress in three of the six sectors that are directly related to ship-based operations.
Table 5-2 2010 Progress and Initiatives for Ship-Based Operations Sector 2010 Progress and Initiatives
Ocean-Going Vessels
44 percent of calls made by frequent calling vessels met the performance measure through the use of low-sulfur fuels or electrical shore power connections for vessels during hotelling operations.
Cargo Handling Equipment
62 percent of diesel powered equipment met the performance measure through engine retrofits, or use of low-sulfur fuels.
Harbor Vessels Progress was made through use of alternative and low sulfur fuels, engine replacement, shore power, and resurfacing vessel hulls.
Source: NWPCAS 2010

West Coast Marine Highway Market Analysis
Part 5 Environmental Analysis
5-34
The first Implementation report was published in 2008 and they are updated annually.
Green Gateway for Trade
A study conducted on the Port of Seattle and Port of Tacoma’s carbon impacts in trade determined that these Ports offer the lowest carbon footprint for containers moving from Asia to the United States destinations (POT 2009). Seattle and Tacoma are closer to Asia than any other United States port and therefore the shorter transit times result in lower fuel consumption. A Green Gateway Carbon Calculator was developed from the study and allows shippers to use different vessel sizes, utilizations, and slow steaming speeds to compare carbon dioxide equivalent (CO2e) per TEU through various North American gateways.
Specific routes the carbon footprint was calculated for included those from the Asian ports of Singapore, Hong Kong, Shanghai, Ho Chi Minh, Busan, and Tokyo to the United States distribution hubs of Chicago, Columbus, Memphis, New York, Norfolk, and Atlanta via the North American gateways of Prince Rupert, Seattle, Oakland, Los Angeles/Long Beach, Houston, Savannah, Norfolk, and New York/New Jersey (POS 2011).
At-Berth Clean Fuels Incentive Program
The At-Berth Clean Fuels Incentive Program was created to encourage shipping lines to burn low-sulfur fuel rather than high-sulfur bunker fuel in their auxiliary engines while berthed at the Port of Seattle. The program was implemented in 2009 by the Puget Sound CAA as an approach for the Port to meet performance measures set forth in the 2010 Northwest Ports Clean Air Strategy. Puget Sound Maritime Air Emissions inventory conducted in 2005 estimated that ships generated 4,229 tons of sulfur dioxide, 209 tons of fine-PM and 131 tons of DPM annually while at port using high-sulfur fuel (PSMAF 2005). Although use of low-sulfur fuel reduces these harmful emissions, it is also more costly than the high-sulfur bunker fuel (PSCAA 2011). The program reimburses shipping lines, while at port call, for using the more costly low sulfur fuel. More than 60 vessels from nine carriers have participated in the program, contributing to a reduction in sulfur dioxide emissions by approximately 80 percent (POS 2010). The program is expected to continue through June 30, 2013, subject to the availability of funds from the Port of Seattle (PSCAA 2011).
An increase in port calls as a result of the Marine Highway service would need to comply with and support the pro-active approaches the Port of Seattle takes to improve air quality from their operations.
Water Resources
The Port of Seattle has a Memorandum of Understanding in place that includes the Olympic Coast National Marine Sanctuary and prohibits all untreated cruise ship wastewater discharges.
Port of Tacoma
In general, the Port has invested millions of dollars in a wide range of cleanup and improvement projects in and around Commencement Bay. The Port’s environmental goals were adopted by the Port Commission in January 2008 and include the following:
• Protect land and water,
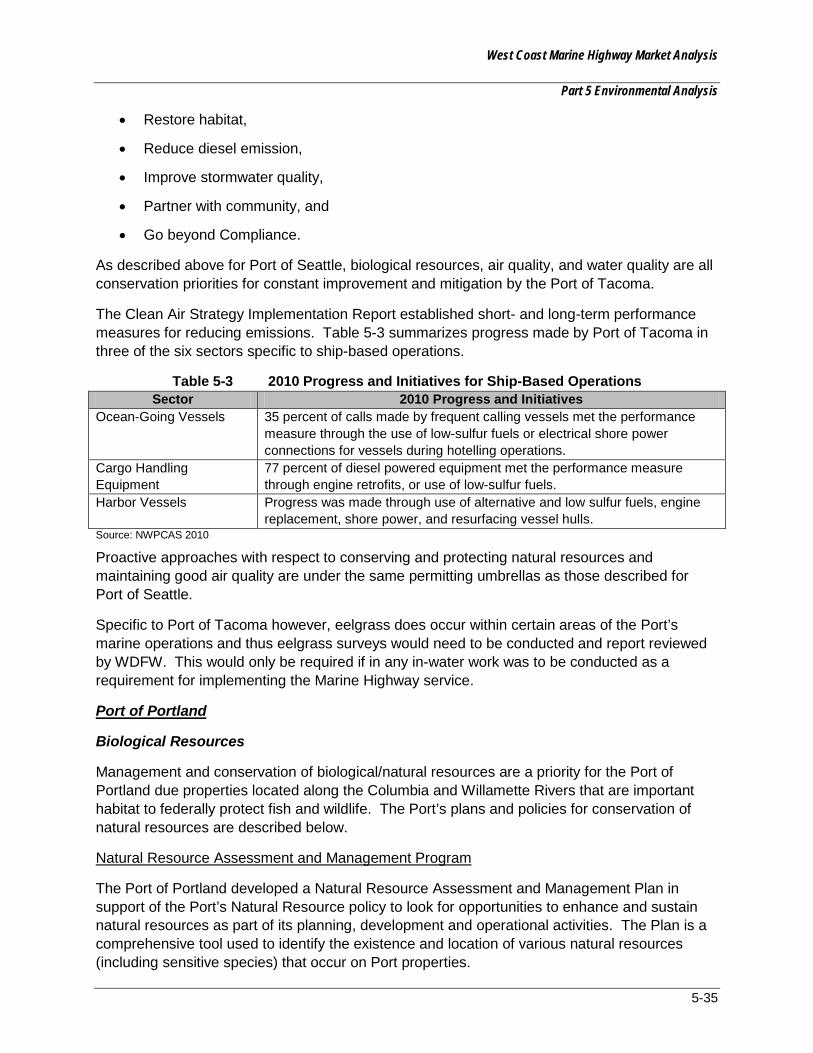
West Coast Marine Highway Market Analysis
Part 5 Environmental Analysis
5-35
• Restore habitat,
• Reduce diesel emission,
• Improve stormwater quality,
• Partner with community, and
• Go beyond Compliance.
As described above for Port of Seattle, biological resources, air quality, and water quality are all conservation priorities for constant improvement and mitigation by the Port of Tacoma.
The Clean Air Strategy Implementation Report established short- and long-term performance measures for reducing emissions. Table 5-3 summarizes progress made by Port of Tacoma in three of the six sectors specific to ship-based operations.
Table 5-3 2010 Progress and Initiatives for Ship-Based Operations Sector 2010 Progress and Initiatives
Ocean-Going Vessels 35 percent of calls made by frequent calling vessels met the performance measure through the use of low-sulfur fuels or electrical shore power connections for vessels during hotelling operations.
Cargo Handling Equipment
77 percent of diesel powered equipment met the performance measure through engine retrofits, or use of low-sulfur fuels.
Harbor Vessels Progress was made through use of alternative and low sulfur fuels, engine replacement, shore power, and resurfacing vessel hulls.
Source: NWPCAS 2010
Proactive approaches with respect to conserving and protecting natural resources and maintaining good air quality are under the same permitting umbrellas as those described for Port of Seattle.
Specific to Port of Tacoma however, eelgrass does occur within certain areas of the Port’s marine operations and thus eelgrass surveys would need to be conducted and report reviewed by WDFW. This would only be required if in any in-water work was to be conducted as a requirement for implementing the Marine Highway service.
Port of Portland
Biological Resources
Management and conservation of biological/natural resources are a priority for the Port of Portland due properties located along the Columbia and Willamette Rivers that are important habitat to federally protect fish and wildlife. The Port’s plans and policies for conservation of natural resources are described below.
Natural Resource Assessment and Management Program
The Port of Portland developed a Natural Resource Assessment and Management Plan in support of the Port’s Natural Resource policy to look for opportunities to enhance and sustain natural resources as part of its planning, development and operational activities. The Plan is a comprehensive tool used to identify the existence and location of various natural resources (including sensitive species) that occur on Port properties.
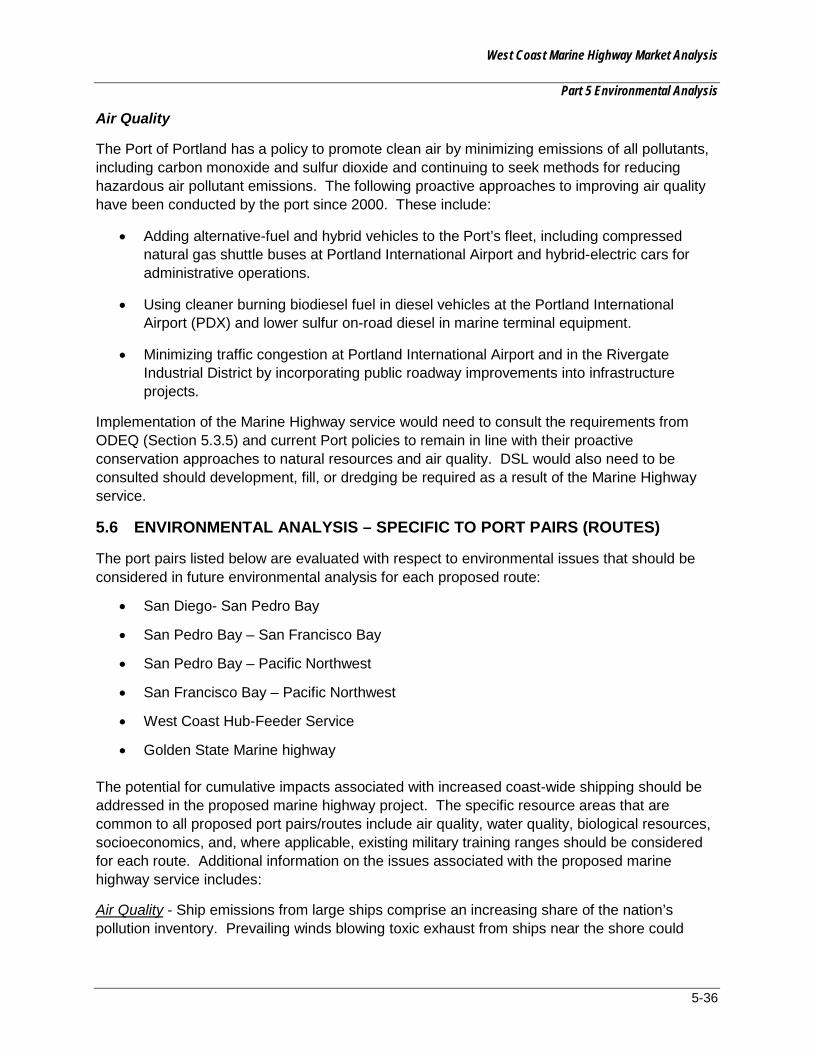
West Coast Marine Highway Market Analysis
Part 5 Environmental Analysis
5-36
Air Quality
The Port of Portland has a policy to promote clean air by minimizing emissions of all pollutants, including carbon monoxide and sulfur dioxide and continuing to seek methods for reducing hazardous air pollutant emissions. The following proactive approaches to improving air quality have been conducted by the port since 2000. These include:
• Adding alternative-fuel and hybrid vehicles to the Port’s fleet, including compressed natural gas shuttle buses at Portland International Airport and hybrid-electric cars for administrative operations.
• Using cleaner burning biodiesel fuel in diesel vehicles at the Portland International Airport (PDX) and lower sulfur on-road diesel in marine terminal equipment.
• Minimizing traffic congestion at Portland International Airport and in the Rivergate Industrial District by incorporating public roadway improvements into infrastructure projects.
Implementation of the Marine Highway service would need to consult the requirements from ODEQ (Section 5.3.5) and current Port policies to remain in line with their proactive conservation approaches to natural resources and air quality. DSL would also need to be consulted should development, fill, or dredging be required as a result of the Marine Highway service.
5.6 ENVIRONMENTAL ANALYSIS – SPECIFIC TO PORT PAIRS (ROUTES)
The port pairs listed below are evaluated with respect to environmental issues that should be considered in future environmental analysis for each proposed route:
• San Diego- San Pedro Bay
• San Pedro Bay – San Francisco Bay
• San Pedro Bay – Pacific Northwest
• San Francisco Bay – Pacific Northwest
• West Coast Hub-Feeder Service
• Golden State Marine highway
The potential for cumulative impacts associated with increased coast-wide shipping should be addressed in the proposed marine highway project. The specific resource areas that are common to all proposed port pairs/routes include air quality, water quality, biological resources, socioeconomics, and, where applicable, existing military training ranges should be considered for each route. Additional information on the issues associated with the proposed marine highway service includes:
Air Quality - Ship emissions from large ships comprise an increasing share of the nation’s pollution inventory. Prevailing winds blowing toxic exhaust from ships near the shore could

West Coast Marine Highway Market Analysis
Part 5 Environmental Analysis
5-37
further impact regions that may already be designated as non-attainment for hazardous air pollutants.
Water Quality - Spills due to collisions or other accidents are of paramount concern the entire length of the coastline. The size of vessel and cargoes shipped (i.e., oil or hazardous materials) can further open a route up to risk. A maritime accident poses the single greatest risk to marine sanctuaries. The Olympic Coast National Marine Sanctuary worked with the USCG and the IMO to establish an area to be avoided as a buffer (Figure 5-1) to provide greater response time for assistance to vessels as the rocky and environmentally sensitive coast would be at risk from a spill. All ships transiting the area and carrying cargoes of oil or hazardous materials and all ships 1,600 gross tons and larger are requested to avoid this area. Should these types of cargoes be contained on vessels or ship size using the marine highway, avoidance of the buffer would be required if these routes are considered.
Biological Resources – Five major National Marine Sanctuaries occur along the west coast and are described below in order from
Figure 5-1 International Maritime Organization Areas to be Avoided
Source OCNMS 2002
Northernmost in Washington State to southernmost in California.
• The Olympic Coast National Marine Sanctuary consists of an area of approximately 2,500 square nautical miles (NM2) of coastal and ocean waters, and the submerged lands thereunder, off the central and northern coast of the state of Washington (15 CFR Part 922) (Figures 5-4, 5-5, and 5-6).
• Cordell Bank National Marine Sanctuary incorporates 399 NM2 of the northern California coast (Figures 5-4 and 5-5).
• The Gulf of the Farallones National Marine Sanctuary is an area of 1,282 square miles (m2) off the northern and central California coast (Figures 5-3, 5-4, and 5-5).
• Monterey Bay National Marine Sanctuary encompasses a shoreline length of 276 miles (444 km) and 6,094 M2 of ocean (Figures 5-3, 5-4, and 5-5).
• The Channel Islands National Marine Sanctuary consists of an area of approximately 1,110 NM2 of coastal and ocean waters and the submerged lands thereunder, off the southern coast of California (Figure 5-3).
Socioeconomics – A common impact to consider for all proposed port pairs/routes is the increased truck traffic through minority and low income neighborhoods.
West Coast Marine Highway Market Analysis
Part 5 Environmental Analysis
5-38
Also of consideration within these proposed routes are MPAs. MPAs are protected under, EO 13158—Marine Protected Areas, which identifies significant natural and cultural resources within the marine environment for the benefit of present and future generations (Figures 5-2 through 5-8). In addition to designated sanctuaries and MPAs, designated critical habitat should also be considered for all proposed routes discussed. Critical habitat has been designated for Southern Resident killer whales, Steller sea lion, Puget Sound Chinook salmon, Hood Canal chum salmon, and Coastal/Puget Sound Bull trout and may fall directly in or immediately adjacent to proposed routes for the marine highway project.
The figures in the subsequent sections depict general representations of the marine routes evaluated in this study. Table 5-4 is a summary of the environmental issues associated with the proposed marine highway project. The figures include MPAs, national marine sanctuaries, and critical habitat for federally listed threatened or endangered species protected under the USESA. The marine highway routes are shown for illustration purposes only, and are not intended to be the actual routes. Beyond the overall resource areas and environmental issues identified within the aforementioned section, detailed information is provided in the subsequent sections (Sections 5.6.1 through 5.6.7) where specific issues have been identified for each port pair/route.
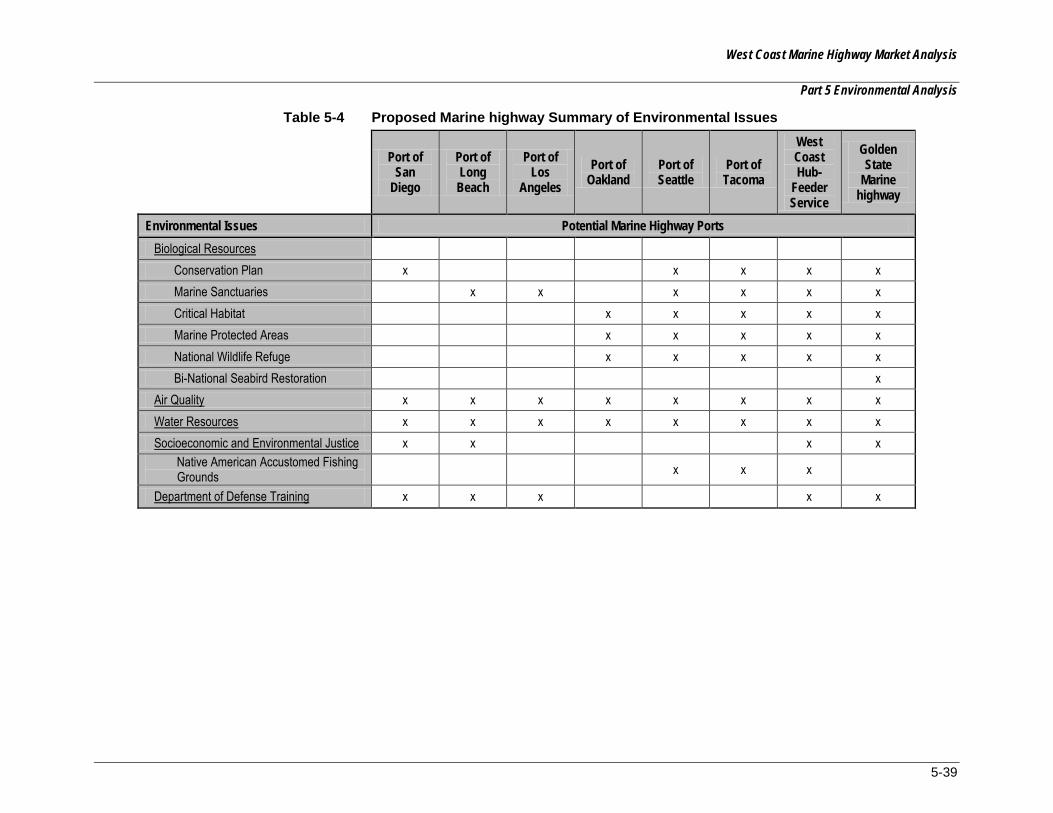
West Coast Marine Highway Market Analysis
Part 5 Environmental Analysis
5-39
Table 5-4 Proposed Marine highway Summary of Environmental Issues
Port of
San Diego
Port of Long
Beach
Port of Los
Angeles Port of
Oakland Port of Seattle
Port of Tacoma
West Coast Hub-
Feeder Service
Golden State
Marine highway
Environmental Issues Potential Marine Highway Ports Biological Resources
Conservation Plan x x x x x Marine Sanctuaries x x x x x x Critical Habitat x x x x x Marine Protected Areas x x x x x National Wildlife Refuge x x x x x Bi-National Seabird Restoration x
Air Quality x x x x x x x x Water Resources x x x x x x x x Socioeconomic and Environmental Justice x x x x
Native American Accustomed Fishing Grounds x x x
Department of Defense Training x x x x x

West Coast Marine Highway Market Analysis
Part 5 Environmental Analysis
5-40
5.6.1 San Diego-San Pedro Bay
The proposed Marine Highway corridor between San Diego and San Pedro Bay is represented in Figure 5-2. The figure identifies the boundaries of the MPAs located along the route. The route is shown for illustration purposes only, and is not intended to represent the actual route.
Air Quality
As mentioned above, ship emissions from large ships comprise an increasing share of the nation’s pollution inventory. Prevailing winds can blow diesel exhaust emissions into the South Coast Air Basin. The ARB adopted the regulation under MARPOL Annex VI that requires ocean-going vessels within 24 NM (44 km) of California’s coastline use lower-sulfur marine distallates in their main and auxiliary engines and auxiliary boilers instead of the dirtier heavy-fuel oil or “bunker fuel”. This requirement will be implemented in 2012. The Marine Highway project would need to adhere to this requirement should this route be considered.
Biological Resources
The Southern California Bight is a biologically enriched area for marine abundance and diversity. Federally listed endangered whale species (i.e., blue whales and humpbacks) as well as other large migratory whales are seasonally abundant and especially vulnerable to ship strikes. Consultation with NMFS under USESA and MMPA may be warranted should this route be considered.
Department of Defense Training Activities
Military training activities occur in the Southern California Range Complex between Camp Pendleton, San Diego, and San Clemente Island. Potential conflicts with this route could arise as the DoD is extremely concerned about “encroachment” of non-military uses into these and other areas that are used for training. The Marine Highway project would need to consult with the Navy and United States Marine Corps should this route be considered.
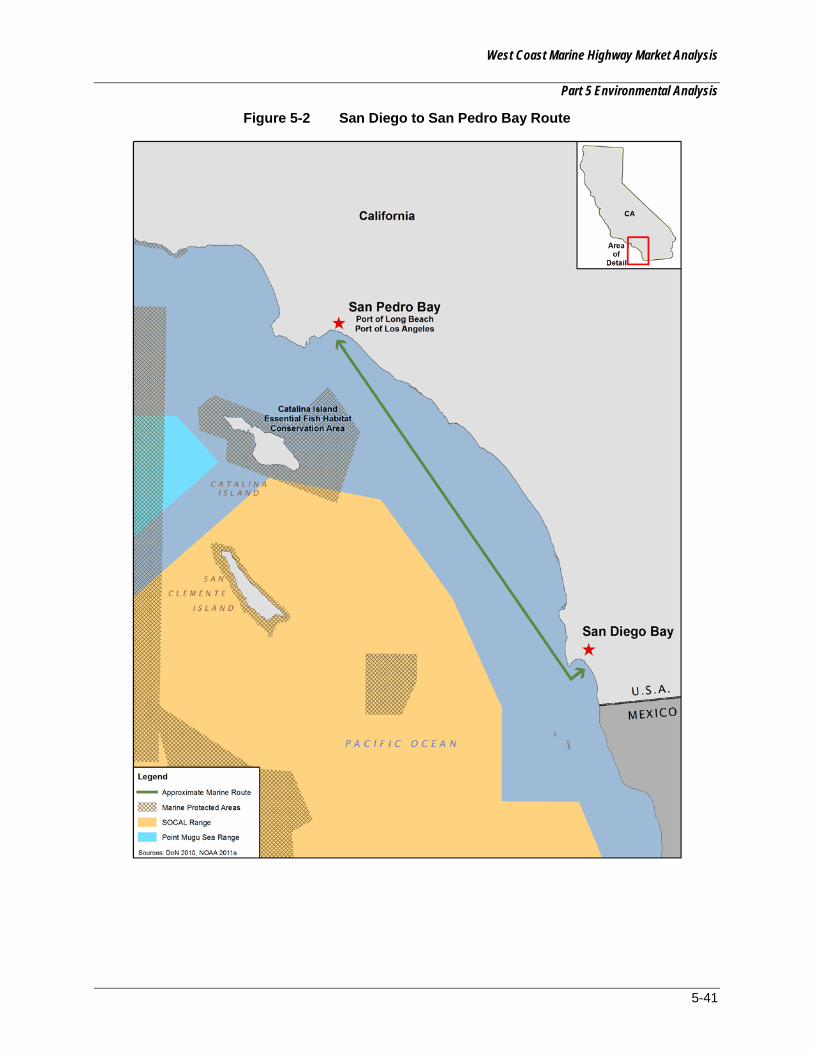
West Coast Marine Highway Market Analysis
Part 5 Environmental Analysis
5-41
Figure 5-2 San Diego to San Pedro Bay Route
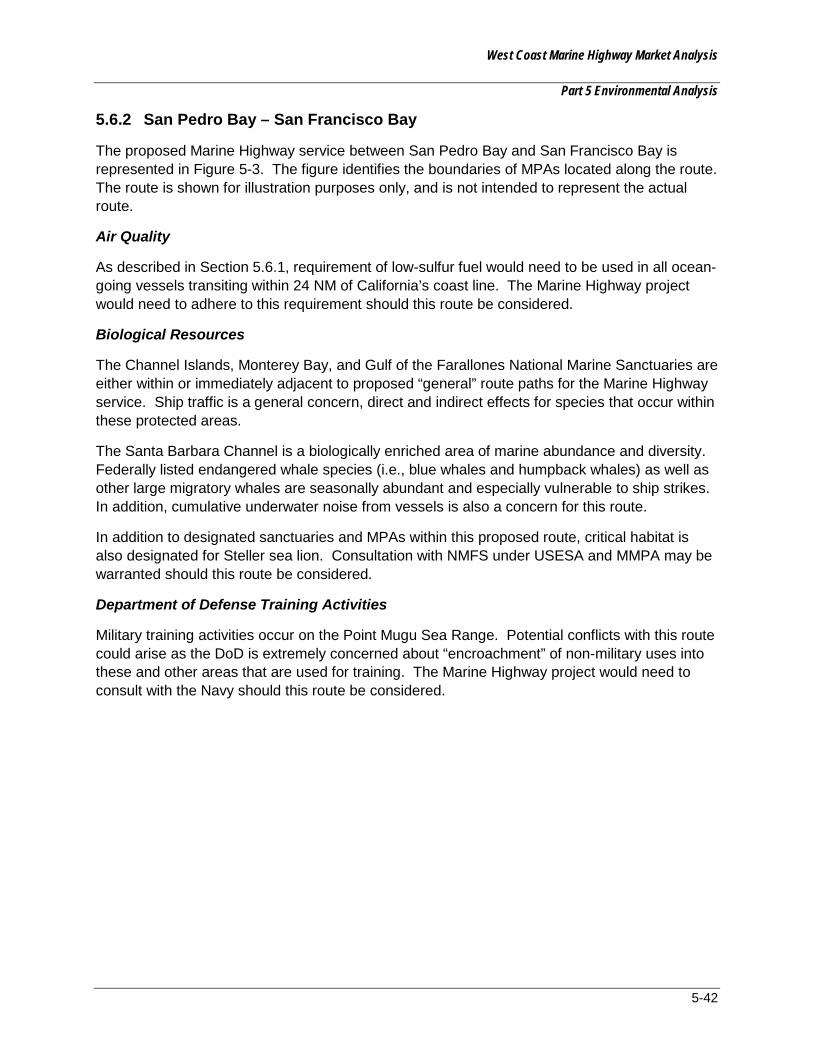
West Coast Marine Highway Market Analysis
Part 5 Environmental Analysis
5-42
5.6.2 San Pedro Bay – San Francisco Bay
The proposed Marine Highway service between San Pedro Bay and San Francisco Bay is represented in Figure 5-3. The figure identifies the boundaries of MPAs located along the route. The route is shown for illustration purposes only, and is not intended to represent the actual route.
Air Quality
As described in Section 5.6.1, requirement of low-sulfur fuel would need to be used in all ocean-going vessels transiting within 24 NM of California’s coast line. The Marine Highway project would need to adhere to this requirement should this route be considered.
Biological Resources
The Channel Islands, Monterey Bay, and Gulf of the Farallones National Marine Sanctuaries are either within or immediately adjacent to proposed “general” route paths for the Marine Highway service. Ship traffic is a general concern, direct and indirect effects for species that occur within these protected areas.
The Santa Barbara Channel is a biologically enriched area of marine abundance and diversity. Federally listed endangered whale species (i.e., blue whales and humpback whales) as well as other large migratory whales are seasonally abundant and especially vulnerable to ship strikes. In addition, cumulative underwater noise from vessels is also a concern for this route.
In addition to designated sanctuaries and MPAs within this proposed route, critical habitat is also designated for Steller sea lion. Consultation with NMFS under USESA and MMPA may be warranted should this route be considered.
Department of Defense Training Activities
Military training activities occur on the Point Mugu Sea Range. Potential conflicts with this route could arise as the DoD is extremely concerned about “encroachment” of non-military uses into these and other areas that are used for training. The Marine Highway project would need to consult with the Navy should this route be considered.
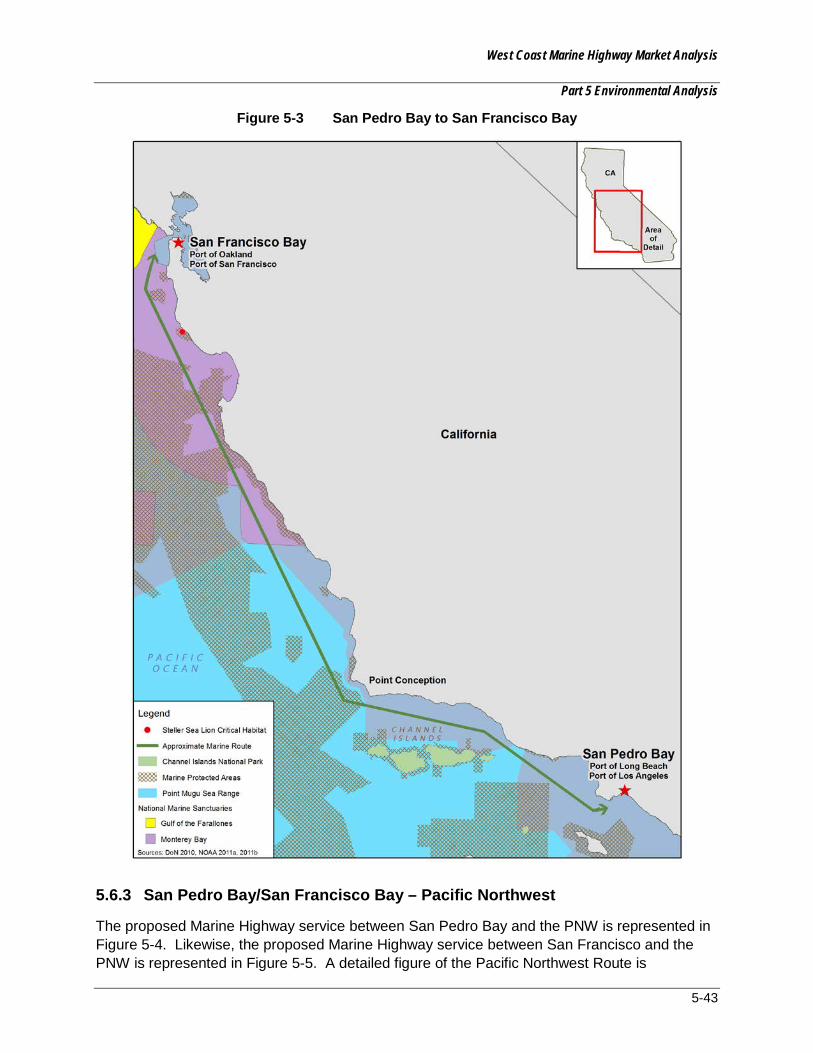
West Coast Marine Highway Market Analysis
Part 5 Environmental Analysis
5-43
Figure 5-3 San Pedro Bay to San Francisco Bay
5.6.3 San Pedro Bay/San Francisco Bay – Pacific Northwest
The proposed Marine Highway service between San Pedro Bay and the PNW is represented in Figure 5-4. Likewise, the proposed Marine Highway service between San Francisco and the PNW is represented in Figure 5-5. A detailed figure of the Pacific Northwest Route is

West Coast Marine Highway Market Analysis
Part 5 Environmental Analysis
5-44
represented in Figure 5-6. The figures identify the boundaries of MPAs located along the route. The route is shown for illustration purposes only, and is not intended to represent the actual route.
Air Quality
As described in Section 5.6.1, requirement of low-sulfur fuel would need to be used in all ocean-going vessels transiting within 24 NM of California’s coast line. The Northern American ECA as described in Section 5.2.4, will be implemented in 2012 which requires fuel be switched to the low-sulfur fuel within 200 NM) of the Pacific coastline. The Ports of Seattle, Tacoma, and PMV have already taken a proactive approach by reducing hazardous air emissions through the Northwest Ports Clean Air Strategy (see Section 5.5.3). The Marine Highway project would need to adhere to the requirements of the Northern American ECA as well as proactive reduction approaches currently performed in the PNW ports if these routes are considered.
Biological Resources
The Olympic Coast, Channel Islands, Monterey Bay, and Gulf of the Farallones National Marine Sanctuaries are either within or immediately adjacent to proposed “general” route paths for the Marine Highway service. Ship traffic is a general concern, direct and indirect effects for species that occur within these protected areas. There are also a number of National Wildlife Refuges (NWRs) along the coast of Oregon (i.e., Oregon Islands NWR) and Washington that extend offshore including many islands. Concerns are with water quality and the potential for collisions or other accidents that might cause a spill of cargo or fuel.
The Santa Barbara Channel is a biologically enriched area of marine abundance and diversity. Federally listed endangered whale species (i.e., blue whales and humpback whales) as well as other large migratory whales are seasonally abundant and especially vulnerable to ship strikes. In addition, cumulative underwater noise from vessels is also a concern for this route.
In addition to designated sanctuaries, MPAs, and NWRs, critical habitat is designated within or immediately adjacent to the proposed route path for the following species: Southern Resident killer whale, Steller sea lion, Puget Sound Chinook salmon, Hood Canal chum salmon, and Coastal/Puget Sound Bull trout. Consultation with NMFS under USESA and MMPA may be warranted should this route be considered.
Department of Defense Training Activities
DoD training activities occur on the Point Mugu Sea Range as well as the Northwest Training and Keyport Range Complexes. Potential conflicts with these routes could arise as the DoD is extremely concerned about “encroachment” of non-military uses into these and other areas that are used for training. The Marine Highway project would need to consult with the Navy should these routes be considered.
Native American Usual and Accustomed Fishing Grounds
Native American fishing rights need to be considered, and potential conflicts addressed, along the outer coast of Washington and in Puget Sound. Consultation may be required with the following tribes, Makah, Quileute, Hoh, and Quinault. Consultation with specific tribes that have Usual and Accustomed Fishing Rights along the Pacific Coast would be conducted accordingly.
West Coast Marine Highway Market Analysis
Part 5 Environmental Analysis
5-45
Figure 5-4 San Pedro Bay to Pacific Northwest

West Coast Marine Highway Market Analysis
Part 5 Environmental Analysis
5-46
Figure 5-5 San Francisco Bay to Pacific Northwest

West Coast Marine Highway Market Analysis
Part 5 Environmental Analysis
5-47
Figure 5-6 Strait of Juan De Fuca and Puget Sound Route
West Coast Marine Highway Market Analysis
Part 5 Environmental Analysis
5-48
5.6.4 West Coast Hub – Feeder Service
The proposed West Coast Hub-Feeder service portion of the Marine Highway project is located between southern California and the Washington with stops along the states of California, Oregon, and Washington, as represented in Figure 5-9. The figure is shown for illustration purposes only, and is not intended to represent the actual route. Figures 5-3 through 5-7 identify the MPAs, marine sanctuaries, and critical habitat located along the proposed route.
Air Quality
The proposed West Coast Hub-Feeder service portion of the Marine Highway is subject to air quality regulations for the states of California, Oregon, and Washington should be followed. As described in previous sections low-sulfur fuels would be used in all ocean going vessels transiting within 24 NM of the California coastline. Ocean going vessels must also be in compliance with the Northern American ECA which will be implemented in 2012 and requires fuel is switched to the low-sulfur fuel within 200 NM of the Pacific Coast coastline. The Marine Highway project would need to adhere to the requirements of the Northern American ECA as well as proactive reduction approaches currently performed in the California and PNW ports if these routes are considered.
Biological Resources
The Olympic Coast, Channel Islands, Monterey Bay, and Gulf of the Farallones National Marine Sanctuaries are either within or immediately adjacent to proposed “general” route paths for the Marine Highway service. Ship traffic is a general concern, direct and indirect effects for species that occur within these protected areas. The Santa Barbara Channel is also a biologically enriched area of marine abundance and diversity. Federally listed endangered whale species (i.e., blue whales and humpback whales) as well as other large migratory whales are seasonally abundant and especially vulnerable to ship strikes. In addition, cumulative underwater noise from vessels is also a concern for this route. There are also a number of NWRs along the coast of Oregon (i.e., Oregon Islands NWR) and Washington that extend offshore including many islands.
In addition to designated sanctuaries, MPAs, and NWRs, critical habitat is designated within or immediately adjacent to the proposed route path for the following species: Southern Resident killer whale, Steller sea lion, Puget Sound Chinook salmon, Hood Canal chum salmon, and Coastal/Puget Sound Bull trout. Consultation with NMFS under USESA and MMPA may be warranted should this route be considered.
Department of Defense Training Activities
Military training activities occur on the Point Mugu Sea Range. Potential conflicts with this route could arise as the DoD is extremely concerned about “encroachment” of non-military uses into these and other areas that are used for training. The Marine Highway project would need to consult with the Navy should this route be considered.
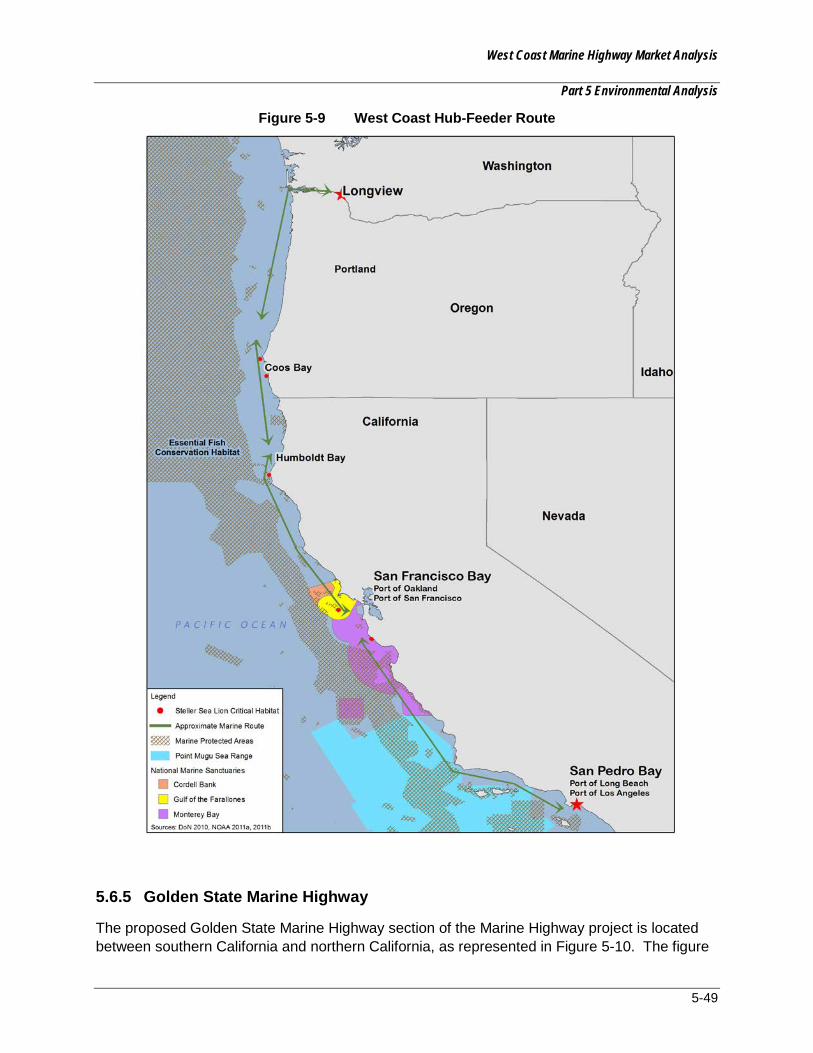
West Coast Marine Highway Market Analysis
Part 5 Environmental Analysis
5-49
Figure 5-9 West Coast Hub-Feeder Route
5.6.5 Golden State Marine Highway
The proposed Golden State Marine Highway section of the Marine Highway project is located between southern California and northern California, as represented in Figure 5-10. The figure
West Coast Marine Highway Market Analysis
Part 5 Environmental Analysis
5-50
is shown for illustration purposes only, and is not intended to represent the actual route. Figures 5-2 through 5-7 identify the MPAs, marine sanctuaries, and critical habitat located along the proposed route.
Air Quality
As described in Section 5.6.1, requirement of low-sulfur fuel would need to be used in all ocean-going vessels transiting within 24 NM of California’s coast line. The Marine Highway project would need to adhere to this requirement should this route be considered.
Biological Resources
The Southern California Bight is a biologically enriched area for marine abundance and diversity. Federally listed endangered whale species (i.e., blue whales and humpbacks) as well as other large migratory whales are seasonally abundant and especially vulnerable to ship strikes. Consultation with NMFS under USESA and MMPA may be warranted should this route be considered.
The Channel Islands, Monterey Bay, and Gulf of the Farallones National Marine Sanctuaries are either within or immediately adjacent to proposed “general” route paths for the Marine Highway service. Ship traffic is a general concern, direct and indirect effects for species that occur within these protected areas.
The Santa Barbara Channel is a biologically enriched area of marine abundance and diversity. Federally listed endangered whale species (i.e., blue whales and humpback whales) as well as other large migratory whales are seasonally abundant and especially vulnerable to ship strikes. In addition, cumulative underwater noise from vessels is also a concern for this route.
In addition to designated sanctuaries and MPAs within this proposed route, critical habitat is also designated for Steller sea lion. Consultation with NMFS under USESA and MMPA may be warranted should this route be considered.
Department of Defense Training Activities
Military training activities occur in the Southern California Range Complex between Camp Pendleton, San Diego, and San Clemente Island. Potential conflicts with this route could arise as the DoD is extremely concerned about “encroachment” of non-military uses into these and other areas that are used for training. The Marine Highway project would need to consult with the Navy and United States Marine Corps should this route be considered.
Military training activities occur on the Point Mugu Sea Range. Potential conflicts with this route could arise as the DoD is extremely concerned about “encroachment” of non-military uses into these and other areas that are used for training. The Marine Highway project would need to consult with the Navy should this route be considered.

West Coast Marine Highway Market Analysis
Part 5 Environmental Analysis
5-51
Figure 5-10 Golden State Marine Highway
West Coast Marine Highway Market Analysis
Part 5 Environmental Analysis
5-52
5.7 ENVIRONMENTAL ANALYSIS REFERENCES
Administración Portuararia Integral de Ensenada (Port Authority). 2010. Environmental Programs (Programas ambientales) Accessed: http://www.puertoensenada.com.mx/English/programasambientales.html. (December 9, 2011).
Bureau of Land Management (BLM). 2008. California Coastal National Monument – Biotic Dimension. August 5. Accessed: http://www.blm.gov/ca/st/en/prog/blm_special_areas/nm/ccnm/site_characterization/biotic.html. (October 19, 2011).
______. 2009. California Coastal National Monument – Resource Management Plan. September 9. Accessed: http://www.blm.gov/ca/st/en/prog/blm_special_areas/ nm/ccnm/ccnm_rmp_index.html. (October 19, 2011).
California Coastal Commission. 2011. New Laws Memo: 2010 Chaptered Legislation. January 12. Accessed: http://documents.coastal.ca.gov/reports/2011/1/W15-1-2011.pdf. (October 7).
California Department of Fish and Game (DFG). 2011. The Marine Region: What We Do. Accessed: http://www.dfg.ca.gov/marine/marineregion.asp. (October 7).
California Environmental Protection Agency Air Resources Board (ARB). 2010. ARB Mission and Goals. http://www.arb.ca.gov/html/mission.htm. (August 22, 2011).
______. 2011a. Mandatory Greenhouse Gas Emissions Reporting. September 12. Accessed: http://arb.ca.gov/cc/reporting/ghg-rep/ghg-rep.htm. (October 10).
______. 2011b. Commercial Harbor Craft Regulatory Activities. May 20. Accessed: http://www.arb.ca.gov/ports/marinevess/harborcraft.htm. (October 10).
California Environmental Resources Evaluation System (CERES). 2005. The California Environmental Quality Act. Accessed: http://ceres.ca.gov/ceqa/summary.html. (October 5, 2011).
Canadian Department of Justice. 2011a. Canadian Environmental Assessment Act. October 6. Accessed: http://laws-lois.justice.gc.ca/eng/acts/C-15.2/. (October 19, 2011).
Canadian Department of Justice. 2011b. Migratory Birds Regulations. October 6. Accessed: http://laws-lois.justice.gc.ca/eng/regulations/C.R.C.,_c._1035/. (October 12, 2011).
Canadian Minister of Fisheries and Oceans. 2010. Canada’s Ocean Strategy. July 9. Accessed: http://www.dfo-mpo.gc.ca/oceans/publications/cos-soc/page07-eng.asp. (October 19, 2011).
Commission for Environmental Cooperation (CEC). 1993. Part Two: Obligations, Article 2: General Commitments. Accessed: http://www.cec.org/Page.asp?PageID=122&ContentID=2731&SiteNodeID=567&BL_ExpandID=&BL_ExpandID=. (October 6, 2011).
West Coast Marine Highway Market Analysis
Part 5 Environmental Analysis
5-53
______. 2011. Commission for Environmental Cooperation. Accessed: http://www.cec.org/Page.asp?PageID=1226&SiteNodeID=310&BL_ExpandID=154. (October 10, 2011).
Council on Environmental Quality (CEQ). 2010. Final Recommendations of the Interagency Ocean Policy Task Force. July 19. Accessed: http://www.whitehouse.gov/files/documents/OPTF_FinalRecs.pdf. (October 11, 2011).
Department of Navy (DoN). 2010. Military Sea Ranges.
Environment Canada. 2009. Overview of the Environmental Enforcement Bill. March 23. Accessed: http://www.ec.gc.ca/default.asp?lang=En&xml=2ADA2898-0852-46C6-97CF-C27DF9FF8D00. (October 12, 2011).
Environment Canada. 2011. About Environment Canada. June 27. Accessed: http://www.ec.gc.ca/default.asp?lang=En&n=BD3CE17D-1. (October 12, 2011).
Environmental Protection Agency (EPA). 2012. Ocean Vessels and Large Ships – EPA Actions. Accessed: http://www.epa.gov/otaq/oceanvessels.htm. (January 18).
Food and Agriculture Organization of the United Nations (FAO). 2011. National Aquaculture Legislation Overview – Mexico. Accessed: http://www.fao.org/fishery/legalframework/nalo_mexico/en. (December 9).
Government of Canada. 2009. Species at Risk Public Registry: Purpose. November 13. Accessed: http://www.sararegistry.gc.ca/approach/act/purpose_e.cfm. (October 11, 2011).
Northwest Ports Clean Air Strategy (NWCAS). 2010. Northwest Ports Clean Air Strategy, Draft dated April 8, 2011 Draft.
Olympic Coast National Marine Sanctuary (OCNMS). 2002. International Maritime Organization (IMO) Area to be Avoided (ATBA) – Sanctuary Map and Flyer. Accessed: http://olympiccoast.noaa.gov/protect/incidentresponse/atbamap.html. (December 12, 2011).
Oregon Department of Environmental Quality (DEQ). Table 1 Air Contaminant Discharge Permits, Division 216, OAR 340-216-0020.
Port of Los Angeles (POLA) and Port of Long Beach (POLB). 2011. About the Clean Air Action Plan. Accessed: http://www.cleanairactionplan.org/about/default.asp. (October 11).
Port of San Diego (POSD). 2008. Green Port Policy. Accessed: http://www.portofsandiego.org/public-documents/doc_view/1391-green-port-policy.html. (December 9, 2011).
POSD Unified Port District (District) and Naval Facilities Engineering Command (NAVFAC) Southwest (SW). 1999. Accessed: http://www.slideshare.net/portofsandiego/san-diego-bay-integrated-natural-resources-management-plan.
Port of Seattle (POS). 2007. Seaport Shoreline Plan.
West Coast Marine Highway Market Analysis
Part 5 Environmental Analysis
5-54
________. 2010. Port Program Continues for At-Berth Ships to Burn Low-sulfur Diesel. http://www.portseattle.org/news/press/2010/06_08_2010_01.shtml. Accessed 12 Oct.
________. 2011. Port of Seattle Continues to be the Green Gateway for Trade. Article published on 19 July 2011. Accessed: http://www.portseattle.org/news/press/2011/ 07_19_2011_01.shtml. Accessed November 12.
Puget Sound Clean Air Agency (PSCAA). 2011. At-Berth Clean (ABC) Fuels Incentive program. Clearing the air on the Seattle Waterfront is as easy as ABC. http://www.pscleanair.org/programs/ dieselsolutions/abc_fuels.aspx. Accessed 12 Oct.
Puget Sound Maritime Air Forum (PSMAF). 2005. Puget Sound Maritime Air Emissions Inventory.
SEMARNAT. 2010. Procuraduría Federal de Protección al Ambiente – PROFEPA. Accessed: http://www.profepa.gob.mx/innovaportal/v/1402/1/mx.wap/our_history.html. (October 19, 2011).
United States Fish and Wildlife Service (USFWS). 2011. Bi-National Seabird Restoration Effort Launched on the Baja California Pacific Islands. Accessed: http://www.fws.gov/cno/press/release.cfm?rid=315. December 9.
Walton, Janice. 2010. Critical Habitat for Endangered Species – What is the Scope of Protection? December 14. Accessed: http://www.blakes.com/english/view_bulletin.asp?ID=4459. (October 11).
Washington Administrative Code (WAC). 2007. WAC 173-27-040: Developments exempt from substantial development permit requirement. Accessed: http://apps.leg.wa.gov/wac/default.aspx?cite=173-27&full=true#173-27-040. (December 12).
Washington Department of Ecology (Ecology). 2011a. Environmental Checklist. WAC 197-11-960.
________. 2011b. Shoreline Management. Accessed: http://www.ecy.wa.gov/programs/sea/sma/st_guide/intro.html. (December 12).
________. 2011c. Coastal Zone Management. Accessed: http://www.ecy.wa.gov/programs/sea/czm/fed-consist.html. (December 12).
Washington Department of Natural Resources (WDNR). 2011. Application and Authorization to Use State-Owned Aquatic Lands. February 2011.

West Coast Marine Highway Market Analysis
Part 5 Environmental Analysis
5-55
[This page intentionally left blank.]

West Coast Marine Highway Market Analysis
Part 6 Conclusions and Recommendations
6-1
6.0 CONCLUSIONS AND RECOMMENDATIONS
6.1 OVERVIEW
A viable marine highway service requires two principal interrelated factors: one, services that are economically and operationally attractive; and, two, potential cargo volumes that are attainable in the marketplace. Viability needs to be looked at from both the shipper's and the operator's perspectives. For the larger ports, an emerging marine highway service must fit in operationally and physically to the port's existing terminal facilities, especially the mix of international and domestic cargoes. As a new service in a smaller port, the emerging marine highway service will have to meet the test of customer acceptance. There may also be public acceptance and environmental regulatory issues not present in a port with well-established freight corridors. In both cases, the competitiveness of all-in logistics costs will be critical.
For a Marine Highway services to be attractive to shippers, they should offer an economic advantage over surface modes to potential customers in lower per unit transportation costs or service improvements (e.g., reliability and transit time). For the operator, the ability to provide service frequency and pricing required by the customer will depend largely on volume (in both directions), utilization, and systems costs.
A successful marine highway service will, then, need to connect cargo (shippers) and transportation providers (carriers) along the following parameters:
• Density – the amount of cargo transported in a single move.
• Frequency – the number of times a transport move is made (weekly, biweekly, daily).
• Reliability – the ability to predict, on a consistent basis, the movement of cargo. This factor includes arrival, departure, transit time, costs, security, and overall customer confidence in the move.
• Balance – the ability to have revenue moves in both directions (elimination or reduction of deadheading or empty non-revenue moves).
• Revenue/Cost – for a carrier/operator, revenue that creates a profit; for the shipper costs of transportation that maintains the economics of the pricing model for the commodity moved.
Other Considerations
Department of Defense Activities
• Coordination with the DoD and specific installations to minimize any conflicts between the proposed marine highway vessel operations and training activities.
Environmental Justice
• Socioeconomic studies at the port communities are required if the proposed marine highway service was found to have adverse impacts on the local port communities to
West Coast Marine Highway Market Analysis
Part 6 Conclusions and Recommendations
6-2
determine whether these impacts would disproportionally affect minority or low-income populations.
• Consideration of port communities that exhibit higher percentages of low income and/or minority residents through the NEPA documentation process would identify mitigation opportunities.
Vessel Collisions/Accidental Releases
• Vessel collisions and subsequent impacts to water quality can be minimized via compliance with ship reporting procedures, IMO traffic separation schemes, and port plans.
6.1.1 Market Requirements
The Study’s market analysis has pointed to a number of domestic and international cargo moves that potentially represent viable volumes for a prospective marine highway service. These cargo flows are both international and domestic. Interest in a marine highway option may be driven either by the shipper or the carrier. For domestic moves the shipper will largely determine whether or not a marine highway alternative is viable. For international moves, both the carrier and the carrier's customers will determine if the marine highway service presents attractive cost and service options. However, in the case of substituted service for international container moves, the economic interests of the ocean carrier could be the more important factor.
The scope of this study and its reliance on FAF3 data bases did not allow a prediction with sufficient certainty regarding what specific commodities and trade lanes would directly lead to any given successful marine highway service. Additional market study, utilizing such data bases such as TranSearch, combined with extensive shipper and transportation service provider interviews would be helpful. Clearly, a sophisticated investor would, prior to serious consideration of a marine highway venture, require a detailed market study for any prospective trade lane. The Study Team has included preliminary and conservative startup costs, which include detailed market studies and business development, in our analysis of potential marine highway services. But, the importance of understanding actual cargo movement data, both domestic and international, cannot be over-estimated as a marine highway business is contemplated.
The approach of this study is to combine the Study Team’s high-level market assessment for each prospective Marine Highway service with the team’s understanding and the results of further investigation into the competitive economics of marine highway service s compared to existing surface transportation modes. The Team’s view is that, regardless of the potential market volumes, if the economics of a truck or rail move (or the burden of the additional cost factors of a marine highway service) present competitive hurdles that can't be cleared then more detailed market data for any given marine highway corridor will be irrelevant.
West Coast Marine Highway Market Analysis
Part 6 Conclusions and Recommendations
6-3
6.1.2 Assumptions
1. Surface transportation competition will be based primarily on truck rates. Where rail is competitive, rates tend to be equalized with trucking rates. Service issues differ, with rail at a disadvantage door to door with trucking and at par or better than marine highway services.
2. Drays to the larger ports should be within 25 miles to be practicable, and 35 miles and sometimes more depending on traffic to the smaller ports. The cargo's proximity to the port is a key issue due to cost and time associated with the dray.
3. International cargo will provide the important primary or base cargo, to be augmented by domestic. However, for some of the smaller ports domestic cargo will serve as the base cargo.
4. For larger ports, the Team assumes an all-in stevedoring charge of $180 per 40 foot box, and $150 per box for the smaller ports. This rate is discounted, but considered fair given the added value a marine highway service may offer a terminal. This rate does not take into consideration special or extra gate processes that may be necessary to equalize marine highway service to truck which is essentially 24/7/365
5. Pricing target is assumed to be 20 percent less than trucking rate. As this study indicated previously, 20 percent is an arbitrary number. However, it has been tested in interviews and found generally to be acknowledged as a reasonable target. Aside from any operational advantages or deficiencies (see Part 3 for fuller discussion), a marine highway service represents not only a new market entrant but a new way of serving the market demand, requiring price incentives in the start-up phase.
6. Revenue assumptions are based on pricing at 20 percent discount off truck rates with a utilization of 95-100 percent unless otherwise noted. This aggressive utilization factor will likely not be realized, but is used to illustrate the best case. In much of the analysis, more realistic utilizations are calculated to show potential profit or loss.
7. No initial assumptions are made regarding route length or vessel type, though the operational analysis did identify certain vessels as more appropriate for certain routes.
8. No reductions in ILWU jurisdiction, labor rates, or gang sizes are assumed.
9. Fuel costs will not be a critical variable based on use of current fueling options because those increases will be reflected in fuel surcharges imposed relatively equally across all modes. However, two exceptions should be noted. One, if high speed vessels (not considered in this study) were utilized. Secondly, if LNG were to be the fuel.
10. While no minimum market size was assumed, it is clear that more cargo availability leads to a higher probability of success.
11. Multiple port calls present a challenge that is not present in a two port routing scenario based on the additional costs that will be borne with each incremental port call without obvious commensurate increases in cargo availability. Further, balancing volumes between multiple ports can be a difficult process that often results in less than optimum

West Coast Marine Highway Market Analysis
Part 6 Conclusions and Recommendations
6-4
utilization on certain legs. There is a possibility of a market advantage if there are substantial additional cargoes to be obtained at one or more intermediary ports. However, service requirements for such a service are rigorous and the revenue potential for an additional port call will be great. Market data did not identify such additional cargoes. One would also need to consider the added costs of providing empty containers or trailers to that intermediate Port. Also, container sizes will also be a consideration that would need to be balanced.
12. It is assumed that the Harbor Maintenance Tax will be enforced as it is currently (except for the “All-In” case in Part 4 where HMT is exempted) and that its value is $75 per 40' container.
13. It is assumed that the PierPASS charges ($60/TEU and $120/FEU) will not be applied.
14. It is assumed domestic cabotage requirements will remain as they currently exist.
15. It is assumed that long distance rail service will increasingly serve as a competitive transportation offering to both trucking and marine highway services on an all-in cost basis.
6.1.3 Key Success Factors
6.1.3.1 Vessels
Vessels should be matched to the service and route. The speed characteristics of various vessel types will be a major factor in costs considerations, as well as service factors. Fuel efficiency will be the prime concern. While “fast ships” may be intriguing, experience shows their fuel burn renders them non-competitive in a commercial environment. On the other side of the spectrum, barges and tug barge combinations may be the most efficient from a fuel consumption point of view but their relatively slow speed creates competitive service concerns.
LNG offers an attractive option, yielding up to 30 percent net fuel savings over MDO. While LNG fueling options at United States ports are not now well established, over the next five years several studies suggest LNG will be available, at least at the major port gateways. This emerging alternative is attracting a good deal of attention from commercial interests, as well as public decision makers.
Load line vessels with speeds between 14 and 22 knots provide the best service profile as well as sea keeping considerations for ocean voyages. However, vessel costs as well as fuel cost per mile at various speeds becomes a major planning consideration. Service should be regular and reliable and vessel schedules as advertised to potential clients should be strictly adhered to. This means vessels should be designed to operate within these schedules and customer mandates. Vessel size and draft as well as other operational characteristics to include cranes, thrusters, and crew size will also affect the cost parameters.
The most commercially viable marine highway vessel for the potential services examined for this study would appear to be a modest sized (600/700 TEU) RoCon built to specifications that would include:

West Coast Marine Highway Market Analysis
Part 6 Conclusions and Recommendations
6-5
• Speed of 18 knots with optimal fuel efficiency utilizing environmentally friendly propellants
• Thrusters for maneuverability
• Unattended engine room technology,
• Gearless and hatchless for landside operational efficiencies, and
• Ro/Ro space with quartering ramps for trailers, over-sized cargoes, and domestic 53 ft assets that are not CSC rated.
6.1.3.2 Revenue Cargo
The most obvious marine highway cargoes will be those already at the marine facilities. In most cases this will be international import, export freight and existing marine highway bulk and specialty cargoes.
In general, a viable marine highway service will attract international cargoes (for overseas transport) that are bulky and heavy, are not time sensitive, and will load in 20-, 40-, or 45-foot container assets. However, care must be taken not to exceed safe container, crane, and dray weight limits. For Marine Highway services that link major container ports, international container cargo will likely comprise the “base” cargo. It is likely, however, that additional volumes of domestic cargo will be needed to make the service viable. Other Marine Highway services, for example, those that connect smaller ports or one major container port and a smaller, may find the domestic market generating the majority of the cargo volume. In either case, it should be noted that the domestic markets are now fairly well standardized on 53-foot assets. However, the vast majority of the domestic 53-foot container equipment is lighter, has lower racking strength tolerances, and is not yet certified for sea transport. This is an area that needs further examination from a regulatory and international convention standpoint.
Price, service and transit time are critical for Marine Highway services to attract domestic cargoes from existing truck and to a lesser degree rail routes. Targeted cargoes would include those currently moving over congested routes such as the I-5, I-710, and M-580. Furthermore, longer distance routes over congested interstates and secondary two or four lane state highways may form a domestic cargo base. Normally, cargo origins and destinations relatively near the marine facilities will be favored from a cost perspective.
Other specialized over-the-road assets such as garbage or scrap haulers, cement trucks, flatbeds will not be easily accommodated by Marine Highway service unless specialized Ro/Ro ships or ATBs are constructed. In some cases, where volumes are exceptionally high for cargoes such as garbage and scrap, specialized services generally utilizing cheaper (and slower) deck barges may be appropriate.
6.1.3.3 Marine Terminal Operations
In addition to sufficient capacity, the marine terminal will need to offer consistent, reliable service matching the needs of the clients’ logistics chain. Service must be as competitive as possible to overall time and cost when compared to truck or rail. Moreover, stochastic (e.g.,
West Coast Marine Highway Market Analysis
Part 6 Conclusions and Recommendations
6-6
induced port calls) service offerings will not survive as the basis of any given Marine Highway service.
Reliable, consistent, predictable service should not be in question. However, a Marine Highway service cannot operate 24/7/365, as do truck and rail. Therefore, the marine terminal will need to be aware and capable of providing levels of service that the domestic supply chain expects, but likely in excess of the typical marine terminal operations (for example, flexible gate hours and acceptance of "hot boxes" arriving after typical vessel cut-off times). The augmented operations and services associated with current services to Hawaii, Puerto Rico, and Alaska serve as models.
6.1.3.4 Drayage
The added costs of moving cargo between international terminals or the direct drayage costs of moving cargo to and from inland distribution and manufacturing facilities to a port/terminal complex on both ends of a viable marine highway service will add anywhere from $125 to $150 per container (regardless of size) for a maximum 25 mile dray. Any dray beyond 25 miles will begin to load costs beyond that which the service may be able to competitively absorb. In addition, the costs for relocating empty containers and repositioning chassis is a cost that needs to be applied to a marine highway service as the competitive trucking costs cover these events (dead-heading).
6.1.3.5 Management and Financing
As with any successful venture the quality of the management, especially in an entrepreneurial environment is critical. As start-ups are always problematic, especially given the intense competition from trucks and potentially from rail on the longer routes, sufficient financing should be in place to bridge low vessel utilization until the Marine Highway concept is proven to be reliable and predictable.
Vessel and operational management should have a clear concept of the service so that vessels can be properly designed. Marine facilities should be organized to effectively deal with the extra rigors associated with domestic freight movements. The importance of labor in the maritime industry, both waterside and land side, cannot be underestimated. Management should have hands-on experience in these areas.
The development of systems and procedures to deal with the cargo flows, booking, documentation and customs or other regulatory procedures where appropriate is another non trivial task that a potential operator should consider. Systems and process take time and money to establish and they should work effectively and efficiently from the first sailing if the reliability and predictability of any marine highway application is to be proven to the supply chain community.
6.1.3.6 Potential for Public Policy Cost Savings
Public Port Charges - Cost reduction opportunities, at least on a start-up basis, will enhance the ability of an emerging Marine Highway service to survive in the first few critical years as that service makes the business case to shippers and carriers to make a modal transfer. The major
West Coast Marine Highway Market Analysis
Part 6 Conclusions and Recommendations
6-7
marine terminal cost element is wharfage or the equivalent fee paid to public port authorities, including throughput agreements with private terminal operators. In consideration for the positive public benefits of marine highways, public ports should closely examine their costing structure regarding marine highway services. However, it is recognized that for port authorities that may lose business due to a marine highway serving as a substituted service for a direct international call, any such subsidization of a marine highway will not be looked at favorably.
Harbor Maintenance Tax - This study has assumed that HMT adds an average of $75 per forty foot container to the shipping costs. The application of HMT to domestic port to port moves, as well as import cargo, provides a cost advantage to trucking. The tax adds costs and might impact the competitiveness of Marine Highway services.
6.1.3.7 Recommendations Include:
1. Monitor M-580 Corridor business and operational implementation as to its applicability (lessons learned, best practices) with other Marine Highway corridors, notably M-5.
2. An in-depth market analysis should be undertaken for the most feasible Marine Highway Service routes and corridors, based on the current series of studies, including M-5. These analyses should be developed on an individual corridor basis, due to the fact that each Marine Highway tends to evidence unique attributes. These analyses should focus on domestic cargoes where current information is deficient--identifying potential modal shift and market opportunities. The studies should address specific economic and business drivers, by corridor, required to incent a modal shift to a given Marine Highway Service, as well as on investor requirements. Shipper, trucker, and prospective investor input will be especially useful. Such studies typically are a normal and usual part of the "due diligence" process for a private investor, but given the prospective public benefits of Marine Highway Services, joint public and private funding may be appropriate. This evaluation should incorporate the assessment of “specialty” cargoes, such as garbage or waste and recyclables, which are characterized by factors not normally associated with moving containers or Ro/Ro cargo. These analytics would also create further evidence regarding potential economic development opportunity at Marine Highway Service ports.
3. The means or criteria for quantifying public benefits of specific Marine Highway transportation services should be developed. Likewise the standards by which that data can be put used to judge those services and award tax or other incentives as discussed earlier. While states could take the initiative it would be most desirable for those terms to be set at the national level. The calculator and project grant evaluation standards used by the European Union in its Marco Polo and Motorways of the Sea programs, as well as EPA SmartWay and other calculators here in the United States, can be evaluated as potential models.
6.2 CONCLUSIONS
This study explained the factors for a successful Marine Highway service. Based on those factors, services with the greatest chance of long-term viability exhibited the following characteristics:
West Coast Marine Highway Market Analysis
Part 6 Conclusions and Recommendations
6-8
• Longer distance between port pairs with an origin/destination of the cargo within 25 to 35 miles of each port terminal. This means larger, denser population centers had a greater probability of developing sufficient cargoes to sustain a Marine Highway service development.
• New load-line vessel. Existing tonnage is not optimal for Marine Highway services. Acquiring vessels with high fuel efficiency, operational flexibility (combination Ro/Ro Lo/Lo) and other operating characteristics are important success factors in the longer term.
• Potential for carrying international cargo based on substituted service.
• Available domestic cargo within defined dray distance parameters.
• The ability to have service reliability and predictability in terms of frequency and consistency of service that, while not precisely matching truck competition, will be acceptable to certain domestic supply chain clients.
• The Marine Highway service was not subject to either HMT or other port charges.
• Public port pricing reductions were made available in the areas of dockage and wharfage.

West Coast Marine Highway Market Analysis
Part 6 Conclusions and Recommendations
6-9
[This page intentionally left blank.]

West Coast Marine Highway Market Analysis
Attachment 1 Abbreviations and Acronyms
ATTACHMENT 1 ABBREVIATIONS AND ACRONYMS
3PL third party logistics ACDP Air Contamination Discharge ARB California Air Research Board AMH American Marine Highway ASG American Shipping Group ATB articulated tug and barge BCO beneficial cargo owner BLM United States Bureau of Land Management C3 Category 3 [engine standards] CAA Clean Air Act CAAP [San Pedro Bay] Clean Air Action Plan CAP Clean Air Program CARB [California] South Coast Air Quality Management District CBP United States Custom and Border Protection CCA California Coastal Act CCDoTT Center for the Commercial Deployment of Transportation Technologies CCNM California Coastal National Monument CCR California Code of Regulations CEC Commission for Environmental Cooperation CEPA Canadian Environmental Protection Act CEQ Council on Environmental Quality CEQA California Environmental Quality Act cfs cubic feet per second CMSP coastal and marine spatial planning COB Container on Barge COG council of governments CONABIO National Commission for Knowledge and Use of Biodiversity
(Comisión Nacional para el Conocimiento y Uso de la Biodiversidad COSEWIC Committee on the Stats of Endangered Wildlife in Canada CSA Consolidated Statistical Area CSA 2001 Canadian Shipping Act, 2001 CSC Convention for Safe Containers CWA Clean Water Act CZMA Coastal Zone Management Act DFG California Department of Fish and Game DLCD Department of Land Conservation and Development DNR Washington Department of Natural Resources DNS determination of non-significance DoD Department of Defense DPM diesel particulate matter DSL Department of State Lands EA Environmental Assessment EBITDA Earnings Before Interest, Taxes, Depreciation, Amortization ECA emission control area

West Coast Marine Highway Market Analysis
Attachment 1 Abbreviations and Acronyms
Ecology Washington Department of Ecology EDF Environmental Defense Fund EEZ Exclusive Economic Zone EFH essential fish habitat EIR Environmental Impact Report EIS Environmental Impact Statement EO Executive Order ERAP Emergency Response Assistant Plan EU European Union FAF3 Freight Analysis Framework FEU forty-foot equivalent unit FHWA Federal Highway Administration FMC Fishery Management Council FMP Fishery Management Plan FOE Friends of the Earth FONSI Finding of No Significant Impact GAO Government Accountability Office GHG greenhouse gas Ha hectares HML Humboldt Marine Logistics HMT Harbor Maintenance Tax hp horse power HPA Hydraulic Project Approval HS Harmonized System ILA International Longshoremen’s Association ILWU International Longshore and Warehouse Union IMC intermodal marketing company IMO International Maritime Organization IMTC International Mobility & Trade Corridor INE National Ecology Institute (Instituto Nacional de Ecología INRMP Integrated Natural Management Plan ISO International Organization of Standardization JARPA Joint Aquatic Resources Permit Application Jones Act Merchant Marine Act of 1920 Section 27 (P.L. 66-261) 46 USC 551) km kilometer LA/LB Ports Ports of Los Angeles and Long Beach LNG liquefied natural gas Lo/Lo lift on/lift off vessel m2 square miles MAQIP Maritime Air Quality Improvement Plan MARAD United States Maritime Administration MARPOL International Convention for the Prevention of Pollution from Ships MBTA Migratory Bird Treaty Act MDO marine diesel oil MGO marine gas oil MGS Magnuson-Stevens Fishery Conservation and Management Act
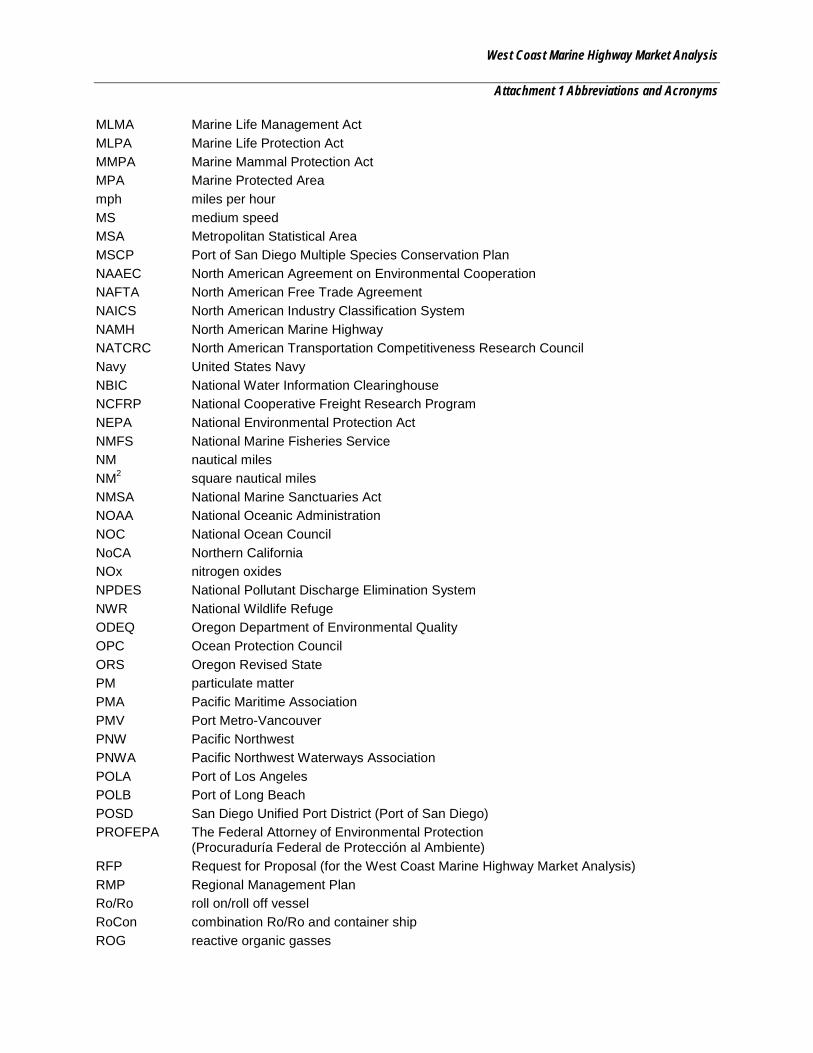
West Coast Marine Highway Market Analysis
Attachment 1 Abbreviations and Acronyms
MLMA Marine Life Management Act MLPA Marine Life Protection Act MMPA Marine Mammal Protection Act MPA Marine Protected Area mph miles per hour MS medium speed MSA Metropolitan Statistical Area MSCP Port of San Diego Multiple Species Conservation Plan NAAEC North American Agreement on Environmental Cooperation NAFTA North American Free Trade Agreement NAICS North American Industry Classification System NAMH North American Marine Highway NATCRC North American Transportation Competitiveness Research Council Navy United States Navy NBIC National Water Information Clearinghouse NCFRP National Cooperative Freight Research Program NEPA National Environmental Protection Act NMFS National Marine Fisheries Service NM nautical miles NM2 square nautical miles NMSA National Marine Sanctuaries Act NOAA National Oceanic Administration NOC National Ocean Council NoCA Northern California NOx nitrogen oxides NPDES National Pollutant Discharge Elimination System NWR National Wildlife Refuge ODEQ Oregon Department of Environmental Quality OPC Ocean Protection Council ORS Oregon Revised State PM particulate matter PMA Pacific Maritime Association PMV Port Metro-Vancouver PNW Pacific Northwest PNWA Pacific Northwest Waterways Association POLA Port of Los Angeles POLB Port of Long Beach POSD San Diego Unified Port District (Port of San Diego) PROFEPA The Federal Attorney of Environmental Protection
(Procuraduría Federal de Protección al Ambiente) RFP Request for Proposal (for the West Coast Marine Highway Market Analysis) RMP Regional Management Plan Ro/Ro roll on/roll off vessel RoCon combination Ro/Ro and container ship ROG reactive organic gasses
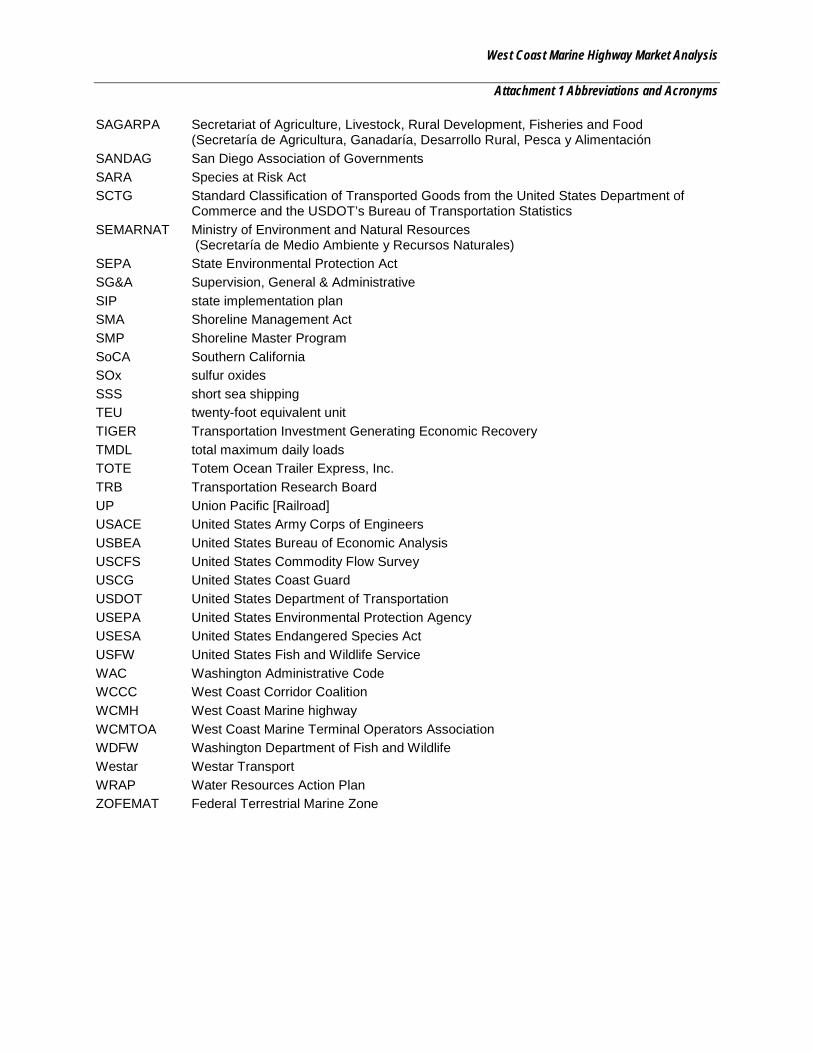
West Coast Marine Highway Market Analysis
Attachment 1 Abbreviations and Acronyms
SAGARPA Secretariat of Agriculture, Livestock, Rural Development, Fisheries and Food (Secretaría de Agricultura, Ganadaría, Desarrollo Rural, Pesca y Alimentación
SANDAG San Diego Association of Governments SARA Species at Risk Act SCTG Standard Classification of Transported Goods from the United States Department of
Commerce and the USDOT’s Bureau of Transportation Statistics SEMARNAT Ministry of Environment and Natural Resources
(Secretaría de Medio Ambiente y Recursos Naturales) SEPA State Environmental Protection Act SG&A Supervision, General & Administrative SIP state implementation plan SMA Shoreline Management Act SMP Shoreline Master Program SoCA Southern California SOx sulfur oxides SSS short sea shipping TEU twenty-foot equivalent unit TIGER Transportation Investment Generating Economic Recovery TMDL total maximum daily loads TOTE Totem Ocean Trailer Express, Inc. TRB Transportation Research Board UP Union Pacific [Railroad] USACE United States Army Corps of Engineers USBEA United States Bureau of Economic Analysis USCFS United States Commodity Flow Survey USCG United States Coast Guard USDOT United States Department of Transportation USEPA United States Environmental Protection Agency USESA United States Endangered Species Act USFW United States Fish and Wildlife Service WAC Washington Administrative Code WCCC West Coast Corridor Coalition WCMH West Coast Marine highway WCMTOA West Coast Marine Terminal Operators Association WDFW Washington Department of Fish and Wildlife Westar Westar Transport WRAP Water Resources Action Plan ZOFEMAT Federal Terrestrial Marine Zone

West Coast Marine Highway Market Analysis
Attachment 2 Glossary
ATTACHMENT 2 GLOSSARY All-In. Business case which assumes reductions in base cost for stevedoring, dockage, wharfage, and Harbor Maintenance Tax
Base Case. Business case which assumes all expenses as understood today (including existing vessel costs) with no discounting.
Drayage. Transport of containerized cargo by specialized trucking companies between ocean ports or rail ramps and shipping docks (Wikipedia)
Intermodal Marketing Company. Company that specializes in the provision of intermodal services through wholesale purchasing freight capacity from carriers, such as railroad companies, and retail marketing that capacity to shippers. Often providing shippers intermodal containers.
Marpol. The International Convention for the Prevention of Pollution From Ships, 1973 as modified by the Protocol of 1978
MOVES. Motor Vehicle Emission Simulator developed by the EPA Office of Transportation and Air Quality (OTAQ). This new emission modeling system estimates emissions for mobile sources covering a broad range of pollutants and allows multiple scale analysis.
PierPASS. A program initiated by San Pedro Bay ports to relieve congestion, security, and air quality issues by charging a traffic mitigation fee during peak hours, thereby incentivizing the use of off-peak hour for truckers.
Short Sea Shipping. Movement of cargo on sea while remaining in the same continent without crossing an ocean.
SmartWay. EPA program that reduces transportation-related emissions by creating incentives to improve supply chain fuel efficiency.
Substituted Service. An international carrier reduces port calls with larger vessels, serving other ports with smaller vessels via a Marine Highway.
Title XI. Federal ship financing program to promote growth and modernization of U.S. Merchant Marine and U.S. Shipyards.
West Coast Marine Highway Market Analysis
Attachment 3
ATTACHMENT 3 LIBRARY (Electronic only)
• Journals
• PowerPoint
• Program Regulations
• Reports, Studies
• Document List
• White Papers

West Coast Marine Highway Market Analysis
Attachment 4
Attachment 4-1
ATTACHMENT 4 International Services Appendix
INTRODUCTION The America’s Marine Highway Program was established by the U.S. Department of Transportation to reduce landside congestion through the increased use of short sea transportation between U.S. ports (or U.S. ports and Canadian Great Lakes ports). The M-5 Corridor Study included an analysis of two short shipping routes that do not meet that definition of Marine Highway services because they do not operate between U.S. ports. For that reason, analyses of short sea shipping routes between Ensenada, Mexico and San Pedro Bay (Los Angeles and Long Beach); and between the Vancouver, Canada and Seattle/Tacoma; are described herein: Ensenada - San Pedro Bay There is a large amount of freight cargo transported in both directions from the San Pedro area (Ports of Los Angeles and Long Beach) to the region served by the Port of Ensenada, Mexico, including the substantial cargo flows between warehouses and distribution centers in the San Pedro basin and Baja, Mexico. That freight transportation generates regional traffic congestion and resultant environmental impacts on the I-5 corridor in Southern California.
Starting a short sea transportation service between these two areas offers an opportunity to reduce that landside congestion. If implemented correctly, a short sea service can also attract cargoes by allowing shipping companies to bypass congestion and other transportation bottlenecks. For example, although the 200-mile distance from the San Pedro area to Ensenada, Mexico is should be a 4-5 hour truck trip at 50 mph for a truck, considerations such as border crossing delays and I-5 congestion realistically make this a one-day trip for a vehicle and driver. Border crossings can be challenging for trucking operators and adds cost when there are documentation issues, inspections, congestion, or other events that lead to slowdowns, and many drayage trucking companies (those that transport import and export cargoes between the San Pedro Bay ports and the Ensenada region) make this trip during the evening or overnight hours in an effort to avoid what can be substantial road congestion and border crossing delays. A short sea service connection with good customs service at the marine terminals could provide an effective solution to many of these issues.
A short sea transportation service might also be attractive as a feeder service for the larger ocean carriers. While many ocean containership lines that serve San Pedro also call Mexican ports, there is an opportunity for those that don’t to service cargoes with origins and destinations near Ensenada using a dedicated short sea feeder type vessel. For international carriers, such a service could feed cargoes to “mother” vessels calling at San Pedro thereby negating the need for the line haul vessels to call at Ensenada. To attract these cargoes, service consistency, reliability, and cost will be critical factors.
Chartering an appropriately sized, self-propelled Ro/Ro or Lo/Lo combination vessel with sufficient speed to perform three round trips a week between Ensenada and a terminal(s) at San
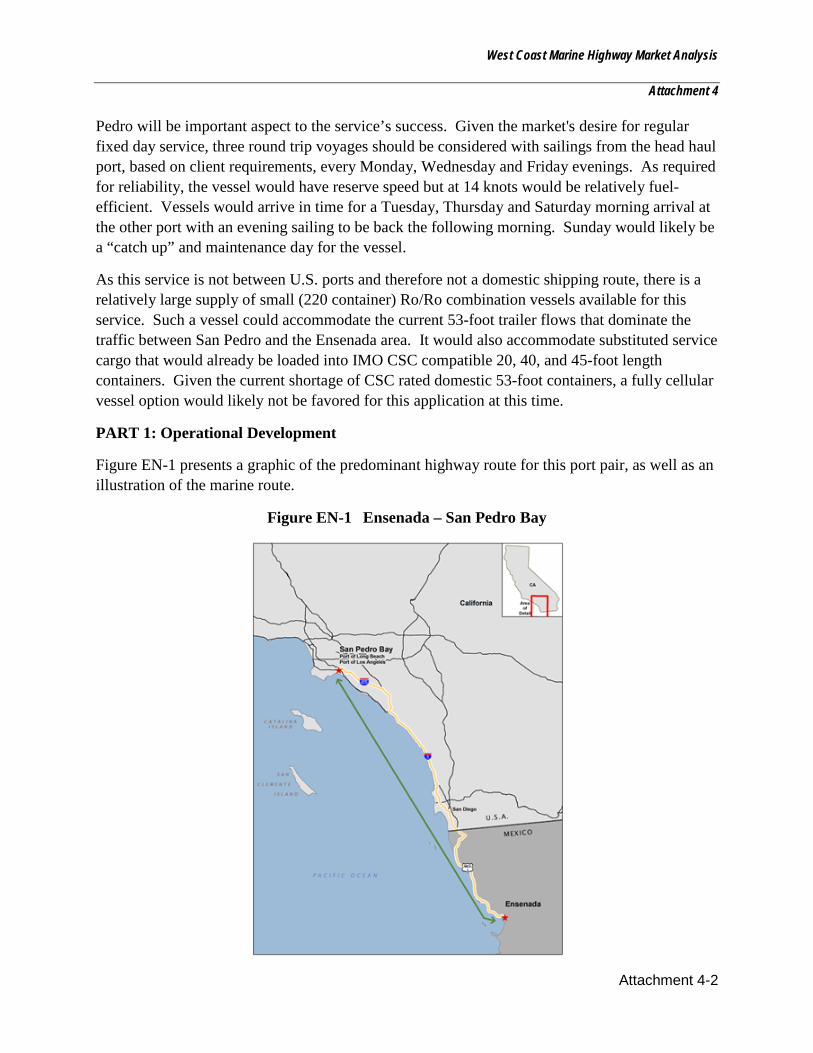
West Coast Marine Highway Market Analysis
Attachment 4
Attachment 4-2
Pedro will be important aspect to the service’s success. Given the market's desire for regular fixed day service, three round trip voyages should be considered with sailings from the head haul port, based on client requirements, every Monday, Wednesday and Friday evenings. As required for reliability, the vessel would have reserve speed but at 14 knots would be relatively fuel-efficient. Vessels would arrive in time for a Tuesday, Thursday and Saturday morning arrival at the other port with an evening sailing to be back the following morning. Sunday would likely be a “catch up” and maintenance day for the vessel.
As this service is not between U.S. ports and therefore not a domestic shipping route, there is a relatively large supply of small (220 container) Ro/Ro combination vessels available for this service. Such a vessel could accommodate the current 53-foot trailer flows that dominate the traffic between San Pedro and the Ensenada area. It would also accommodate substituted service cargo that would already be loaded into IMO CSC compatible 20, 40, and 45-foot length containers. Given the current shortage of CSC rated domestic 53-foot containers, a fully cellular vessel option would likely not be favored for this application at this time.
PART 1: Operational Development
Figure EN-1 presents a graphic of the predominant highway route for this port pair, as well as an illustration of the marine route.
Figure EN-1 Ensenada – San Pedro Bay
West Coast Marine Highway Market Analysis
Attachment 4
Attachment 4-3
Markets served:
International (Asia, South American) Cargo – While many Lines also call Mexican Ports there is an opportunity to service Mexico via the San Pedro Ports for some international carriers. Service consistency, reliability, and cost will be critical factors. Additionally, effectively dealing with customs and other regulatory procedures will be important success factors.
International Coastal Cargo - The principal cargoes on this route will be Mexico origin and/or destination cargoes bound for warehouses and distribution centers in the San Pedro basin. Consequently, a small foreign flag Ro/Ro vessel would be favored so that current 53-foot trailer flows can be preserved. If cellular container vessels were utilized, all the cargo would need to be loaded into International Maritime Organization's (IMO) CSC compatible domestic 53 foot containers or International Organizational of Standardization (ISO) marine containers of predominantly 40 and 45-foot lengths. Given the current shortage of CSC rated domestic 53 foot containers, the cellular option would likely not be favored for this application at this time.
Major Potential Commodities
Electronic products are the largest product group in terms of value moving in both directions between Mexico and the Los Angeles region but are considered to have low potential for short sea service, given their relatively high value.
Northbound low value flows from Mexico to the Los Angeles region are dominated by agricultural products in terms of tonnage. Other principal products include:
• non-metallic mineral products,
• furniture,
• plastics/rubber, and
• alcoholic beverages.
Principal low-value products moving southbound from the Los Angeles region to Mexico include:
• plastics/rubber,
• wood products,
• other foodstuffs (e.g. soups and broths, cheese),
• paper articles, and
• base metals and products of base metals.

West Coast Marine Highway Market Analysis
Attachment 4
Attachment 4-4
Operational Parameters
• Surface mode: Distance and truck time – The distance from San Pedro to Ensenada is approximately 200 miles on I-5. Although this could be a 4-5 hour trip at 50 mph, considerations such as border crossing and I-5 congestion would realistically make this a one day trip for a driver. Currently most drayage companies prefer to make this trip during the evening and night. Security of assets and drivers are also major concerns.
Vessel Operations
o Sailing distance: 141 NM
o Deck barges, ATB combinations, and load line vessels were considered. As this is a foreign to foreign route, there are a larger number of vessels available for deployment for this service. As pricing was not available for the ATB, only a small foreign flag Lo/Lo Ro/Ro type vessel was used in the analysis. However, it should be noted that if this port pair becomes part of a broader service that might also call at multiple United States ports (e.g., Hueneme or Oakland), U.S. domestic shipping regulations will apply to any domestic-to-domestic cargoes.
o Sailing Times
Deck Barge at six knots = 24 hours
ATB at 12 knots = 12 hours
Load line vessel at 20 knots = seven hours
Load Line at 14 knots = 10 hours (more efficient fuel burn)
Service Frequency – Considering 10-12 hours Port time at each terminus of the service the vessel types can achieve the following frequencies:
o Deck Barge – One round trip every three days or two voyages per week, likely Monday and Thursday evenings from the head haul port as determined by client needs. This would be uncompetitive.
o ATB – round trip voyage every two days and with three turns per week, likely Monday, Wednesday, and Friday. Given the competitive truck times and the lack of suitable ATBs in the marketplace, this alternative was not considered.
o Load Line – At speed a load line vessel could not maintain a fixed day/fixed time schedule. The round trip would likely require 30-34 hours (seven at sea in each direction plus terminal time). In consideration of the potential savings in fuel consumption, the load line vessel would likely transit at 14 knots. At that speed the vessel would turn a round trip every two days, even allowing for "catch-up"
West Coast Marine Highway Market Analysis
Attachment 4
Attachment 4-5
time for contingencies. Service reliability will be critical. The vessel could sail at the same time three days a week providing regular, consistent service.
Service Recommendation and Summary This route would best be served with a small load line vessel. With a 36 to 40-hour turn from Ensenada to San Pedro and back again three trips a week could be scheduled. Given the market's desire for regular fixed day service, three round trip voyages should be considered with sailings from the head haul port, based on client requirements, every Monday, Wednesday and Friday evenings. As required for reliability, the vessel would have reserve speed but at 14 knots would be more fuel efficient. Vessels would arrive in time for a Tuesday, Thursday and Saturday morning arrival at the other port with an evening sailing to be back the following morning. Sunday would likely be a “catch up” and maintenance day for the vessel.
Marine Terminal Operations
San Pedro: There are numerous berths available in the San Pedro basin that could accommodate this type of service (Figure 3-2). As most of the cargo will be treated as domestic (even though it is legally international coastal cargo to and from Mexico), the terminal will need to have gate hours and processes that would accommodate needs more characteristic of domestic cargo. These transportation needs resemble domestic “just in time” services rather than pure international flows from Asia, Europe, or South America. Customs requirements would also be a major concern. Some exemption from export filing requirements will also be necessary as the 24 hour rule will be difficult, if not impossible, to comply with given the short duration of the trip.
Ensenada, Mexico: The vessel configuration must be compatible with in the Port of Ensenada. Refer to the figure below for an aerial view of the port. Ramp locations and capacities should be matched to available berths. It will also be a challenge to insure regular berth availability as well as gate hours to accommodate the flow of domestic traffic.
Given the importance of such a possible service, it is anticipated that the Ensenada Port Authority would be positively disposed to encouraging such a venture and making facilities available as required.
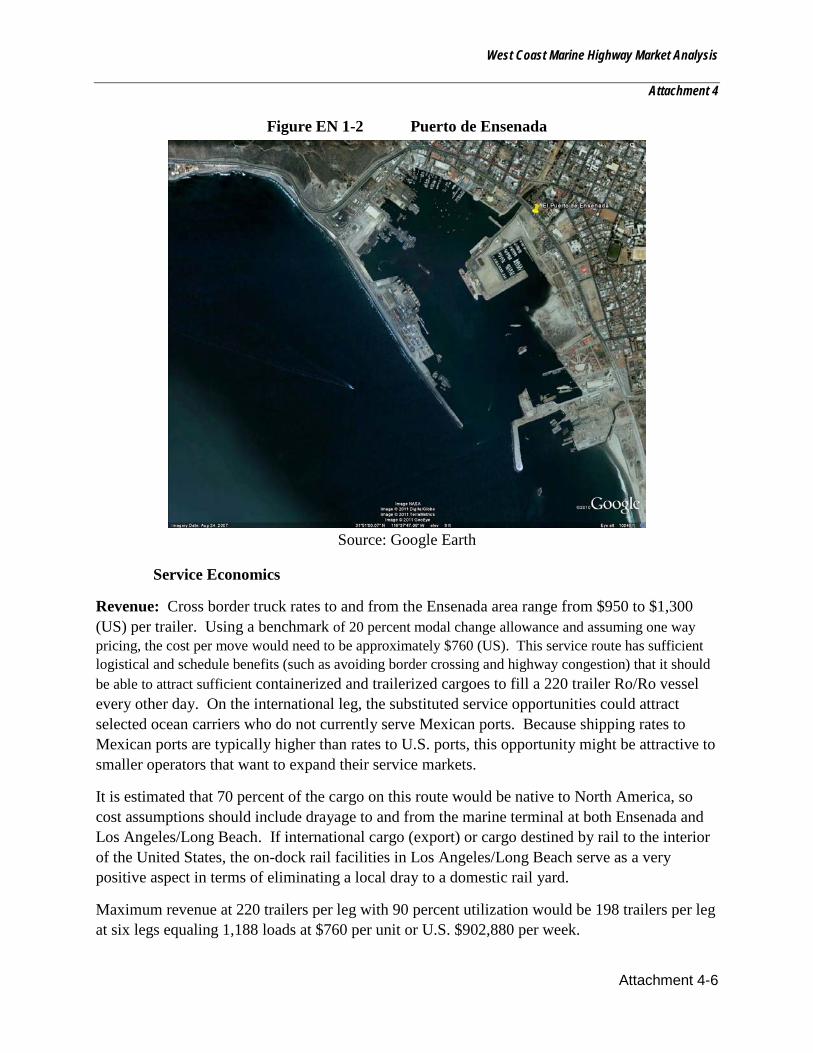
West Coast Marine Highway Market Analysis
Attachment 4
Attachment 4-6
Figure EN 1-2 Puerto de Ensenada
Source: Google Earth
Service Economics
Revenue: Cross border truck rates to and from the Ensenada area range from $950 to $1,300 (US) per trailer. Using a benchmark of 20 percent modal change allowance and assuming one way pricing, the cost per move would need to be approximately $760 (US). This service route has sufficient logistical and schedule benefits (such as avoiding border crossing and highway congestion) that it should be able to attract sufficient containerized and trailerized cargoes to fill a 220 trailer Ro/Ro vessel every other day. On the international leg, the substituted service opportunities could attract selected ocean carriers who do not currently serve Mexican ports. Because shipping rates to Mexican ports are typically higher than rates to U.S. ports, this opportunity might be attractive to smaller operators that want to expand their service markets.
It is estimated that 70 percent of the cargo on this route would be native to North America, so cost assumptions should include drayage to and from the marine terminal at both Ensenada and Los Angeles/Long Beach. If international cargo (export) or cargo destined by rail to the interior of the United States, the on-dock rail facilities in Los Angeles/Long Beach serve as a very positive aspect in terms of eliminating a local dray to a domestic rail yard.
Maximum revenue at 220 trailers per leg with 90 percent utilization would be 198 trailers per leg at six legs equaling 1,188 loads at $760 per unit or U.S. $902,880 per week.

West Coast Marine Highway Market Analysis
Attachment 4
Attachment 4-7
Table EN-1 Cost Factors Description Quantity Unit Cost Amount
Vessel Cost 7 days $7,200/day $50,400 Fuel: Steaming 2.5 days x 30 tons/day $650/ton $48,750 Fuel: In port 4.5 days x 12 tons/day $950/ton $51,300 Pilotage at San Pedro 6 trips $795/trip $4,770 Pilotage at Ensenada 6 trips $450/trip $2,700 Dockage at San Pedro 3 calls $2,046/call $6,140 Dockage at Ensenada 3 calls $3,990/call $11,970
Subtotal – Vessel $176,030 Variable Costs Port to Port
Stevedoring at San Pedro 1,188 Ro/Ro moves/week $150/move $178,200 Stevedoring at Ensenada 1,188 Ro/Ro moves/week $120/move $142,560 Wharfage at San Pedro 70% of cargo $62/move $51,600 Wharfage at Ensenada $14,300 HMT 1,188 loads $75/load $89,100
Subtotal - Variable Cost $475,760 Total – Port to Port $651,790
Note: San Pedro stevedoring for Ro/Ro vessels is lower than Lo/Lo costs
Gross profit before administration and drayage at 90 percent utilization is potentially $251,090
The cost of drayage will have a large effect on price competitiveness, especially in Mexico. Potential Ensenada hinterland cargo currently moves cross border over the road, and the distance from the port may render water transport uncompetitive. In addition, international “relay” cargo will require at least one transportation leg for ultimate delivery. As stated earlier in the study, the actual origin and destinations of cargoes are difficult to ascertain, so that information would not become available until the service started. In some cases the added drayage costs will not be a factor because the average trucking charges may be greater due to actual customer locations. In other cases, the location of the cargo may increase the drayage costs. Consequently, a drayage factor was added to the cost model in an attempt to equalize costs and develop a representative picture of the service economics. However, avoiding a truck border crossing is cost effective and enticing to virtually every drayage and IMC company that was interviewed.
Table EN-2 Truck Drayage to Equalize Costs Description Quantity Unit Cost Amount
Domestic dray: San Pedro 830 units $150 $124,500 Domestic dray: Ensenada 830 units $120 $99,600 International dray 358 units $135 $48,330 Total Drayage $272,430
Note: TBD- to be determined

West Coast Marine Highway Market Analysis
Attachment 4
Attachment 4-8
Conclusion
This is a potentially competitive route if a right-sized Ro/Ro vessel is available, and because this is an international route, there are likely a greater number of available vessels that meet the service’s needs. In addition to vessel capital and fueling costs, port costs represent about a third of the costs associated with this mid-length deployment. No allowances have been made for extraordinary gate operations which would likely be required in both San Pedro and Ensenada. These extended gates hours to accommodate domestic cargoes could add costs. The actual origin and destination locations of the cargo will also affect the drayage considerations noted in the analysis.
PART 2: Business Case Analysis
Investment Requirements
As this is an international shipping route, the service operator should be able to procure a right-sized vessel at a competitive price. New builds need not be considered at this point in time.
An operator of this service would primarily require sufficient funds or credit to satisfy a vessel charterer and fuel broker. Sufficient funds for sustaining the business through the critical start-up period as noted below would also be required.
Financial Analysis
A ten-year financial cash flow analysis was run to test the financial performance of this route. This financial analysis is based on the following operating assumptions:
• The service is assumed to operate via a load line Ro/Ro vessel that has a capacity of approximately 220 containers or trailers at full utilization as developed in Part 3, and
• The service operates six one-way voyages per week. Calculations are made for operating over 50 weeks per year.
Financial calculations are supported by the following assumptions:
• Service pricing is pegged at 80 percent of the prevailing competitive truck rate. This base rate increases in step increments by three percent at three year intervals (years 3, 6 and 9),
• Pricing (revenues) and expenses escalate at two percent per year, and
• The service experiences market acceptance as follows:
o 1st year – operations run at 50 percent of vessel capacity,
o 2nd year- operations run at 70 percent of vessel capacity, and
o 3rd year through the 10th year – operations run at 95 percent of vessel capacity.
West Coast Marine Highway Market Analysis
Attachment 4
Attachment 4-9
Two financial scenarios were developed, one (base case model) which assumes all expenses as understood today with no discounting (per Part 3), and the second, (all-in model) which assumes reductions in base cost for stevedoring, dockage, and wharfage.
In both cases the model assumes start-up costs equaling $650,000 over two years to prepare the business for full-scale operations. These costs are conservative, as personnel would need to be employed in advance of any commencement of sailing and most importantly, operating, control and financial systems would need to be purchased and/or prepared prior to implementation. Additionally funds would need to be available to pay for initial vessel charter and fuel costs. Importantly, a detailed marketing study with corresponding business targets, along with a sales and advertising plan will be required prior to commitment to start-up.

West Coast Marine Highway Market Analysis
Attachment 4
Attachment 4-10
Table EN-3 Base Case Model
S/U Year 1
S/U Year 2 Year 1 Year 2 Year 3 Year 4 Year 5 Year 6 Year 7 Year 8 Year 9 Year 10
Revenue Factors Load Efficiency 0% 0% 50% 70% 95% 95% 95% 95% 95% 95% 95% 95% Service Pricing per unit 0 0 760 775 814 831 847 890 908 926 973 992 Truck Pricing per unit 0 0 950 969 988 1008 1028 1049 1070 1091 1113 1135 Rail Pricing per box Service Price Advantage ($/unit) 0 0 190 194 174 177 181 159 162 165 140 143
Service Price Advantage (%) 0 0 20% 20% 18% 18% 18% 15% 15% 15% 13% 13%
Operating Revenue From TEU 0 0 25,080,000 35,814,240 51,064,455 52,085,744 53,127,459 55,815,708 56,932,023 58,070,663 61,009,039 62,229,219 From Non-TEU 0 0 0 0 0 0 0 0 0 0 0 0 Total Annual Revenue 0 0 25,080,000 35,814,240 51,064,455 52,085,744 53,127,459 55,815,708 56,932,023 58,070,663 61,009,039 62,229,219 Operating Expense 150,000 500,000 29,012,880 36,640,032 46,173,972 47,097,451 48,039,400 49,000,188 49,980,192 50,979,796 51,999,392 53,039,380
EBITDA Annual -150,000
-500,000 -3,932,880 -825,792 4,890,483 4,988,293 5,088,059 6,815,520 6,951,830 7,090,867 9,009,647 9,189,840
EBITDA Cumulative -650,000 -4,582,880 -5,408,672 -518,189 4,470,104 9,558,162 16,373,682 23,325,513 30,416,380 39,426,026 48,615,866
EBITDA Margin (annual) -15.68% -2.31% 9.58% 9.58% 9.58% 12.21% 12.21% 12.21% 14.77% 14.77%
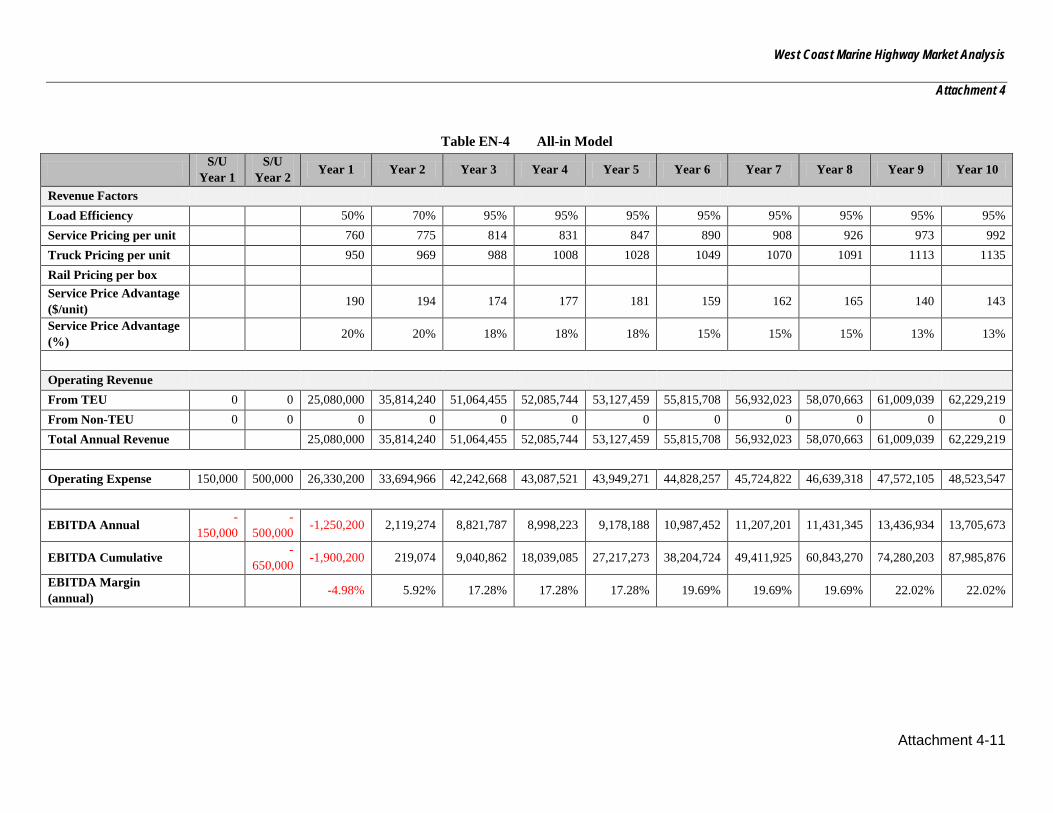
West Coast Marine Highway Market Analysis
Attachment 4
Attachment 4-11
Table EN-4 All-in Model
S/U Year 1
S/U Year 2 Year 1 Year 2 Year 3 Year 4 Year 5 Year 6 Year 7 Year 8 Year 9 Year 10
Revenue Factors Load Efficiency 50% 70% 95% 95% 95% 95% 95% 95% 95% 95% Service Pricing per unit 760 775 814 831 847 890 908 926 973 992 Truck Pricing per unit 950 969 988 1008 1028 1049 1070 1091 1113 1135 Rail Pricing per box Service Price Advantage ($/unit) 190 194 174 177 181 159 162 165 140 143
Service Price Advantage (%) 20% 20% 18% 18% 18% 15% 15% 15% 13% 13%
Operating Revenue From TEU 0 0 25,080,000 35,814,240 51,064,455 52,085,744 53,127,459 55,815,708 56,932,023 58,070,663 61,009,039 62,229,219 From Non-TEU 0 0 0 0 0 0 0 0 0 0 0 0 Total Annual Revenue 25,080,000 35,814,240 51,064,455 52,085,744 53,127,459 55,815,708 56,932,023 58,070,663 61,009,039 62,229,219 Operating Expense 150,000 500,000 26,330,200 33,694,966 42,242,668 43,087,521 43,949,271 44,828,257 45,724,822 46,639,318 47,572,105 48,523,547
EBITDA Annual -150,000
-500,000 -1,250,200 2,119,274 8,821,787 8,998,223 9,178,188 10,987,452 11,207,201 11,431,345 13,436,934 13,705,673
EBITDA Cumulative -650,000 -1,900,200 219,074 9,040,862 18,039,085 27,217,273 38,204,724 49,411,925 60,843,270 74,280,203 87,985,876
EBITDA Margin (annual) -4.98% 5.92% 17.28% 17.28% 17.28% 19.69% 19.69% 19.69% 22.02% 22.02%
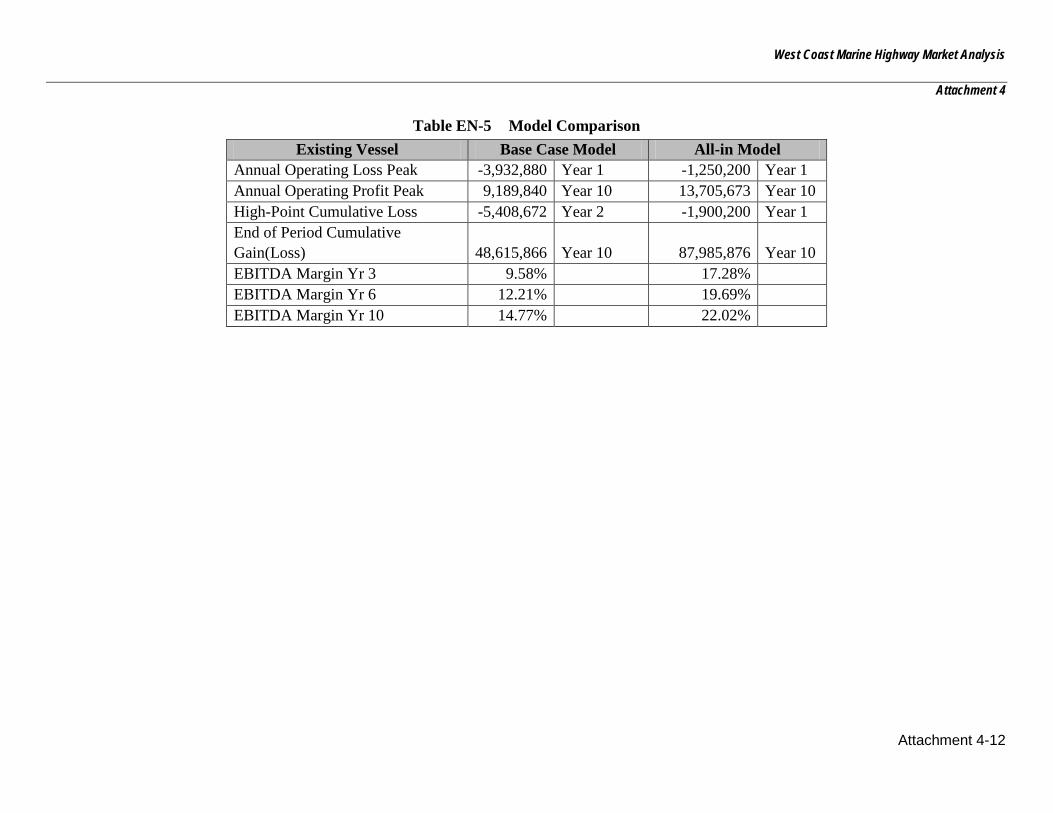
West Coast Marine Highway Market Analysis
Attachment 4
Attachment 4-12
Table EN-5 Model Comparison Existing Vessel Base Case Model All-in Model
Annual Operating Loss Peak -3,932,880 Year 1 -1,250,200 Year 1 Annual Operating Profit Peak 9,189,840 Year 10 13,705,673 Year 10 High-Point Cumulative Loss -5,408,672 Year 2 -1,900,200 Year 1 End of Period Cumulative Gain(Loss) 48,615,866 Year 10 87,985,876 Year 10 EBITDA Margin Yr 3 9.58% 17.28% EBITDA Margin Yr 6 12.21% 19.69% EBITDA Margin Yr 10 14.77% 22.02%

West Coast Marine Highway Market Analysis
Attachment 4
Attachment 4-13
Performance Summary
In the “base case” scenario, this potential short sea service performs fairly well and only experiences a negative cash flow in the operating years one and two. The negative cash flow is attributable to low vessel capacity utilization rates (50 percent and 70 percent) as the market reacts to this new commercial offering. This scenario yields a cash flow margin over nine-and-a-half percent in the third year, and by the tenth year is projected to earn almost an annual operating return of almost 15 percent. The service’s profitability depends on it penetrating the market quickly to reach a 95 percent utilization rate by the end of its second year. While attainable, the 95 percent vessel utilization rate assumed in this analysis is somewhat optimistic. At-risk investors in such a business proposition would probably see this scenario as somewhat marginal until market acceptance was proven.
In the “all-in” scenario, the service reaches financial viability after one year of operations, and the cumulative positive cash flow grows to approximately 88 million dollars by the end of the tenth year of operations. With projected EBITDA cash margins exceeding 17 percent in the third year and escalating to over 22 percent by the tenth year, the service would likely be of greater interest to investors.
This short sea service is potentially viable because of the availability of right-sized vessels with high fuel efficiency. Service viability is also impacted by projected port costs, which represent about a third of the costs associated with this mid-length deployment.
This market analysis does not make allowances for the port gate and customs operations that will likely be required in both San Pedro and Ensenada, both of which could add costs. The actual origin and destination locations of the cargo will affect the drayage cost considerations as noted in the analysis. The anticipated new border crossing at Otay Mesa may pull some cargo out of this route, but the projected completion, now in the 2018 range, along with the Maquiladora cargo focus, should not present a major constraint to this corridor's viability.
Cost and Investment Issues
The vessel can be chartered in from the worldwide inventory and containers, trailers, and chassis can be leased where required. Depending on the sales model, this service could operate as a wholesaler selling space to IMCs, larger trucking companies and international liner operators for substituted service.
Consistently high vessel utilization rates and service net revenue per unit will impact long-term service viability. Another central issue will be customs and the ability to effectively develop responsive terminal operations at both ends of the service. A relatively sophisticated documentation system, linked real time to both United States and Mexican customs will be essential.
West Coast Marine Highway Market Analysis
Attachment 4
Attachment 4-14
PART 3: ENVIRONMENTAL ISSUES – SPECIFIC TO PORTS Port of Ensenada, Mexico The Environmental Quality Program PROFEPA at the Port of Ensenada establishes prevention, reduction, and mitigation of environmental risks and impacts to improve environmental performance throughout the Port area. The objective of the program is to obtain and/or maintain industry certification or compliance with environmental regulations of the Port Authority (Administración Portuaria Integral). The General List of Environmental Aspects (la Lista General de Aspectos Ambientales: API-SM-SGCA-F-16) contains updated information on the legal requirements, monitoring and surveillance procedures for the maintenance of hazardous substances and waste in the Port area and should be consulted to establish any issues associated with the proposed short sea service (Administración Portuararia Integral de Ensenada 2010). Additional information on the Port-specific environmental issues is provided below.
Biological Resources
The Official Mexican Standards (Normas Oficiales Mexicanas) facilitates the implementation of the Fisheries Law (Ley de Pesca, 1992, as emended in 2001) and establishes specific measures and standards required by law administered by the Secretariat of Agriculture, Livestock, Rural Development, Fisheries and Food (Secretaría de Agricultura, Ganadaría, Desarrollo Rural, Pesca y Alimentación [SAGARPA]) (FAO 2011). The proposed short sea service must consult the SAGARPA to determine any impacts to species within the Port area.
Air Quality
Attempts are being made by the National Air Program (Programa Nacional del Aire) to extend air quality programs throughout all of Mexico. The PROFEPA is responsible for enforcing standards and regulations to discourage pollution and encourage cleaner technologies. The proposed short sea service should consult the PROFEPA to ensure coordination with all relevant air quality regulations in the Port of Ensenada area.
Water Resources
The National Water Commission (Comisión Nacional del Agua (CNA)) is an administrative unit of the SEMARNAT and oversees all regulatory programs associated with water resources in Mexico. The proposed short sea service should consult the CNA to ensure consideration with all regulations and relevant issues at the Port of Ensenada.
Ensenada – San Pedro Bay – Port Pair Analysis The proposed short sea service between Ensenada, Mexico and San Pedro Bay is represented in Figure EN1-1. The figure identifies the MPA located adjacent to the proposed route. The route is shown for illustration purposes only, and is not intended to represent the actual route.
West Coast Marine Highway Market Analysis
Attachment 4
Attachment 4-15
Biological Resources
The Bi-National Seabird Restoration Effort launched on the Baja California Pacific Islands establishes a United States-Mexico partnership to implement a program that will create and stabilize nesting grounds of seabirds in the islands along California and Mexico. The participating agencies in Mexico include the Grupo de Ecología y Conservación de Islas, and the Mexican Fund for the Conservation of Nature (USFWS 2011). Bird conservation efforts for the California Brown Pelican, Cassin’s Auklet, Ashy Storm-Petrel, and Xantus’s Murrelet will begin in January 2012 throughout the Coronado, Todos Santos, San Martín, San Jerónimo, Natividad, Asunción, and San Roque Islands (USFWS 2011). Birds and marine mammals located on the Coronado and Todos Santos Islands along the proposed route highlight a biological issue in terms of the risk of potential spills, noise, and visual disturbance.

West Coast Marine Highway Market Analysis
Attachment 4
Attachment 4-16
Figure EN-3 Ensenada to San Pedro Bay Route
Pacific Northwest – Canada

West Coast Marine Highway Market Analysis
Attachment 4
Attachment 4-17
Pacific Northwest – Canada – Operational Development / Port Pair Analysis
Figure PNC-1 presents a graphic of the predominant highway route for this port pair, as well as an illustration of the marine route.
Figure PNC-1 Pacific Northwest - Canada
Description of Opportunities
The traffic lanes between Seattle and Vancouver along the I-5 Interstate corridor may provide sufficient cargo opportunities to support a short sea shipping business, because of delay caused by traffic congestion on both sides of the border. The flows are somewhat complicated by the border crossing, although the United States/ Canada border is relatively benign and is a mature crossing.
Markets served:
Cross Border Cargo – Much of the cargo moving along the I-5 Corridor cargo is of mid-to-low value and is not necessarily time sensitive, but will be transport price sensitive (see Market Analysis, Part 2). The volumes of cross border cargo moving via truck Puget Sound and the Vancouver regions are substantial, totaling 2.5 million tons in 2007. Consequently, these cargos may be a candidate for slower short sea transportation if the parameters of cost, reliability, and frequency are appropriate to the cargo.

West Coast Marine Highway Market Analysis
Attachment 4
Attachment 4-18
Major Potential Commodities
Principal northbound commodity flows from the Seattle region to Canada are in:
• wood products,
• non-metallic mineral products, and
• base metals.
Primary southbound flows are concentrated in:
• wood products,
• newsprint/paper,
• paper products, and
• non-metallic mineral products.
Operational Parameters
• Surface Mode: The distance from Seattle to Vancouver, British Columbia, is about 160 miles. Distances from Tacoma are about 20 miles further. At 50 mph, trucks should be able to make the trip in about three to four hours. However, border crossing and congestion on both sides of the border normally extend this travel time, affecting trucking rates.
The railroads do not operate on this route.
• Vessel operations
o Sailing distance – 122 NM, all inside waters
o Both deck barges and load line vessels were considered. Vessel availability would depend on the ports served.
o Sailing times
Deck barges at six knots would require approximately 20 hours to complete a one way voyage.
Load Line (regardless of flag) at 20 knots would transit in six to seven hours considering docking times. At 14 knots the transit would be about nine hours.
• Service Frequency - Considering 12 hours in port at each terminal, potential services using deck barges and load line vessels would pro forma as follows:

West Coast Marine Highway Market Analysis
Attachment 4
Attachment 4-19
Table PNC-2 Pacific Northwest Schedule to Canada-Deck Barge Description Schedule Remarks
Sail Vancouver 1700 Mon Arrive Seattle 1300 Tue Commence stevedoring upon arrival Sail Seattle 2400 Tue Arrive Vancouver
2000 Wed Commence stevedoring 0700 Thursday
Sail Vancouver 1700 Thu Arrive Seattle 1300 Fri Sail Seattle 2400 Fri Arrive Vancouver
2000 Sat Partial stevedoring on weekend, finish Monday
This conveyance could accomplish two round voyages per week with catch up time to insure reliability
Table PNC-2 Pacific Northwest Schedule to Canada-Load Line at 14 knots Description Schedule Remarks
Sail Vancouver 1900 Mon Arrive Seattle 0500 Tue Commence stevedoring at 0700 Sail Seattle 1900 Tue Arrive Vancouver 0500 Wed Commence stevedoring at 0700
Sail Vancouver 1900 Wed Arrive Seattle 0500 Thu Sail Seattle 1900 Thu Arrive Vancouver 0500 Fri
Sail Vancouver 1900 Fri Arrive Seattle 0500 Sat Sail Seattle 1900 Sat Arrive Vancouver 0500 Sun Limited stevedoring Sunday, complete
Monday
This service would produce three round voyages per week, all with competitive departure and arrival times. There is also provision for "catch up” time on the weekend to help insure schedule integrity and deal with contingencies. An alternative would be a load line vessel at 20 knots. The fuel differential would likely not provide a positive deployment given the short distances. The 14 knot pro forma works well as fuel consumption is down and the vessel has back up speed to insure service reliability and consistency. However, with multiple calls, attracting sufficient cargo volumes is a concern and serious business consideration.
West Coast Marine Highway Market Analysis
Attachment 4
Attachment 4-20
Marine Terminal Operations
Seattle: The Port of Seattle has recently invested over $1.2 billion to upgrade their four container terminal facilities, which cover 500+ acres, and supporting road infrastructure. The port is supported by both the UP and the Burlington Northern Santa Fe Railroad (BNSF) with near dock facilities. The APL Terminal (T5) has on-dock rail. Being located in the southern part of downtown Seattle, even with the new road infrastructure (which includes rail separation), congestion results in higher than “normal” drayage costs. The Port also has the Alaskan Hydro-barge service and other barge related services that could possibly handle domestic Marine Highway traffic to other than Alaskan destinations, if a route were deemed commercially viable and ultimately profitable.
Tacoma: The Port of Tacoma has seven major container terminals and one Ro/Ro terminal (TOTE) with the opportunity to develop several other terminals within the Tacoma tideflats area. The port is north of the downtown area and has direct access to I-5 and other state highways. The Port of Tacoma is support by four on-dock intermodal yards. The South Yard, although technically a near-dock facility has the ability to operate as an on-dock facility for the APM Terminal. In addition, UP is using the South Yard as their primary domestic intermodal terminal allowing the Argo Yard in Seattle to support the Port of Seattle’s growing intermodal business (UP mainly hauls for APL and needs support tracks for the T5 on-dock intermodal yard).
The TOTE Terminal handles Ro/Ro for Alaska but could very easily become a Marine Highway or short sea service terminal. However, at present, TOTE does not have lift-on, lift-off capability without the use of a mobile harbor crane.
The Port of Tacoma and Washington State have started planning and preliminary environmental work for State Route 167, a major State Highway that would lead directly from the Port to the Auburn/Kent/Sumer Valley. This highway would increase the drayage capability and be a key development in a Marine Highway or short sea service strategy.
Vancouver, British Columbia: Vancouver is Canada’s largest container terminal complex with three container terminals, two within the downtown area and Deltaport, several miles to the south of the downtown. Refer to the figure below for an aerial view of the port complex.
The two downtown terminals (Vanterm and Centerm) are landlocked and very compacted. They are both served by the Canadian Pacific (CP) and the Canadian railways in a semi-automated operation. These two terminals are not considered candidates for any short sea shipping given their current congestion and location. Deltaport is currently a 1.5 million TEU terminals with plans to grow to 2.4 million TEUs with on-dock rail and support infrastructure in place or being developed within the next 3-5 years. The Port is also starting development of a second Terminal at Deltaport with additional on-dock rail capabilities that would handle an additional 2.4 million TEU’s. The second terminal is being considered to also handle short sea shipping at two berths.
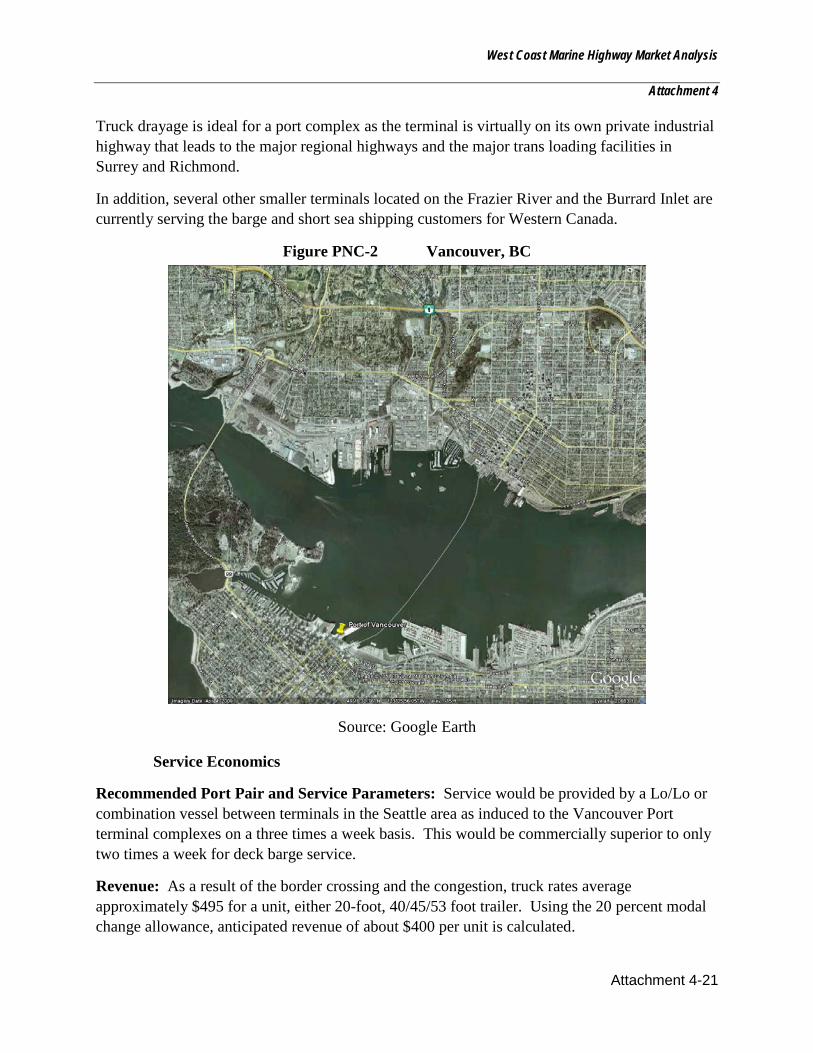
West Coast Marine Highway Market Analysis
Attachment 4
Attachment 4-21
Truck drayage is ideal for a port complex as the terminal is virtually on its own private industrial highway that leads to the major regional highways and the major trans loading facilities in Surrey and Richmond.
In addition, several other smaller terminals located on the Frazier River and the Burrard Inlet are currently serving the barge and short sea shipping customers for Western Canada.
Figure PNC-2 Vancouver, BC
Source: Google Earth
Service Economics
Recommended Port Pair and Service Parameters: Service would be provided by a Lo/Lo or combination vessel between terminals in the Seattle area as induced to the Vancouver Port terminal complexes on a three times a week basis. This would be commercially superior to only two times a week for deck barge service.
Revenue: As a result of the border crossing and the congestion, truck rates average approximately $495 for a unit, either 20-foot, 40/45/53 foot trailer. Using the 20 percent modal change allowance, anticipated revenue of about $400 per unit is calculated.

West Coast Marine Highway Market Analysis
Attachment 4
Attachment 4-22
Allowing for a load line vessel with a capacity of about 300 FEUs in each direction, gross revenue over a week would be a maximum of 1,800 FEUs at $400 per unit, or $720,000 gross revenue per week.
Because a 100 percent vessel utilization rate is likely unattainable, this analysis uses a vessel utilization rate of 80 to 90 percent.
International feeder cargoes already at the marine facilities will likely form the base cargo for such a feeder operation. These feeder services enable ocean-vessel operators to restrict the number of calls their larger, more costly “mother” vessels make along the West Coast of North America. This cargo will then be supplemented with cargo moving from the PNW region, near the port area to Vancouver or areas in the region reasonably close to the port complex.
Unless a combination Ro/Ro-Lo/Lo vessel is utilized, transporting cargoes loaded into 53-foot (U.S. domestic) trailers will be a challenge. These cargoes will need to find CSC approved 53-foot assets to load aboard the vessels. If a Ro/Ro or combination vessel is utilized, there is greater trailering asset flexibility. The study team assumed that the cost for a foreign flag combination vessel, if available, would be essentially the same as a foreign container vessel.
Expense: The following is a comparison of costs by conveyance-type, reviewed at current conditions:
Table PNC-3 Vessel Costs
Vessel Capacity Speed I/P Cost/Day
U/W Cost/Day
Deck Barge 600 TEU/300FEU 6 $7,200
Load line Domestic 300 FEU 14 $25,000 $51,000 Freight Forwarders LO/LO 300 FEU’s 14 $7,200 $19,000
Table PNC-4 Cost Factors
Description Quantity Unit Cost Amount Vessel Cost 7 days $7,200/day $50,400 Fuel: Steaming 3 days x 30 tons/day $650/ton $58,500 Fuel: In port 4 days x 12 tons/day $950/ton $45,600 Pilotage at PNW: 6 trips $1,000/trip $6,000 Pilotage at Vancouver 6 trips $1,000/trip $6,000 Dockage at PNW: 3 calls $3,900/call $11,700 Dockage at Vancouver 3 calls $2,000/call $6,000
Subtotal – Vessel $184,200 Variable Costs Port to Port

West Coast Marine Highway Market Analysis
Attachment 4
Attachment 4-23
Stevedoring at PNW: 1,800 moves/week $180/move $324,000 Stevedoring at Vancouver: 1,800 moves/week $150/move $270,000 Wharfage at PNW: 1,800 loads $62/load $111,600 Wharfage at Vancouver 1,800 loads $50/load $90,000 HMT 1,800 loads $75/load $135,000 Subtotal - Variable Cost $930,600
Total – Port to Port $1,114,800
Conclusion
Recommended Port Pair and Service Parameters: This international service would be provided by foreign flagged Lo/Lo or combination vessel between terminals in Puget Sound as induced to the Vancouver Port's terminal complexes on a three times per week basis. This would be superior to twice weekly service on a deck barge. Since this is an international run, foreign flagged vessels could be used.
This port pair could potentially be coupled to an Oakland or San Pedro port call. However, the service at that point becomes a domestic service, which creates additional vessel availability considerations.
Even with greater vessel availability and the application of relatively less-restrictive international shipping regulations, this service does not appear viable. The relatively short truck route with resulting low revenue coupled with the stevedoring costs create a business loss even before administrative costs or additional drayage expenses the cargo needs to bear to move between the marine terminal and the final destination. Further, the assumption of a 100 percent vessel utilization rate is an impossible target which overstates the revenue. Considered more simply, the combination of wharfage and stevedoring at PNW and Vancouver Port exceeds the revenue attainable per unit of cargo moved.
Pacific Northwest – Canada – Port Pair environmental issues The proposed short sea service between the Pacific Northwest and Vancouver, British Colombia, Canada is represented in Figure 5-8. The figure identifies the MPAs, marine sanctuaries, and critical habitat located along the proposed route. The route is shown for illustration purposes only, and is not intended to represent the actual route.
Air Quality
The Northern American ECA as described in Section 5.2.4, will be implemented in 2012 which requires fuel be switched to the low-sulfur fuel within 200 NM of the Pacific Coast coastline. The Ports of Seattle, Tacoma, and PMV have already taken a proactive approach by reducing hazardous air emissions through the Northwest Ports Clean Air Strategy (see Section 5.5.3). The short sea service would be required to adhere to the requirements of the Northern American ECA
West Coast Marine Highway Market Analysis
Attachment 4
Attachment 4-24
as well as proactive reduction approaches currently performed in the PNW ports if these routes are considered.
Biological Resources
MPAs are located within or immediately adjacent to the proposed route. Critical habitat is designated within or immediately adjacent to the proposed route path for the Southern Resident killer whale and Puget Sound Chinook salmon. Consultation with NMFS under USESA and MMPA may be warranted should this route be considered. Species managed by Fisheries and Oceans Canada should be verified if they occur along this route.
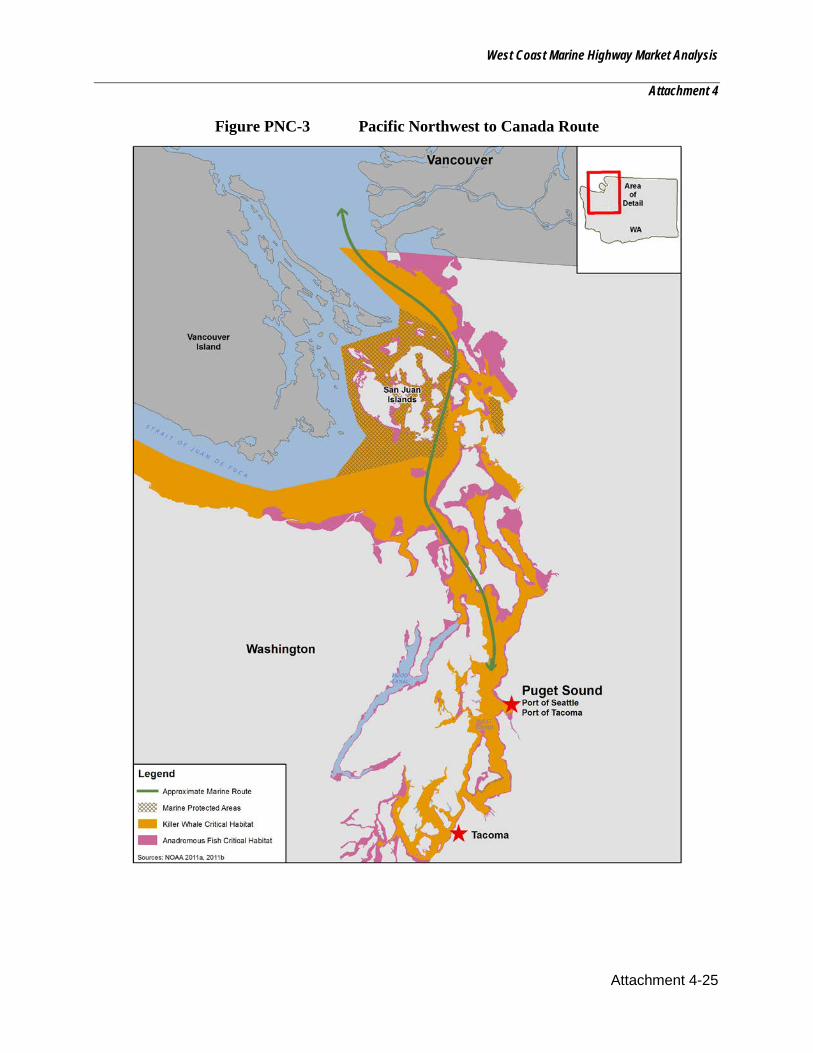
West Coast Marine Highway Market Analysis
Attachment 4
Attachment 4-25
Figure PNC-3 Pacific Northwest to Canada Route