Embed Size (px)
Citation preview
- 1 -
WesCan Energy Corp. STATEMENT OF RESERVES DATA
AND OTHER OIL AND GAS INFORMATION (Form 51-101F1)
Part 1 – Date of Statement
This statement of reserves data and other oil and gas information is dated July 3, 2014
The effective date is March 31, 2014
The preparation date is July 3, 2014
- 2 -
Part 2 – Disclosure of Reserves Data
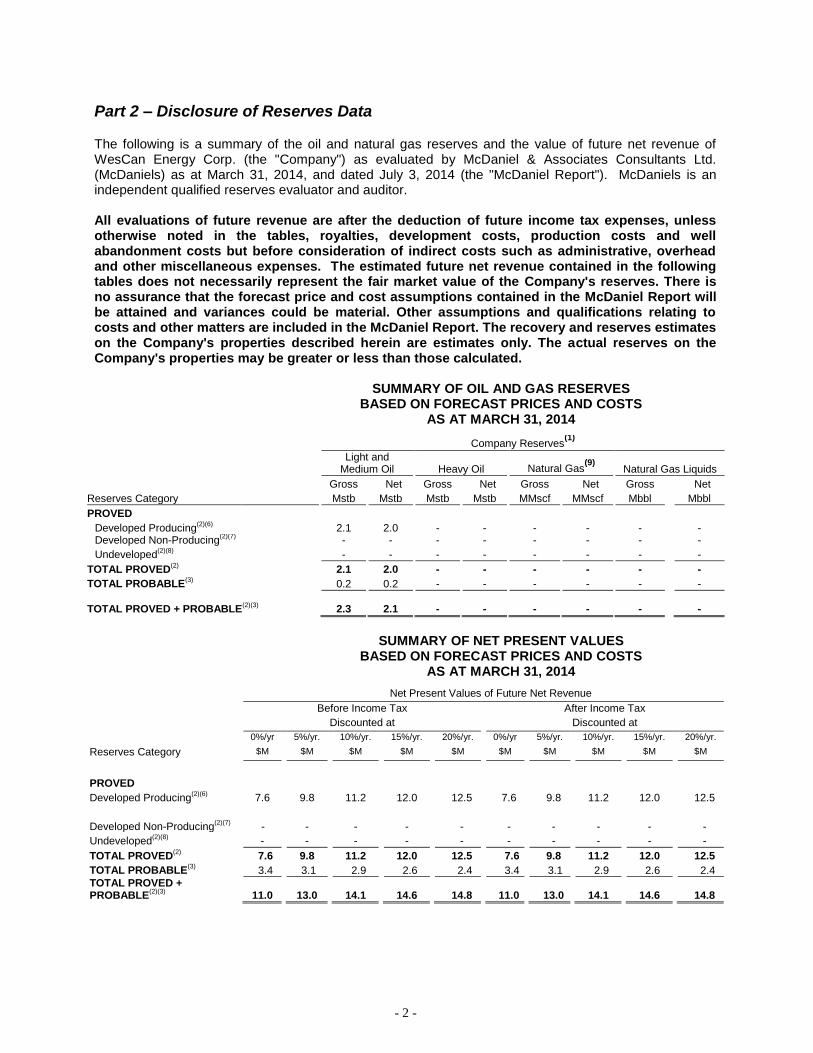
The following is a summary of the oil and natural gas reserves and the value of future net revenue of WesCan Energy Corp. (the "Company") as evaluated by McDaniel & Associates Consultants Ltd. (McDaniels) as at March 31, 2014, and dated July 3, 2014 (the "McDaniel Report"). McDaniels is an independent qualified reserves evaluator and auditor. All evaluations of future revenue are after the deduction of future income tax expenses, unless otherwise noted in the tables, royalties, development costs, production costs and well abandonment costs but before consideration of indirect costs such as administrative, overhead and other miscellaneous expenses. The estimated future net revenue contained in the following tables does not necessarily represent the fair market value of the Company's reserves. There is no assurance that the forecast price and cost assumptions contained in the McDaniel Report will be attained and variances could be material. Other assumptions and qualifications relating to costs and other matters are included in the McDaniel Report. The recovery and reserves estimates on the Company's properties described herein are estimates only. The actual reserves on the Company's properties may be greater or less than those calculated.
SUMMARY OF OIL AND GAS RESERVES BASED ON FORECAST PRICES AND COSTS
AS AT MARCH 31, 2014
Company Reserves(1)
Light and
Medium Oil Heavy Oil Natural Gas(9)
Natural Gas Liquids
Gross Net Gross Net Gross Net Gross Net
Reserves Category Mstb Mstb Mstb Mstb MMscf MMscf Mbbl Mbbl
PROVED
Developed Producing(2)(6)
2.1 2.0 - - - - - - Developed Non-Producing
(2)(7) - - - - - - - -
Undeveloped(2)(8)
- - - - - - - -
TOTAL PROVED(2)
2.1 2.0 - - - - - -
TOTAL PROBABLE(3)
0.2 0.2 - - - - - -
TOTAL PROVED + PROBABLE
(2)(3) 2.3 2.1 - - - - - -
SUMMARY OF NET PRESENT VALUES BASED ON FORECAST PRICES AND COSTS
AS AT MARCH 31, 2014
Net Present Values of Future Net Revenue
Before Income Tax After Income Tax
Discounted at Discounted at
0%/yr 5%/yr. 10%/yr. 15%/yr. 20%/yr. 0%/yr 5%/yr. 10%/yr. 15%/yr. 20%/yr.
Reserves Category $M $M $M $M $M $M $M $M $M $M
PROVED
Developed Producing(2)(6)
7.6 9.8 11.2 12.0 12.5 7.6 9.8 11.2 12.0 12.5
Developed Non-Producing(2)(7)
- - - - - - - - - -
Undeveloped(2)(8)
- - - - - - - - - -
TOTAL PROVED(2)
7.6 9.8 11.2 12.0 12.5 7.6 9.8 11.2 12.0 12.5
TOTAL PROBABLE(3)
3.4 3.1 2.9 2.6 2.4 3.4 3.1 2.9 2.6 2.4
TOTAL PROVED + PROBABLE
(2)(3)
11.0
13.0
14.1
14.6
14.8
11.0
13.0
14.1
14.6
14.8
- 3 -
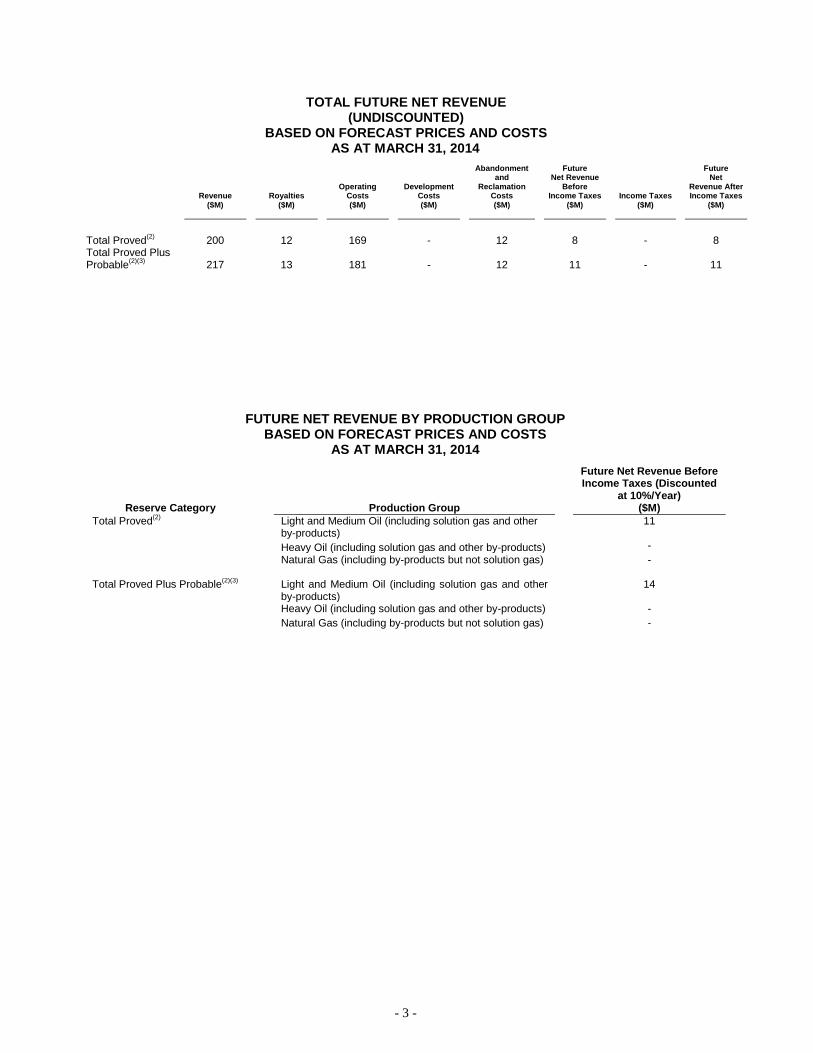
TOTAL FUTURE NET REVENUE (UNDISCOUNTED)
BASED ON FORECAST PRICES AND COSTS AS AT MARCH 31, 2014
Revenue ($M)
Royalties ($M)
Operating Costs ($M)
Development Costs ($M)
Abandonment and
Reclamation Costs ($M)
Future Net Revenue
Before Income Taxes
($M)
Income Taxes ($M)
Future Net
Revenue After Income Taxes
($M)
Total Proved(2)
200 12 169 - 12 8 - 8 Total Proved Plus Probable
(2)(3)
217 13 181 - 12 11 - 11
FUTURE NET REVENUE BY PRODUCTION GROUP BASED ON FORECAST PRICES AND COSTS
AS AT MARCH 31, 2014
Reserve Category
Production Group
Future Net Revenue Before Income Taxes (Discounted
at 10%/Year) ($M)
Total Proved(2)
Light and Medium Oil (including solution gas and other by-products)
11
Heavy Oil (including solution gas and other by-products) -
Natural Gas (including by-products but not solution gas)
-
Total Proved Plus Probable(2)(3)
Light and Medium Oil (including solution gas and other by-products)
14
Heavy Oil (including solution gas and other by-products) -
Natural Gas (including by-products but not solution gas)
-
- 4 -
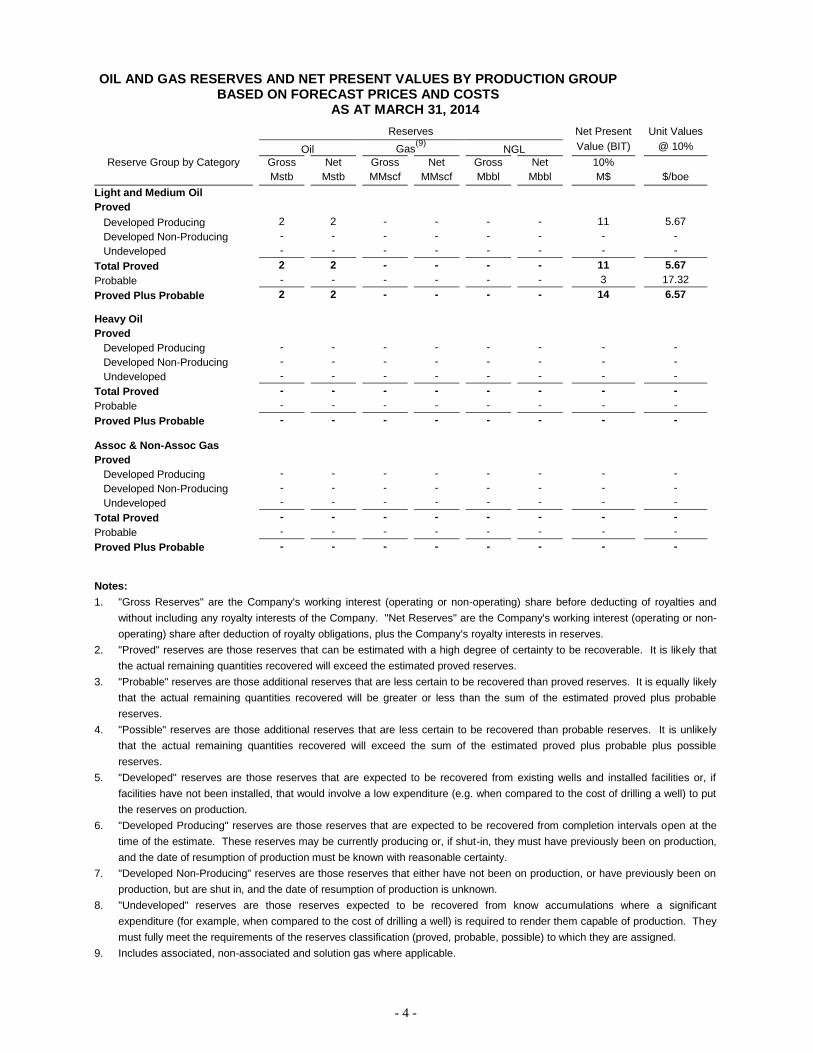
OIL AND GAS RESERVES AND NET PRESENT VALUES BY PRODUCTION GROUP BASED ON FORECAST PRICES AND COSTS
AS AT MARCH 31, 2014
Reserves Net Present Unit Values
Oil Gas(9)
NGL Value (BIT) @ 10%
Reserve Group by Category Gross Net Gross Net Gross Net 10%
Mstb Mstb MMscf MMscf Mbbl Mbbl M$ $/boe
Light and Medium Oil
Proved
Developed Producing 2 2 - - - - 11 5.67
Developed Non-Producing - - - - - - - -
Undeveloped - - - - - - - -
Total Proved 2 2 - - - - 11 5.67
Probable - - - - - - 3 17.32
Proved Plus Probable 2 2 - - - - 14 6.57
Heavy Oil
Proved
Developed Producing - - - - - - - -
Developed Non-Producing - - - - - - - -
Undeveloped - - - - - - - -
Total Proved - - - - - - - -
Probable - - - - - - - -
Proved Plus Probable - - - - - - - -
Assoc & Non-Assoc Gas
Proved
Developed Producing - - - - - - - -
Developed Non-Producing - - - - - - - -
Undeveloped - - - - - - - -
Total Proved - - - - - - - -
Probable - - - - - - - -
Proved Plus Probable - - - - - - - -
Notes:
1. "Gross Reserves" are the Company's working interest (operating or non-operating) share before deducting of royalties and
without including any royalty interests of the Company. "Net Reserves" are the Company's working interest (operating or non-
operating) share after deduction of royalty obligations, plus the Company's royalty interests in reserves.
2. "Proved" reserves are those reserves that can be estimated with a high degree of certainty to be recoverable. It is likely that
the actual remaining quantities recovered will exceed the estimated proved reserves.
3. "Probable" reserves are those additional reserves that are less certain to be recovered than proved reserves. It is equally likely
that the actual remaining quantities recovered will be greater or less than the sum of the estimated proved plus probable
reserves.
4. "Possible" reserves are those additional reserves that are less certain to be recovered than probable reserves. It is unlikely
that the actual remaining quantities recovered will exceed the sum of the estimated proved plus probable plus possible
reserves.
5. "Developed" reserves are those reserves that are expected to be recovered from existing wells and installed facilities or, if
facilities have not been installed, that would involve a low expenditure (e.g. when compared to the cost of drilling a well) to put
the reserves on production.
6. "Developed Producing" reserves are those reserves that are expected to be recovered from completion intervals open at the
time of the estimate. These reserves may be currently producing or, if shut-in, they must have previously been on production,
and the date of resumption of production must be known with reasonable certainty.
7. "Developed Non-Producing" reserves are those reserves that either have not been on production, or have previously been on
production, but are shut in, and the date of resumption of production is unknown.
8. "Undeveloped" reserves are those reserves expected to be recovered from know accumulations where a significant
expenditure (for example, when compared to the cost of drilling a well) is required to render them capable of production. They
must fully meet the requirements of the reserves classification (proved, probable, possible) to which they are assigned.
9. Includes associated, non-associated and solution gas where applicable.
- 5 -
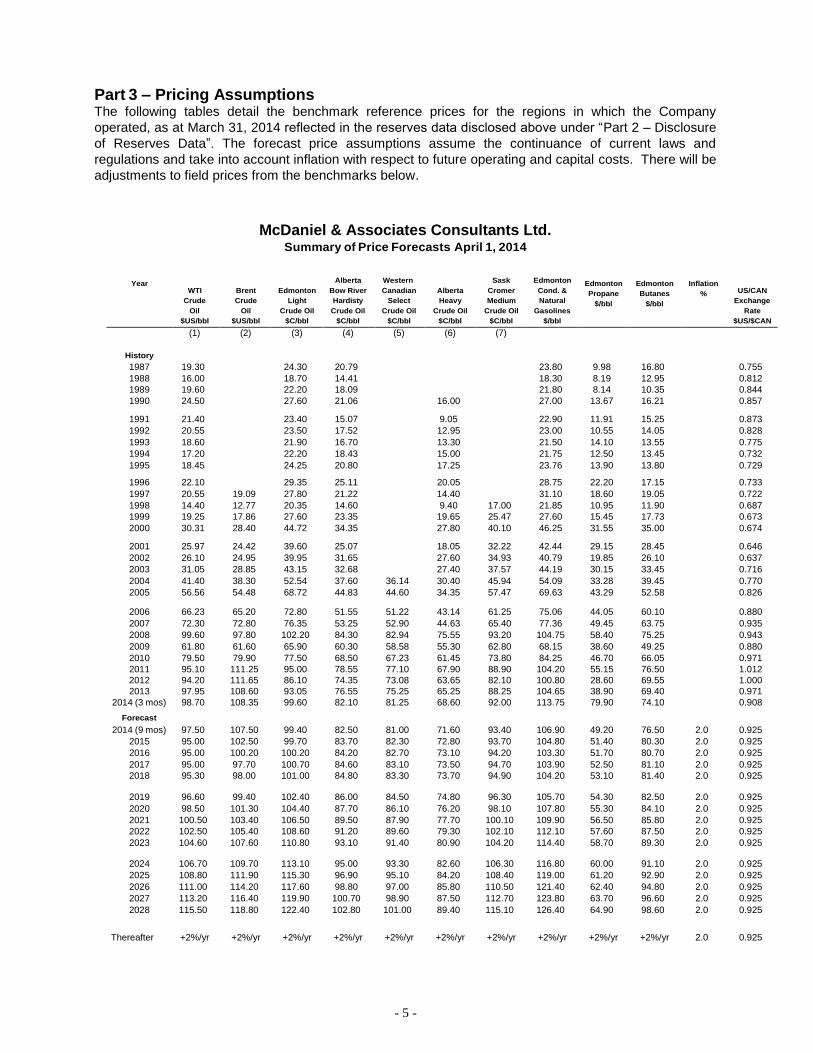
Part 3 – Pricing Assumptions
The following tables detail the benchmark reference prices for the regions in which the Company
operated, as at March 31, 2014 reflected in the reserves data disclosed above under “Part 2 – Disclosure
of Reserves Data”. The forecast price assumptions assume the continuance of current laws and
regulations and take into account inflation with respect to future operating and capital costs. There will be
adjustments to field prices from the benchmarks below.
McDaniel & Associates Consultants Ltd. Summary of Price Forecasts April 1, 2014
Year
WTI
Crude
Oil
$US/bbl
Brent
Crude
Oil
$US/bbl
Edmonton
Light
Crude Oil
$C/bbl
Alberta
Bow River
Hardisty
Crude Oil
$C/bbl
Western
Canadian
Select
Crude Oil
$C/bbl
Alberta
Heavy
Crude Oil
$C/bbl
Sask
Cromer
Medium
Crude Oil
$C/bbl
Edmonton
Cond. &
Natural
Gasolines
$/bbl
Edmonton
Propane
$/bbl
Edmonton
Butanes
$/bbl
Inflation
%
US/CAN
Exchange
Rate
$US/$CAN
(1) (2) (3) (4) (5) (6) (7) History 1987 19.30 24.30 20.79 23.80 9.98 16.80 0.755 1988 16.00 18.70 14.41 18.30 8.19 12.95 0.812 1989 19.60 22.20 18.09 21.80 8.14 10.35 0.844 1990 24.50 27.60 21.06 16.00 27.00 13.67 16.21 0.857
1991 21.40 23.40 15.07 9.05 22.90 11.91 15.25 0.873 1992 20.55 23.50 17.52 12.95 23.00 10.55 14.05 0.828 1993 18.60 21.90 16.70 13.30 21.50 14.10 13.55 0.775 1994 17.20 22.20 18.43 15.00 21.75 12.50 13.45 0.732 1995 18.45 24.25 20.80 17.25 23.76 13.90 13.80 0.729 1996 22.10 29.35 25.11 20.05 28.75 22.20 17.15 0.733 1997 20.55 19.09 27.80 21.22 14.40 31.10 18.60 19.05 0.722 1998 14.40 12.77 20.35 14.60 9.40 17.00 21.85 10.95 11.90 0.687 1999 19.25 17.86 27.60 23.35 19.65 25.47 27.60 15.45 17.73 0.673 2000 30.31 28.40 44.72 34.35 27.80 40.10 46.25 31.55 35.00 0.674
2001 25.97 24.42 39.60 25.07 18.05 32.22 42.44 29.15 28.45 0.646 2002 26.10 24.95 39.95 31.65 27.60 34.93 40.79 19.85 26.10 0.637 2003 31.05 28.85 43.15 32.68 27.40 37.57 44.19 30.15 33.45 0.716 2004 41.40 38.30 52.54 37.60 36.14 30.40 45.94 54.09 33.28 39.45 0.770 2005 56.56 54.48 68.72 44.83 44.60 34.35 57.47 69.63 43.29 52.58 0.826
2006 66.23 65.20 72.80 51.55 51.22 43.14 61.25 75.06 44.05 60.10 0.880 2007 72.30 72.80 76.35 53.25 52.90 44.63 65.40 77.36 49.45 63.75 0.935 2008 99.60 97.80 102.20 84.30 82.94 75.55 93.20 104.75 58.40 75.25 0.943 2009 61.80 61.60 65.90 60.30 58.58 55.30 62.80 68.15 38.60 49.25 0.880 2010 79.50 79.90 77.50 68.50 67.23 61.45 73.80 84.25 46.70 66.05 0.971 2011 95.10 111.25 95.00 78.55 77.10 67.90 88.90 104.20 55.15 76.50 1.012 2012 94.20 111.65 86.10 74.35 73.08 63.65 82.10 100.80 28.60 69.55 1.000 2013 97.95 108.60 93.05 76.55 75.25 65.25 88.25 104.65 38.90 69.40 0.971
2014 (3 mos) 98.70 108.35 99.60 82.10 81.25 68.60 92.00 113.75 79.90 74.10 0.908 Forecast
2014 (9 mos) 97.50 107.50 99.40 82.50 81.00 71.60 93.40 106.90 49.20 76.50 2.0 0.925 2015 95.00 102.50 99.70 83.70 82.30 72.80 93.70 104.80 51.40 80.30 2.0 0.925 2016 95.00 100.20 100.20 84.20 82.70 73.10 94.20 103.30 51.70 80.70 2.0 0.925 2017 95.00 97.70 100.70 84.60 83.10 73.50 94.70 103.90 52.50 81.10 2.0 0.925 2018 95.30 98.00 101.00 84.80 83.30 73.70 94.90 104.20 53.10 81.40 2.0 0.925
2019 96.60 99.40 102.40 86.00 84.50 74.80 96.30 105.70 54.30 82.50 2.0 0.925 2020 98.50 101.30 104.40 87.70 86.10 76.20 98.10 107.80 55.30 84.10 2.0 0.925 2021 100.50 103.40 106.50 89.50 87.90 77.70 100.10 109.90 56.50 85.80 2.0 0.925 2022 102.50 105.40 108.60 91.20 89.60 79.30 102.10 112.10 57.60 87.50 2.0 0.925 2023 104.60 107.60 110.80 93.10 91.40 80.90 104.20 114.40 58.70 89.30 2.0 0.925
2024 106.70 109.70 113.10 95.00 93.30 82.60 106.30 116.80 60.00 91.10 2.0 0.925 2025 108.80 111.90 115.30 96.90 95.10 84.20 108.40 119.00 61.20 92.90 2.0 0.925 2026 111.00 114.20 117.60 98.80 97.00 85.80 110.50 121.40 62.40 94.80 2.0 0.925 2027 113.20 116.40 119.90 100.70 98.90 87.50 112.70 123.80 63.70 96.60 2.0 0.925 2028 115.50 118.80 122.40 102.80 101.00 89.40 115.10 126.40 64.90 98.60 2.0 0.925
Thereafter +2%/yr +2%/yr +2%/yr +2%/yr +2%/yr +2%/yr +2%/yr +2%/yr +2%/yr +2%/yr 2.0 0.925
- 6 -
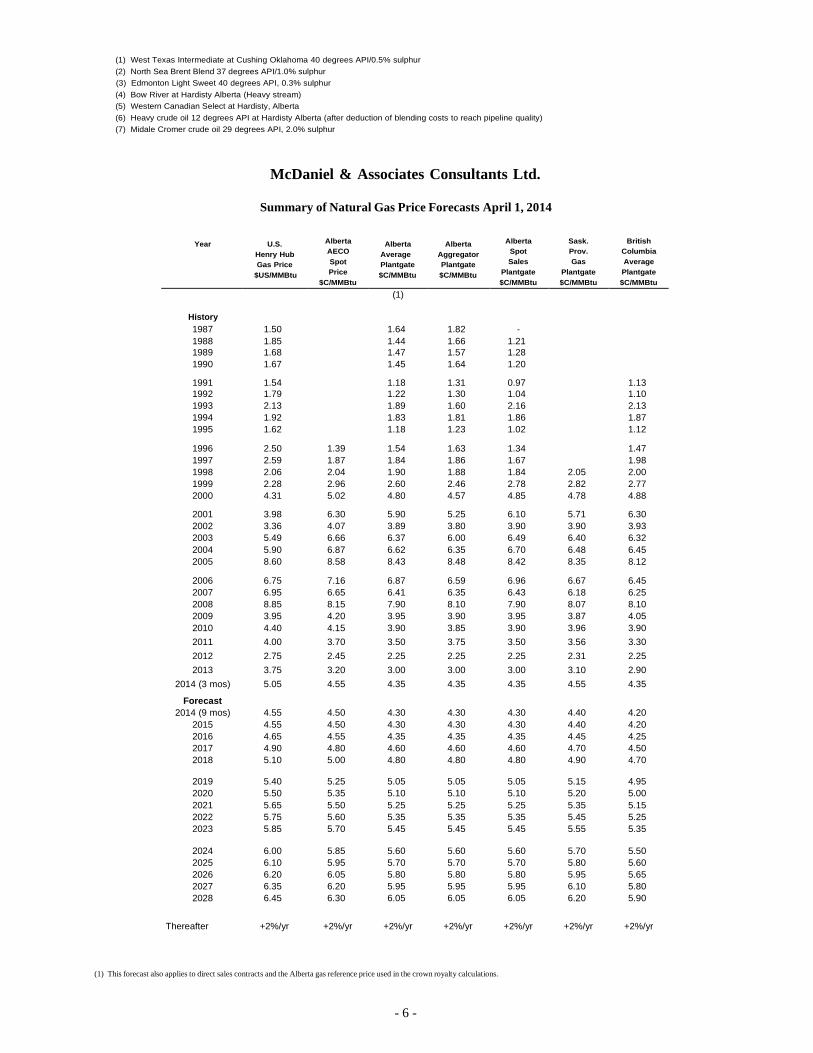
(1) West Texas Intermediate at Cushing Oklahoma 40 degrees API/0.5% sulphur
(2) North Sea Brent Blend 37 degrees API/1.0% sulphur
(3) Edmonton Light Sweet 40 degrees API, 0.3% sulphur
(4) Bow River at Hardisty Alberta (Heavy stream)
(5) Western Canadian Select at Hardisty, Alberta
(6) Heavy crude oil 12 degrees API at Hardisty Alberta (after deduction of blending costs to reach pipeline quality)
(7) Midale Cromer crude oil 29 degrees API, 2.0% sulphur
McDaniel & Associates Consultants Ltd.
Summary of Natural Gas Price Forecasts April 1, 2014
Year
U.S.
Henry Hub
Gas Price
$US/MMBtu
Alberta
AECO
Spot
Price
$C/MMBtu
Alberta
Average
Plantgate
$C/MMBtu
Alberta
Aggregator
Plantgate
$C/MMBtu
Alberta
Spot
Sales
Plantgate
$C/MMBtu
Sask.
Prov.
Gas
Plantgate
$C/MMBtu
British
Columbia
Average
Plantgate
$C/MMBtu (1)
History 1987 1.50 1.64 1.82 - 1988 1.85 1.44 1.66 1.21 1989 1.68 1.47 1.57 1.28 1990 1.67 1.45 1.64 1.20 1991 1.54 1.18 1.31 0.97 1.13 1992 1.79 1.22 1.30 1.04 1.10 1993 2.13 1.89 1.60 2.16 2.13 1994 1.92 1.83 1.81 1.86 1.87 1995 1.62 1.18 1.23 1.02 1.12
1996 2.50 1.39 1.54 1.63 1.34 1.47 1997 2.59 1.87 1.84 1.86 1.67 1.98 1998 2.06 2.04 1.90 1.88 1.84 2.05 2.00 1999 2.28 2.96 2.60 2.46 2.78 2.82 2.77 2000 4.31 5.02 4.80 4.57 4.85 4.78 4.88
2001 3.98 6.30 5.90 5.25 6.10 5.71 6.30 2002 3.36 4.07 3.89 3.80 3.90 3.90 3.93 2003 5.49 6.66 6.37 6.00 6.49 6.40 6.32 2004 5.90 6.87 6.62 6.35 6.70 6.48 6.45 2005 8.60 8.58 8.43 8.48 8.42 8.35 8.12
2006 6.75 7.16 6.87 6.59 6.96 6.67 6.45 2007 6.95 6.65 6.41 6.35 6.43 6.18 6.25 2008 8.85 8.15 7.90 8.10 7.90 8.07 8.10 2009 3.95 4.20 3.95 3.90 3.95 3.87 4.05 2010 4.40 4.15 3.90 3.85 3.90 3.96 3.90 2011 4.00 3.70 3.50 3.75 3.50 3.56 3.30 2012 2.75 2.45 2.25 2.25 2.25 2.31 2.25 2013 3.75 3.20 3.00 3.00 3.00 3.10 2.90
2014 (3 mos) 5.05 4.55 4.35 4.35 4.35 4.55 4.35 Forecast
2014 (9 mos) 4.55 4.50 4.30 4.30 4.30 4.40 4.20 2015 4.55 4.50 4.30 4.30 4.30 4.40 4.20 2016 4.65 4.55 4.35 4.35 4.35 4.45 4.25 2017 4.90 4.80 4.60 4.60 4.60 4.70 4.50 2018 5.10 5.00 4.80 4.80 4.80 4.90 4.70
2019 5.40 5.25 5.05 5.05 5.05 5.15 4.95 2020 5.50 5.35 5.10 5.10 5.10 5.20 5.00 2021 5.65 5.50 5.25 5.25 5.25 5.35 5.15 2022 5.75 5.60 5.35 5.35 5.35 5.45 5.25 2023 5.85 5.70 5.45 5.45 5.45 5.55 5.35
2024 6.00 5.85 5.60 5.60 5.60 5.70 5.50 2025 6.10 5.95 5.70 5.70 5.70 5.80 5.60 2026 6.20 6.05 5.80 5.80 5.80 5.95 5.65 2027 6.35 6.20 5.95 5.95 5.95 6.10 5.80 2028 6.45 6.30 6.05 6.05 6.05 6.20 5.90
Thereafter +2%/yr +2%/yr +2%/yr +2%/yr +2%/yr +2%/yr +2%/yr
(1) This forecast also applies to direct sales contracts and the Alberta gas reference price used in the crown royalty calculations.
- 7 -
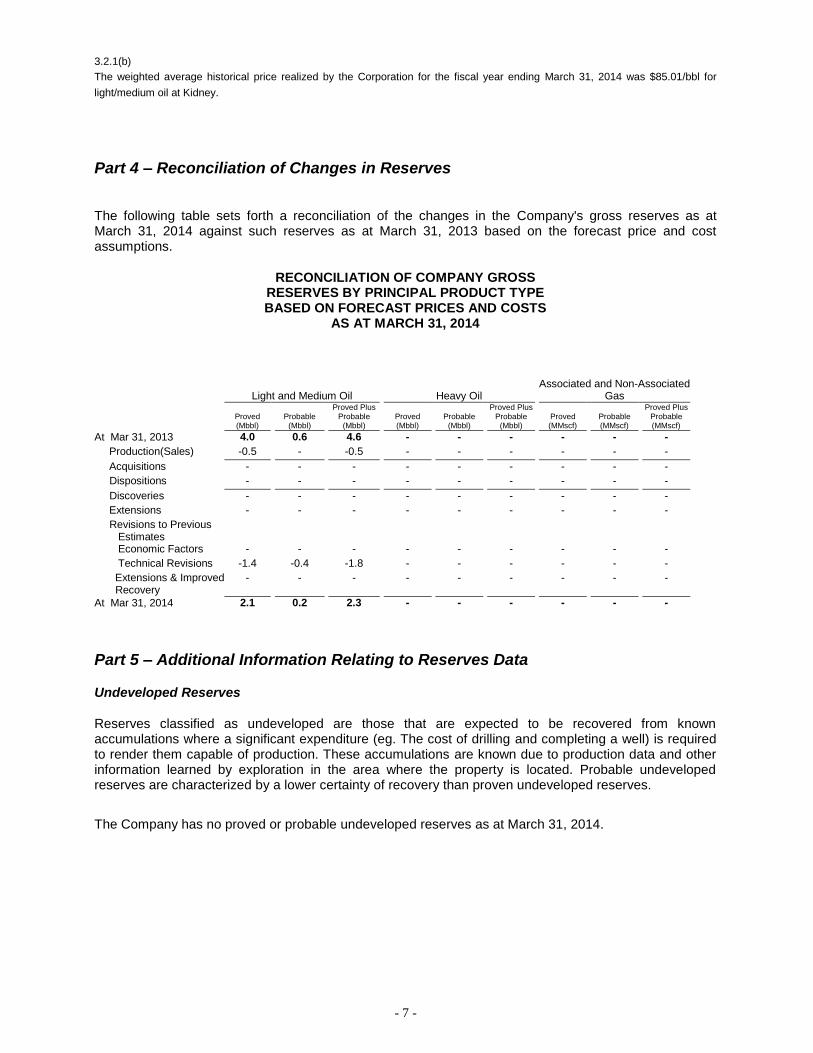
3.2.1(b)
The weighted average historical price realized by the Corporation for the fiscal year ending March 31, 2014 was $85.01/bbl for
light/medium oil at Kidney.
Part 4 – Reconciliation of Changes in Reserves
The following table sets forth a reconciliation of the changes in the Company's gross reserves as at March 31, 2014 against such reserves as at March 31, 2013 based on the forecast price and cost assumptions.
RECONCILIATION OF COMPANY GROSS RESERVES BY PRINCIPAL PRODUCT TYPE BASED ON FORECAST PRICES AND COSTS
AS AT MARCH 31, 2014
Light and Medium Oil Heavy Oil Associated and Non-Associated
Gas
Proved (Mbbl)
Probable (Mbbl)
Proved Plus Probable
(Mbbl) Proved (Mbbl)
Probable (Mbbl)
Proved Plus Probable
(Mbbl) Proved (MMscf)
Probable (MMscf)
Proved Plus Probable (MMscf)
At Mar 31, 2013 4.0 0.6 4.6 - - - - - -
Production(Sales) -0.5 - -0.5 - - - - - -
Acquisitions - - - - - - - - -
Dispositions - - - - - - - - -
Discoveries - - - - - - - - -
Extensions - - - - - - - - -
Revisions to Previous Estimates
Economic Factors - - - - - - - - -
Technical Revisions -1.4 -0.4 -1.8 - - - - - -
Extensions & Improved Recovery
- - - - - - - - -
At Mar 31, 2014 2.1 0.2 2.3 - - - - - -
Part 5 – Additional Information Relating to Reserves Data
Undeveloped Reserves
Reserves classified as undeveloped are those that are expected to be recovered from known accumulations where a significant expenditure (eg. The cost of drilling and completing a well) is required to render them capable of production. These accumulations are known due to production data and other information learned by exploration in the area where the property is located. Probable undeveloped reserves are characterized by a lower certainty of recovery than proven undeveloped reserves.
The Company has no proved or probable undeveloped reserves as at March 31, 2014.
- 8 -
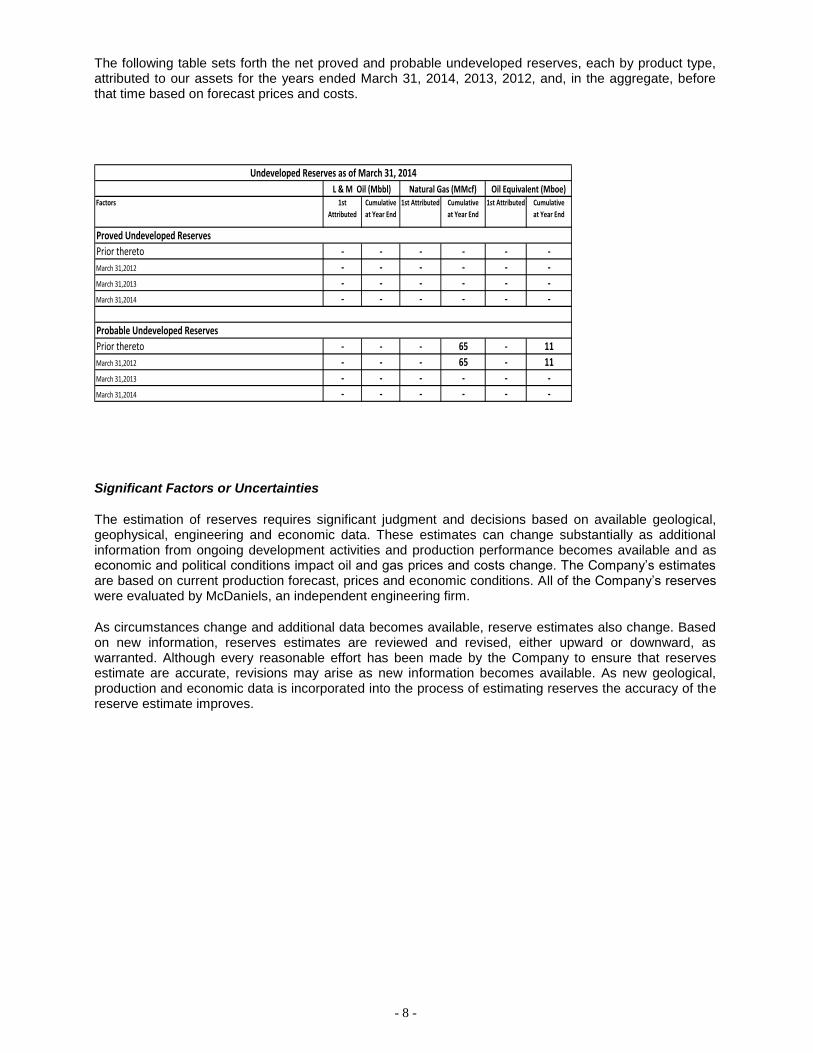
The following table sets forth the net proved and probable undeveloped reserves, each by product type, attributed to our assets for the years ended March 31, 2014, 2013, 2012, and, in the aggregate, before that time based on forecast prices and costs.
Factors 1st
Attributed
Cumulative
at Year End
1st Attributed Cumulative
at Year End
1st Attributed Cumulative
at Year End
Prior thereto - - - - - -
March 31,2012 - - - - - -
March 31,2013 - - - - - -
March 31,2014 - - - - - -
Prior thereto - - - 65 - 11
March 31,2012 - - - 65 - 11
March 31,2013 - - - - - -
March 31,2014 - - - - - -
Probable Undeveloped Reserves
Undeveloped Reserves as of March 31, 2014
L & M Oil (Mbbl) Natural Gas (MMcf) Oil Equivalent (Mboe)
Proved Undeveloped Reserves
Significant Factors or Uncertainties
The estimation of reserves requires significant judgment and decisions based on available geological, geophysical, engineering and economic data. These estimates can change substantially as additional information from ongoing development activities and production performance becomes available and as economic and political conditions impact oil and gas prices and costs change. The Company’s estimates are based on current production forecast, prices and economic conditions. All of the Company’s reserves were evaluated by McDaniels, an independent engineering firm.
As circumstances change and additional data becomes available, reserve estimates also change. Based on new information, reserves estimates are reviewed and revised, either upward or downward, as warranted. Although every reasonable effort has been made by the Company to ensure that reserves estimate are accurate, revisions may arise as new information becomes available. As new geological, production and economic data is incorporated into the process of estimating reserves the accuracy of the reserve estimate improves.
- 9 -
Certain information regarding the Company set forth in this report, including management’s assessment of the Company’s future plans and operations contain forward-looking statements that involve substantial known and unknown risks and uncertainties. These risks include, but are not limited to: the risks associated with the oil and gas industry, commodity prices and exchange rates; industry related risks could include, but are not limited to, operational risks in exploration, development and production, delays or changes in plans, risks associated with the uncertainty of reserve estimates, health and safety risks and the uncertainty of estimates and projections of production, costs and expenses. Competition from other producers, the lack of available qualified personnel or management, stock market volatility and ability to access sufficient capital from internal and external sources are additional risks the Company faces in this market. The Company’s actual results, performance or achievements could differ materially from those expressed in, or implied by, these forward looking statements and accordingly, no assurance can be given that any events anticipated by the forward looking statements will transpire or occur, if any of them do, what benefits the Company can derive from. The reader is cautioned not to place undue reliance on this forward looking information.
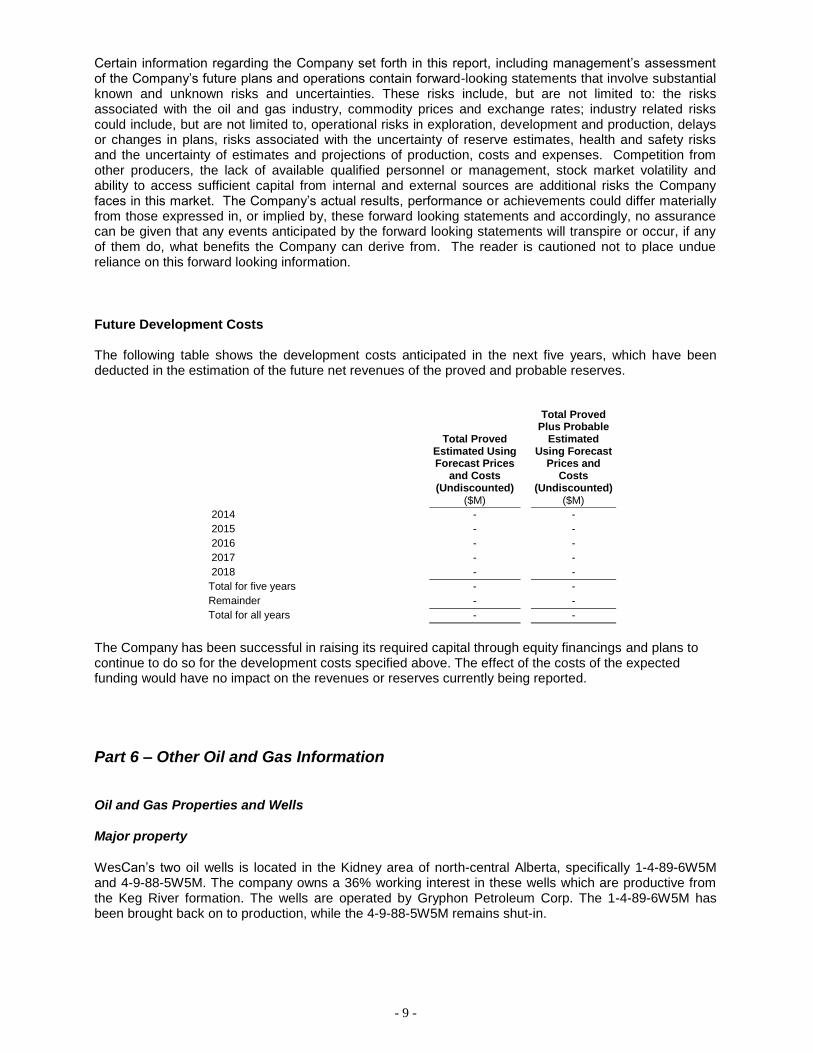
Future Development Costs The following table shows the development costs anticipated in the next five years, which have been deducted in the estimation of the future net revenues of the proved and probable reserves.
Total Proved
Estimated Using Forecast Prices
and Costs (Undiscounted)
($M)
Total Proved Plus Probable
Estimated Using Forecast
Prices and Costs
(Undiscounted) ($M)
2014 - -
2015 - -
2016 - -
2017 - -
2018 - -
Total for five years - -
Remainder - -
Total for all years - -
The Company has been successful in raising its required capital through equity financings and plans to continue to do so for the development costs specified above. The effect of the costs of the expected funding would have no impact on the revenues or reserves currently being reported.
Part 6 – Other Oil and Gas Information
Oil and Gas Properties and Wells
Major property
WesCan’s two oil wells is located in the Kidney area of north-central Alberta, specifically 1-4-89-6W5M and 4-9-88-5W5M. The company owns a 36% working interest in these wells which are productive from the Keg River formation. The wells are operated by Gryphon Petroleum Corp. The 1-4-89-6W5M has been brought back on to production, while the 4-9-88-5W5M remains shut-in.
- 10 -
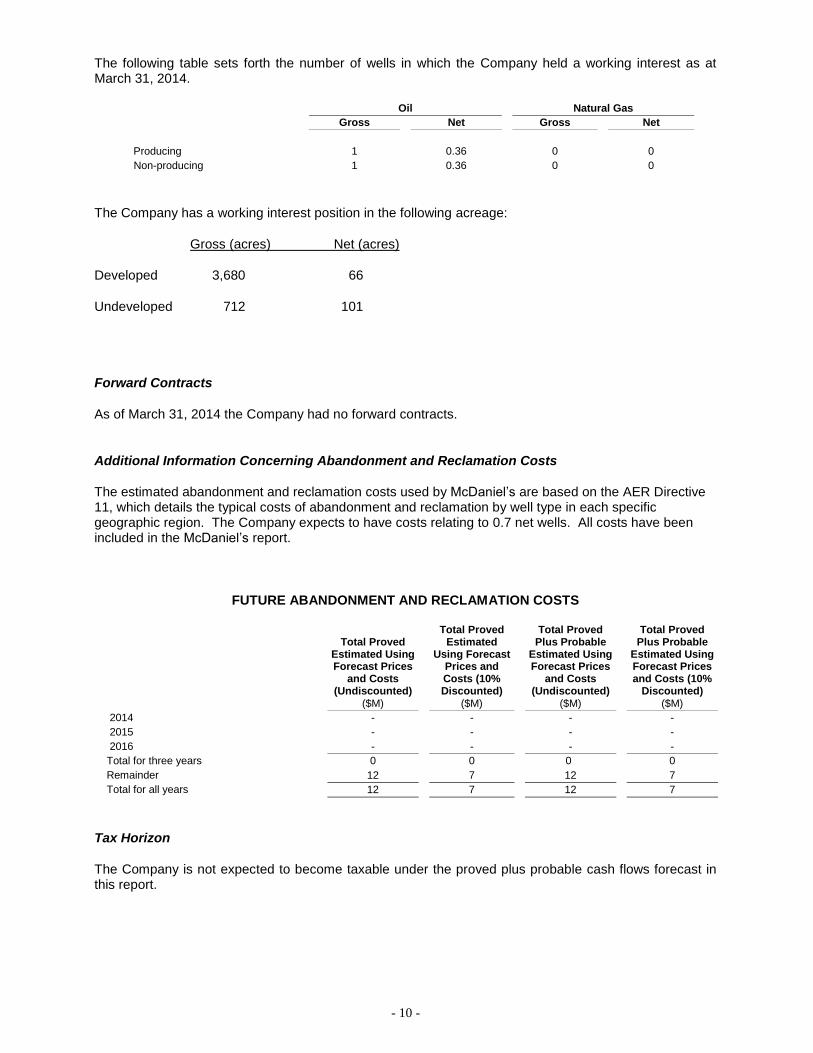
The following table sets forth the number of wells in which the Company held a working interest as at March 31, 2014.
Oil Natural Gas
Gross Net Gross Net
Producing 1 0.36 0 0
Non-producing 1 0.36 0 0
The Company has a working interest position in the following acreage:
Gross (acres) Net (acres)
Developed 3,680 66
Undeveloped 712 101
Forward Contracts
As of March 31, 2014 the Company had no forward contracts.
Additional Information Concerning Abandonment and Reclamation Costs
The estimated abandonment and reclamation costs used by McDaniel’s are based on the AER Directive 11, which details the typical costs of abandonment and reclamation by well type in each specific geographic region. The Company expects to have costs relating to 0.7 net wells. All costs have been included in the McDaniel’s report.
FUTURE ABANDONMENT AND RECLAMATION COSTS
Total Proved
Estimated Using Forecast Prices
and Costs (Undiscounted)
($M)
Total Proved
Estimated Using Forecast
Prices and Costs (10% Discounted)
($M)
Total Proved Plus Probable
Estimated Using Forecast Prices
and Costs (Undiscounted)
($M)
Total Proved Plus Probable
Estimated Using Forecast Prices and Costs (10%
Discounted) ($M)
2014 - - - -
2015 - - - -
2016 - - - -
Total for three years 0 0 0 0
Remainder 12 7 12 7
Total for all years 12 7 12 7
Tax Horizon
The Company is not expected to become taxable under the proved plus probable cash flows forecast in this report.
- 11 -
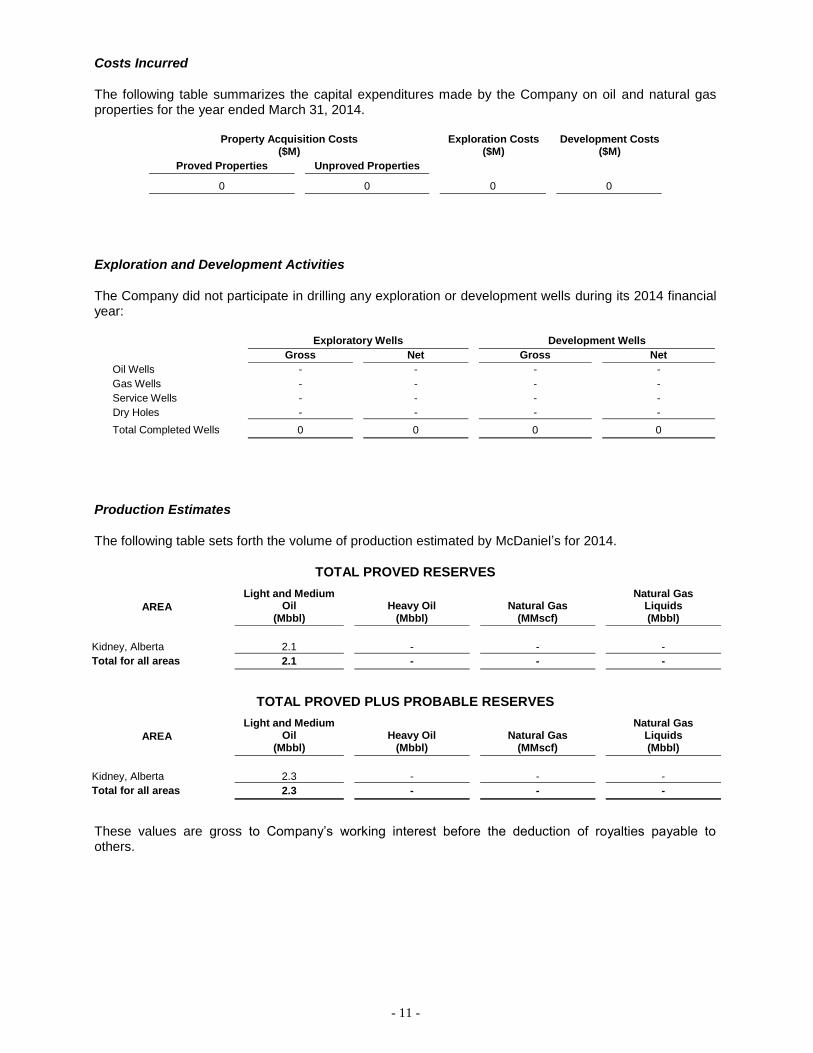
Costs Incurred
The following table summarizes the capital expenditures made by the Company on oil and natural gas properties for the year ended March 31, 2014.
Property Acquisition Costs ($M)
Exploration Costs ($M)
Development Costs ($M)
Proved Properties Unproved Properties
0 0 0 0
Exploration and Development Activities
The Company did not participate in drilling any exploration or development wells during its 2014 financial year:
Exploratory Wells Development Wells
Gross
Net
Gross Net
Oil Wells - - - -
Gas Wells - - - -
Service Wells - - - -
Dry Holes - - - -
Total Completed Wells 0 0 0 0
Production Estimates
The following table sets forth the volume of production estimated by McDaniel’s for 2014.
TOTAL PROVED RESERVES
AREA
Light and Medium Oil
(Mbbl)
Heavy Oil
(Mbbl)
Natural Gas
(MMscf)
Natural Gas Liquids (Mbbl)
Kidney, Alberta 2.1 - - -
Total for all areas 2.1 - - -
TOTAL PROVED PLUS PROBABLE RESERVES
AREA
Light and Medium Oil
(Mbbl)
Heavy Oil
(Mbbl)
Natural Gas
(MMscf)
Natural Gas Liquids (Mbbl)
Kidney, Alberta 2.3 - - -
Total for all areas 2.3 - - -
These values are gross to Company’s working interest before the deduction of royalties payable to others.
- 12 -
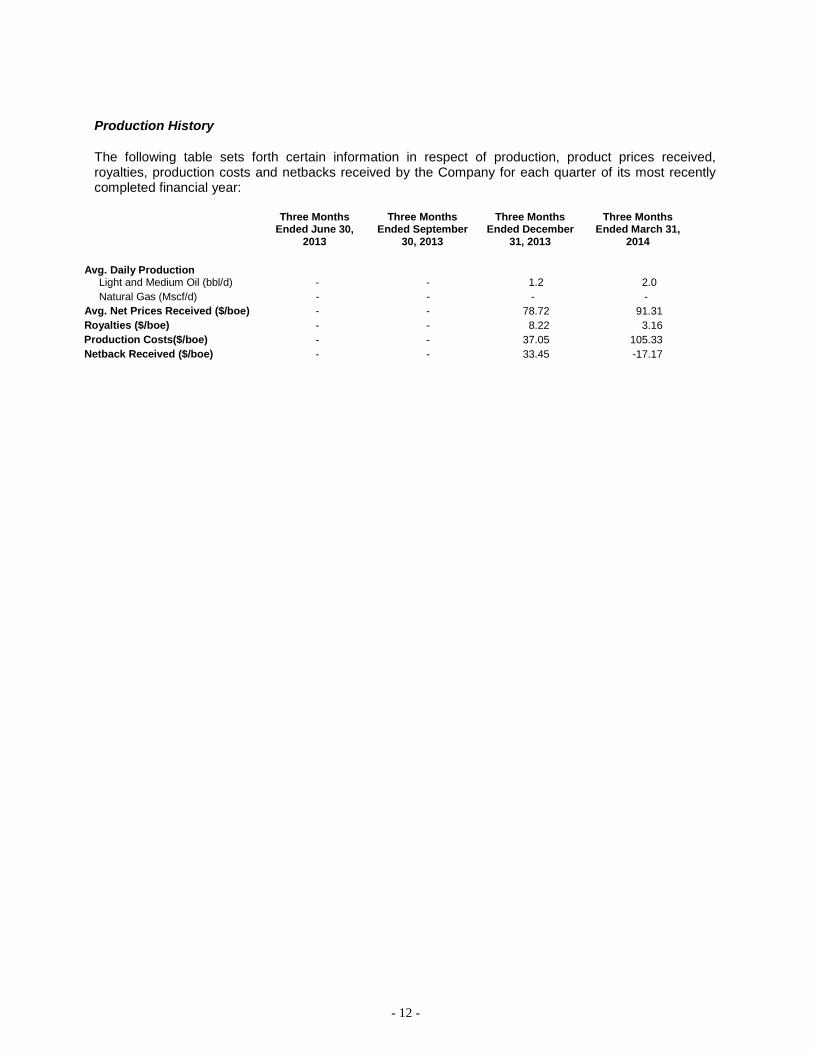
Production History
The following table sets forth certain information in respect of production, product prices received, royalties, production costs and netbacks received by the Company for each quarter of its most recently completed financial year:
Three Months Ended June 30,
2013
Three Months Ended September
30, 2013
Three Months Ended December
31, 2013
Three Months Ended March 31,
2014
Avg. Daily Production Light and Medium Oil (bbl/d) - - 1.2 2.0
Natural Gas (Mscf/d) - - - -
Avg. Net Prices Received ($/boe) - - 78.72 91.31
Royalties ($/boe) - - 8.22 3.16
Production Costs($/boe) - - 37.05 105.33
Netback Received ($/boe) - - 33.45 -17.17
- 13 -
ABBREVIATIONS AND CONVERSION
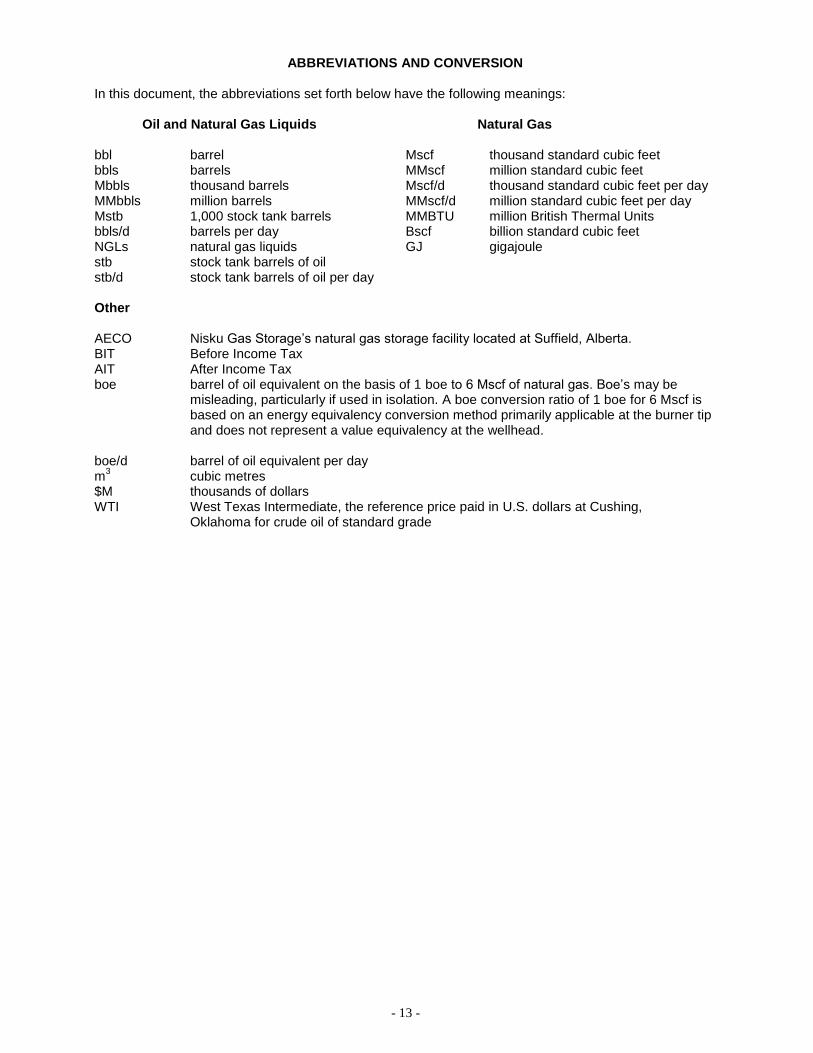
In this document, the abbreviations set forth below have the following meanings: Oil and Natural Gas Liquids Natural Gas bbl barrel Mscf thousand standard cubic feet bbls barrels MMscf million standard cubic feet Mbbls thousand barrels Mscf/d thousand standard cubic feet per day MMbbls million barrels MMscf/d million standard cubic feet per day Mstb 1,000 stock tank barrels MMBTU million British Thermal Units bbls/d barrels per day Bscf billion standard cubic feet NGLs natural gas liquids GJ gigajoule stb stock tank barrels of oil stb/d stock tank barrels of oil per day Other AECO Nisku Gas Storage’s natural gas storage facility located at Suffield, Alberta. BIT Before Income Tax AIT After Income Tax boe barrel of oil equivalent on the basis of 1 boe to 6 Mscf of natural gas. Boe’s may be
misleading, particularly if used in isolation. A boe conversion ratio of 1 boe for 6 Mscf is based on an energy equivalency conversion method primarily applicable at the burner tip and does not represent a value equivalency at the wellhead.
boe/d barrel of oil equivalent per day m
3 cubic metres
$M thousands of dollars WTI West Texas Intermediate, the reference price paid in U.S. dollars at Cushing, Oklahoma for crude oil of standard grade