Embed Size (px)
Citation preview

1
WES SPILLWAY STRUCTURAL DESIGN AND STABILITY
Raquel Rosa1
1Instituto Superior Técnico, University of Lisbon
Av. Rovisco Pais, 1049-001, Lisboa, Portugal
Keywords: Spillway, Structural design, Stability, Hydrostatic pressure, Concrete, Finite element
design.
Abstract: Spillways are hydraulic works of large dimensions, in which safety is of utmost importance,
not only due to the high costs associated to this work, but also to the damages caused in case of
accident. The impact of the negative consequences related to this last scenario requires a careful
structural stability evaluation through an appropriate structural design.
This work concerns the structural stability evaluation through the development of a safe and proper
design, at a preliminary level, of a WES spillway type (Waterways Experiment Station), inserted in
an earth dam in Mozambique.
The following data were provided: water levels upstream and downstream the structure; geotechnical
properties; as well as the structure’s geometry.
The structure is composed by 10 identical modules (19 m length). Each module will be composed by
the spillway body (15 m) and a structural reinforced concrete wall (4 m).
This work is divided in two sections. In the first section, the design of the spillway body is carried out
based in a global stability analysis, using safety factors prescribed by the “Normas Portuguesas de
Barragens”. The second section concerns the design of the walls and the reinforcement detailing.
1. Introduction
Spillways are hydraulic works made of
concrete inserted in dams, in which the main
goal is the discharge of water in order to
ensure the safety of the dam [1].
Given the high risk that comes with such an
endeavor, and the eventual need to extend its
lifetime when compared to the initially
estimated in the project, dam structural
safety is still a topic of interest.
The presented work, a preliminary draft,
aims to provide the design of a WES
(Waterways Experiment Station) spillway
type, located in Mozambique.
The spillway structural design takes into
account several aspects, amongst which the
type of dam in which the spillway operates,
1 e-mail: [email protected]
the topographical and hydraulic conditions,
the foundation conditions, as well as the
mass needed to ensure the stability of the
structure.
Provided good foundation conditions, this
type of spillways, when accurately projected
and built, has a high degree of reliability and
low maintenance costs. However, they
present high economic impacts.
The spillway geometry definition takes into
account the stability analysis and it is based
on the following data:
Downstream and upstream water
levels at full water level and at
maximum flood level;

2
Foundation resistance and
deformability conditions ;
Shape of the hydraulic surface of the
face in contact with the flow.
2. General work description
The dam spillway will be formed by 10
modules with 19,00 m in length each. These
modules are individually composed by the
spillway’s threshold (hydraulic span of
15,00m), and by pillars (thickness of 4,00m),
for a total extension of 190,00 m. Each
module has an approximate volume of
15530 m3 (Figure 2.1).
‘
Figure 2.1- Layout of structure
The spillway will be implanted in the area
where the sound rock foundation is
available.
The spillway is a WES spillway, with
adherent water blade, with the surface level
at 97,00m. . It is constituted by 10 modules
each with 19,00m of length, in a total of
190,00m. The flow is controlled by radial
gates.
The pillars that separate the spans of the
spillway threshold have an elliptic shape,
4,00 m thick, which extend approximately
6,25m upstream (Figure 2.2). The
roadbridge makes the connection between
the spillway and the road along the full
extent of the dam.
The 3d model of the structure is represented
in Figure 2.2.
Figure 2.2- Tridimensional model of the spillway
module..
3. Spillway body
3.1. Threshold geometry
The threshold of the spillway is a WES type,
and the flow is controlled by radial gates.
Figure 3.1 represents the adapted geometry
for the threshold, as well as the relevant
points for the profile definition (Table 3.1)
and for the exponential equation of the
central section of the threshold (𝑌 =
0,055𝑋1,84).
Figure 3.1- Profile of the WES threshold
Table 3.1- Coordinates (X,Y) of the points that
compose the spillway threshold
Points X (m) Y (m)
P1 -3,7500 1,4275
P2 -2,1424 0,3000

3
P3 0,0000 0,0000
P4 18,5496 11,8603
P5 21,9921 15,9103
P6 39,9946 17,0000
C1 -1,3184 3,1846
C2 0,0000 7,8000
C3 31,5163 7,8147
3.2. Materials and actions
The concrete used is presented in Table 3.2.
Table 3.2- Concrete used in construction and
corresponding application zones.
Concrete
class Zone of application
C16/20 Core of the spillway
threshold
C30/37
1,0 m thick after the
spillway clime area and in
the pillars
The considered actions, according with the
Portaria 846/93, artigo 22., of Normas
Portuguesas de Barragens (NPB) [2] were:
Structure self-weight ;
Self-weight of the gate and deck;
Hydrostatic pressures;
Uplift hydrostatic pressure
Earth pressures;
Seismic actions;
The water levels taken into account in the
design according to the NPB are (Table 3.3)
[2]:
FWL (full water level): regular level of the
reservoir, allowing for its full exploration;
MFL (maximum flood level): maximum
level corresponding to the occurrence of a
major flood.
Table 3.3- Water levels upstream and downstream
of the dam
Upstream Downstream
FWL [m] 112,00 80,50
MFL [m] 113,00 92,00
Figure 3.2 shows a scheme of the pressure
diagrams of the several actions taken into
account, and the resulting actions that the
dam undergoes, considering a 19m module.
Figure 3.2- - Scheme of the actions that the dam
undergoes
The self-weight is the major stability action.
The spillway is usually designed and
calculated to solely resist by its self-weight
to the several actions that undergoes to [3].
The hydrodynamic pressures are obtained
with the integration of the pressure diagram.
With the purpose of reducing the value of the
uplift pressure, drainage galleries are
introduced. The k parameter accounts for the
percentage of pressure that is dissipated with
the drainage system.
It was considered a 𝑘 = 1/3, as
recommended by the NPB [2], 1993 and [4].
The uplift pressure diagram will be done
accordingly with the shape of the dam
foundation, as illustrated in Figure 3.3.
Figure 3.3- Uplift diagram
The seismic action was quantified as
indicated in Table 3-4 where:
OBE- operating basis earthquake

4
MDE- maximum design earthquake
Table 3.4- Base accelerations
aearthquake,h
[g]
aearthquake,v
[g]
OBE 0,100 g ± 2/3.
aearthquake,h
MDE 0,150 g ± 2/3.
aearthquake,h
In the presence of a seismic event, the
hydrodynamic pressure diagram has a
parabolic shape (Figure 3.4), and it is
calculated through the expression [3]:
𝑝(𝑧) = 𝐶 × 𝛼 × 𝛾 × ℎ (3.1)
Figure 3.4- Hydrodynamic pressure diagram
The action of the fine-grained sediments is
calculated using the Rankine’s theory,
neglecting the cohesion and using the soil
parameters of Table 3.5:
𝑒𝑎𝑟𝑡ℎ 𝑝𝑟𝑒𝑠𝑠𝑢𝑟𝑒
=𝛾𝑠 × ℎ𝑠
2
2𝑘0
(3.2)
Table 3.5- Soil parameters
Parameters
Terrain s [kN/m3] c’ [kPa]
Sandy 18 28 0
In the event of a seism, the generated terrain
impulse due to seismic action should be
taken into account, and should be considered
accordingly to the formulation of
Mononobe-Okabe, as presented in
EN1998:5 [5].
Thermal actions were not considered in this
preliminary draft, since some requirements
to the study of thermal actions related to
construction factors are yet to be defined.
3.3. Global stability analysis
The global stability analysis consists of two
points:
Guarantee of the safety of the
spillway against fluctuation,
overturning and sliding;
Stress and displacement
verifications.
3.3.1. Load scenarios
According to the NPB Portaria n.º 846/93,
artigo1.[2], it should take into account two
scenarios: usual scenarios (normal
conditions of exploration, to which the
construction should not deteriorate) and
extreme scenarios (situations which are less
likely to occur, for which the construction
should not rupture).
Table 3.6- Load combinations that are considered
in the global stability analysis
Scenario Actions
Usual
Static actions (FWL)
Seismic combination (FWL and
OBE)
Extreme
Static actions (MFL)
Seismic combination (FWL
MDE)
3.3.2. Safety verifications to fluctuation,
overturning and sliding
In the spillway global stability analysis the
following partial safety coefficients were
considered, presented in Table 3.7 as
recommended in Artigo 31. da Portaria
846/93 [2] and in [6].
Table 3.7- Safety coefficients for the global stability
analysis
Safety
factor
Current
Scenario
Fracture
Scenario
S.F.Fluct. 1,3 1,1
S.F.Roll. 1,5 1,2
S.F.Slid. 1,5 1,2
The geotechnical parameters used to
characterize the rock-concrete interface are
shown in Table 3.8.

5
Table 3.8- Adopted geotechnical parameters for the
rock-concrete interface
Current
scenarios
Fracture
scenarios
Friction
angle (R-C) 45 45
Cohesion(c) 100
[kPa](*) -
(*)Cohesion was considered null in all scenarios,
except for the maximum seismic action scenario where
it was adopted the 100 kPa value.
The safety factors are defined through the
expressions present in Table 3.9.
Table 3.9- Safety formulas to fluctuation, sliding
and overturning
Safety
factor Formula
S.F. Flut t. 𝐹𝑆𝐹𝑙𝑢𝑡. =∑ 𝐹𝑉
𝑈
S.F.Roll 𝐹𝑆𝐷𝑒𝑟𝑟. =∑ 𝑀𝐸𝑠𝑡.
∑ 𝑀𝐷𝑒𝑟𝑟.
S.F.Slid. 𝐹𝑆𝐷𝑒𝑠𝑙.𝑅𝑒𝑠. =
∑ 𝐹𝑉 .𝑡𝑔(𝛿𝑅−𝐶)
𝐶𝑆𝛿+ 𝐿. 𝑐/𝐶𝑆𝑐
∑ 𝐹𝐻
≥ 1.0
S.F.Slid. 𝐹𝑆𝐷𝑒𝑠𝑙. =∑ 𝐹𝑉 . 𝑡𝑔𝛿
∑ 𝐹𝐻
≥ 𝐶𝑆𝛿
The safety factor results are summarized in
Table 3.10.
Table 3.10- Safety factors to fluctuation, sliding and
overturning
Scenario S.F. Flut. S.F.Slid. S.F.Roll.
FWL 3,13 ✓ 1,93 ✓ 4,25 ✓
FWL+OBE 2,94 ✓ 1,39 × 2,96 ✓
MFL 1,78 ✓ 1,23 ✓ 3,86 ✓
FWL+MDE 2,86 ✓ 1,20 ✓ 2,43 ✓
Since the safety check for sliding was not
performed for the current scenario, it was
necessary to calculate the safety factor to the
residual sliding, considering cohesion
(100kPa).
𝐹𝑆𝐷𝑒𝑠𝑙.𝑅𝑒𝑠. = 1,1 ≥ 1,0 ✓
Therefore, all safety coefficients established
by the NPB (Table 3.7) were complied.
3.3.3. Stress verification at the foundation
Tensile stresses are not usually accepted at
the foundation base, in order to avoid
cracking. This is equivalent as applying the
resulting attenuating forces inside the central
core of the dam.
To the concrete with class C15/20
(fcd=10,7MPa e fctm=1,9MPa), and applying
the safety factors recommended by the NPB,
the maximum admissible tensions at the dam
are:
Table 3-11- Maximum tensions admitted to usual
and extreme scenarios
F.S. σmax.comp.
[MPa]
σmax.tensile
[MPa]
Usual S. 2,5 4,28 0,76
Extreme S. 1,2 8,92 1,58
Making sure that the resulting forces are
inside the central core, the following tensile
stress values were obtained (Table 3.12)
through the following expression:
𝜎𝑖 =𝑁
𝑏𝐿±
6𝑁. 𝑒
𝑏𝐿2 (3.3)
Table 3.12- Transmitted tensions to the foundation
massif
Combinations σm [MPa] σj
[MPa]
Usu
al
S.
PP 0,81 ✓ 0,04 ✓
FWL 0,35 ✓ 0,30 ✓
FWL+OBE(+) 0,21 ✓ 0,42 ✓
FWL+OBE(-) 0,50 ✓ 0,17 ✓
Ex
trem
e S
. MFL 0,28 ✓ 0,12 ✓
FWL+MDE(+) 0,12 ✓ 0,51 ✓
FWL+MDE(-) 0,59 ✓ 0,09 ✓
3.4. Structural Modeling
3.4.1. Conception
The structural model of the spillway was
developed using the finite elements program
SAP2000 and all elements used in the
spillway modeling are shell elements.
The model is bi-dimensional with the
deformation restrained in a perpendicular
direction to the spillway section and with
unitary thickness.
6
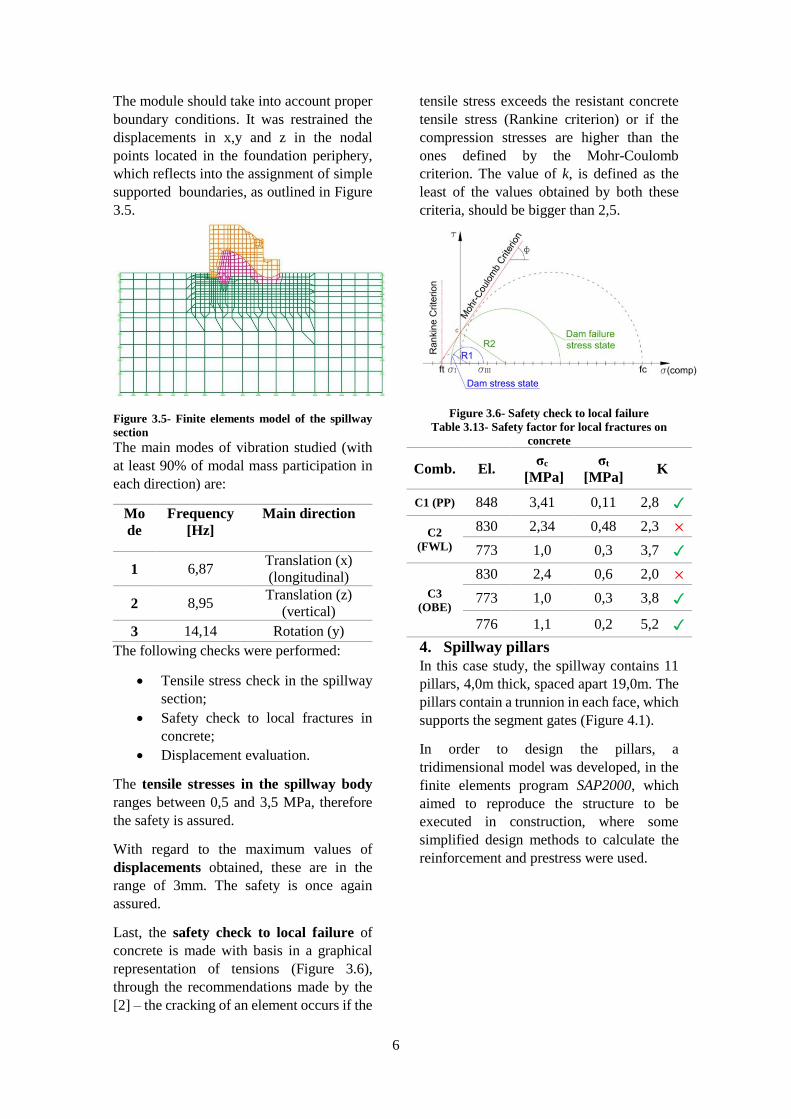
The module should take into account proper
boundary conditions. It was restrained the
displacements in x,y and z in the nodal
points located in the foundation periphery,
which reflects into the assignment of simple
supported boundaries, as outlined in Figure
3.5.
Figure 3.5- Finite elements model of the spillway
section
The main modes of vibration studied (with
at least 90% of modal mass participation in
each direction) are:
Mo
de
Frequency
[Hz]
Main direction
1 6,87 Translation (x)
(longitudinal)
2 8,95 Translation (z)
(vertical)
3 14,14 Rotation (y)
The following checks were performed:
Tensile stress check in the spillway
section;
Safety check to local fractures in
concrete;
Displacement evaluation.
The tensile stresses in the spillway body
ranges between 0,5 and 3,5 MPa, therefore
the safety is assured.
With regard to the maximum values of
displacements obtained, these are in the
range of 3mm. The safety is once again
assured.
Last, the safety check to local failure of
concrete is made with basis in a graphical
representation of tensions (Figure 3.6),
through the recommendations made by the
[2] – the cracking of an element occurs if the
tensile stress exceeds the resistant concrete
tensile stress (Rankine criterion) or if the
compression stresses are higher than the
ones defined by the Mohr-Coulomb
criterion. The value of k, is defined as the
least of the values obtained by both these
criteria, should be bigger than 2,5.
Figure 3.6- Safety check to local failure
Table 3.13- Safety factor for local fractures on
concrete
Comb. El. σc
[MPa]
σt
[MPa] K
C1 (PP) 848 3,41 0,11 2,8 ✓
C2
(FWL)
830 2,34 0,48 2,3 ×
773 1,0 0,3 3,7 ✓
C3
(OBE)
830 2,4 0,6 2,0 ×
773 1,0 0,3 3,8 ✓
776 1,1 0,2 5,2 ✓
4. Spillway pillars
In this case study, the spillway contains 11
pillars, 4,0m thick, spaced apart 19,0m. The
pillars contain a trunnion in each face, which
supports the segment gates (Figure 4.1).
In order to design the pillars, a
tridimensional model was developed, in the
finite elements program SAP2000, which
aimed to reproduce the structure to be
executed in construction, where some
simplified design methods to calculate the
reinforcement and prestress were used.
7
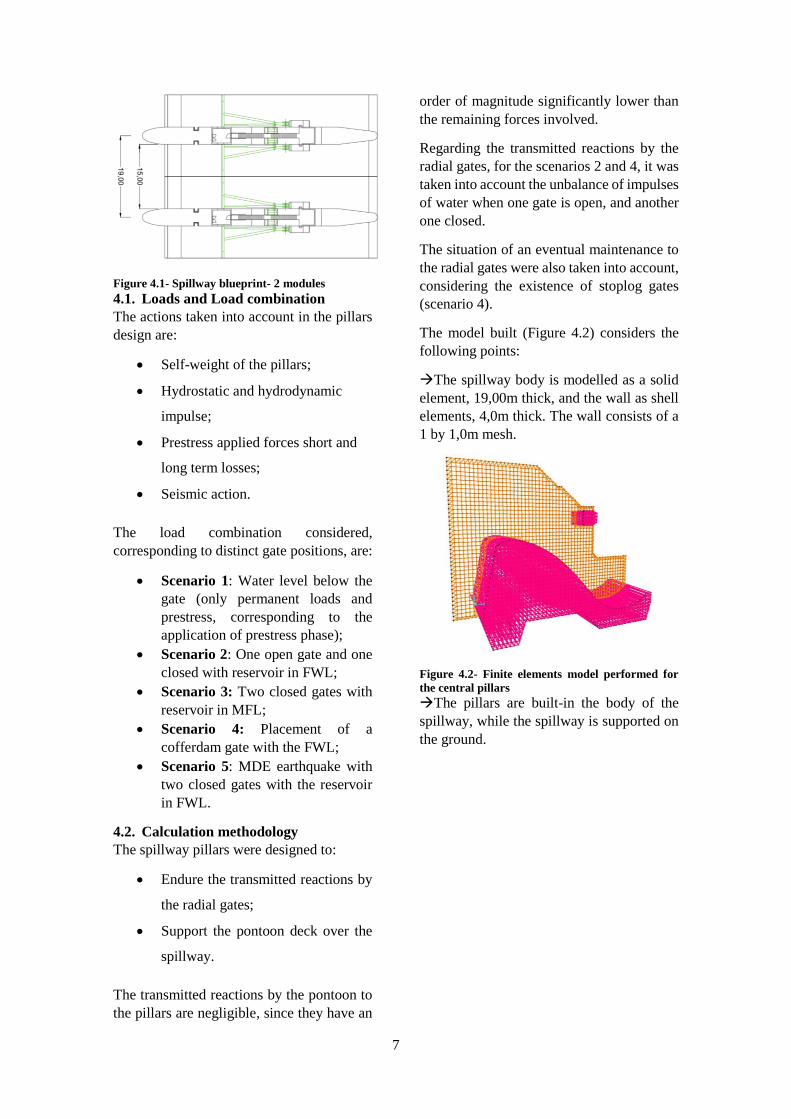
Figure 4.1- Spillway blueprint- 2 modules
4.1. Loads and Load combination
The actions taken into account in the pillars
design are:
Self-weight of the pillars;
Hydrostatic and hydrodynamic
impulse;
Prestress applied forces short and
long term losses;
Seismic action.
The load combination considered,
corresponding to distinct gate positions, are:
Scenario 1: Water level below the
gate (only permanent loads and
prestress, corresponding to the
application of prestress phase);
Scenario 2: One open gate and one
closed with reservoir in FWL;
Scenario 3: Two closed gates with
reservoir in MFL;
Scenario 4: Placement of a
cofferdam gate with the FWL;
Scenario 5: MDE earthquake with
two closed gates with the reservoir
in FWL.
4.2. Calculation methodology
The spillway pillars were designed to:
Endure the transmitted reactions by
the radial gates;
Support the pontoon deck over the
spillway.
The transmitted reactions by the pontoon to
the pillars are negligible, since they have an
order of magnitude significantly lower than
the remaining forces involved.
Regarding the transmitted reactions by the
radial gates, for the scenarios 2 and 4, it was
taken into account the unbalance of impulses
of water when one gate is open, and another
one closed.
The situation of an eventual maintenance to
the radial gates were also taken into account,
considering the existence of stoplog gates
(scenario 4).
The model built (Figure 4.2) considers the
following points:
The spillway body is modelled as a solid
element, 19,00m thick, and the wall as shell
elements, 4,0m thick. The wall consists of a
1 by 1,0m mesh.
Figure 4.2- Finite elements model performed for
the central pillars
The pillars are built-in the body of the
spillway, while the spillway is supported on
the ground.
8
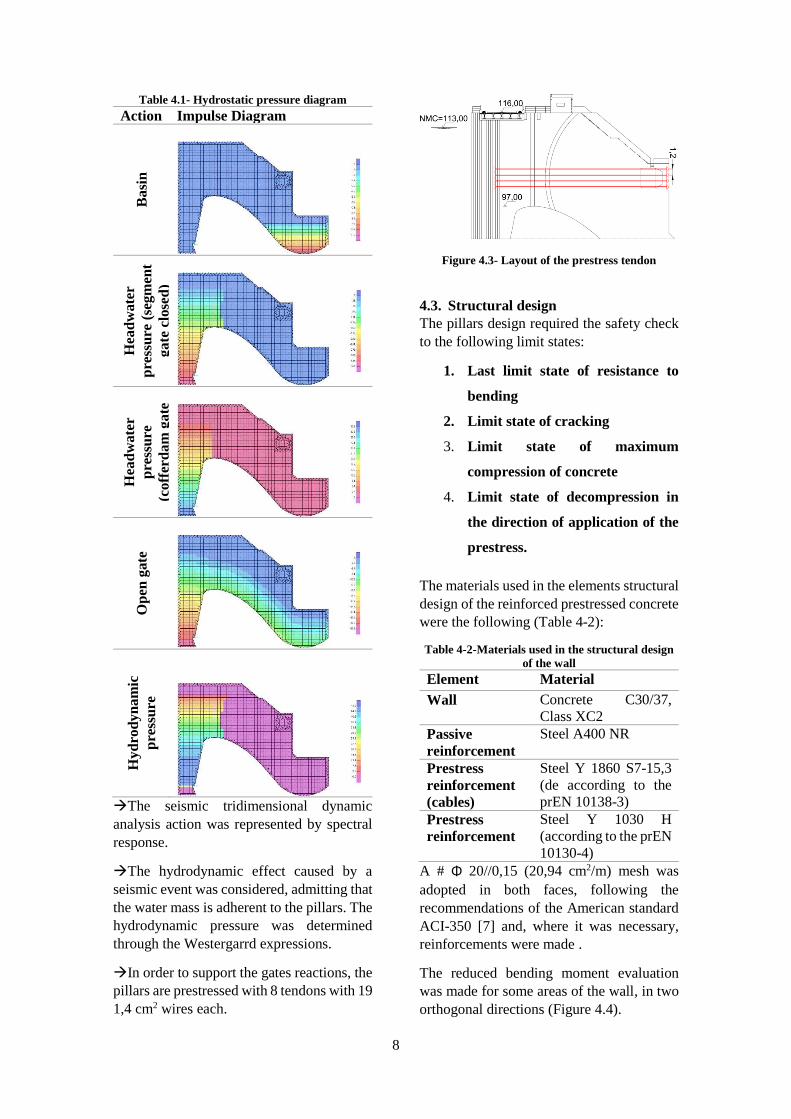
Table 4.1- Hydrostatic pressure diagram
Action Impulse Diagram
Ba
sin
Hea
dw
ate
r
pre
ssu
re (
segm
ent
ga
te c
lose
d)
Hea
dw
ate
r
pre
ssu
re
(coff
erd
am
ga
te
close
d)
Op
en g
ate
Hyd
rod
yn
am
ic
pre
ssu
re
The seismic tridimensional dynamic
analysis action was represented by spectral
response.
The hydrodynamic effect caused by a
seismic event was considered, admitting that
the water mass is adherent to the pillars. The
hydrodynamic pressure was determined
through the Westergarrd expressions.
In order to support the gates reactions, the
pillars are prestressed with 8 tendons with 19
1,4 cm2 wires each.
Figure 4.3- Layout of the prestress tendon
4.3. Structural design
The pillars design required the safety check
to the following limit states:
1. Last limit state of resistance to
bending
2. Limit state of cracking
3. Limit state of maximum
compression of concrete
4. Limit state of decompression in
the direction of application of the
prestress.
The materials used in the elements structural
design of the reinforced prestressed concrete
were the following (Table 4-2):
Table 4-2-Materials used in the structural design
of the wall
Element Material
Wall Concrete C30/37,
Class XC2
Passive
reinforcement
Steel A400 NR
Prestress
reinforcement
(cables)
Steel Y 1860 S7-15,3
(de according to the
prEN 10138-3)
Prestress
reinforcement
Steel Y 1030 H
(according to the prEN
10130-4)
A # Φ 20//0,15 (20,94 cm2/m) mesh was
adopted in both faces, following the
recommendations of the American standard
ACI-350 [7] and, where it was necessary,
reinforcements were made .
The reduced bending moment evaluation
was made for some areas of the wall, in two
orthogonal directions (Figure 4.4).

9
Besides the transversal loads, the wall is also
subjected to axial loads, which concerns to
an unsymmetrical bending problem. The
axial loads emerge due to the self-weight of
the structure, in a vertical direction, and
prestress, in a horizontal direction.
Figure 4.4- Wall zones for stress analysis
Table 4-3- ELU direction x
Direction x
Sce. Msd
[kNm/m] m
Nsd
[kN/m] u
1 C3 -3200 0,010 -6700 -0,085
2 C5 -980 0,003 -3840 -0,049
3 C5 -7000 0,022 -1130 -0,014
4 C5 -2700 0,009 147 0,002
5 C4 2000 0,006 440 0,006
6 C4 125 0,000 -70 -0,001
7 C3 1100 0,004 -380 -0,005
Table 4-4- ELU direction y
Direction y
Sce. Msd
[kNm/m] m Nsd
[kN/m] u
1 C2 -886 0,003 -5000 0,063
2 C5 -890 0,003 -1600 0,020
3 C5 -7400 0,024 -2600 0,033
4 C5 -810 0,003 -1430 0,018
5 C4 -2500 0,008 -2700 0,034
6 C4 650 0,002 -1600 0,020
7 C3 -1030 0,003 -800 0,010
Since the values of μ are inferior to 0,20, the
adopted resistance classed is appropriate.
Zone 3 is the only zone where the
mechanical percentage of reinforcement was
larger that the minimum reinforcement
required. In this zone, it was adopted # Φ
32//0,15 (53,62cm2/m) mesh reinforcement
in both directions (Mrd=7358,11 kNm).
The verification of ultimate limit state of
cracking consists on the cracks opening
limitation (EN1992-1-1 [7]).
𝑤𝑘 ≤ 0,3 𝑚𝑚 in the reinforced concrete
zone;
𝑤𝑘 ≤ 0,2 𝑚𝑚 in the prestressed zones.
Figure 4.5- Wall zones for stress analysis
Mfreq.
[kN.
m/m]
Nfreq.
[kN/m]
sS
[MPa]
wk
[mm]
3 (dir. x) 7065 1055 166,8 0,20 ✓
5 (dir. x) 1360 -1215 112,9 0,17 ✓
3 (dir. y) 7775 2631 111,4 0,10 ✓
1 (dir. y) 4700 2500 43,5 0,07 ✓
Regarding the limit states of
decompression, the prestressed tendons are
located in an “always compressed zone”, and
so the decompression is verified.
According to EN1992-1-1 [7], the
compression stresses limit in concrete, in a
way that limits the risk of longitudinal
cracking, for the rare load combination is:
𝜎𝑐 = 0,6𝑓𝑐𝑘 = 18,0 𝑀𝑃𝑎
The maximum obtained compression
stresses in concrete occurs in the zone of
application and prestress, and are in the
range of 2,0 𝑀𝑃𝑎 < 18,0 𝑀𝑃𝑎 ✓.
For the trunnion design, it was adopted a
compression-tension model presented in
Figure 4.5:
Figure 4.5- compression-tension model adopted
10
Table 4-5- - Calculation of the transversal
prestressed needed in the trunnions
𝑹𝑵𝑴𝑪
[𝒌𝑵] 𝑭𝒕,𝒔𝒅
[𝒌𝑵] 𝑨𝒔
[𝒄𝒎𝟐] 𝑨𝒔
adopted
𝑷𝒖
[𝒌𝑵]
10458 8824 294 10 bars
Φ40
Y1030H
6989
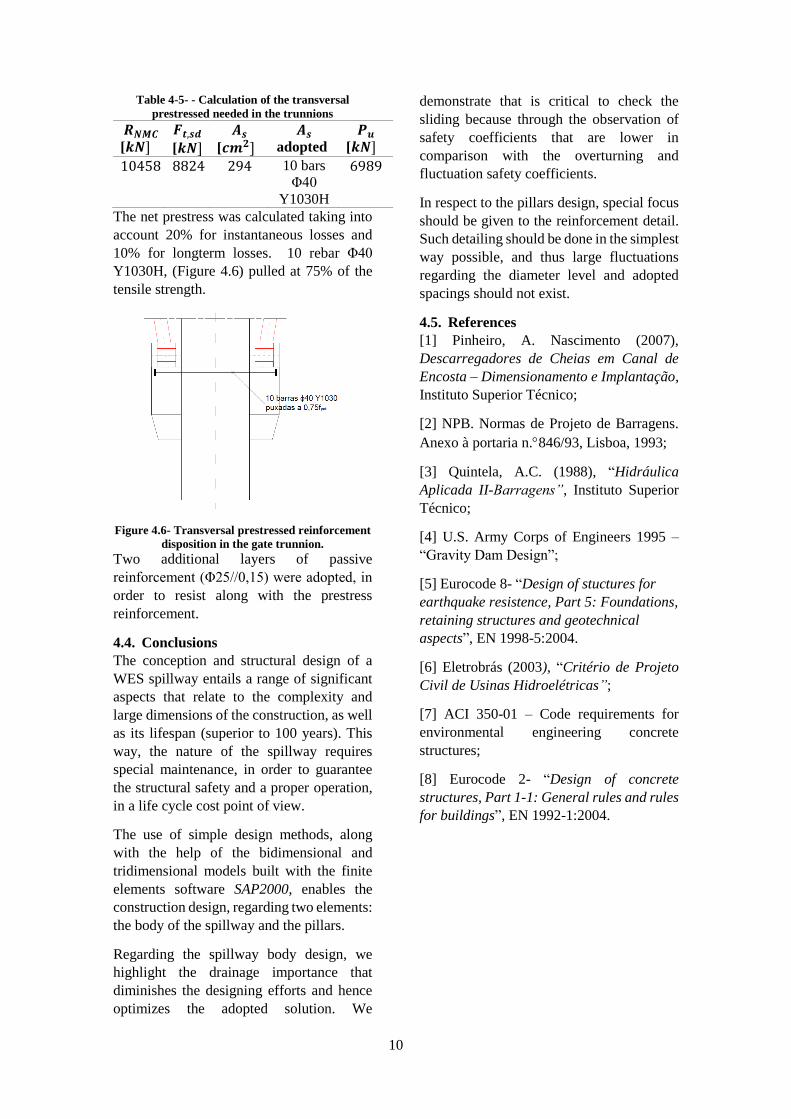
The net prestress was calculated taking into
account 20% for instantaneous losses and
10% for longterm losses. 10 rebar Φ40
Y1030H, (Figure 4.6) pulled at 75% of the
tensile strength.
Figure 4.6- Transversal prestressed reinforcement
disposition in the gate trunnion.
Two additional layers of passive
reinforcement (Φ25//0,15) were adopted, in
order to resist along with the prestress
reinforcement.
4.4. Conclusions
The conception and structural design of a
WES spillway entails a range of significant
aspects that relate to the complexity and
large dimensions of the construction, as well
as its lifespan (superior to 100 years). This
way, the nature of the spillway requires
special maintenance, in order to guarantee
the structural safety and a proper operation,
in a life cycle cost point of view.
The use of simple design methods, along
with the help of the bidimensional and
tridimensional models built with the finite
elements software SAP2000, enables the
construction design, regarding two elements:
the body of the spillway and the pillars.
Regarding the spillway body design, we
highlight the drainage importance that
diminishes the designing efforts and hence
optimizes the adopted solution. We
demonstrate that is critical to check the
sliding because through the observation of
safety coefficients that are lower in
comparison with the overturning and
fluctuation safety coefficients.
In respect to the pillars design, special focus
should be given to the reinforcement detail.
Such detailing should be done in the simplest
way possible, and thus large fluctuations
regarding the diameter level and adopted
spacings should not exist.
4.5. References
[1] Pinheiro, A. Nascimento (2007),
Descarregadores de Cheias em Canal de
Encosta – Dimensionamento e Implantação,
Instituto Superior Técnico;
[2] NPB. Normas de Projeto de Barragens.
Anexo à portaria n.846/93, Lisboa, 1993;
[3] Quintela, A.C. (1988), “Hidráulica
Aplicada II-Barragens”, Instituto Superior
Técnico;
[4] U.S. Army Corps of Engineers 1995 –
“Gravity Dam Design”;
[5] Eurocode 8- “Design of stuctures for
earthquake resistence, Part 5: Foundations,
retaining structures and geotechnical
aspects”, EN 1998-5:2004.
[6] Eletrobrás (2003), “Critério de Projeto
Civil de Usinas Hidroelétricas”;
[7] ACI 350-01 – Code requirements for
environmental engineering concrete
structures;
[8] Eurocode 2- “Design of concrete
structures, Part 1-1: General rules and rules
for buildings”, EN 1992-1:2004.