Embed Size (px)
Citation preview

©2020 Warehousing Education and Research Council
SampCo Distribution
Warehouse CertificationAuditor’s Assessment Report
Findings PresentationFebruary 17, 2020

©2020 Warehousing Education and Research Council©2020 Warehousing Education and Research Council
Rights and Confidentiality
• SampCo entered into a License Agreement with WERC concerning the CertificationProgram and use of the WERC® Certified WarehouseSM certification mark. At thispoint, SampCo is considered a Licensee.
• The contents of this warehouse certification Auditor’s Assessment Report areconfidential, and are not to be distributed by WERC to any party outside of theparticipant organizations. The Licensee facility has full right to distribute this reportinternally and externally for its own purposes
• Neither the Auditor nor WERC shall make any public comments on the status of thisreport, or a particular warehouse facility, except to note whether the warehouseappears in the Certification Program Directory.
2

©2020 Warehousing Education and Research Council©2020 Warehousing Education and Research Council
Agenda
• Stakeholders & Objectives
• Methodology
• Results
• Wrap Up & Next Steps
3

Stakeholders and Objectives

©2020 Warehousing Education and Research Council©2020 Warehousing Education and Research Council
Stakeholders
• Lead Auditor – John B. Jones, Audit Firm Company• SampCo Lead Contact – Robert Smith, VP Distribution
• Key Functional Area Contacts• Roger Edwards – Receiving Manager• George Weaver – Quality Assurance• Eduardo Sanchez – Stores Manager• Lisa Robertson – Picking Supervisor• Shawn Jenkins – Shipping Supervisor
5

©2020 Warehousing Education and Research Council©2020 Warehousing Education and Research Council
Objectives
• Present the result of the process assessment andcertification audit
• Review the assessment methodology and processes covered• Clarify any questions
• Review the detailed results of the qualitative assessment• A guide to understanding the detailed report• Discuss Auditor’s Notes• Clarify any questions
• Discuss options for building on the value of the certificationprocess
6

Methodology

©2020 Warehousing Education and Research Council©2020 Warehousing Education and Research Council
Overview of Approach• Conduct a qualitative assessment of facility
processes and procedures against the WERCWarehousing & Fulfillment Process & BestPractices Guide 2016 Edition
• Provide Certification scoring against minimumacceptable practices level benchmarks definedby industry subject matter experts
• Develop a gap analysis of current practicesagainst established five point scale of industrypractice levels
8

©2020 Warehousing Education and Research Council©2020 Warehousing Education and Research Council
Process Assessment Framework• The WERC Warehousing &
Fulfillment Processes & BestPractices Guide is used asthe basis for all areas to begraded.
• The Guide rates 8 mainwarehouse Functions brokendown by Process Area.
• There are a total of 119Process Attributes availableto grade.
9
Process
Group
Poor
Practice
1
Bad
Practice
2
Common
Practice
3
Good
Practice
4
Best
Practice
5
Warehouse
personnel have
little or no access
to shipment data
before arrival
Shippers and
carriers supply
inbound shipment
information on a
limited basis
Warehouse
personnel can get
information on
inbound shipments
on demand only
Warehouse
personnel receive
data on inbound
shipment
information from
shippers and
carriers
Warehouse
personnel and
systems use
inbound shipment
status for planning
operations in
hourly segments
Little or no effort
to get information
about inbound
deliveries
Shippers and
carriers may notify
of pending
deliveries, but
times not
scheduled
Receiving
appointments
manually tendered,
shippers given
broad delivery
window
Manual scheduling
of deliveries to
maximize
utilization of
available labor and
dock space.
Shippers given a
delivery time in
hours and minutes
Dock appointments
are made and
systems are used
to manage and
monitor that
appointments are
kept
Dock/Yard
Management
Practices whichare consideredto provide littlevalue.
ProcessAttribute
Practicesto beavoided
Practices which are commonlyseen and used – while theymay provide added value theyleave room for improvement
Practices which providesignificant added value, andmay be fully satisfactory formost businesses
Recognized best practices for thegiven attribute – note that the bestpractice may vary across industries,geographies and business units
ProcessArea

©2020 Warehousing Education and Research Council©2020 Warehousing Education and Research Council
Process
Group
Poor
Practice
1
Bad
Practice
2
Common
Practice
3
Good
Practice
4
Best
Practice
5
Min
imu
mV
alu
e
Warehouse
personnel have
little or no access
to shipment data
before arrival
Shippers and
carriers supply
inbound shipment
information on a
limited basis
Warehouse
personnel can get
information on
inbound shipments
on demand only
Warehouse
personnel receive
data on inbound
shipment
information from
shippers and
carriers
Warehouse
personnel and
systems use
inbound shipment
status for planning
operations in
hourly segments
3
Little or no effort
to get information
about inbound
deliveries
Shippers and
carriers may notify
of pending
deliveries, but
times not
scheduled
Receiving
appointments
manually tendered,
shippers given
broad delivery
window
Manual scheduling
of deliveries to
maximize
utilization of
available labor and
dock space.
Shippers given a
delivery time in
hours and minutes
Dock appointments
are made and
systems are used
to manage and
monitor that
appointments are
kept
3
Dock/Yard
Management
Process Assessment Framework• Using the 5 point Grading Scale’s
attribute process level descriptions,the WERC team of Subject MatterExperts have developed a “MinimumAcceptable Score” for each of the119 attributes.
• Certification is based on meeting atleast the minimum acceptable valuefor all selected* attributes.
10
* Specific Attributes may be omitted if not applicable to the facility

©2020 Warehousing Education and Research Council©2020 Warehousing Education and Research Council 11
MethodologyWe Ask a Lot of Questions…
• Utilizing the Guide and our Grading Tool, the Auditor interviewed team membersfrom all appropriate functional departments/areas at SampCo:
• Team members were interviewed in their work environment
• Current practices and qualitative results were witnessed
• Examples and data where available were examined
• At the end of each interview session, the individual was asked what they wouldrequest if they could be granted up to three “wishes”
• The only restriction was that the wishes be used to improve workingconditions and efficiency
• Upon completion of the interviews, the Auditor selected the appropriate descriptivecomments and rated the practices according to the scale in the Guide
• The Auditor inserted notes into the assessment tool outlining activities witnessedand areas which could be considered for improvement

©2020 Warehousing Education and Research Council©2020 Warehousing Education and Research Council
• Processes outlined in the Guide are typical for all warehouse operations. Some industriesmay have requirements which are more stringent than others, but as previously mentionedthe WERC Certification is developed around a common set of standards.
• Practices within each process are broken down into five levels as follows:
12
MethodologyWe Grade What We Saw and Heard…
Poor
Practice
Bad
Practice
Common
Practice
Good
Practice
Best
Practice
These activities
should be avoided.
They provide no value
and may be
detrimental to
efficient, value based
operations.
These activities are
considered to provide
little value.
Practices commonly
seen and used in the
industry. While they
provide added value,
they typically leave
room for
improvement.
These are activities
which provide added
value and may be fully
satisfactory for most
businesses.
These activities have
been seen to
accompany high
performing
operations.

©2020 Warehousing Education and Research Council©2020 Warehousing Education and Research Council
Poor
Practice
Bad
Practice
Common
Practice
Good
Practice
Best
PracticeWarehouse personnel
have little or no access
to shipment data before
arrival
Shippers and carriers
supply inbound
shipment information
on a limited basis
Warehouse personnel
can get information on
inbound shipments on
demand only
Warehouse personnel
receive data on inbound
shipment information
from shippers and
carriers
Warehouse personnel
and systems use
inbound shipment
status for planning
operations in hourly
segments
Audited
Score3
Minimum
Acceptable3
These are Auditor notes entered into the Excel tool and linked
directly to the presentation eliminating redundant data entry.
Grading Example
Auditor’s Notes Regarding this Functional Attribute Outlining HowWork is Done and Possible Considerations for Process Improvement
Auditor’s Grade andMinimum Acceptable
13
PassedFailed

©2020 Warehousing Education and Research Council©2020 Warehousing Education and Research Council
Grading SummaryGap AnalysisThe table below represents the WERC Standardized Grading Level for each section based on the gradingscale of 1-5 for each attribute, summarized by Process Group.
Below Minimum = number of processattributes measured x 1
Needs Attention = midpoint betweenBelow Minimum and Meets StandardMeets Standard = sum of SMEMinimum Allowable for the section
Good Practice = midpoint betweenMeets Standard and Best Practice
Best Practice = number of processattributes measured x 5 X 90%
14
Process GroupBelow
Minimum
Needs
Attention
Meets
Standard
Good
Practice
Best
Practice
Receiving and Inspection 14.0 26.0 38.0 50.5 63.0
Material Handling & Putaway 17.0 34.0 51.0 63.8 76.5
Slotting 9.0 18.0 27.0 33.8 40.5
Storage & Inventory Control 16.0 31.0 46.0 59.0 72.0
Picking & Packing 17.0 35.0 53.0 64.8 76.5
Load Consolidation & Shipping 18.0 34.5 51.0 66.0 81.0
Shipping Documentation 10.0 20.0 30.0 37.5 45.0
Warehouse Management System 18.0 33.0 48.0 64.5 81.0
Comparable Base Scores Gap Analysis

©2020 Warehousing Education and Research Council©2020 Warehousing Education and Research Council
Focus Your Efforts!Best-in-Class Companies Are Like Decathletes
Top ranking athletes compete across a set of events• Accumulate the most points among all events
• Win some events, but not all
• Know their own strengths and weaknesses
• Know the strengths and weaknesses of competitors
• Focus training first on events that match their relative strengths& events which they feel they can or must win
• Spend remainder of training time and energy on the remainingevents to assure they are minimally competitive in all events
Top ranking companies across their processes• Beat competitors in most areas, perhaps not all
• Are not best-in-class in every performance category, but win inareas that match their strategies and priorities
• Know their own competencies, strengths, and weaknesses
• Likewise, know the same about their competitors
• Spend most of their resources in those areas in which they mustexcel (in accordance with competitive knowledge, customer andstakeholder requirements, and business strategies)
• Are minimally competitive in every performance categorySource: Performance Measurement Group
15

Results

©2020 Warehousing Education and Research Council©2020 Warehousing Education and Research Council
Process Assessment ResultsThe Auditor’s assessment has yielded a determination as follows:
17

©2020 Warehousing Education and Research Council©2020 Warehousing Education and Research Council
The table below shows SampCo’s assessment findings summarized by key process group.
• Note that each of the eight process sections meets Minimum Allowable Aggregate Total grade guidelines, as does theAssessment Summary Total. However the distribution of practices in the “Poor” to “Common” columns indicates that there is likelyroom for improvement. Further analysis of individual Attributes within each section is presented in Appendix 1.
Process Assessment SummaryHigh Level Results
18
Process GroupPoor
Practice
Bad
Practice
Common
Practice
Good
Practice
Best
Practice
Receiving and Inspection 0 2 10 2 0 42 41
Material Handling & Putaway 0 0 17 0 0 51 51
Slotting 0 0 9 0 0 27 27
Storage & Inventory Control 0 1 15 0 0 47 46
Picking & Packing 0 0 15 2 0 53 53
Load Consolidation & Shipping 1 0 17 0 0 52 51
Shipping Documentation 0 0 10 0 0 30 30
Warehouse Management System 0 0 18 0 0 54 48
Assessment Summary 1 3 111 4 0 356 347
Count of Entries by Practice LevelTotal
Grade
Minimum
Allowable

©2020 Warehousing Education and Research Council©2020 Warehousing Education and Research Council
The table below shows the WERC Standardized Grading Scale for each section with SampCo’s grading levelshighlighted. This shows where the assessed grade falls with relation to the standard grading scale.
• SampCo’s assessed scores are above the minimum value for all of the 8 areas assessed. However, there are severalindividual Attributes which contain improvement considerations as shown in the Auditor’s notes. Considerationsshould be reviewed as part of an on-going process improvement strategy.
• Experience has shown that improvements in even a single area can result in significant productivity and customersatisfaction gains across many functions.
Process Assessment SummaryGap Analysis
19
Process GroupBelow
Minimum
Needs
Attention
Meets
Standard
Good
PracticeBest Practice
Receiving and Inspection 14.0 27.5 41.0 52.0 63.0
Material Handling & Putaway 17.0 34.0 51.0 63.8 76.5
Slotting 9.0 18.0 27.0 33.8 40.5
Storage & Inventory Control 16.0 31.0 46.0 59.0 72.0
Picking & Packing 17.0 35.0 53.0 64.8 76.5
Load Consolidation & Shipping 18.0 34.5 51.0 66.0 81.0
Shipping Documentation 10.0 20.0 30.0 37.5 45.0
Warehouse Management System 18.0 33.0 48.0 64.5 81.0
Comparable Base Scores Gap Analysis

©2020 Warehousing Education and Research Council©2020 Warehousing Education and Research Council
Three Wishes Summary
20
0 1 2 3
O T HER NO T CL A S S I F I ED
WO R KI NG CO NDI T I O NS ( EHS )
R OL ES & R ES PO NS I B I L I T I ES
T EA M T R A I NI NG
CR O S S G R O U P ( I B P - S & O P)
S U PPL I ER S ( PR O DU CT /T R A NS )
EQ U I PM ENT ( M A T ' HA NDL I NG )
CO M M U NI CA T I O NS
F A CI L I T I ES ( B L DG , R A CK , Y A R D)
S T R A T EG Y & VI S I O N
B U S I NES S ( CU S T O M ER S )
I T S Y S T EM S ( ER P, WM S , ET C. )
• A part of our interviewprocess is to ask therespondents what theywould ask for if theyhad “3 Wishes”.
• We grouped theresponses intocategories as shownbelow. Details ofresponses are shownon the following slides.

©2020 Warehousing Education and Research Council©2020 Warehousing Education and Research Council
Three Wishes SummaryDetail of the responses we received:
• Roles & Responsibilities• Break down the silos to assure that everyone sees the whole picture and acts as a
unit• Cross educate departments on roles & resp to promote better communication &
actions• Cross Group (IBP - S&OP)
• Eliminate physical and technology barriers between the different groups withinaffiliates
• Resolve procedural conflicts between different organizations• Facilities (Bldg, Rack, Yard)
• Expand facility• More racking
• IT Systems (ERP, WMS, Etc.)• Adequate budget for productivity improvements in fulfillment hardware and software• One central location for all information on a given order, including shipping info
• Business (Customers)• Increase our business by making our service offering more cost competitive• Expand our marketplace geographically to serve new customers
21

©2020 Warehousing Education and Research Council©2020 Warehousing Education and Research Council
• Working Conditions (EHS)
• Make flex time and telecommuting available for associates to improve morale
• Recognition and remuneration commensurate with responsibilities and achievement
• Communications
• Improve communication within and across departments in EQL to avoid confusion & rework
• Enhance our brand awareness and recognition in the community
• Other Not Classified
• Improved collaborative forecasting with customers
• Configure forecasting tools to do all necessary manipulations, and eliminate add-ons
• Suppliers (Product/Trans)
• Work with sourcing and customer support to require the use of contracted suppliers
• Team Training
• Better training of field personnel on internal systems to avoid kick-outs & rework
• Strategy & Vision
• Clearly articulated corporate strategy with specific impacts on all departments
• Equipment (Mat' Handling)
• Make budget available for facility upgrades that have ROI
Three Wishes Summary
22

Wrap Up and Next Steps

©2020 Warehousing Education and Research Council©2020 Warehousing Education and Research Council
Next Steps
• Having achieved certification, SampCo can nowfocus on reviewing areas where there may beopportunities to further improve its operations.
• WERC recommends that SampCo consider thehigh level gap shown on Slide 18, and thedetailed audit scoring by Process Attribute inAppendix 1 to understand the areas whereinvestments in process improvements may bejustified by return on time and dollars.
24

©2020 Warehousing Education and Research Council©2020 Warehousing Education and Research Council
Set Improvement Targets
• The Summary shows SampCo’spercentage scoring for each ofthe 8 Sections based on achievedvs. maximum attainable forselected Attributes
• This can help to judge strong andweak areas for potentialimprovement projects and forcomparison to other facilities.
25
62.4% Picking & Packing
60.0% Slotting
60.0% Material Handling & Putaway
60.0% Warehouse Management System
60.0% Shipping Documentation
57.8% Load Consolidation & Shipping
58.8% Storage & Inventory Control
60.0% Receiving and Inspection
59.8% Assessment Summary
Attained % Process Group

©2020 Warehousing Education and Research Council©2020 Warehousing Education and Research Council
Assessment Change 20XX-20XX
26
60.0%
60.0%
60.0%
58.8%
62.4%
57.8%
60.0%
60.0%
54.3%
60.0%
60.0%
58.8%
62.4%
57.8%
60.0%
60.0%
50% 55% 60% 65%
Receiving and Inspection
Material Handling & Putaway
Slotting
Storage & Inventory Control
Picking & Packing
Load Consolidation & Shipping
Shipping Documentation
Warehouse Management System
Prior Current
©2020 Warehousing Education and Research Council©2020 Warehousing Education and Research Council
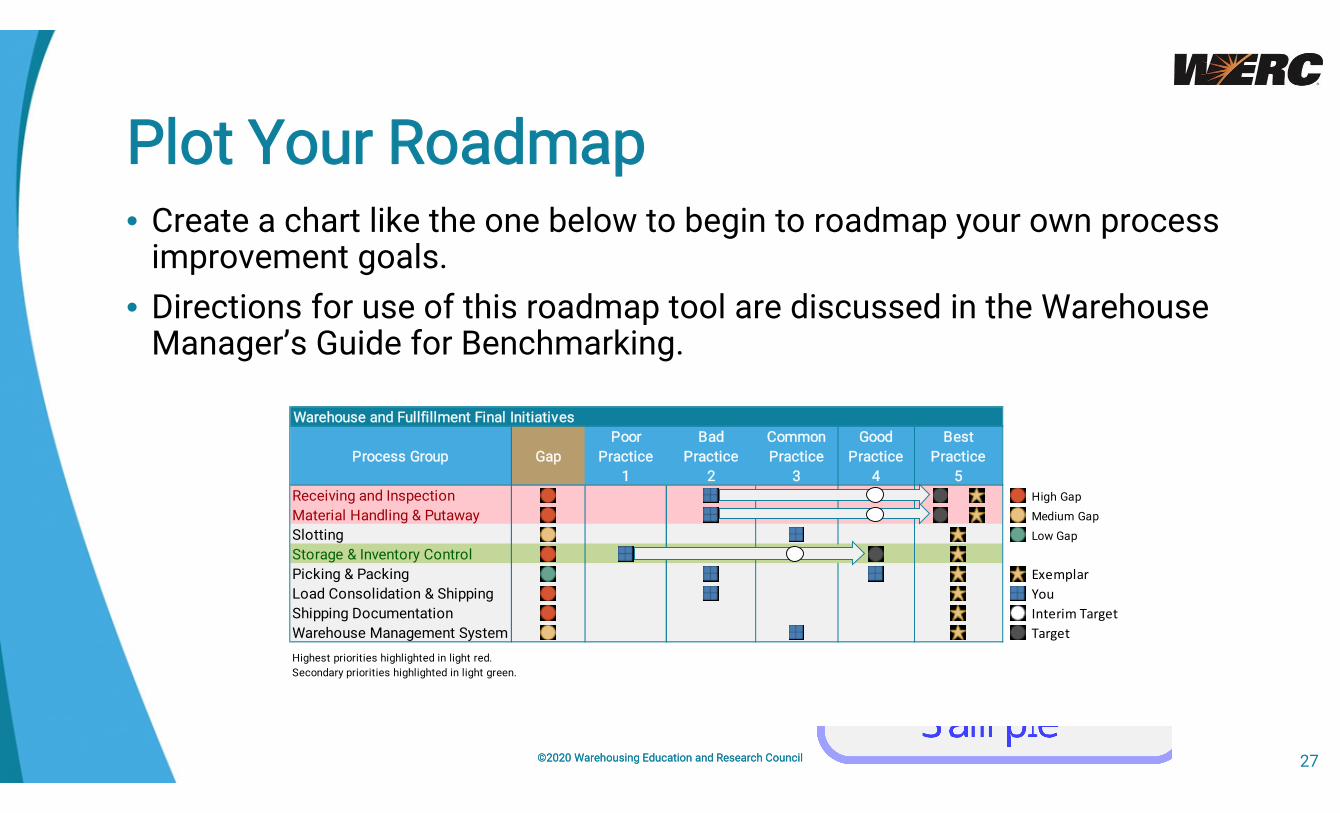
Plot Your Roadmap• Create a chart like the one below to begin to roadmap your own process
improvement goals.
• Directions for use of this roadmap tool are discussed in the WarehouseManager’s Guide for Benchmarking.
27
Process Group Gap
Poor
Practice
1
Bad
Practice
2
Common
Practice
3
Good
Practice
4
Receiving and Inspection High Gap
Material Handling & Putaway Medium Gap
Slotting Low Gap
Storage & Inventory Control
Picking & Packing Exemplar
Load Consolidation & Shipping You
Shipping Documentation Interim Target
Warehouse Management System Target
Secondary priorities highlighted in light green.
Highest priorities highlighted in light red.
Warehouse and Fullfillment Final Initiatives
Best
Practice
5

©2020 Warehousing Education and Research Council©2020 Warehousing Education and Research Council
Quantitative Benchmarking• In addition to this qualitative assessment of warehousing processes, WERC believes
that each facility should regularly benchmark its operations quantitatively against itsown earlier metrics as well as any available industry or competitive benchmarks.
The benefits of doing regular benchmarking are:• Provides insight into how a facility compares to others in its industry
• Provides a yardstick to measure performance improvement over time
• Helps guard against a possible degradation of operational efficiency
• May be necessary to comply with specific client requirements
• Can be useful for self promotion during sales opportunities
• Such on-going process improvement can be used to determine the level of excellenceSampCo wants to perform at, and develop a list of “Improvement Initiatives” and a“Roadmap” showing how those improvements will be implemented.
28

©2020 Warehousing Education and Research Council©2020 Warehousing Education and Research Council
Resources
• The current WERC Annual Study of DC Metricsis available on the WERC Website athttps://werc.org/page/DCMeasures.
• Sources for education, publications and on-siteguidance, as well as a Vendor Locator whichcan be used to identify consultants and productvendors which address warehouse processes toassist in the development and implementationof improvements are available to WERCmembers through the Quick Links dropdown ontheir member profile at www.werc.org
• Note that WERC is a research and educationassociation and does not directly provide norrecommend specific warehousing products,technology or consulting services.
29

©2020 Warehousing Education and Research Council©2020 Warehousing Education and Research Council
Re-Certification
30
• Finally, to maintain the WERCCertification a facility must be re-certified at least every three years.
• Re-certification for this facility isrequired by Month DD, 20YY.
• WERC will contact SampCo threemonths prior to the re-certificationdeadline to begin the process ofscheduling an audit.

©2020 Warehousing Education and Research Council©2020 Warehousing Education and Research Council
Appendix 1Detailed Assessment Results
31

©2020 Warehousing Education and Research Council©2020 Warehousing Education and Research Council
General Notes
32
Comments and Observations
None at this time.

©2020 Warehousing Education and Research Council©2020 Warehousing Education and Research Council
Receiving and Inspection
33
Poor
Practice
Bad
Practice
Common
Practice
Good
Practice
Best
PracticeWarehouse personnel
have little or no access
to shipment data before
arrival
Shippers and carriers
supply inbound
shipment information
on a limited basis
Warehouse personnel
can get information on
inbound shipments on
demand only
Warehouse personnel
receive data on inbound
shipment information
from shippers and
carriers
Warehouse personnel
and systems use
inbound shipment
status for planning
operations in hourly
segments
Audited
Score3
Minimum
Acceptable3
These are Auditor notes entered into the Excel tool and linked
directly to the presentation eliminating redundant data entry.
R&I-01 Inbound Visibility - Dock/Yard Management
NOTE: The scoring for each of the 119 processes will be listed in the actual report as demonstrated in this slide.This sample report only lists one of the processes for demonstration purposes.

©2020 Warehousing Education and Research Council