Embed Size (px)
Citation preview
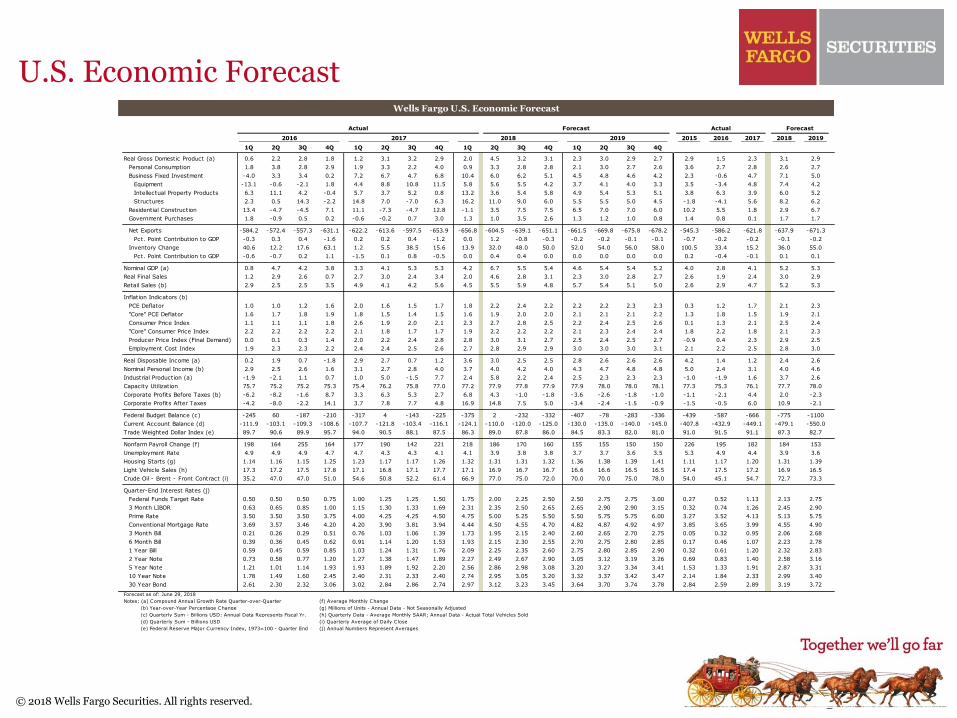
U.S. Economic Forecast
© 2018 Wells Fargo Securities. All rights reserved.
Wells Fargo U.S. Economic Forecast
Q4 2010 q220182018
2015 2016 2017 2018 2019
1Q 2Q 3Q 4Q 1Q 2Q 3Q 4Q 1Q 2Q 3Q 4Q 1Q 2Q 3Q 4Qq22018 #### #### #### #### ## ## #### ####
Real Gross Domestic Product (a) 0.6 2.2 2.8 1.8 1.2 3.1 3.2 2.9 2.0 q22018 4.5 3.2 3.1 2.3 3.0 2.9 2.7 2.9 #### #### 1.5 #### #### 2.3 ## ## 3.1 #### #### 2.9
Personal Consumption 1.8 3.8 2.8 2.9 1.9 3.3 2.2 4.0 0.9 q22018 3.3 2.8 2.8 2.1 3.0 2.7 2.6 3.6 #### #### 2.7 #### #### 2.8 ## ## 2.6 #### #### 2.7
Business Fixed Investment -4.0 3.3 3.4 0.2 7.2 6.7 4.7 6.8 10.4 q22018 6.0 6.2 5.1 4.5 4.8 4.6 4.2 2.3 #### #### -0.6 #### #### 4.7 ## ## 7.1 #### #### 5.0
Equipment -13.1 -0.6 -2.1 1.8 4.4 8.8 10.8 11.5 5.8 q22018 5.6 5.5 4.2 3.7 4.1 4.0 3.3 3.5 #### #### -3.4 #### #### 4.8 ## ## 7.4 #### #### 4.2
Intellectual Property Products 6.3 11.1 4.2 -0.4 5.7 3.7 5.2 0.8 13.2 q22018 3.6 5.4 5.8 4.9 5.4 5.3 5.1 3.8 #### #### 6.3 #### #### 3.9 ## ## 6.0 #### #### 5.2
Structures 2.3 0.5 14.3 -2.2 14.8 7.0 -7.0 6.3 16.2 q22018 11.0 9.0 6.0 5.5 5.5 5.0 4.5 -1.8 #### #### -4.1 #### #### 5.6 ## ## 8.2 #### #### 6.2
Residential Construction 13.4 -4.7 -4.5 7.1 11.1 -7.3 -4.7 12.8 -1.1 q22018 3.5 7.5 7.5 6.5 7.0 7.0 6.0 10.2 #### #### 5.5 #### #### 1.8 ## ## 2.9 #### #### 6.7
Government Purchases 1.8 -0.9 0.5 0.2 -0.6 -0.2 0.7 3.0 1.3 q22018 1.0 3.5 2.6 1.3 1.2 1.0 0.8 1.4 #### #### 0.8 #### #### 0.1 ## ## 1.7 #### #### 1.7q22018 #### #### #### #### ## ## #### ####
q22018 #### #### #### #### ## ## #### ####
Net Exports -584.2 -572.4 -557.3 -631.1 -622.2 -613.6 -597.5 -653.9 -656.8 q22018 -604.5 -639.1 -651.1 -661.5 -669.8 -675.8 -678.2 -545.3 #### #### -586.2 #### #### -621.8 ## ## -637.9 #### #### -671.3
Pct. Point Contribution to GDP -0.3 0.3 0.4 -1.6 0.2 0.2 0.4 -1.2 0.0 q22018 1.2 -0.8 -0.3 -0.2 -0.2 -0.1 -0.1 -0.7 #### #### -0.2 #### #### -0.2 ## ## -0.1 #### #### -0.2
Inventory Change 40.6 12.2 17.6 63.1 1.2 5.5 38.5 15.6 13.9 q22018 32.0 48.0 50.0 52.0 54.0 56.0 58.0 100.5 #### #### 33.4 #### #### 15.2 ## ## 36.0 #### #### 55.0
Pct. Point Contribution to GDP -0.6 -0.7 0.2 1.1 -1.5 0.1 0.8 -0.5 0.0 q22018 0.4 0.4 0.0 0.0 0.0 0.0 0.0 0.2 #### #### -0.4 #### #### -0.1 ## ## 0.1 #### #### 0.1q22018 #### #### #### #### ## ## #### ####
q22018 #### #### #### #### ## ## #### ####
Nominal GDP (a) 0.8 4.7 4.2 3.8 3.3 4.1 5.3 5.3 4.2 q22018 6.7 5.5 5.4 4.6 5.4 5.4 5.2 4.0 #### #### 2.8 #### #### 4.1 ## ## 5.2 #### #### 5.3
Real Final Sales 1.2 2.9 2.6 0.7 2.7 3.0 2.4 3.4 2.0 q22018 4.6 2.8 3.1 2.3 3.0 2.8 2.7 2.6 #### #### 1.9 #### #### 2.4 ## ## 3.0 #### #### 2.9
Retail Sales (b) 2.9 2.5 2.5 3.5 4.9 4.1 4.2 5.6 4.5 q22018 5.5 5.9 4.8 5.7 5.4 5.1 5.0 2.6 #### #### 2.9 #### #### 4.7 ## ## 5.2 #### #### 5.3q22018 #### #### #### #### ## ## #### ####
q22018 #### #### #### #### ## ## #### ####
Inflation Indicators (b) q22018 #### #### #### #### ## ## #### ####
PCE Deflator 1.0 1.0 1.2 1.6 2.0 1.6 1.5 1.7 1.8 q22018 2.2 2.4 2.2 2.2 2.2 2.3 2.3 0.3 #### #### 1.2 #### #### 1.7 ## ## 2.1 #### #### 2.3
"Core" PCE Deflator 1.6 1.7 1.8 1.9 1.8 1.5 1.4 1.5 1.6 q22018 1.9 2.0 2.0 2.1 2.1 2.1 2.2 1.3 #### #### 1.8 #### #### 1.5 ## ## 1.9 #### #### 2.1
Consumer Price Index 1.1 1.1 1.1 1.8 2.6 1.9 2.0 2.1 2.3 q22018 2.7 2.8 2.5 2.2 2.4 2.5 2.6 0.1 #### #### 1.3 #### #### 2.1 ## ## 2.5 #### #### 2.4
"Core" Consumer Price Index 2.2 2.2 2.2 2.2 2.1 1.8 1.7 1.7 1.9 q22018 2.2 2.2 2.2 2.1 2.3 2.4 2.4 1.8 #### #### 2.2 #### #### 1.8 ## ## 2.1 #### #### 2.3
Producer Price Index (Final Demand) 0.0 0.1 0.3 1.4 2.0 2.2 2.4 2.8 2.8 q22018 3.0 3.1 2.7 2.5 2.4 2.5 2.7 -0.9 #### #### 0.4 #### #### 2.3 ## ## 2.9 #### #### 2.5
Employment Cost Index 1.9 2.3 2.3 2.2 2.4 2.4 2.5 2.6 2.7 q22018 2.8 2.9 2.9 3.0 3.0 3.0 3.1 2.1 #### #### 2.2 #### #### 2.5 ## ## 2.8 #### #### 3.0q22018 #### #### #### #### ## ## #### ####
q22018 #### #### #### #### ## ## #### ####
Real Disposable Income (a) 0.2 1.9 0.7 -1.8 2.9 2.7 0.7 1.2 3.6 q22018 3.0 2.5 2.5 2.8 2.6 2.6 2.6 4.2 #### #### 1.4 #### #### 1.2 ## ## 2.4 #### #### 2.6
Nominal Personal Income (b) 2.9 2.5 2.6 1.6 3.1 2.7 2.8 4.0 3.7 q22018 4.0 4.2 4.0 4.3 4.7 4.8 4.8 5.0 #### #### 2.4 #### #### 3.1 ## ## 4.0 #### #### 4.6
Industrial Production (a) -1.9 -2.1 1.1 0.7 1.0 5.0 -1.5 7.7 2.4 q22018 5.8 2.2 2.4 2.5 2.3 2.3 2.3 -1.0 #### #### -1.9 #### #### 1.6 ## ## 3.7 #### #### 2.6
Capacity Utilization 75.7 75.2 75.2 75.3 75.4 76.2 75.8 77.0 77.2 q22018 77.9 77.8 77.9 77.9 78.0 78.0 78.1 77.3 #### #### 75.3 #### #### 76.1 ## ## 77.7 #### #### 78.0
Corporate Profits Before Taxes (b) -6.2 -8.2 -1.6 8.7 3.3 6.3 5.3 2.7 6.8 q22018 4.3 -1.0 -1.8 -3.6 -2.6 -1.8 -1.0 -1.1 #### #### -2.1 #### #### 4.4 ## ## 2.0 #### #### -2.3
Corporate Profits After Taxes -4.2 -8.0 -2.2 14.1 3.7 7.8 7.7 4.8 16.9 q22018 14.8 7.5 5.0 -3.4 -2.4 -1.5 -0.9 -1.5 #### #### -0.5 #### #### 6.0 ## ## 10.9 #### #### -2.1q22018 #### #### #### #### ## ## #### ####
q22018 #### #### #### #### ## ## #### ####
Federal Budget Balance (c) -245 60 -187 -210 -317 4 -143 -225 -375 q22018 2 -232 -332 -407 -78 -283 -336 -439 #### #### -587 #### #### -666 ## ## -775 #### #### -1100
Current Account Balance (d) -111.9 -103.1 -109.3 -108.6 -107.7 -121.8 -103.4 -116.1 -124.1 q22018 -110.0 -120.0 -125.0 -130.0 -135.0 -140.0 -145.0 -407.8 #### #### -432.9 #### #### -449.1 ## ## -479.1 #### #### -550.0
Trade Weighted Dollar Index (e) 89.7 90.6 89.9 95.7 94.0 90.5 88.1 87.5 86.3 q22018 89.0 87.8 86.0 84.5 83.3 82.0 81.0 91.0 #### #### 91.5 #### #### 91.1 ## ## 87.3 #### #### 82.7q22018 #### #### #### #### ## ## #### ####
q22018 #### #### #### #### ## ## #### ####
Nonfarm Payroll Change (f) 198 164 255 164 177 190 142 221 218 q22018 186 170 160 155 155 150 150 226 #### #### 195 #### #### 182 ## ## 184 #### #### 153
Unemployment Rate 4.9 4.9 4.9 4.7 4.7 4.3 4.3 4.1 4.1 q22018 3.9 3.8 3.8 3.7 3.7 3.6 3.5 5.3 #### #### 4.9 #### #### 4.4 ## ## 3.9 #### #### 3.6
Housing Starts (g) 1.14 1.16 1.15 1.25 1.23 1.17 1.17 1.26 1.32 q22018 1.31 1.31 1.32 1.36 1.38 1.39 1.41 1.11 #### #### 1.17 #### #### 1.20 ## ## 1.31 #### #### 1.39
Light Vehicle Sales (h) 17.3 17.2 17.5 17.8 17.1 16.8 17.1 17.7 17.1 q22018 16.9 16.7 16.7 16.6 16.6 16.5 16.5 17.4 #### #### 17.5 #### #### 17.2 ## ## 16.9 #### #### 16.5
Crude Oil - Brent - Front Contract (i) 35.2 47.0 47.0 51.0 54.6 50.8 52.2 61.4 66.9 q22018 77.0 75.0 72.0 70.0 70.0 75.0 78.0 54.0 #### #### 45.1 #### #### 54.7 ## ## 72.7 #### #### 73.3q22018 #### #### #### #### ## ## #### ####
q22018 #### #### #### #### ## ## #### ####
Quarter-End Interest Rates (j) q22018 #### #### #### #### ## ## #### ####
Federal Funds Target Rate 0.50 0.50 0.50 0.75 1.00 1.25 1.25 1.50 1.75 q22018 2.00 2.25 2.50 2.50 2.75 2.75 3.00 0.27 #### #### 0.52 #### #### 1.13 ## ## 2.13 #### #### 2.75
3 Month LIBOR 0.63 0.65 0.85 1.00 1.15 1.30 1.33 1.69 2.31 q22018 2.35 2.50 2.65 2.65 2.90 2.90 3.15 0.32 #### #### 0.74 #### #### 1.26 ## ## 2.45 #### #### 2.90
Prime Rate 3.50 3.50 3.50 3.75 4.00 4.25 4.25 4.50 4.75 q22018 5.00 5.25 5.50 5.50 5.75 5.75 6.00 3.27 #### #### 3.52 #### #### 4.13 ## ## 5.13 #### #### 5.75
Conventional Mortgage Rate 3.69 3.57 3.46 4.20 4.20 3.90 3.81 3.94 4.44 q22018 4.50 4.55 4.70 4.82 4.87 4.92 4.97 3.85 #### #### 3.65 #### #### 3.99 ## ## 4.55 #### #### 4.90
3 Month Bill 0.21 0.26 0.29 0.51 0.76 1.03 1.06 1.39 1.73 q22018 1.95 2.15 2.40 2.60 2.65 2.70 2.75 0.05 #### #### 0.32 #### #### 0.95 ## ## 2.06 #### #### 2.68
6 Month Bill 0.39 0.36 0.45 0.62 0.91 1.14 1.20 1.53 1.93 q22018 2.15 2.30 2.55 2.70 2.75 2.80 2.85 0.17 #### #### 0.46 #### #### 1.07 ## ## 2.23 #### #### 2.78
1 Year Bill 0.59 0.45 0.59 0.85 1.03 1.24 1.31 1.76 2.09 q22018 2.25 2.35 2.60 2.75 2.80 2.85 2.90 0.32 #### #### 0.61 #### #### 1.20 ## ## 2.32 #### #### 2.83
2 Year Note 0.73 0.58 0.77 1.20 1.27 1.38 1.47 1.89 2.27 q22018 2.49 2.67 2.90 3.05 3.12 3.19 3.26 0.69 #### #### 0.83 #### #### 1.40 ## ## 2.58 #### #### 3.16
5 Year Note 1.21 1.01 1.14 1.93 1.93 1.89 1.92 2.20 2.56 q22018 2.86 2.98 3.08 3.20 3.27 3.34 3.41 1.53 #### #### 1.33 #### #### 1.91 ## ## 2.87 #### #### 3.31
10 Year Note 1.78 1.49 1.60 2.45 2.40 2.31 2.33 2.40 2.74 q22018 2.95 3.05 3.20 3.32 3.37 3.42 3.47 2.14 #### #### 1.84 #### #### 2.33 ## ## 2.99 #### #### 3.40
30 Year Bond 2.61 2.30 2.32 3.06 3.02 2.84 2.86 2.74 2.97 q22018 3.12 3.23 3.45 3.64 3.70 3.74 3.78 2.84 #### #### 2.59 #### #### 2.89 ## ## 3.19 #### #### 3.72q22018 #### #### #### #### ## ## #### ####
Forecast as of: June 29, 2018
Notes: (a) Compound Annual Growth Rate Quarter-over-Quarter (f) Average Monthly Change
(b) Year-over-Year Percentage Change (g) Millions of Units - Annual Data - Not Seasonally Adjusted
(c) Quarterly Sum - Billions USD; Annual Data Represents Fiscal Yr. (h) Quarterly Data - Average Monthly SAAR; Annual Data - Actual Total Vehicles Sold
(d) Quarterly Sum - Billions USD (i) Quarterly Average of Daily Close
(e) Federal Reserve Major Currency Index, 1973=100 - Quarter End (j) Annual Numbers Represent Averages
Actual Forecast
2017 2018 2019
Actual Forecast
2016
Wells Fargo Securities Economics Group
1
John E. Silvia [email protected]
Global Head of Research, Economics & Strategy
Diane Schumaker-Krieg ………………… ………[email protected]
Global Head of Research, Economics & Strategy
Chief Economist
Mark Vitner, Senior Economist [email protected]
Jay H. Bryson, Global Economist …[email protected]
Sam Bullard, Senior Economist [email protected]
Nick Bennenbroek, Currency Strategist [email protected]
Azhar Iqbal, Econometrician [email protected]
Tim Quinlan, Senior Economist [email protected]
Eric J. Viloria, Currency Strategist [email protected]
Sarah House, Senior Economist [email protected]
Senior Economists
Economists
Charlie Dougherty, Economist [email protected]
Erik Nelson, Currency Strategist [email protected]
Michael Pugliese, Economist [email protected]
Economic Analysts
Administrative Assistants
Wells Fargo Securities Economics Group publications are produced by Wells Fargo Securities, LLC, a U.S broker-dealer registered with the U.S. Securities and Exchange Commission, the FinancialIndustry Regulatory Authority, and the Securities Investor Protection Corp. Wells Fargo Securities, LLC, distributes these publications directly and through subsidiaries including, but not limited to,Wells Fargo & Company, Wells Fargo Bank N.A., Wells Fargo Clearing Services, LLC, Wells Fargo Securities International Limited, Wells Fargo Securities Asia Limited and Wells Fargo Securities(Japan) Co. Limited. Wells Fargo Securities, LLC. ("WFS") is registered with the Commodities Futures Trading Commission as a futures commission merchant and is a member in good standing ofthe National Futures Association. Wells Fargo Bank, N.A. ("WFBNA") is registered with the Commodities Futures Trading Commission as a swap dealer and is a member in good standing of theNational Futures Association. WFS and WFBNA are generally engaged in the trading of futures and derivative products, any of which may be discussed within this publication. Wells FargoSecurities, LLC does not compensate its research analysts based on specific investment banking transactions. Wells Fargo Securities, LLC’s research analysts receive compensation that is based uponand impacted by the overall profitability and revenue of the firm which includes, but is not limited to investment banking revenue. The information and opinions herein are for general informationuse only. Wells Fargo Securities, LLC does not guarantee their accuracy or completeness, nor does Wells Fargo Securities, LLC assume any liability for any loss that may result from the reliance byany person upon any such information or opinions. Such information and opinions are subject to change without notice, are for general information only and are not intended as an offer orsolicitation with respect to the purchase or sales of any security or as personalized investment advice. Wells Fargo Securities, LLC is a separate legal entity and distinct from affiliated banks and is awholly owned subsidiary of Wells Fargo & Company © 2018 Wells Fargo Securities, LLC.
SECURITIES: NOT FDIC-INSURED/NOT BANK-GUARANTEED/MAY LOSE VALUE
Important Information for Non-U.S. Recipients
For recipients in the EEA, this report is distributed by Wells Fargo Securities International Limited ("WFSIL"). WFSIL is a U.K. incorporated investment firm authorized and regulated by theFinancial Conduct Authority. The content of this report has been approved by WFSIL a regulated person under the Act. For purposes of the U.K. Financial Conduct Authority’s rules, this reportconstitutes impartial investment research. WFSIL does not deal with retail clients as defined in the Markets in Financial Instruments Directive 2007. The FCA rules made under the FinancialServices and Markets Act 2000 for the protection of retail clients will therefore not apply, nor will the Financial Services Compensation Scheme be available. This report is not intended for, andshould not be relied upon by, retail clients. This document and any other materials accompanying this document (collectively, the "Materials") are provided for general informational purposes only.
Donna LaFleur, Executive Assistant [email protected]
Dawne Howes, Administrative Assistant [email protected]
Harry Pershing, Economic Analyst [email protected]
Hank Carmichael, Economic Analyst [email protected]
Ariana Vaisey, Economic Analyst [email protected]
Abigail Kinnaman, Economic Analyst [email protected]
Shannon Seery, Economic Analyst [email protected]