Embed Size (px)
Citation preview

WELLS AND PUMPING (1989-2006) IN THE BARTON SPRINGS/EDWARDS AQUIFER CONSERVATION DISTRICT, CENTRAL TEXAS
BSEACD Data Series Report 2006-1005 Barton Springs/Edwards Aquifer Conservation District 1124 Regal Row Austin, Texas

Disclaimer All of the information provided in this report is believed to be accurate and reliable; however, the Barton Springs/Edwards Aquifer Conservation District (District), or its staff, assumes no responsibility for any errors or for the use of the information provided. Cover. Photographs clockwise from top left: water well drilling rig mast; “Negley” Windmill near Mountain City, in Hays County; public water supply well in the Creedmoor-Maha Water Supply Corporation well field, Travis County; domestic well in Hays County (Photographs taken by Brian B. Hunt).
BSEACD Data Series Report 2006-1005 ii

WELLS AND PUMPING (1989-2006) IN THE BARTON SPRINGS/EDWARDS AQUIFER CONSERVATION DISTRICT, CENTRAL TEXAS by Brian B. Hunt, P.G.; Brian A. Smith, Ph.D., P.G.; Kirk Holland, P.G., and Joe Beery
Kirk Holland, P.G., General Manager Board of Directors
Dr. Robert D. Larsen- President Precinct 3 Jack Goodman- Vice President Precinct 4 Craig Smith- Secretary Precinct 5 Chuck Murphy Precinct 1 Gary Franklin Precinct 2 BSEACD Data Series Report 2006-1005 Barton Springs/Edwards Aquifer Conservation District 1124 Regal Row Austin, Texas
BSEACD Data Series Report 2006-1005 iii
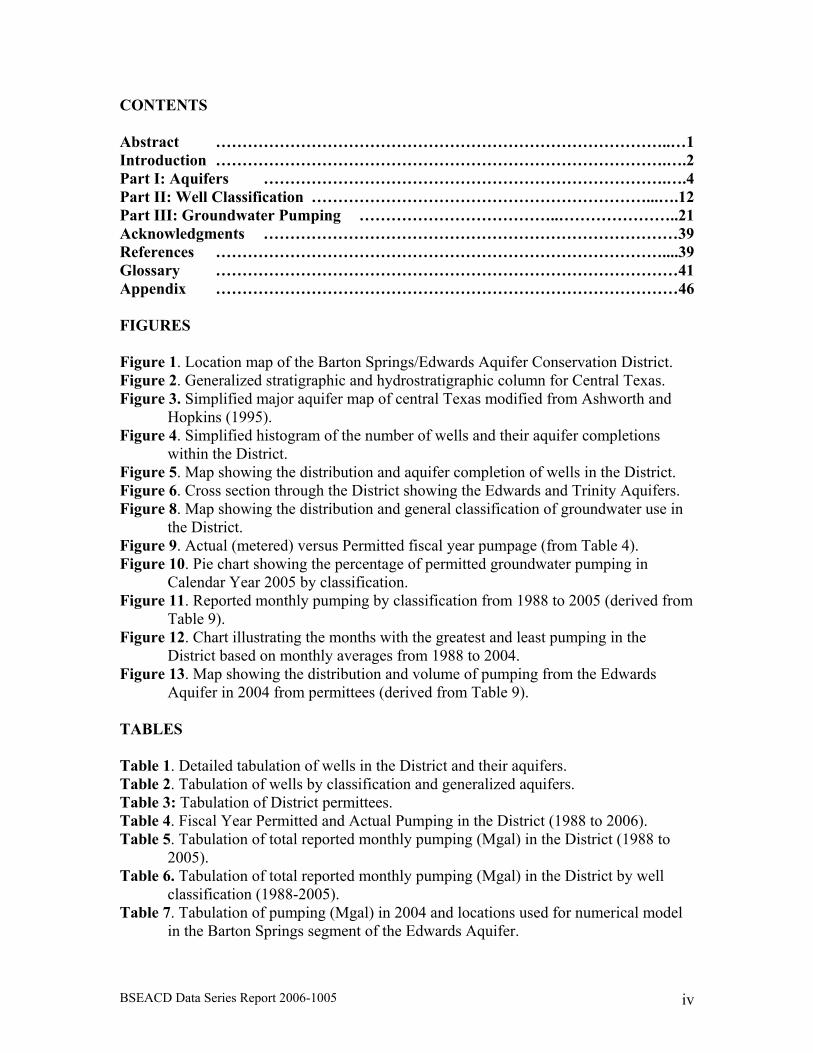
CONTENTS Abstract …………………………………………………………………………..…1 Introduction ………………………………………………………………………….….2 Part I: Aquifers ………………………………………………………………….….4 Part II: Well Classification ………………………………………………………...….12 Part III: Groundwater Pumping ………………………………..…………………..21 Acknowledgments ……………………………………………………………………39 References …………………………………………………………………………....39 Glossary ……………………………………………………………………………41 Appendix ……………………………………………………………………………46 FIGURES Figure 1. Location map of the Barton Springs/Edwards Aquifer Conservation District. Figure 2. Generalized stratigraphic and hydrostratigraphic column for Central Texas. Figure 3. Simplified major aquifer map of central Texas modified from Ashworth and
Hopkins (1995). Figure 4. Simplified histogram of the number of wells and their aquifer completions
within the District. Figure 5. Map showing the distribution and aquifer completion of wells in the District. Figure 6. Cross section through the District showing the Edwards and Trinity Aquifers. Figure 8. Map showing the distribution and general classification of groundwater use in
the District. Figure 9. Actual (metered) versus Permitted fiscal year pumpage (from Table 4). Figure 10. Pie chart showing the percentage of permitted groundwater pumping in
Calendar Year 2005 by classification. Figure 11. Reported monthly pumping by classification from 1988 to 2005 (derived from
Table 9). Figure 12. Chart illustrating the months with the greatest and least pumping in the
District based on monthly averages from 1988 to 2004. Figure 13. Map showing the distribution and volume of pumping from the Edwards
Aquifer in 2004 from permittees (derived from Table 9). TABLES Table 1. Detailed tabulation of wells in the District and their aquifers. Table 2. Tabulation of wells by classification and generalized aquifers. Table 3: Tabulation of District permittees. Table 4. Fiscal Year Permitted and Actual Pumping in the District (1988 to 2006). Table 5. Tabulation of total reported monthly pumping (Mgal) in the District (1988 to
2005). Table 6. Tabulation of total reported monthly pumping (Mgal) in the District by well
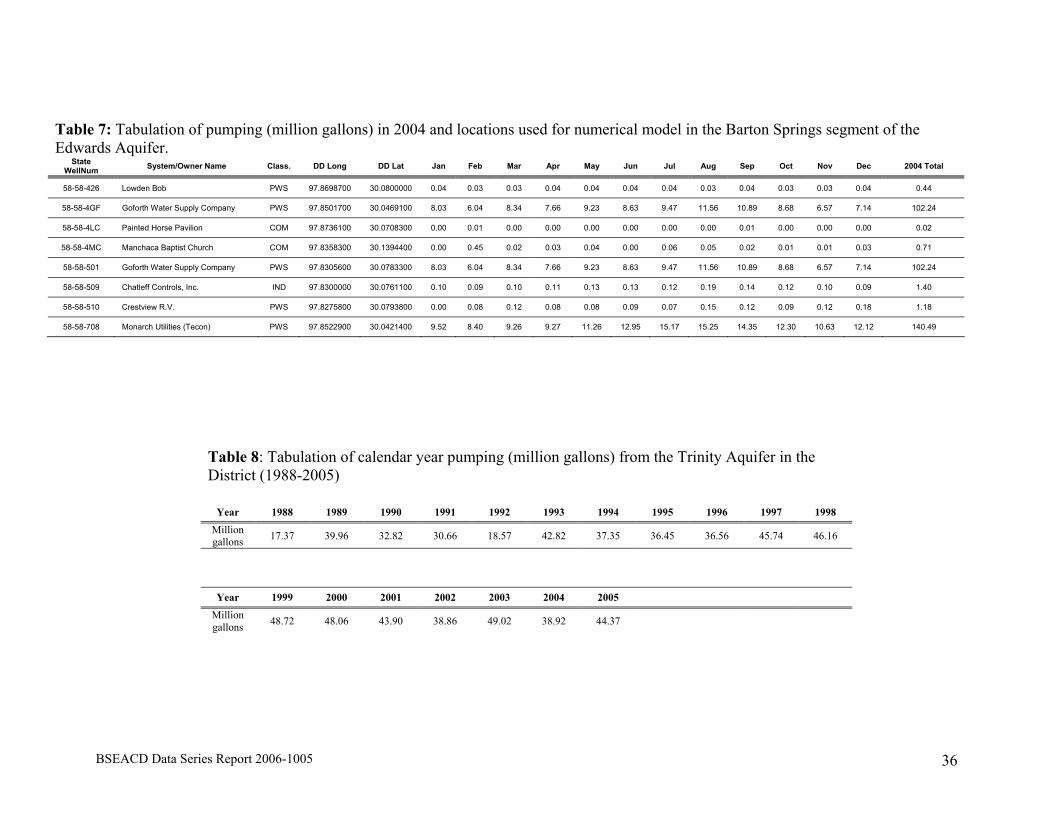
classification (1988-2005). Table 7. Tabulation of pumping (Mgal) in 2004 and locations used for numerical model
in the Barton Springs segment of the Edwards Aquifer.
BSEACD Data Series Report 2006-1005 iv

Table 8. Tabulation of yearly pumping (Mgal) from the Trinity Aquifer in the District (1988-2005)
Table 9. Synthetic monthly pumpage in the Barton Springs segment of the Edwards Aquifer, 1947-1987.
UNITS AND CONVERSIONS Volume: 1 acre-ft = 325,900 gallons 1 acre-ft = 43,560 ft3 Flow Rate: 1 ft3/s = 723.97 acre-ft/year 1 ft3/s = 235,905,352 gallons/year
BSEACD Data Series Report 2006-1005 v

WELLS AND PUMPING (1989-2006) IN THE BARTON SPRINGS/EDWARDS AQUIFER CONSERVATION DISTRICT, CENTRAL TEXAS by Brian B. Hunt, P.G.; Brian A. Smith, Ph.D., P.G.; Kirk Holland, P.G., and Joe Beery ABSTRACT The Barton Springs/Edwards Aquifer Conservation District (District) contains vital groundwater resources within its jurisdictional boundaries providing for municipal, industrial, domestic, recreational, and ecological needs. Approximately 50,000 to 60,000 people depend upon water from the Barton Springs segment of the Edwards Aquifer (Barton Springs aquifer), and the Barton Springs complex is the only known habitat for the endangered Barton Springs salamander. The Barton Springs aquifer is a prolific, karst limestone aquifer producing water for 84% of the wells in the District. The Trinity Aquifer is the second-most prolific aquifer in the District composed of limestones and sandstones, producing water for about 3% of the wells in the District. At least 9% of the total of number of wells appear to derive their water from a combination of the Edwards and Trinity Aquifers. The remaining wells in the District are completed within small localized water-bearing units that include the terrace/alluvium, Austin Chalk, igneous, and the Taylor/Navarro. The District has about 1,230 operational wells for the following purposes: domestic (71% of the wells), public-supply (9%), monitor (6%), commercial (5%), irrigation (4%), agricultural (3%), closed loop (1%), and industrial (1%). In fiscal year (FY) 2006 about 94 permittees had an annual permitted volume of 2.5 billion gallons (8,200 acre-ft/yr, 11.4 cfs). Pumpage from non-permitted wells in FY 2006 was estimated to have been about 228 million gallons. Since 1988, users have pumped between 71% to 97% of the permitted volume, depending upon climatic conditions. In FY 2006 actual and estimated (non-permitted) pumping was 2.3 billion gallons (7,070 acre-ft/yr, 9.8 cfs). In Calendar Year 2005 permittee groundwater use was 80% public water supply, 13% Industrial, 7% irrigation, and less than 1% commercial. The majority of pumping occurs in the confined, southeastern portion of the Barton Springs aquifer. Based on monthly pumping data from 1998 to 2005, peak irrigation and public water supply pumping follows seasonal trends with February having the lowest pumping totals, and August the highest pumping totals. Assuming the lowest usage months represent primarily indoor use for public supply, between 42% to 24% of the volume pumped has historically been used for outdoor use, with an average of 33%. The Trinity Aquifer supplies water to 5 permittees that pumped a total of 44.3 million gallons in 2005. This total represents about 2% of the total pumped in 2005 by all District permittees.
BSEACD Data Series Report 2006-1005 1

INTRODUCTION The Barton Springs/Edwards Aquifer Conservation District (District) contains vital groundwater resources within its jurisdictional boundaries providing for municipal, industrial, domestic, recreational, and ecological needs. Approximately 50,000 to 60,000 people depend upon water from the Barton Springs and Trinity Aquifers, and the Barton Springs complex is the only known habitat for the endangered Barton Springs salamander. Location The District is located mainly within parts of Travis and Hays Counties in Central Texas, and lies within the Balcones Fault Zone (BFZ) physiographic province. The District is generally bounded to the north by the Colorado River, to the south near the City of Kyle, and to the west by FM 1826. The eastern boundary is more irregular and extends east of IH-35 into Caldwell and Bastrop Counties (Figure 1). Purpose and Scope A statutory mandate charges the District with the responsibility of conserving, protecting, and enhancing groundwater resources. Part of this responsibility is to determine the amount of groundwater available for use in the aquifers. State law requires water planning for drought conditions and use of groundwater modeling in conjunction with other studies or data about the aquifers. The purpose of this report is to provide a foundation of data for scientific studies and planning. The scope of the report is outlined below:
• Part I provides an overview of the aquifers within the study area. • Part II characterizes well classifications and use within the District. • Part III describes and quantifies pumping from the principal aquifers in the
District. The Appendix at the end of this report contains a compact disk providing digital files of all figures and tables in this report.
BSEACD Data Series Report 2006-1005 2
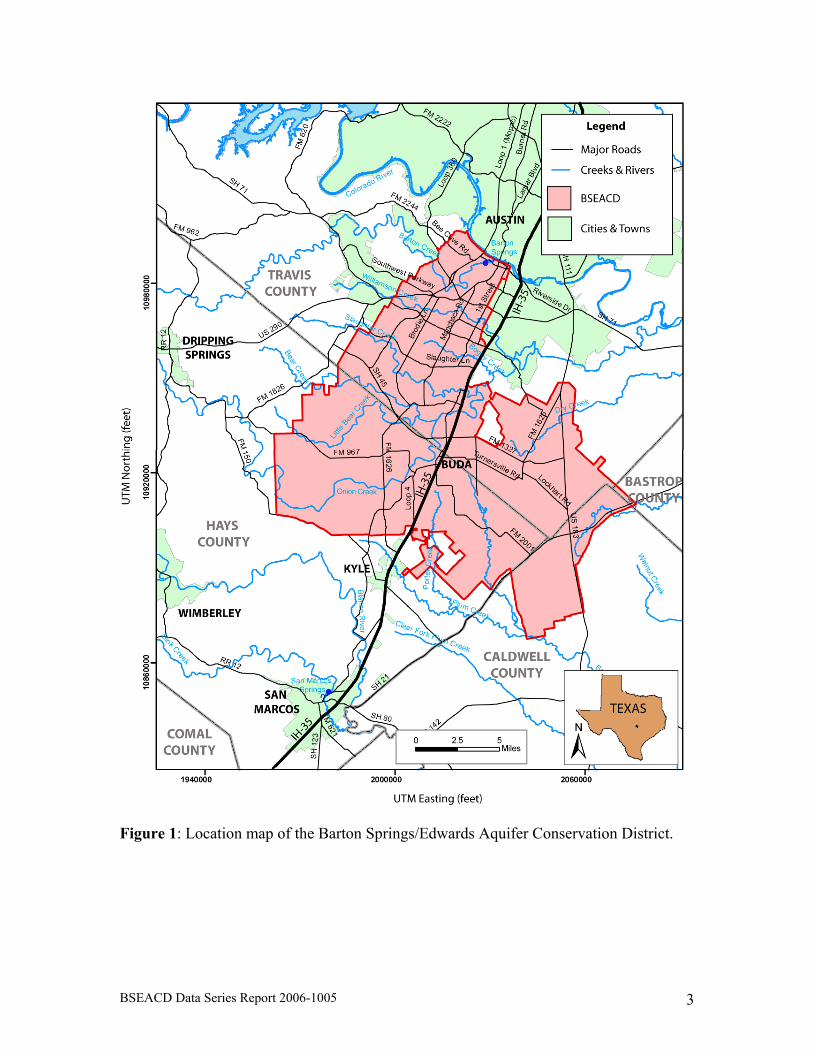
Figure 1: Location map of the Barton Springs/Edwards Aquifer Conservation District.
BSEACD Data Series Report 2006-1005 3
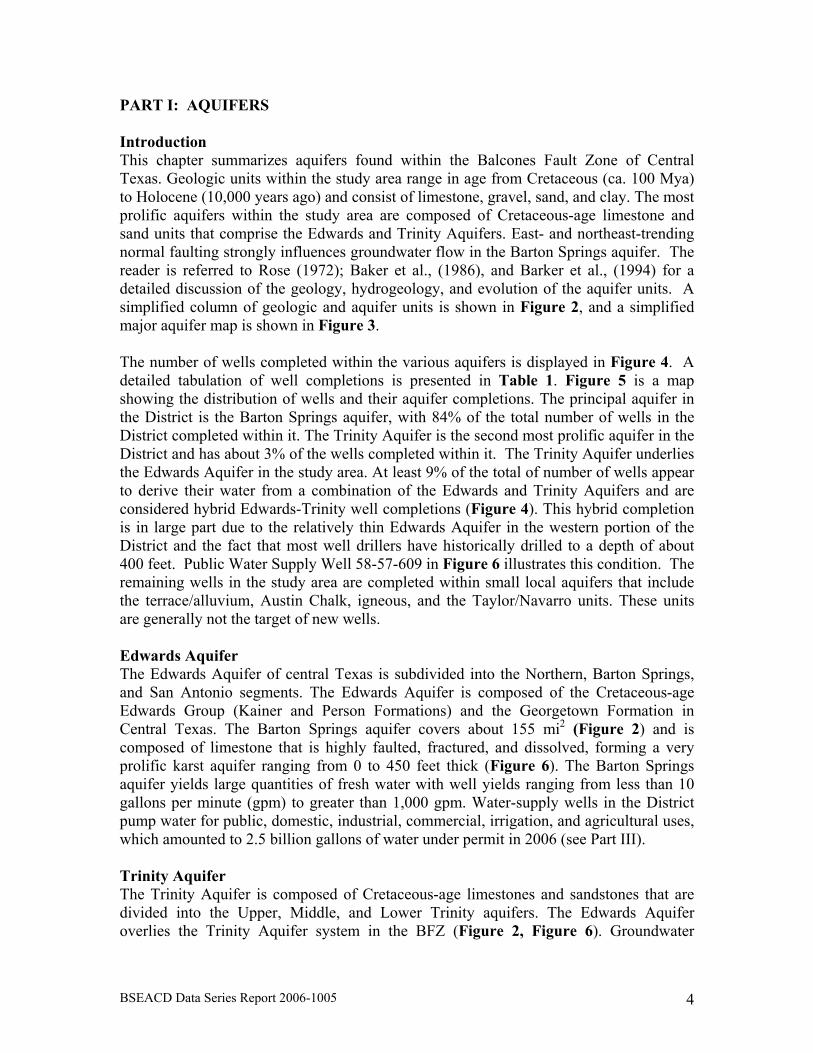
PART I: AQUIFERS Introduction This chapter summarizes aquifers found within the Balcones Fault Zone of Central Texas. Geologic units within the study area range in age from Cretaceous (ca. 100 Mya) to Holocene (10,000 years ago) and consist of limestone, gravel, sand, and clay. The most prolific aquifers within the study area are composed of Cretaceous-age limestone and sand units that comprise the Edwards and Trinity Aquifers. East- and northeast-trending normal faulting strongly influences groundwater flow in the Barton Springs aquifer. The reader is referred to Rose (1972); Baker et al., (1986), and Barker et al., (1994) for a detailed discussion of the geology, hydrogeology, and evolution of the aquifer units. A simplified column of geologic and aquifer units is shown in Figure 2, and a simplified major aquifer map is shown in Figure 3. The number of wells completed within the various aquifers is displayed in Figure 4. A detailed tabulation of well completions is presented in Table 1. Figure 5 is a map showing the distribution of wells and their aquifer completions. The principal aquifer in the District is the Barton Springs aquifer, with 84% of the total number of wells in the District completed within it. The Trinity Aquifer is the second most prolific aquifer in the District and has about 3% of the wells completed within it. The Trinity Aquifer underlies the Edwards Aquifer in the study area. At least 9% of the total of number of wells appear to derive their water from a combination of the Edwards and Trinity Aquifers and are considered hybrid Edwards-Trinity well completions (Figure 4). This hybrid completion is in large part due to the relatively thin Edwards Aquifer in the western portion of the District and the fact that most well drillers have historically drilled to a depth of about 400 feet. Public Water Supply Well 58-57-609 in Figure 6 illustrates this condition. The remaining wells in the study area are completed within small local aquifers that include the terrace/alluvium, Austin Chalk, igneous, and the Taylor/Navarro units. These units are generally not the target of new wells. Edwards Aquifer The Edwards Aquifer of central Texas is subdivided into the Northern, Barton Springs, and San Antonio segments. The Edwards Aquifer is composed of the Cretaceous-age Edwards Group (Kainer and Person Formations) and the Georgetown Formation in Central Texas. The Barton Springs aquifer covers about 155 mi2 (Figure 2) and is composed of limestone that is highly faulted, fractured, and dissolved, forming a very prolific karst aquifer ranging from 0 to 450 feet thick (Figure 6). The Barton Springs aquifer yields large quantities of fresh water with well yields ranging from less than 10 gallons per minute (gpm) to greater than 1,000 gpm. Water-supply wells in the District pump water for public, domestic, industrial, commercial, irrigation, and agricultural uses, which amounted to 2.5 billion gallons of water under permit in 2006 (see Part III). Trinity Aquifer The Trinity Aquifer is composed of Cretaceous-age limestones and sandstones that are divided into the Upper, Middle, and Lower Trinity aquifers. The Edwards Aquifer overlies the Trinity Aquifer system in the BFZ (Figure 2, Figure 6). Groundwater
BSEACD Data Series Report 2006-1005 4
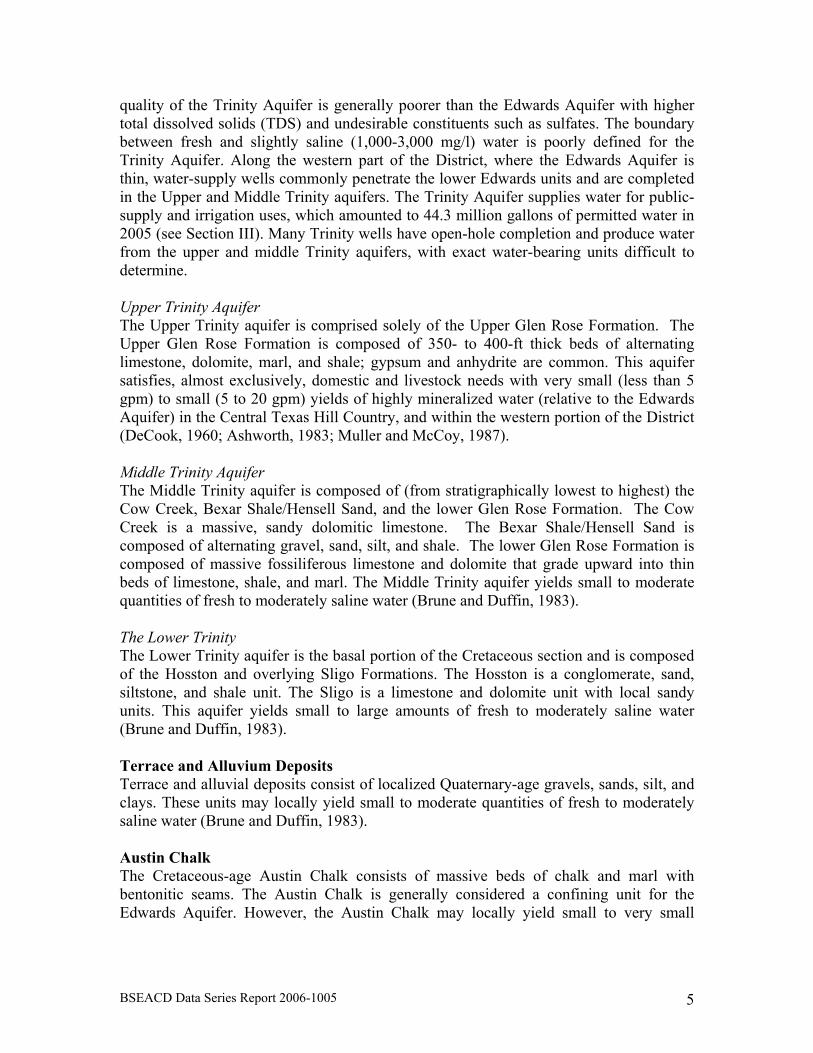
quality of the Trinity Aquifer is generally poorer than the Edwards Aquifer with higher total dissolved solids (TDS) and undesirable constituents such as sulfates. The boundary between fresh and slightly saline (1,000-3,000 mg/l) water is poorly defined for the Trinity Aquifer. Along the western part of the District, where the Edwards Aquifer is thin, water-supply wells commonly penetrate the lower Edwards units and are completed in the Upper and Middle Trinity aquifers. The Trinity Aquifer supplies water for public-supply and irrigation uses, which amounted to 44.3 million gallons of permitted water in 2005 (see Section III). Many Trinity wells have open-hole completion and produce water from the upper and middle Trinity aquifers, with exact water-bearing units difficult to determine. Upper Trinity Aquifer The Upper Trinity aquifer is comprised solely of the Upper Glen Rose Formation. The Upper Glen Rose Formation is composed of 350- to 400-ft thick beds of alternating limestone, dolomite, marl, and shale; gypsum and anhydrite are common. This aquifer satisfies, almost exclusively, domestic and livestock needs with very small (less than 5 gpm) to small (5 to 20 gpm) yields of highly mineralized water (relative to the Edwards Aquifer) in the Central Texas Hill Country, and within the western portion of the District (DeCook, 1960; Ashworth, 1983; Muller and McCoy, 1987). Middle Trinity Aquifer The Middle Trinity aquifer is composed of (from stratigraphically lowest to highest) the Cow Creek, Bexar Shale/Hensell Sand, and the lower Glen Rose Formation. The Cow Creek is a massive, sandy dolomitic limestone. The Bexar Shale/Hensell Sand is composed of alternating gravel, sand, silt, and shale. The lower Glen Rose Formation is composed of massive fossiliferous limestone and dolomite that grade upward into thin beds of limestone, shale, and marl. The Middle Trinity aquifer yields small to moderate quantities of fresh to moderately saline water (Brune and Duffin, 1983). The Lower Trinity The Lower Trinity aquifer is the basal portion of the Cretaceous section and is composed of the Hosston and overlying Sligo Formations. The Hosston is a conglomerate, sand, siltstone, and shale unit. The Sligo is a limestone and dolomite unit with local sandy units. This aquifer yields small to large amounts of fresh to moderately saline water (Brune and Duffin, 1983). Terrace and Alluvium Deposits Terrace and alluvial deposits consist of localized Quaternary-age gravels, sands, silt, and clays. These units may locally yield small to moderate quantities of fresh to moderately saline water (Brune and Duffin, 1983). Austin Chalk The Cretaceous-age Austin Chalk consists of massive beds of chalk and marl with bentonitic seams. The Austin Chalk is generally considered a confining unit for the Edwards Aquifer. However, the Austin Chalk may locally yield small to very small
BSEACD Data Series Report 2006-1005 5

quantities of fresh water (Brune and Duffin, 1983), especially where faulted and fractured. Igneous Igneous rocks are composed of highly altered pyroclastic material and basaltic (basanite) intrusions. These units are locally found in the Edwards, Austin Chalk and Taylor groups and are related to the volcanics associated with the upper Cretaceous Balcones Magmatic Province and eruption centers such as Pilot Knob in the Austin area (Caran et al., 2006). The highly porous McKown limestone is locally associated with pyroclastic mounds and may be an additional source of water. These units may yield very localized and small quantities of fresh water (Brune and Duffin, 1983). Navarro Clay and Taylor Marl The Taylor and Navarro Groups are the youngest Cretaceous-age sediments in the District. They are composed of massive beds of shale and marl with clayey chalk and sand and are generally considered confining units of the Edwards Aquifer. However, locally they may yield very small quantities of fresh to moderately saline water (Brune and Duffin, 1983).
BSEACD Data Series Report 2006-1005 6
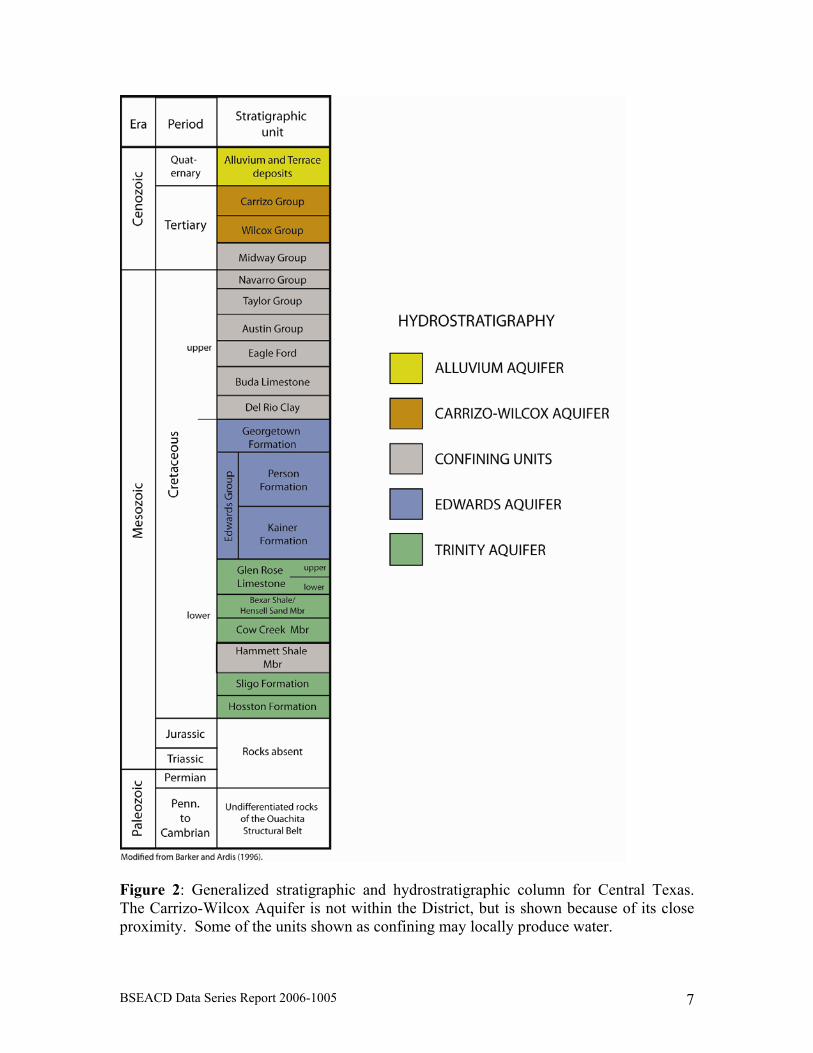
Figure 2: Generalized stratigraphic and hydrostratigraphic column for Central Texas. The Carrizo-Wilcox Aquifer is not within the District, but is shown because of its close proximity. Some of the units shown as confining may locally produce water.
BSEACD Data Series Report 2006-1005 7

Figure 3: Simplified major aquifer map of central Texas modified from Ashworth and Hopkins (1995). The area shown in white does not have a major aquifer, although locally water may be available within the Alluvium/Terrace, Austin Chalk, Navarro-Taylor, and Igneous units (not shown). GIS coverages of major aquifers from the TWDB.
BSEACD Data Series Report 2006-1005 8
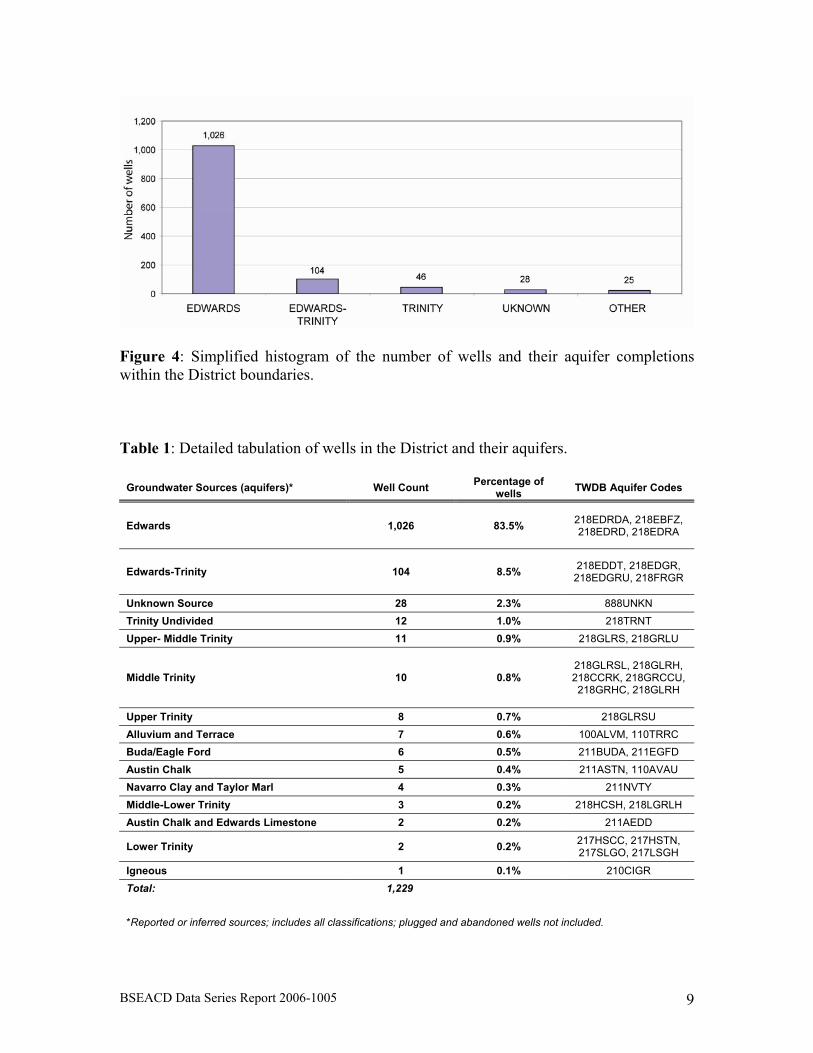
Figure 4: Simplified histogram of the number of wells and their aquifer completions within the District boundaries. Table 1: Detailed tabulation of wells in the District and their aquifers.
Groundwater Sources (aquifers)* Well Count Percentage of wells TWDB Aquifer Codes
Edwards 1,026 83.5% 218EDRDA, 218EBFZ, 218EDRD, 218EDRA
Edwards-Trinity 104 8.5% 218EDDT, 218EDGR, 218EDGRU, 218FRGR
Unknown Source 28 2.3% 888UNKN Trinity Undivided 12 1.0% 218TRNT Upper- Middle Trinity 11 0.9% 218GLRS, 218GRLU
Middle Trinity 10 0.8% 218GLRSL, 218GLRH, 218CCRK, 218GRCCU, 218GRHC, 218GLRH
Upper Trinity 8 0.7% 218GLRSU Alluvium and Terrace 7 0.6% 100ALVM, 110TRRC Buda/Eagle Ford 6 0.5% 211BUDA, 211EGFD Austin Chalk 5 0.4% 211ASTN, 110AVAU Navarro Clay and Taylor Marl 4 0.3% 211NVTY Middle-Lower Trinity 3 0.2% 218HCSH, 218LGRLH Austin Chalk and Edwards Limestone 2 0.2% 211AEDD
Lower Trinity 2 0.2% 217HSCC, 217HSTN, 217SLGO, 217LSGH
Igneous 1 0.1% 210CIGR Total: 1,229 *Reported or inferred sources; includes all classifications; plugged and abandoned wells not included.
BSEACD Data Series Report 2006-1005 9

Figure 5: Map showing the distribution and aquifer completion of wells in the District.
BSEACD Data Series Report 2006-1005 10

Figu
re 6
: Cro
ss se
ctio
n A
-A’ t
hrou
gh th
e D
istri
ct sh
owin
g th
e Ed
war
ds a
nd T
rinity
Aqu
ifers
in N
orth
ern
Hay
s Cou
nty.
Po
tent
iom
etric
surf
ace
is fr
om th
e dr
ough
t of r
ecor
d.
BSEACD Data Series Report 2006-1005 11
BSEACD Data Series Report 2006-1005 12
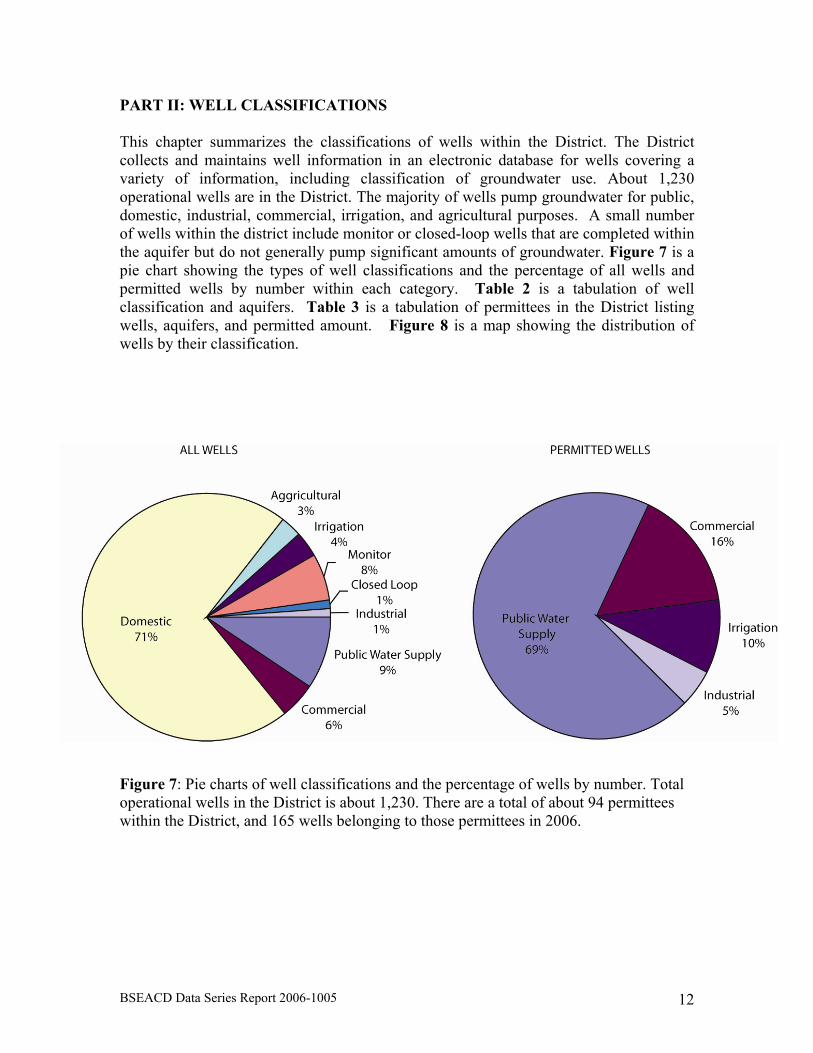
PART II: WELL CLASSIFICATIONS This chapter summarizes the classifications of wells within the District. The District collects and maintains well information in an electronic database for wells covering a variety of information, including classification of groundwater use. About 1,230 operational wells are in the District. The majority of wells pump groundwater for public, domestic, industrial, commercial, irrigation, and agricultural purposes. A small number of wells within the district include monitor or closed-loop wells that are completed within the aquifer but do not generally pump significant amounts of groundwater. Figure 7 is a pie chart showing the types of well classifications and the percentage of all wells and permitted wells by number within each category. Table 2 is a tabulation of well classification and aquifers. Table 3 is a tabulation of permittees in the District listing wells, aquifers, and permitted amount. Figure 8 is a map showing the distribution of wells by their classification.
Figure 7: Pie charts of well classifications and the percentage of wells by number. Total operational wells in the District is about 1,230. There are a total of about 94 permittees within the District, and 165 wells belonging to those permittees in 2006.

Table 2: Tabulation of all wells by classification and generalized aquifers.
District
Edwards* Trinity**Alluvium & Terrace
Buda & Eagle Ford
Austin Chalk
Navarro & Taylor Igneous
Total well records 1,489 Total operational wells 1,230 1,129 47 7 6 5 4 1 Well Classifications
Domestic 873 814 21 4 - - 3 1Abandoned 148 - - - - - - -Public water supply 113 104 9 - - - - -Plugged 111 - - - - - - -Monitor 94 78 7 - 6 4 - -Commercial 53 53 0 - - - - -Irrigation 42 34 5 2 - - - -Agricultural 27 20 4 1 - 1 1 -Closed loop 14 14 0 - - - - -Industrial (IND) 13 12 1 - - - - -Injection (INJ) 1 1 0 - - - - -*Includes Edwards-Trinity Wells **Includes Upper, Middle, and Lower Trinity Table 3: Tabulation of District permittees and wells (2006).
Well Owner System Name
2006 Permitted Pumpage (gal) Permit #
Well ID (SWN) Aquifer* Class County Ddlat Ddlong
AAW Oak Hill, Ltd. AAW Oak Hill, Ltd. 100,000 P265-93-00 58-50-122 Edwards COM Travis 30.23839 97.83824Arroyo Doble Water System Arroyo Doble Water System 52,800,000 P084-88-01 58-50-845 Edwards PWS Travis 30.13027 97.82185Arroyo Doble Water System Arroyo Doble Water System P084-88-01 58-58-215 Edwards PWS Travis 30.12277 97.81532
BSEACD Data Series Report 2006-1005 13

Table 3: Tabulation of District permittees and wells (2006).
Well Owner System Name
2006 Permitted Pumpage (gal) Permit #
Well ID (SWN) Aquifer* Class County Ddlat Ddlong
Associated Drilling Associated Drilling 2,000,000 P017-03-00 58-50-7AD Edwards PWS Travis 30.12861 97.83528Barton Properties Barton Properties 400,000 P311-88-00 58-57-606 Edwards PWS Hays 30.04472 97.88528Hays Consolidated I.S.D. Beacon Hill 562,500 P044-92-00 58-57-305 Edwards PWS Hays 30.09986 97.88229Bear Creek Office Park Bear Creek Office Park 1,000,000 P025-93-00 58-50-744 Edwards COM Travis 30.14222 97.84278Aqua Texas, Inc. Bear Creek Park 12,098,000 P145-90-00 58-50-718 Edwards PWS Travis 30.13670 97.84542Aqua Texas, Inc. Bear Creek Park P145-90-00 58-50-733 Edwards PWS Travis 30.14054 97.84488Capital Soccer Club Capital Soccer Club 12,000,000 P191-03-00 58-50-231 Edwards IRR Travis 30.20944 97.79195Centex Materials, LP. Centex Materials, LP. 214,291,000 P084-88-00 58-58-414 Edwards IND Hays 30.07083 97.86500Centex Materials, LP. Centex Materials, LP. P084-88-00 58-58-415 Edwards IND Hays 30.04723 97.86748Aqua Texas, Inc. Chaparral 28,000,000 P084-88-01 58-49-910 Trinity PWS Hays 30.13316 97.88988Aqua Texas, Inc. Chaparral P084-88-01 58-49-913 Trinity PWS Hays 30.13278 97.88944Aqua Texas, Inc. Chaparral P084-88-01 58-49-914 Trinity PWS Hays 30.13314 97.88982Aqua Texas, Inc. Chaparral P084-88-01 58-49-916 Edwards PWS Hays 30.13861 97.88472Aqua Texas, Inc. Chaparral P084-88-01 58-49-919 Trinity PWS Hays 30.13778 97.89222Aqua Texas, Inc. Chaparral P084-88-01 58-49-920 Trinity PWS Hays 30.13780 97.89276Aqua Texas, Inc. Chaparral P084-88-01 58-49-911 Trinity PWS Hays 30.13305 97.88972Aqua Texas, Inc. Chaparral P084-88-01 58-49-912 Edwards PWS Hays 30.13278 97.88944Aqua Texas, Inc. Chaparral P084-88-01 58-49-915 Edwards PWS Hays 30.13874 97.88488Aqua Texas, Inc. Chaparral P084-88-01 58-49-918 Trinity PWS Hays 30.13778 97.89261Aqua Texas, Inc. Chaparral P084-88-01 58-49-917 Edwards PWS Hays 30.13861 97.88472Chatleff Controls, Inc. Chatleff Controls, Inc. 1,500,000 P084-88-02 58-58-509 Edwards IND Hays 30.07611 97.83000Church Of Christ At Buda/Kyle Church Of Christ At Buda/Kyle 266,825 P076-92-00 58-57-607 Edwards PWS Hays 30.08045 97.91660Cimarron Park Water Company, Inc. Cimarron Park Water Company, Inc. 118,000,000 P084-88-00 58-58-102 Edwards PWS Hays 30.08472 97.84250Cimarron Park Water Company, Inc. Cimarron Park Water Company, Inc. P084-88-00 58-58-114 Edwards PWS Hays 30.12444 97.87389City Of Buda City Of Buda 275,000,000 P084-88-03 58-58-106 Edwards PWS Hays 30.10889 97.86604City Of Buda City Of Buda P084-88-03 58-58-403 Edwards PWS Hays 30.06203 97.85602City Of Buda City Of Buda P084-88-03 58-58-413 Edwards PWS Hays 30.06781 97.86275City of Hays Water Department City Of Hays Water Department 14,000,000 P084-88-05 58-58-111 Edwards PWS Hays 30.11503 97.86271City of Hays Water Department City Of Hays Water Department P084-88-05 58-58-115 Edwards PWS Hays 30.09333 97.83916
City of Hays Water Department City Of Hays Water Department (Elliot Ranch) 49,500,000 P245-00-00 58-57-314 Edwards PWS Hays 30.09667 97.88361
BSEACD Data Series Report 2006-1005 14

Table 3: Tabulation of District permittees and wells (2006).
Well Owner System Name
2006 Permitted Pumpage (gal) Permit #
Well ID (SWN) Aquifer* Class County Ddlat Ddlong
City of Hays Water Department City Of Hays Water Department (Elliot Ranch) P245-00-00 58-57-3Z4 Edwards PWS Hays 30.04950 97.93567
City Of Kyle City Of Kyle 165,000,000 P029-99-00 58-57-9N1 Edwards PWS Hays 30.10459 97.85434City Of Sunset Valley City Of Sunset Valley 18,590,000 P084-88-04 58-50-215 Edwards PWS Travis 30.22764 97.81035City Of Buda CityOf Buda (Dahlstrom, Hays I.S.D.) P084-88-06 58-57-307 Edwards PWS Hays 30.10956 97.87837Comal Tackle Company Comal Tackle Company 843,750 P084-88-04 58-58-423 Edwards IND Hays 30.08000 97.86987Aqua Texas, Inc. Copper Hills 7,000,000 P084-88-04 58-49-921 Trinity PWS Hays 30.14167 97.87917Aqua Texas, Inc. Copper Hills P084-88-04 58-49-922 Trinity PWS Hays 30.14167 97.87917Aqua Texas, Inc. Copper Hills P084-88-04 58-49-923 Trinity PWS Hays 30.14167 97.87917Aqua Texas, Inc. Copper Hills P084-88-04 58-49-924 Trinity PWS Hays 30.14276 97.88005Creedmoor Maha PWS Corp 213,696,000 P084-88-00 58-50-846 Edwards PWS Travis 30.13015 97.82169Creedmoor Maha PWS Corp P084-88-00 58-50-851 Edwards PWS Travis 30.16167 97.81834Creedmoor Maha PWS Corp P084-88-00 58-50-848 Edwards PWS Travis 30.12613 97.81598Creedmoor Maha PWS Corp P084-88-00 58-50-849 Edwards PWS Travis 30.12590 97.81580Creedmoor Maha PWS Corp P084-88-00 58-50-847 Edwards PWS Travis 30.13014 97.82169Creedmoor Maha PWS Corp P084-88-00 58-50-850 Edwards PWS Travis 30.12582 97.81564Lougheed, Scott Crestview R.V. 2,000,000 P084-88-07 58-58-510 Edwards PWS Hays 30.07938 97.82758Diamondscape Diamondscape 100,000 P351-91-00 58-50-726 Edwards COM Travis 30.15250 97.83334Gilbert C Johnson Gilbert C Johnson 5,500,000 P211-90-00 58-50-860 Edwards IRR Travis 30.14444 97.83139Goforth Water Supply Company Goforth Water Supply Company 350,900,000 P041-01-00 58-58-4GF Edwards PWS Hays 30.07083 97.87361Goforth Water Supply Company Goforth Water Supply Company P041-01-00 58-58-501 Edwards PWS Hays 30.07833 97.83056Goforth Water Supply Company Goforth Water Supply Company P041-01-00 58-58-506 Edwards PWS Hays 30.07833 97.83056Goforth Water Supply Company Goforth Water Supply Company P041-01-00 58-58-508 Edwards PWS Hays 30.07917 97.83099Goforth Water Supply Company Goforth Water Supply Company P041-01-00 58-58-507 Edwards PWS Hays 30.07833 97.83056Harold And Al Schuster Hicks Harold And Al Schuster Hicks 3,000,000 P084-88-06 58-50-723 Edwards PWS Travis 30.14861 97.83444Verizon Hays 100,000 P076-91-00 58-57-3H Edwards PWS Hays 30.10611 97.90334 Hays County Youth Athletic Assoc. Hays County Youth Athletic Assoc. 4,820,550 P083-92-00 58-58-417 Edwards IRR Hays 30.07129 97.85825Hays Consolidated I.S.D. Hays High School 30,000,000 P010-94-00 58-57-901 Edwards PWS Hays 30.03500 97.89917Hays Consolidated I.S.D. Hays High School P010-94-00 58-57-913 Edwards PWS Travis 30.02917 97.87917Hays Hills Baptist Church Hays Hills Baptist Church 300,000 P201-90-00 58-58-127 Edwards PWS Hays 30.10000 97.85667Texas-Lehigh Cement Company Howe 1,500,000 P353-91-00 58-58-418 Edwards IND Hays 30.04222 97.85278Hunt Enterprises Hunt Enterprises 600,000 P346-91-00 58-50-861 Edwards IRR travis 30.13833 97.82472
BSEACD Data Series Report 2006-1005 15

Table 3: Tabulation of District permittees and wells (2006).
Well Owner System Name
2006 Permitted Pumpage (gal) Permit #
Well ID (SWN) Aquifer* Class County Ddlat Ddlong
Huntington Utility Company, L.L.C. Huntington Utility Company, L.L.C. 18,000,000 P084-88-06 58-57-308 Edwards PWS Hays 30.10611 97.90334J. D. Malone J. D. Malone 2,000,000 P084-88-07 58-50-852 Edwards PWS Travis 30.14593 97.81313Kretchmar Alta Mae Kretchmar Alta Mae 100,000 P209-93-00 58-50-862 Edwards IRR Travis 30.15028 97.83278Aqua Texas, Inc. Leisurewoods Water Company 88,764,000 P084-88-07 58-58-107 Edwards PWS Hays 30.10528 97.86195Aqua Texas, Inc. Leisurewoods Water Company P084-88-07 58-58-118 Edwards PWS Hays 30.11065 97.86930Aqua Texas, Inc. Leisurewoods Water Company P084-88-07 58-58-119 Edwards PWS Hays 30.11127 97.86252Aqua Texas, Inc. Leisurewoods Water Company P084-88-07 58-58-121 Edwards PWS Hays 30.09472 97.84361 Aqua Texas, Inc. Leisurewoods Water Company P084-88-07 58-58-108 Edwards PWS Hays 30.12319 97.87226Aqua Texas, Inc. Leisurewoods Water Company P084-88-07 58-58-120 Edwards PWS Hays 30.10503 97.86236Lowden, Bob Lowden Bob 1,000,000 P078-98-00 58-58-426 Edwards PWS Hays 30.04691 97.85017
Manchaca Baptist Church Manchaca Baptist Church 600,000 P015-04-01 58-50-7MB Edwards COM Travis 30.13889 97.85445
Manchaca Fellowship Baptist Church Manchaca Fellowship Baptist Church 100,000 P244-91-01 58-50-737 Edwards PWS Travis 30.13611 97.83389
Manchaca Optimist Youth Sports Manchaca Optimist Youth Sports 24,000,000 P113-04-01 58-50-7MO Edwards COM Travis 30.13605 97.85053
Manchaca Volunteer Fire Dept. Manchaca Volunteer Fire Dept. 600,000 P084-88-07 58-50-724 Edwards COM Travis 30.14111 97.83806Marbridge Foundation Marbridge Foundation 26,730,000 P084-88-08 58-50-703 Edwards PWS Travis 30.13813 97.85522Marbridge Foundation Marbridge Foundation P084-88-08 58-50-704 Edwards PWS Travis 30.13694 97.85555Marbridge Foundation Marbridge Foundation P084-88-08 58-50-719 Edwards PWS Travis 30.13861 97.85806Marbridge Foundation Marbridge Foundation P084-88-08 58-50-725 Edwards PWS Travis 30.13750 97.85361Marbridge Foundation Marbridge Foundation P084-88-08 58-50-727 Edwards PWS Travis 30.13806 97.85722Marbridge Foundation Marbridge Foundation P084-88-08 58-50-728 Edwards PWS Travis 30.13861 97.85555Marbridge Foundation Marbridge Foundation P084-88-08 58-50-740 Edwards IRR Travis 30.13806 97.85555Marbridge Foundation Marbridge Foundation P084-88-08 58-50-7MF Edwards COM Travis 30.13194 97.85500McCoy Corporation McCoy Corporation 120,000 P084-88-08 58-50-730 Edwards COM Travis 30.14000 97.83833Michael Thames Custom Homes Michael Thames Custom Homes 100,000 P242-95-00 58-58-1MT Edwards COM Travis 30.12459 97.81374Mision Cristiana Maranatha Mision Cristiana Maranatha 500,000 P041-02-05 58-50-8mb Edwards COM Travis 30.14139 97.83083Aqua Texas, Inc. Mooreland 6,000,000 P177-89-00 58-50-842 Edwards PWS Travis 30.14305 97.82445Aqua Texas, Inc. Mooreland P177-89-00 58-50-863 Edwards PWS Travis 30.14000 97.83056Mountain City Oaks Water System Mountain City Oaks Water System 43,164,000 P084-88-08 58-57-910 Edwards PWS Hays 30.03389 97.89111Mystic Oak Water Co-op Mystic Oak Water Co-op 7,700,000 P084-88-08 58-58-202 Edwards PWS Travis 30.12022 97.82070Mystic Oak Water Co-op Mystic Oak Water Co-op P084-88-08 58-58-216 Edwards PWS Hays 30.09472 97.81555City of Austin Nature Center 16,000,000 P043-96-00 58-42-9NC Edwards IRR Travis 30.27083 97.77472
BSEACD Data Series Report 2006-1005 16

Table 3: Tabulation of District permittees and wells (2006).
Well Owner System Name
2006 Permitted Pumpage (gal) Permit #
Well ID (SWN) Aquifer* Class County Ddlat Ddlong
Neuro Institute of Austin, L.P. Neuro Institute of Austin, L.P. 7,500,000 P049-92-00 58-50-5A Edwards IRR Travis 30.19084 97.80651 New Forest Oaks, Inc. New Forest Oaks, Inc. 5,000,000 P217-93-00 58-50-123 Edwards IRR Travis 30.23252 97.86346New Forest Oaks, Inc. New Forest Oaks, Inc. P217-93-00 58-50-1NF Edwards IRR Travis 30.23222 97.85750Onion Creek Country Club Onion Creek Country Club 95,166,500 P084-88-09 58-50-835 Edwards IRR Travis 30.14501 97.81313Onion Creek Country Club Onion Creek Country Club P084-88-09 58-50-853 Edwards IRR Travis 30.14624 97.81927Onion Creek Country Club Onion Creek Country Club P084-88-09 58-50-836 Edwards IRR Travis 30.13915 97.82104Onion Creek Kennels Onion Creek Kennels 466,838 P108-91-05 58-58-126 Edwards COM Hays 30.11750 97.87361Aqua Texas, Inc. Onion Creek Meadows 36,300,000 P084-88-10 58-58-207 Edwards PWS Travis 30.11639 97.81976Aqua Texas, Inc. Onion Creek Meadows P084-88-10 58-58-208 Edwards PWS Travis 30.11934 97.81612Aqua Texas, Inc. Onion Creek Meadows P084-88-10 58-58-209 Edwards PWS Travis 30.12250 97.82639Onion Creek Memorial Park, Inc. Onion Creek Memorial Park, Inc. 787,500 P128-89-00 58-50-859 Edwards IRR Travis 30.15361 97.82166Lowden, Bob Painted Horse Pavilion 1,000,000 P211-01-00 58-58-4LC Edwards COM Travis 30.13944 97.83583Park Hills Baptist Church Park Hills Baptist Church 420,000 P084-88-09 58-42-913 Edwards COM Travis 30.26667 97.78222Texas-Lehigh Cement Company Plant 54,750,000 P084-88-11 58-58-407 Edwards IND Hays 30.07667 97.83444Monarch Utilities, Inc. Plum Creek Water Company 224,400,000 P084-88-09 58-58-409 Edwards PWS Hays 30.06683 97.83882Monarch Utilities, Inc. Plum Creek Water Company P084-88-09 58-58-419 Edwards PWS Hays 30.06781 97.85912Monarch Utilities, Inc. Plum Creek Water Company P084-88-09 58-58-708 Edwards PWS Hays 30.04214 97.85229Monarch Utilities, Inc. Plum Creek Water Company P084-88-09 58-58-412 Edwards PWS Hays 30.07051 97.83549Railroad Bar-B-Que Railroad Bar-B-Que 330,000 P053-93-00 58-50-8rrb Edwards COM Hays 30.09917 97.89222Randolph Austin Company Randolph Austin Company 585,000 P235-88-00 58-50-734 Edwards IND Travis 30.13417 97.85000Randolph Austin Company Randolph Austin Company P235-88-00 58-50-735 Edwards ABD Travis 30.13472 97.85000Rocket Water Company Rocket Water Company 7,000,000 P037-97-00 58-57-312 Edwards PWS Hays 30.11571 97.89501Rocket Water Company Rocket Water Company P037-97-00 58-57-3R2 Edwards PWS Hays 30.11672 97.89369Rudy's Country Store Rudy's Country Store 1,875,000 P098-18-00 58-42-825 Edwards COM Travis 30.26419 97.81432Sac-n-pac Company Sac-n-pac Company 150,000 P060-90-00 58-50-738 Edwards COM Travis 30.13472 97.85306Savage, Andrea Savage Andrea 500,000 P037-91-00 58-50-8AS Edwards PWS Travis 30.14000 97.83056Aqua Texas, Inc. Shady Hollow Estates Water Co 80,000,000 P084-88-10 58-50-731 Edwards PWS Travis 30.15297 97.85870Aqua Texas, Inc. Shady Hollow Estates Water Co P084-88-10 58-50-743 Edwards PWS Travis 30.15447 97.85878Penbur Farms, Inc. Shoal Creek Properties 500,000 P298-94-00 58-58-410 Edwards COM Hays 30.07667 97.83444Slaughter Creek Acres Water Supply Slaughter Creek Acres Water Supply 10,586,725 P084-88-10 58-50-829 Edwards PWS Travis 30.16069 97.81808Slaughter Creek Acres Water Supply Slaughter Creek Acres Water Supply P084-88-10 58-50-830 Edwards PWS Travis 30.14671 97.81308Sosebee E.Y. Sosebee E.Y. 690,000 P157-90-00 58-58-125 Edwards PWS Hays 30.10361 97.87028
BSEACD Data Series Report 2006-1005 17

Table 3: Tabulation of District permittees and wells (2006).
Well Owner System Name
2006 Permitted Pumpage (gal) Permit #
Well ID (SWN) Aquifer* Class County Ddlat Ddlong
Southern Hills Church of Christ Southern Hills Church of Christ 400,000 P006-03-00 58-57-315 Edwards COM Hays 30.11306 97.88389Aqua Texas, Inc. Southwest Territory 16,500,000 P084-88-10 58-49-927 Edwards PWS Hays 30.14528 97.87971Aqua Texas, Inc. Southwest Territory P084-88-10 58-49-928 Trinity PWS Hays 30.14532 97.87984Aqua Texas, Inc. Southwest Territory P084-88-10 58-49-929 Edwards PWS Hays 30.14536 97.87968Aqua Texas, Inc. Southwest Territory P084-88-10 58-49-931 Trinity PWS Hays 30.14528 97.87972Aqua Texas, Inc. Southwest Territory P084-88-10 58-49-932 Trinity PWS Hays 30.14522 97.87972Aqua Texas, Inc. Southwest Territory P084-88-10 58-49-933 Trinity PWS Hays 30.14515 97.87982Texas-Lehigh Cement Company Spectrum 825,000 P353-91-00 58-58-406 Edwards IND Hays 30.05345 97.85553St. Albans Episcopal Church St. Albans Episcopal Church 750,000 P084-88-10 58-50-840 Edwards COM Travis 30.15005 97.83235St. Andrews School St. Andrews School 8,000,000 P042-99-00 58-50-125 Trinity IRR Travis 30.24594 97.85099St. Andrews School St. Andrews School P042-99-00 58-50-126 Trinity IRR Travis 30.24572 97.85050St. John's Presbyterian Church St. John's Presbyterian Church 100,000 P259-93-01 58-50-732 Edwards PWS Travis 30.14305 97.84801Stenger Ridgewood Village WS Stenger Ridgewood Village WS 16,500,000 P084-88-10 58-42-816 Edwards PWS Travis 30.27750 97.79389
Steven Carlitz, Kuang Yu Chang and David T. Chang
Steven Carlitz, Kuang Yu Chang and David T. Chang 397,899 P084-88-05 58-42-821 Edwards COM Travis 30.26306 97.81389
Tanglewood Self Storage Tanglewood Self Storage 100,000 P226-97-00 58-50-5SS Trinity COM Travis 30.17167 97.81944Texanna Properties, Inc. Texanna Properties, Inc. 1,649,250 P084-88-00 58-50-843 Edwards PWS Travis 30.14305 97.82445Texanna Properties, Inc. Texanna Properties, Inc. P084-88-00 58-50-844 Edwards PWS Travis 30.12406 97.82665Tilson Custom Homes, Inc. Thames and Wimmer, L.L.C. 100,000 P058-89-00 58-58-709 Edwards COM Hays 30.03860 97.85139The Inn Above Onion Creek The Inn Above Onion Creek 1,300,000 P310-95-00 58-57-5J2 Edwards PWS Hays 30.05853 97.92112The Porter Co. Mech. Contractors The Porter Co. Mech. Contractors 500,000 P273-94-00 58-50-7PC Edwards COM Travis 30.13639 97.81944Thomas Weatherford Thomas Weatherford 5,000,000 P314-89-00 58-58-220 Edwards PWS Hays 30.08189 97.84270Twc Enterprises, Inc. Twc Enterprises, Inc. 24,200,000 P084-99-00 58-57-5T4 Edwards PWS Hays 30.04773 97.88367Twc Enterprises, Inc. Twc Enterprises, Inc. P084-99-00 58-57-608 Edwards PWS Hays 30.08000 97.91722Twc Enterprises, Inc. Twc Enterprises, Inc. P084-99-00 58-57-6T5 Edwards PWS Hays 30.03275 97.89030Twc Enterprises, Inc. Twc Enterprises, Inc. P084-99-00 58-57-609 Edwards PWS Hays 30.07214 97.91615Twc Enterprises, Inc. Twc Enterprises, Inc. P084-99-00 58-57-6M3 Edwards PWS Hays 30.07454 97.91382Twin Creek Park Water Supply Co. Twin Creek Park Water Supply Co. 12,000,000 P084-88-00 58-50-828 Edwards PWS Travis 30.15731 97.82000Twin Creek Park Water Supply Co. Twin Creek Park Water Supply Co. P084-88-00 58-50-856 Edwards PWS Travis 30.13472 97.82889Twin Creek Park Water Supply Co. Twin Creek Park Water Supply Co. P084-88-00 58-50-857 Edwards PWS Travis 30.13169 97.82233Twin Creek Park Water Supply Co. Twin Creek Park Water Supply Co. P084-88-00 58-50-858 Edwards PWS Travis 30.14305 97.82417Twin Oaks Ranch Church Camp Twin Oaks Ranch Church Camp 1,000,000 P084-88-11 58-58-117 Edwards PWS Hays 30.11386 97.86561
BSEACD Data Series Report 2006-1005 18

BSEACD Data Series Repo
Table 3:
Well Owner
rt 2006-1005 19
Tabulation of District permittees and wells (2006).
System Name
2006 Permitted Pumpage (gal) Permit #
Well ID (SWN) Aquifer* Class County Ddlat Ddlong
Twin Oaks Ranch Church Camp Twin Oaks Ranch Church Camp P084-88-11 58-58-122 Edwards PWS Hays 30.08361 97.87389 V.f.w. Post No. 3376 V.f.w. Post No. 3377 180,000 P084-88-12 58-50-729 Edwards COM Travis 30.12972 97.83417Village Of San Leanna Village Of San Leanna 29,013,600 P084-88-12 58-50-827 Edwards PWS Travis 30.13500 97.82528Village Of San Leanna Village Of San Leanna P084-88-12 58-50-838 Edwards PWS Travis 30.12972 97.79833Village Of San Leanna Village Of San Leanna P084-88-12 58-50-855 Edwards PWS Travis 30.13489 97.82649Villita West Condo Assoc Well #1 1,000,000 P226-97-00 58-42-8vw Edwards COM Travis 30.26528 97.81528Villita West Condo Assoc Well #2 1,000,000 P243-99-00 58-42-8v2 Edwards COM Travis 30.26556 97.81667 TOTAL 2,469,469,937
* Edwards Aquifer includes hybrid Edwards-Trinity well completions.
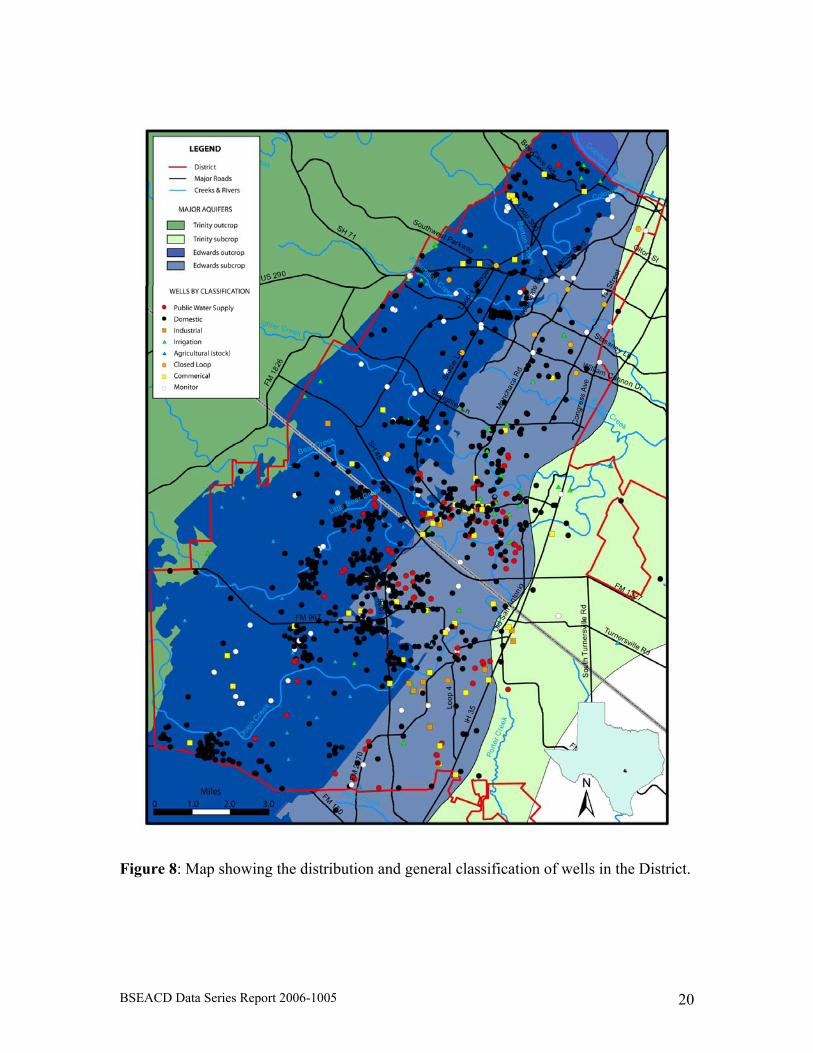
Figure 8: Map showing the distribution and general classification of wells in the District.
BSEACD Data Series Report 2006-1005 20

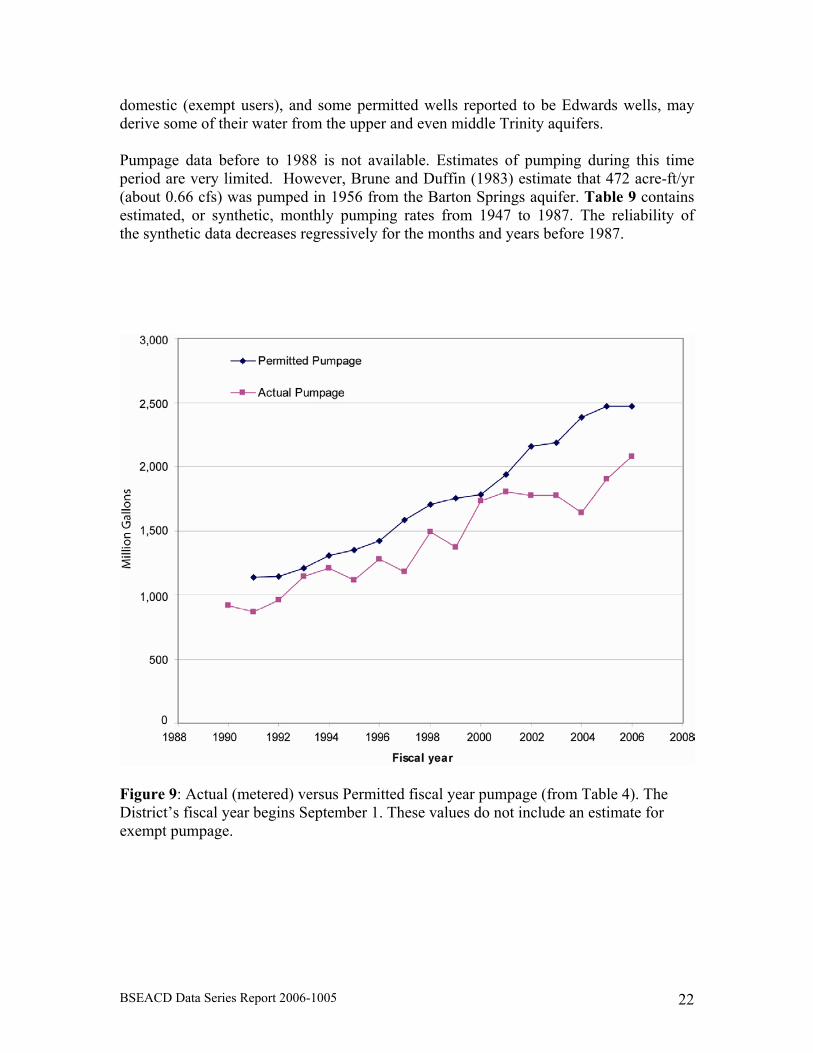
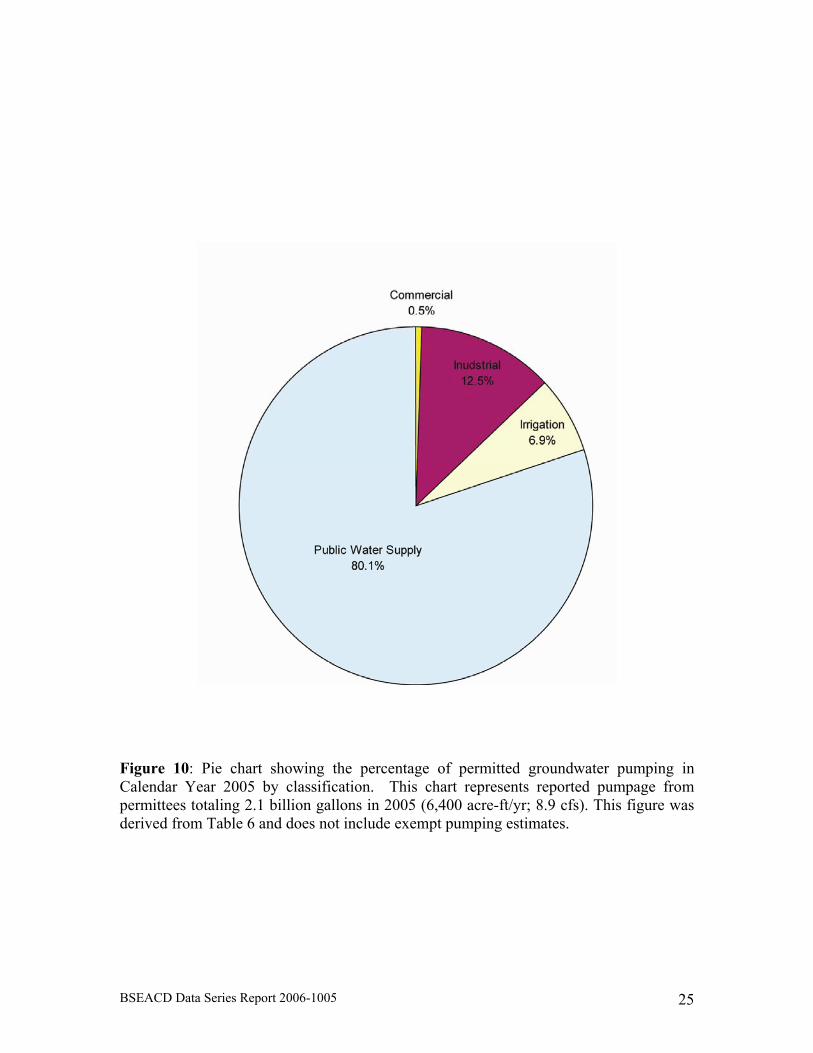
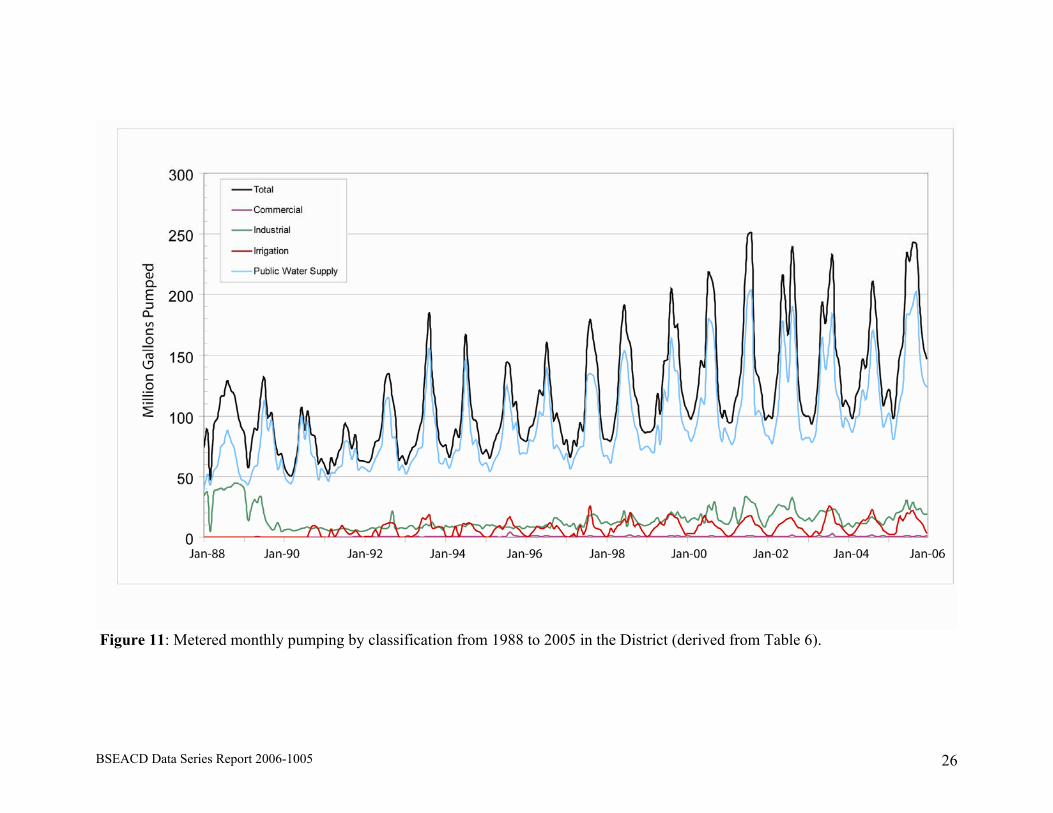
PART III: GROUNDWATER PUMPING This chapter summarizes historical and current pumping within the District from 1988 to 2006. All dates are calendar year except where noted as fiscal year (FY). The District’s fiscal year is from September 1 through August 31. Fiscal year pumpage closely follows calendar year pumpage during average years, but can vary as much as 14% due to climatic conditions. Water-supply wells in the District include about 1,230 operational wells for public, domestic, industrial, commercial, irrigation, and agricultural uses (Table 2). Table 4 is a tabulation of the annual permitted (maximum allowable), actual (metered), and estimated exempt pumpage from FY 1990 to FY 2006. In FY 2006, actual and estimated exempt pumping was 2.3 billion gallons (7,070 acre-ft/yr, 9.8 cfs) with the majority of pumping from the District’s 94 permittees. Estimated exempt pumpage, such as agricultural and domestic supply, is thought to be 11% of the permitted pumpage volume. Figure 9 is a chart showing the actual (metered) versus permitted pumpage for the fiscal years of 1990-2006 derived from Table 4. Actual and permitted pumpage have similar trends, although actual pumpage varyies according to climatic conditions; for example, actual pumpage approaches permitted volume during dry periods. Table 5 is a tabulation of total monthly pumping in millions gallons from 1988 to 2005. Table 6 is a tabulation of monthly pumping (million gallons) by classification from 1988 to 2005. Figure 10 illustrates the percentage of 2005 pumping by classification. The majority of water used within the District is for public water supply. Figure 11 illustrates monthly pumping from 1988 to 2005 by general classification. Public water supply and irrigation pumpage have a notable seasonal cycle with peak use during the summer, and lowest use during the winter. Commercial and Industrial pumping is generally erratic with some seasonal peaks noted with Industrial use. Figure 12 is a chart illustrating the months with the least and greatest pumping, on average, from 1988 to 2005. August is the highest use month, while February is the lowest. The lowest monthly pumpage is likely the amount used primarily indoors for domestic users, while the highest monthly pumpage reflects both indoor and outdoor usage. On an average annual basis, it is estimated that 33% of pumped water for public water supply was used for outdoor use (ranging from a maximum of 42% and a minimum of 24%). Figure 13 is a map showing the distribution and range in volume of pumping from the District in 2004. Table 7 is a tabulation of 2004 pumping that was used for numerical modeling in the Barton Springs aquifer by Smith and Hunt (2004). Note that the most significant volumes of pumping occur in the southeast part of the aquifer (Figure 13). The District currently has five permittees that pumped about 44.3 million gallons from the Trinity Aquifer in 2005. This total represents about 2% of the total pumped in 2005 by all District permittees. The water is used for public water supplies (83%), irrigation (17%), and minor commercial use. Table 8 presents the yearly permittee pumpage for the Trinity aquifer. It is important to note that where the Edwards Aquifer is thin, many
BSEACD Data Series Report 2006-1005 21
BSEACD Data Series Report 2006-1005
domestic (exempt users), and some permitted wells reported to be Edwards wells, may derive some of their water from the upper and even middle Trinity aquifers. Pumpage data before to 1988 is not available. Estimates of pumping during this time period are very limited. However, Brune and Duffin (1983) estimate that 472 acre-ft/yr (about 0.66 cfs) was pumped in 1956 from the Barton Springs aquifer. Table 9 contains estimated, or synthetic, monthly pumping rates from 1947 to 1987. The reliability of the synthetic data decreases regressively for the months and years before 1987.
Figure 9: Actual (metered) versus Permitted fiscal year pumpage (from Table 4). The District’s fiscal year begins September 1. These values do not include an estimate for exempt pumpage.
22

Table 4: Fiscal Year Permitted and Actual (metered) Pumping in the District (1990 to 2006).
1990
1991 1992 1993 1994 1995 1996 1997 1998
No. Permittees 52 74 75 77 91 86 95 96Permitted pumpage (gal)
unknown 1,136,373,000 1,144,558,250 1,207,693,250 1,306,926,250 1,350,697,650 1,417,672,177 1,583,257,177 1,700,218,177Exempt pumpage* (gal) 100,778,997
95,420,435 104,947,170 125,583,032 132,470,911 122,750,783 140,619,920 129,478,321 163,801,098
Total pumpage (gal) unknown 1,231,793,435
1,249,505,420 1,333,276,282 1,439,397,161 1,473,448,433 1,712,735,498 1,864,019,275
62
1,558,292,097Total pumpage (acre-ft) unknown 3,780 3,834 4,091 4,417 4,521 4,782 5,255 5,720Total pumpage (cfs) unknown 5.2 5.3 5.7 6.1 6.2 6.6 7.3 7.9Actual (metered) permitted pumpage 916,172,700 867,458,500 954,065,186 1,141,663,931 1,204,281,007 1,115,916,211 1,278,362,913 1,489,100,893
Exempt pumpage*
100,778,997 95,420,435 104,947,170 125,583,032 132,470,911 122,750,783 140,619,920 129,478,321 163,801,098Total actual pumpage (gal) 1,016,951,697 962,878,935 1,059,012,356 1,267,246,963 1,336,751,918 1,238,666,994 1,418,982,833 1,306,553,969 1,652,901,991Total pumpage (acre-ft) 3,120 2,955 3,250 3,888 4,102 3,801 4,354 4,009 5,072Total pumpage (cfs) 4.3 4.1 4.5 5.4 5.7 5.2 6.0 5.5 7.0Actual as a % of permitted -- 78% 85% 95% 93% 84% 91% 76% 89%
1999 2000 2001 2002 2003 2004 2005 2006
No. Permittees 91 87 89 90 90 94 94 94Permitted pumpage (gal)
1,754,340,569 1,777,105,569 1,936,326,800 2,154,432,800 2,182,251,250 2,383,566,187 2,464,569,937 2,469,917,445Exempt pumpage* (gal) 150,669,960 190,030,736 197,885,377 195,092,059 194,854,638 180,449,871 208,923,973 228,441,657Total pumpage (gal) 1,905,010,529 1,967,136,305 2,134,212,177 2,349,524,859 2,377,105,888 2,564,016,058 2,673,493,910 2,698,359,102Total pumpage (acre-ft) 5,845 6,036 6,549 7,209 7,294 7,867 8,203 8,280Total pumpage (cfs) 8.1 8.3 9.0 10.0 10.1 10.9 11.3 11.4Actual (metered) permitted pumpage 1,369,726,909 1,727,552,146 1,798,957,971 1,773,564,173 1,771,405,803 1,640,453,371 1,899,308,849 2,076,742,335
Exempt pumpage*
150,669,960 190,030,736 197,885,377 195,092,059 194,854,638 180,449,871 208,923,973 228,441,657Total actual pumpage (gal) 1,520,396,869 1,917,582,882 1,996,843,348 1,968,656,232 1,966,260,441 1,820,903,242 2,108,232,822 2,305,183,992Total pumpage (acre-ft) 4,665 5,884 6,127 6,041 6,033 5,587 6,469 7,073Total pumpage (cfs) 6.4 8.1 8.5 8.3 8.3 7.7 8.9 9.8Actual as a % of permitted 80% 97% 94% 84% 83% 71% 79% 85%
* Exempt pumpage is estimated to be 11% of actual permitted pumpage.
1,177,075,648
BSEACD Data Series Report 2006-1005 23

rt 2006-1005 24
Table 5: Tabulation of total reported monthly pumping (million gallons) in the District (1988 to 2005).
Calendar Year Jan Feb Mar Apr May Jun Jul Aug Sep Oct Nov Dec Total
1988 74.03 88.52 47.71 92.27 97.74 115.72 116.68 129.11 121.20 116.91 104.74 91.46 1,196.11
1989 85.43 57.80 71.76 89.58 88.54 115.73 131.38 99.48 102.68 84.44 68.06 69.11 1,265.86
1990 58.54 52.20 50.24 57.26 74.35 107.03 88.38 104.05 84.70 82.98 61.21 64.95 885.89
1991 58.94 52.04 65.28 59.51 69.57 76.54 93.01 88.14 72.80 84.16 64.40 63.00 847.38
1992 62.41 61.52 66.07 78.46 80.11 91.83 129.15 135.08 114.95 100.70 64.00 67.29 1,051.59
1993 60.05 66.60 73.86 76.67 87.18 99.01 146.40 184.69 133.00 108.52 79.49 74.82 1,190.30
1994 76.20 65.67 74.29 89.31 82.99 120.88 167.05 127.43 97.98 95.78 76.17 69.14 1,142.88
1995 71.75 65.06 73.25 83.01 89.53 102.08 143.91 141.84 108.93 111.69 84.09 80.43 1,155.58
1996 79.45 90.52 93.03 108.27 120.95 117.40 160.55 127.23 96.87 102.20 91.19 76.84 1,264.51
1997 80.17 66.04 79.68 76.33 94.18 87.69 161.73 179.43 161.58 143.00 97.35 81.59 1,308.78
1998 80.53 79.32 89.31 111.33 162.68 191.14 167.35 157.14 120.62 110.05 91.28 86.54 1,447.29
1999 86.52 87.08 91.14 117.98 102.13 145.24 146.58 204.23 172.64 174.47 125.33 109.36 1,562.69
2000 103.72 97.63 106.20 124.32 145.27 141.02 218.21 212.91 199.61 121.15 99.15 104.27 1,673.45
2001 95.02 94.96 109.81 120.58 144.13 213.03 249.43 250.98 140.32 132.12 118.89 97.33 1,766.60
2002 100.27 98.64 117.40 146.13 214.53 198.27 168.23 239.56 190.74 128.02 104.25 100.07 1,806.11
2003 99.08 93.22 106.79 146.91 193.26 176.27 207.59 230.83 159.41 143.24 108.69 112.68 1,777.98
2004 107.39 98.25 117.04 122.10 146.90 139.97 174.03 210.89 184.07 141.41 109.02 115.47 1,666.55
2005 121.22 97.95 114.64 148.70 161.80 234.35 227.56 243.19 241.30 185.63 160.64 147.56 2,084.54
BSEACD Data Series Repo
BSEACD Data Series Report 2006-1005
Figure 10: Pie chart showing the percentage of permitted groundwater pumping in Calendar Year 2005 by classification. This chart represents reported pumpage from permittees totaling 2.1 billion gallons in 2005 (6,400 acre-ft/yr; 8.9 cfs). This figure was derived from Table 6 and does not include exempt pumping estimates.
25
rt 2006-1005 26
Figure 11: Metered monthly pumping by classification from 1988 to 2005 in the District (derived from Table 6).
BSEACD Data Series Repo
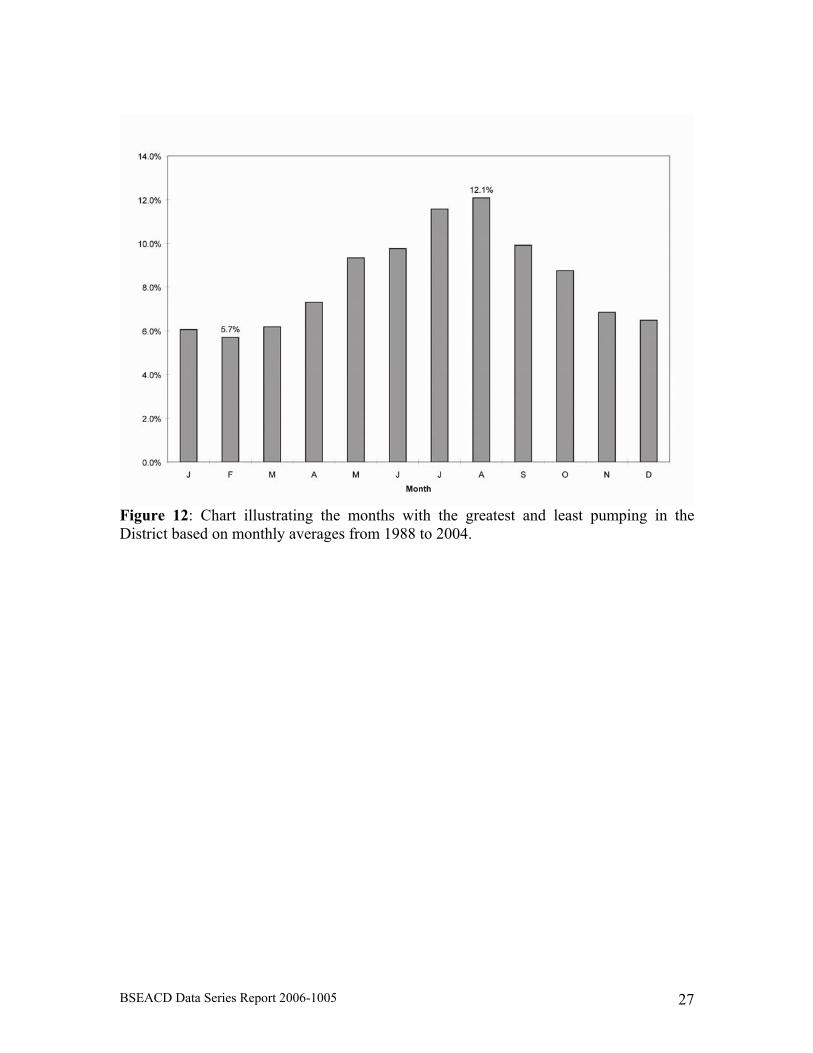
Figure 12: Chart illustrating the months with the greatest and least pumping in the District based on monthly averages from 1988 to 2004.
BSEACD Data Series Report 2006-1005 27

BSEACD Data Series Report 2006-1005
Figure 13: Map showing the distribution and volume of pumping from the Edwards Aquifer in 2004 from permittees (derived from Table 9). Each circle represents a well or well field of a permittee. These values were used in numerical modeling during evaluations of the sustainable yield of the aquifer. In 2004 a total of 1.64 billion gallons was pumped by permittees. Exempt well pumpage is not included, but is estimated to be 0.18 billion gallons distributed throughout the aquifer.
28
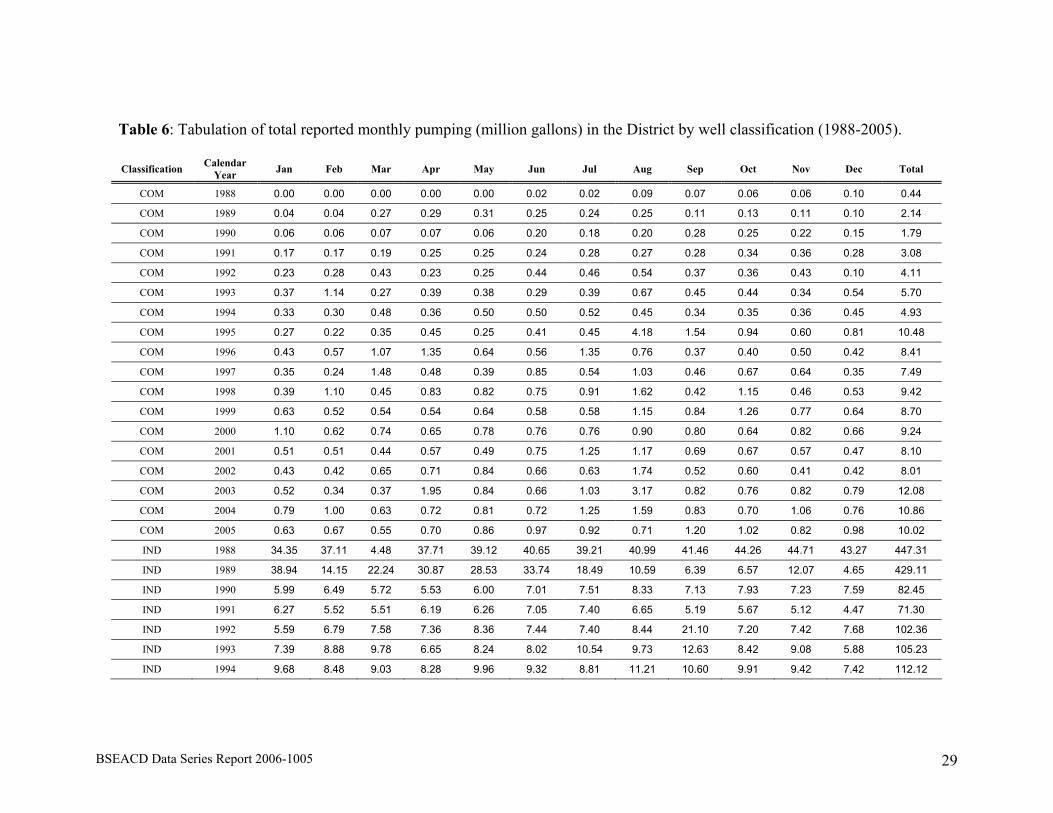
Table 6: Tabulation of total reported monthly pumping (million gallons) in the District by well classification (1988-2005). Classification Calendar
Year Jan
Feb Mar Apr May Jun Jul Aug Sep Oct Nov Dec Total
COM 1988 0.00 0.00 0.00 0.00 0.00 0.02 0.02 0.09 0.07 0.06 0.06 0.10 0.44
COM 1989 0.04 0.04 0.27 0.29 0.31 0.25 0.24 0.25 0.11 0.13 0.11 0.10 2.14
COM 1990 0.06 0.06 0.07 0.07 0.06 0.20 0.18 0.20 0.28 0.25 0.22 0.15 1.79
COM 1991 0.17 0.17 0.19 0.25 0.25 0.24 0.28 0.27 0.28 0.34 0.36 0.28 3.08
COM 1992 0.23 0.28 0.43 0.23 0.25 0.44 0.46 0.54 0.37 0.36 0.43 0.10 4.11
COM 1993 0.37 1.14 0.27 0.39 0.38 0.29 0.39 0.67 0.45 0.44 0.34 0.54 5.70
COM 1994 0.33 0.30 0.48 0.36 0.50 0.50 0.52 0.45 0.34 0.35 0.36 0.45 4.93
COM 1995 0.27 0.22 0.35 0.45 0.25 0.41 0.45 4.18 1.54 0.94 0.60 0.81 10.48
COM 1996 0.43 0.57 1.07 1.35 0.64 0.56 1.35 0.76 0.37 0.40 0.50 0.42 8.41
COM 1997 0.35 0.24 1.48 0.48 0.39 0.85 0.54 1.03 0.46 0.67 0.64 0.35 7.49
COM 1998 0.39 1.10 0.45 0.83 0.82 0.75 0.91 1.62 0.42 1.15 0.46 0.53 9.42
COM 1999 0.63 0.52 0.54 0.54 0.64 0.58 0.58 1.15 0.84 1.26 0.77 0.64 8.70
COM 2000 1.10 0.62 0.74 0.65 0.78 0.76 0.76 0.90 0.80 0.64 0.82 0.66 9.24
COM 2001 0.51 0.51 0.44 0.57 0.49 0.75 1.25 1.17 0.69 0.67 0.57 0.47 8.10
COM 2002 0.43 0.42 0.65 0.71 0.84 0.66 0.63 1.74 0.52 0.60 0.41 0.42 8.01
COM 2003 0.52 0.34 0.37 1.95 0.84 0.66 1.03 3.17 0.82 0.76 0.82 0.79 12.08
COM 2004 0.79 1.00 0.63 0.72 0.81 0.72 1.25 1.59 0.83 0.70 1.06 0.76 10.86
COM 2005 0.63 0.67 0.55 0.70 0.86 0.97 0.92 0.71 1.20 1.02 0.82 0.98 10.02
IND 1988 34.35 37.11 4.48 37.71 39.12 40.65 39.21 40.99 41.46 44.26 44.71 43.27 447.31
IND 1989 38.94 14.15 22.24 30.87 28.53 33.74 18.49 10.59 6.39 6.57 12.07 4.65 429.11
IND 1990 5.99 6.49 5.72 5.53 6.00 7.01 7.51 8.33 7.13 7.93 7.23 7.59 82.45
IND 1991 6.27 5.52 5.51 6.19 6.26 7.05 7.40 6.65 5.19 5.67 5.12 4.47 71.30
IND 1992 5.59 6.79 7.58 7.36 8.36 7.44 7.40 8.44 21.10 7.20 7.42 7.68 102.36
IND 1993 7.39 8.88 9.78 6.65 8.24 8.02 10.54 9.73 12.63 8.42 9.08 5.88 105.23
IND 1994 9.68 8.48 9.03 8.28 9.96 9.32 8.81 11.21 10.60 9.91 9.42 7.42 112.12
BSEACD Data Series Report 2006-1005 29
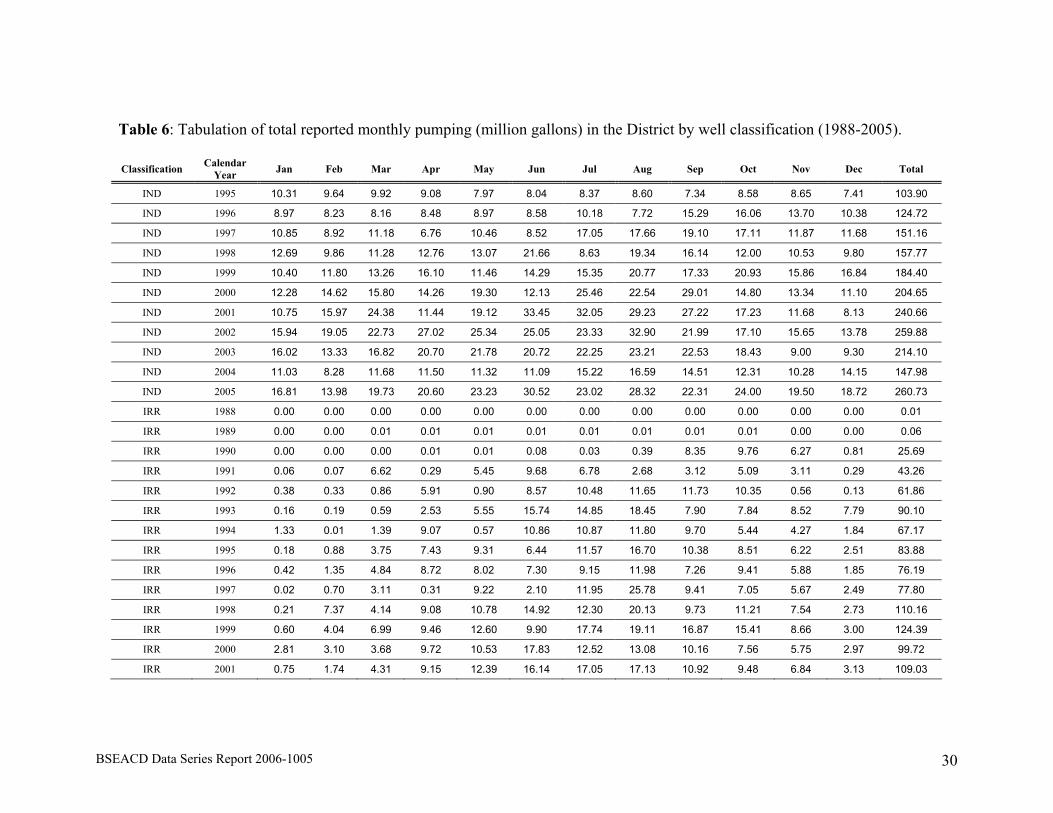
Table 6: Tabulation of total reported monthly pumping (million gallons) in the District by well classification (1988-2005). Classification Calendar
Year Jan Feb Mar Apr May Jun Jul Aug Sep Oct Nov Dec Total
IND 1995 10.31 9.64 9.92 9.08 7.97 8.04 8.37 8.60 7.34 8.58 8.65 7.41 103.90
IND 1996 8.97 8.23 8.16 8.48 8.97 8.58 10.18 7.72 15.29 16.06 13.70 10.38 124.72
IND 1997 10.85 8.92 11.18 6.76 10.46 8.52 17.05 17.66 19.10 17.11 11.87 11.68 151.16
IND 1998 12.69 9.86 11.28 12.76 13.07 21.66 8.63 19.34 16.14 12.00 10.53 9.80 157.77
IND 1999 10.40 11.80 13.26 16.10 11.46 14.29 15.35 20.77 17.33 20.93 15.86 16.84 184.40
IND 2000 12.28 14.62 15.80 14.26 19.30 12.13 25.46 22.54 29.01 14.80 13.34 11.10 204.65
IND 2001 10.75 15.97 24.38 11.44 19.12 33.45 32.05 29.23 27.22 17.23 11.68 8.13 240.66
IND 2002 15.94 19.05 22.73 27.02 25.34 25.05 23.33 32.90 21.99 17.10 15.65 13.78 259.88
IND 2003 16.02 13.33 16.82 20.70 21.78 20.72 22.25 23.21 22.53 18.43 9.00 9.30 214.10
IND 2004 11.03 8.28 11.68 11.50 11.32 11.09 15.22 16.59 14.51 12.31 10.28 14.15 147.98
IND 2005 16.81 13.98 19.73 20.60 23.23 30.52 23.02 28.32 22.31 24.00 19.50 18.72 260.73
IRR 1988 0.00 0.00 0.00 0.00 0.00 0.00 0.00 0.00 0.00 0.00 0.00 0.00 0.01
IRR 1989 0.00 0.00 0.01 0.01 0.01 0.01 0.01 0.01 0.01 0.01 0.00 0.00 0.06
IRR 1990 0.00 0.00 0.00 0.01 0.01 0.08 0.03 0.39 8.35 9.76 6.27 0.81 25.69
IRR 1991 0.06 0.07 6.62 0.29 5.45 9.68 6.78 2.68 3.12 5.09 3.11 0.29 43.26
IRR 1992 0.38 0.33 0.86 5.91 0.90 8.57 10.48 11.65 11.73 10.35 0.56 0.13 61.86
IRR 1993 0.16 0.19 0.59 2.53 5.55 15.74 14.85 18.45 7.90 7.84 8.52 7.79 90.10
IRR 1994 1.33 0.01 1.39 9.07 0.57 10.86 10.87 11.80 9.70 5.44 4.27 1.84 67.17
IRR 1995 0.18 0.88 3.75 7.43 9.31 6.44 11.57 16.70 10.38 8.51 6.22 2.51 83.88
IRR 1996 0.42 1.35 4.84 8.72 8.02 7.30 9.15 11.98 7.26 9.41 5.88 1.85 76.19
IRR 1997 0.02 0.70 3.11 0.31 9.22 2.10 11.95 25.78 9.41 7.05 5.67 2.49 77.80
IRR 1998 0.21 7.37 4.14 9.08 10.78 14.92 12.30 20.13 9.73 11.21 7.54 2.73 110.16
IRR 1999 0.60 4.04 6.99 9.46 12.60 9.90 17.74 19.11 16.87 15.41 8.66 3.00 124.39
IRR 2000 2.81 3.10 3.68 9.72 10.53 17.83 12.52 13.08 10.16 7.56 5.75 2.97 99.72
IRR 2001 0.75 1.74 4.31 9.15 12.39 16.14 17.05 17.13 10.92 9.48 6.84 3.13 109.03
BSEACD Data Series Report 2006-1005 30

Table 6: Tabulation of total reported monthly pumping (million gallons) in the District by well classification (1988-2005). Classification Calendar
Year Jan Feb Mar Apr May Jun Jul Aug Sep Oct Nov Dec Total
IRR 2002 0.90 1.93 5.32 10.10 11.94 13.96 15.16 15.49 10.66 8.00 7.13 3.86 104.45
IRR 2003 0.66 1.20 4.54 2.91 6.22 16.40 25.55 21.41 12.08 10.40 7.15 4.18 112.70
IRR 2004 2.02 2.17 6.08 9.46 13.68 14.31 18.26 22.50 14.27 10.68 5.98 4.29 123.71
IRR 2005 2.08 2.61 3.54 16.75 13.48 19.45 19.78 22.23 16.19 13.28 10.34 3.57 143.30
NDU 2004 0.00 0.00 0.04 0.01 0.02 0.02 0.02 0.04 0.06 0.01 0.02 0.02 0.25
NDU 2005 0.02 0.02 0.02 0.03 0.03 0.05 0.04 0.05 0.04 0.03 0.03 0.03 0.39
PWS 1988 39.68 51.41 43.24 54.56 58.62 75.05 77.45 88.03 79.67 72.59 59.97 48.09 748.35
PWS 1989 46.45 43.62 49.24 58.41 59.68 81.73 112.63 88.63 96.18 77.73 55.88 64.35 834.55
PWS 1990 52.49 45.65 44.45 51.66 68.28 99.75 80.66 95.14 68.95 65.03 47.49 56.41 775.95
PWS 1991 52.44 46.28 52.96 52.77 57.60 59.57 78.54 78.54 64.22 73.06 55.81 57.95 729.74
PWS 1992 56.21 54.13 57.21 64.95 70.60 75.38 110.81 114.45 81.74 82.80 55.60 59.38 883.27
PWS 1993 52.13 56.40 63.22 67.10 73.02 74.96 120.63 155.84 112.02 91.81 61.55 60.60 989.26
PWS 1994 64.86 56.88 63.39 71.61 71.95 100.20 146.85 103.96 77.33 80.07 62.12 59.43 958.66
PWS 1995 61.00 54.32 59.24 66.04 72.00 87.19 123.52 112.37 89.68 93.66 68.61 69.70 957.32
PWS 1996 69.63 80.37 78.97 89.72 103.33 100.96 139.86 106.78 73.95 76.33 71.11 64.18 1,055.19
PWS 1997 68.95 56.17 63.91 68.78 74.11 76.22 132.19 134.96 132.61 118.18 79.17 67.07 1,072.32
PWS 1998 67.23 61.00 73.45 88.67 138.01 153.81 145.50 116.05 94.32 85.68 72.75 73.48 1,169.95
PWS 1999 74.89 70.72 70.35 91.87 77.42 120.46 112.91 163.21 137.60 136.86 100.04 88.87 1,245.19
PWS 2000 87.52 79.29 85.98 99.70 114.66 110.30 179.47 176.38 159.63 98.14 79.23 89.54 1,359.84
PWS 2001 83.02 76.73 80.68 99.43 112.12 162.68 199.07 203.45 101.50 104.74 99.79 85.60 1,408.81
PWS 2002 83.00 77.25 88.71 108.30 176.41 158.60 129.11 189.44 157.57 102.32 81.06 82.01 1,433.77
PWS 2003 81.87 78.34 85.05 121.35 164.42 138.50 158.75 183.04 123.98 113.66 91.71 98.41 1,439.11
PWS 2004 93.55 86.79 98.62 100.41 121.06 113.83 139.28 170.17 154.40 117.71 91.69 96.25 1,383.75
PWS 2005 101.68 80.68 90.80 110.62 124.20 183.36 183.81 191.89 201.56 147.30 129.95 124.26 1,670.10
BSEACD Data Series Report 2006-1005 31

Table 7: Tabulation of pumping (million gallons) in 2004 and locations used for numerical model in the Barton Springs segment of the Edwards Aquifer.
State WellNum System/Owner Name Class. DD Long DD Lat Jan Feb Mar Apr
May Jun Jul Aug Sep Oct Nov Dec 2004 Total
58-42-816 Stenger Ridgewood Village Water System PWS 97.7938900 30.2775000 0.65 0.43 0.59 0.66 0.97 0.74 0.96 1.52 1.09 0.74 0.46 0.60 9.41
58-42-821 Steven Carlitz, Kuang Yu Chang and David T. Chang COM 97.8138900 30.2630600 0.05 0.08 0.08 0.09 0.00 0.12 0.00 0.15 0.00 0.00 0.07 0.05 0.68
58-42-825 Rudy's Country Store COM 97.8143200 30.2641900 0.13 0.12 0.12 0.13 0.15 0.17 0.22 0.20 0.15 0.19 0.13 0.13 1.83
58-42-8VW Well #1 COM 97.8152800 30.2652800 0.02 0.02 0.02 0.03 0.12 0.06 0.11 0.23 0.21 0.14 0.01 0.02 0.98
58-42-913 Park Hills Baptist Church COM 97.7822200 30.2666700 0.02 0.02 0.02 0.02 0.05 0.01 0.01 0.03 0.00 0.02 0.01 0.01 0.23
58-42-9NC Nature Center IRR 97.7747200 30.2708300 1.00 1.18 1.19 1.12 1.41 1.34 1.37 1.59 1.59 1.59 1.59 3.25 18.22
58-49-911 Chaparral PWS 97.8897200 30.1330500 0.10 0.10 0.14 0.11 0.14 0.15 0.15 0.19 0.13 0.10 0.08 0.07 1.46
58-49-915 Chaparral PWS 97.8848800 30.1387400 0.10 0.10 0.14 0.11 0.14 0.15 0.15 0.19 0.13 0.10 0.08 0.07 1.46
58-49-927 Southwest Territory PWS 97.8797100 30.1452800 0.68 0.69 0.97 0.78 1.12 1.16 1.43 1.78 1.48 0.64 0.18 0.97 11.87
58-50-122 AAW Oak Hill, Ltd. COM 97.8382400 30.2383900 0.00 0.00 0.00 0.00 0.00 0.00 0.00 0.00 0.00 0.00 0.00 0.00 0.00
58-50-123 New Forest Oaks, Inc. IRR 97.8634600 30.2325200 0.00 0.00 0.00 0.11 0.16 0.06 0.37 0.38 0.43 0.10 0.01 0.00 1.62
58-50-1NF New Forest Oaks, Inc. IRR 97.8575000 30.2322200 0.00 0.00 0.00 0.11 0.16 0.06 0.37 0.38 0.43 0.10 0.01 0.00 1.62
58-50-215 City Of Sunset Valley PWS 97.8103500 30.2276400 0.82 0.70 1.05 0.86 1.43 0.18 1.65 2.65 2.57 1.49 0.94 0.82 15.17
58-50-231 Austin United Capital Soccer Club IRR 97.7919500 30.2094400 0.18 0.01 0.10 0.04 0.43 0.00 0.50 2.60 1.37 0.17 0.28 0.18 5.87
58-50-414 Johnson Lee V. IRR 97.8388900 30.1802800 0.00 0.00 0.03 0.00 0.00 0.01 0.00 0.00 0.00 0.00 0.00 0.00 0.05
58-50-5A Neuro Institute of Austin, L.P. IRR 97.8065100 30.1908400 0.19 0.00 0.25 0.33 0.00 0.13 0.00 0.01 0.00 0.00 0.00 0.00 0.90
58-50-704 Marbridge Foundation PWS 97.8555500 30.1369400 1.22 1.12 1.19 1.05 1.40 1.22 1.62 1.80 1.54 1.28 0.84 0.77 15.05
58-50-718 Bear Creek Park PWS 97.8454200 30.1367000 0.55 0.52 0.50 0.49 0.65 0.64 0.92 0.94 0.90 0.45 0.51 0.37 7.45
58-50-723 Harold And Al Schuster Hicks PWS 97.8344400 30.1486100 0.00 0.00 0.00 0.00 0.00 0.00 0.00 0.00 0.00 0.00 0.00 0.00 0.00
58-50-724 Manchaca Volunteer Fire Department COM 97.8380600 30.1411100 0.05 0.06 0.07 0.05 0.08 0.06 0.05 0.06 0.06 0.07 0.06 0.06 0.75
58-50-726 Diamondscape COM 97.8333400 30.1525000 0.00 0.00 0.00 0.00 0.00 0.00 0.00 0.00 0.00 0.00 0.00 0.00 0.03
58-50-727 Marbridge Foundation PWS 97.8572200 30.1380600 0.26 0.24 0.25 0.23 0.30 0.26 0.35 0.39 0.33 0.27 0.18 0.17 3.22
58-50-728 Marbridge Foundation PWS 97.8555500 30.1386100 0.26 0.24 0.25 0.23 0.30 0.26 0.35 0.39 0.33 0.27 0.18 0.17 3.22
58-50-729 V.f.w. Post No. 3377 COM 97.8341700 30.1297200 0.01 0.01 0.01 0.02 0.01 0.01 0.02 0.01 0.02 0.01 0.01 0.01 0.16
58-50-730 McCoy Corporation COM 97.8383300 30.1400000 0.00 0.06 0.00 0.00 0.02 0.00 0.00 0.01 0.01 0.00 0.01 0.00 0.10
58-50-731 Shady Hollow Estates Water Company PWS 97.8587000 30.1529700 2.23 2.19 3.09 2.96 6.27 4.61 6.94 8.58 7.14 3.55 2.91 2.38 52.83
BSEACD Data Series Report 2006-1005 32
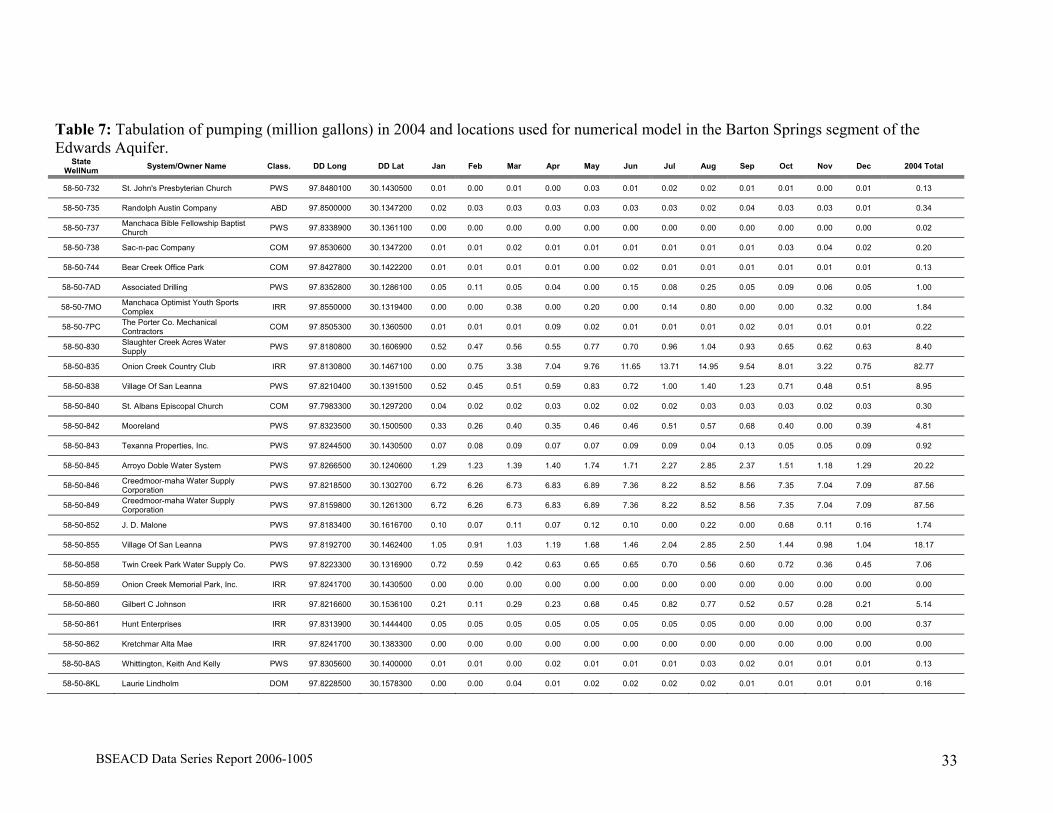
Table 7: Tabulation of pumping (million gallons) in 2004 and locations used for numerical model in the Barton Springs segment of the Edwards Aquifer.
State WellNum System/Owner Name Class. DD Long DD Lat Jan Feb Mar Apr
May Jun Jul Aug Sep Oct Nov Dec 2004 Total
58-50-732 St. John's Presbyterian Church PWS 97.8480100 30.1430500 0.01 0.00 0.01 0.00 0.03 0.01 0.02 0.02 0.01 0.01 0.00 0.01 0.13
58-50-735 Randolph Austin Company ABD 97.8500000 30.1347200 0.02 0.03 0.03 0.03 0.03 0.03 0.03 0.02 0.04 0.03 0.03 0.01 0.34
58-50-737 Manchaca Bible Fellowship Baptist Church PWS 97.8338900 30.1361100 0.00 0.00 0.00 0.00 0.00 0.00 0.00 0.00 0.00 0.00 0.00 0.00 0.02
58-50-738 Sac-n-pac Company COM 97.8530600 30.1347200 0.01 0.01 0.02 0.01 0.01 0.01 0.01 0.01 0.01 0.03 0.04 0.02 0.20
58-50-744 Bear Creek Office Park COM 97.8427800 30.1422200 0.01 0.01 0.01 0.01 0.00 0.02 0.01 0.01 0.01 0.01 0.01 0.01 0.13
58-50-7AD Associated Drilling PWS 97.8352800 30.1286100 0.05 0.11 0.05 0.04 0.00 0.15 0.08 0.25 0.05 0.09 0.06 0.05 1.00
58-50-7MO Manchaca Optimist Youth Sports Complex IRR 97.8550000 30.1319400 0.00 0.00 0.38 0.00 0.20 0.00 0.14 0.80 0.00 0.00 0.32 0.00 1.84
58-50-7PC The Porter Co. Mechanical Contractors COM 97.8505300 30.1360500 0.01 0.01 0.01 0.09 0.02 0.01 0.01 0.01 0.02 0.01 0.01 0.01 0.22
58-50-830 Slaughter Creek Acres Water Supply PWS 97.8180800 30.1606900 0.52 0.47 0.56 0.55 0.77 0.70 0.96 1.04 0.93 0.65 0.62 0.63 8.40
58-50-835 Onion Creek Country Club IRR 97.8130800 30.1467100 0.00 0.75 3.38 7.04 9.76 11.65 13.71 14.95 9.54 8.01 3.22 0.75 82.77
58-50-838 Village Of San Leanna PWS 97.8210400 30.1391500 0.52 0.45 0.51 0.59 0.83 0.72 1.00 1.40 1.23 0.48 0.51 8.95
58-50-840 St. Albans Episcopal Church COM 97.7983300 30.1297200 0.04 0.02 0.02 0.03 0.02 0.02 0.02 0.03 0.03 0.03 0.02 0.03 0.30
58-50-842 Mooreland PWS 97.8323500 30.1500500 0.33 0.26 0.40 0.35 0.46 0.46 0.51 0.57 0.68 0.40 0.00 0.39 4.81
58-50-843 Texanna Properties, Inc. PWS 97.8244500 30.1430500 0.07 0.08 0.09 0.07 0.07 0.09 0.09 0.04 0.13 0.05 0.05 0.09 0.92
58-50-845 Arroyo Doble Water System PWS 97.8266500 30.1240600 1.29 1.23 1.39 1.40 1.74 1.71 2.27 2.85 2.37 1.51 1.18 1.29 20.22
58-50-846 Creedmoor-maha Water Supply Corporation PWS 97.8218500 30.1302700 6.72 6.26 6.73 6.83 6.89 7.36 8.22 8.52 8.56 7.35 7.04 7.09 87.56
58-50-849 Creedmoor-maha Water Supply Corporation PWS 97.8159800 30.1261300 6.72 6.26 6.73 6.83 6.89 7.36 8.22 8.52 8.56 7.35 7.04 7.09 87.56
58-50-852 J. D. Malone PWS 97.8183400 30.1616700 0.10 0.07 0.11 0.07 0.12 0.10 0.00 0.22 0.00 0.68 0.11 0.16 1.74
58-50-855 Village Of San Leanna PWS 97.8192700 30.1462400 1.05 0.91 1.03 1.19 1.68 1.46 2.04 2.85 2.50 1.44 0.98 1.04 18.17
58-50-858 Twin Creek Park Water Supply Co. PWS 97.8223300 30.1316900 0.72 0.59 0.42 0.63 0.65 0.65 0.70 0.56 0.60 0.72 0.36 0.45 7.06
58-50-859 Onion Creek Memorial Park, Inc. IRR 97.8241700 30.1430500 0.00 0.00 0.00 0.00 0.00 0.00 0.00 0.00 0.00 0.00 0.00 0.00 0.00
58-50-860 Gilbert C Johnson IRR 97.8216600 30.1536100 0.21 0.11 0.29 0.23 0.68 0.45 0.82 0.77 0.52 0.57 0.28 0.21 5.14
58-50-861 Hunt Enterprises IRR 97.8313900 30.1444400 0.05 0.05 0.05 0.05 0.05 0.05 0.05 0.05 0.00 0.00 0.00 0.00 0.37
58-50-862 Kretchmar Alta Mae IRR 97.8241700 30.1383300 0.00 0.00 0.00 0.00 0.00 0.00 0.00 0.00 0.00 0.00 0.00 0.00 0.00
58-50-8AS Whittington, Keith And Kelly PWS 97.8305600 30.1400000 0.01 0.01 0.00 0.02 0.01 0.01 0.01 0.03 0.02 0.01 0.01 0.01 0.13
58-50-8KL Laurie Lindholm DOM 97.8228500 30.1578300 0.00 0.00 0.04 0.01 0.02 0.02 0.02 0.02 0.01 0.01 0.01 0.01 0.16
0.71
BSEACD Data Series Report 2006-1005 33
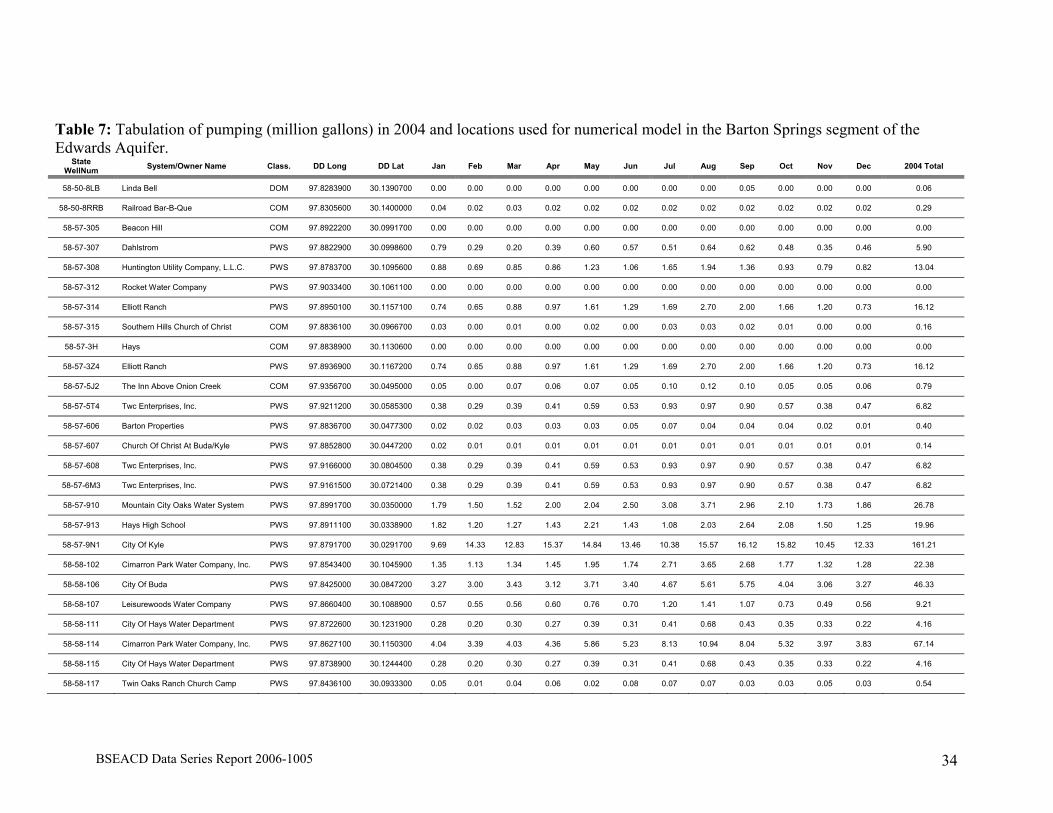
Table 7: Tabulation of pumping (million gallons) in 2004 and locations used for numerical model in the Barton Springs segment of the Edwards Aquifer.
State WellNum System/Owner Name Class. DD Long DD Lat Jan Feb Mar Apr May Jun Jul Aug Sep Oct Nov Dec 2004 Total
58-50-8LB Linda Bell DOM 97.8283900 30.1390700 0.00 0.00 0.00 0.00 0.00 0.00 0.00 0.00 0.05 0.00 0.00 0.00 0.06
58-50-8RRB Railroad Bar-B-Que COM 97.8305600 30.1400000 0.04 0.02 0.03 0.02 0.02 0.02 0.02 0.02 0.02 0.02 0.02 0.02 0.29
58-57-305 Beacon Hill COM 97.8922200 30.0991700 0.00 0.00 0.00 0.00 0.00 0.00 0.00 0.00 0.00 0.00 0.00 0.00 0.00
58-57-307 Dahlstrom PWS 97.8822900 30.0998600 0.79 0.29 0.20 0.39 0.60 0.57 0.51 0.64 0.62 0.48 0.35 0.46 5.90
58-57-308 Huntington Utility Company, L.L.C. PWS 97.8783700 30.1095600 0.88 0.69 0.85 0.86 1.23 1.06 1.65 1.94 1.36 0.93 0.79 0.82 13.04
58-57-312 Rocket Water Company PWS 97.9033400 30.1061100 0.00 0.00 0.00 0.00 0.00 0.00 0.00 0.00 0.00 0.00 0.00 0.00 0.00
58-57-314 Elliott Ranch PWS 97.8950100 30.1157100 0.74 0.65 0.88 0.97 1.61 1.29 1.69 2.70 2.00 1.66 1.20 0.73 16.12
58-57-315 Southern Hills Church of Christ COM 97.8836100 30.0966700 0.03 0.00 0.01 0.00 0.02 0.00 0.03 0.03 0.02 0.01 0.00 0.00 0.16
58-57-3H Hays COM 97.8838900 30.1130600 0.00 0.00 0.00 0.00 0.00 0.00 0.00 0.00 0.00 0.00 0.00 0.00 0.00
58-57-3Z4 Elliott Ranch PWS 97.8936900 30.1167200 0.74 0.65 0.88 0.97 1.61 1.29 1.69 2.70 2.00 1.66 1.20 0.73 16.12
58-57-5J2 The Inn Above Onion Creek COM 97.9356700 30.0495000 0.05 0.00 0.07 0.06 0.07 0.05 0.10 0.12 0.10 0.05 0.05 0.06 0.79
58-57-5T4 Twc Enterprises, Inc. PWS 97.9211200 30.0585300 0.38 0.29 0.39 0.41 0.59 0.53 0.93 0.97 0.90 0.57 0.38 0.47 6.82
58-57-606 Barton Properties PWS 97.8836700 30.0477300 0.02 0.02 0.03 0.03 0.03 0.05 0.07 0.04 0.04 0.04 0.02 0.01 0.40
58-57-607 Church Of Christ At Buda/Kyle PWS 97.8852800 30.0447200 0.02 0.01 0.01 0.01 0.01 0.01 0.01 0.01 0.01 0.01 0.01 0.01 0.14
58-57-608 Twc Enterprises, Inc. PWS 97.9166000 30.0804500 0.38 0.29 0.39 0.41 0.59 0.53 0.93 0.97 0.90 0.57 0.38 0.47 6.82
58-57-6M3 Twc Enterprises, Inc. PWS 97.9161500 30.0721400 0.38 0.29 0.39 0.41 0.59 0.53 0.93 0.97 0.90 0.57 0.38 0.47 6.82
58-57-910 Mountain City Oaks Water System PWS 97.8991700 30.0350000 1.79 1.50 1.52 2.00 2.04 2.50 3.08 3.71 2.96 2.10 1.73 1.86 26.78
58-57-913 Hays High School PWS 97.8911100 30.0338900 1.82 1.20 1.27 1.43 2.21 1.43 1.08 2.03 2.64 2.08 1.50 1.25 19.96
58-57-9N1 City Of Kyle PWS 97.8791700 30.0291700 9.69 14.33 12.83 15.37 14.84 13.46 10.38 15.57 16.12 15.82 10.45 12.33 161.21
58-58-102 Cimarron Park Water Company, Inc. PWS 97.8543400 30.1045900 1.35 1.13 1.34 1.45 1.95 1.74 2.71 3.65 2.68 1.77 1.32 1.28 22.38
58-58-106 City Of Buda PWS 97.8425000 30.0847200 3.27 3.00 3.43 3.12 3.71 3.40 4.67 5.61 5.75 4.04 3.06 3.27 46.33
58-58-107 30.1088900 0.57 0.55 0.56 0.60 0.76 0.70 1.20 1.41 1.07 0.73 0.49 0.56 9.21 Leisurewoods Water Company PWS 97.8660400
58-58-111 City Of Hays Water Department PWS 97.8722600 30.1231900 0.28 0.20 0.30 0.27 0.39 0.31 0.41 0.68 0.43 0.35 0.33 0.22 4.16
58-58-114 Cimarron Park Water Company, Inc. PWS 97.8627100 30.1150300 4.04 3.39 4.03 4.36 5.86 5.23 8.13 10.94 8.04 5.32 3.97 3.83 67.14
58-58-115 City Of Hays Water Department PWS 97.8738900 30.1244400 0.28 0.20 0.30 0.27 0.39 0.31 0.41 0.68 0.43 0.35 0.33 0.22 4.16
58-58-117 Twin Oaks Ranch Church Camp PWS 97.8436100 30.0933300 0.05 0.01 0.04 0.06 0.02 0.08 0.07 0.07 0.03 0.03 0.05 0.03 0.54
BSEACD Data Series Report 2006-1005 34

BSEACD Data Series Report 2006-1005 35
58-58-417 Association PWS 97.8674800 30.0472300 0.15 0.11 0.09 0.34 0.06 0.16 0.32 0.42 0.49 0.33 0.10 0.61 3.17
58-58-418 Howe IND 97.8582500 30.0712900 0.04 0.04 0.03 0.04 0.06 0.04 0.07 0.12 0.11 0.03 0.03 0.06 0.66
58-58-423 Comal Tackle Company IND 97.8591200 30.0678100 0.04 0.04 0.05 0.06 0.05 0.05 0.06 0.05 0.07 0.07 0.05 0.04 0.63
Table 7: Tabulation of pumping (million gallons) in 2004 and locations used for numerical model in the Barton Springs segment of the Edwards Aquifer.
State WellNum System/Owner Name Class. DD Long DD Lat Jan Feb Mar Apr May Jun Jul Aug Sep Oct Nov Dec 2004 Total
58-58-118 Leisurewoods Water Company PWS 97.8656100 30.1138600 0.57 0.55 0.56 0.60 0.76 0.70 1.20 1.41 1.07 0.73 0.49 0.56 9.21
58-58-119 Leisurewoods Water Company PWS 97.8693000 30.1106500 0.57 0.55 0.56 0.60 0.76 0.70 1.20 1.41 1.07 0.73 0.49 0.56 9.21
58-58-120 Leisurewoods Water Company PWS 97.8625200 30.1112700 0.57 0.55 0.56 0.60 0.76 0.70 1.20 1.41 1.07 0.73 0.49 0.56 9.21
58-58-121 Leisurewoods Water Company PWS 97.8623600 30.1050300 1.53 1.47 1.50 1.61 2.01 1.86 3.20 3.77 2.86 1.94 1.31 1.48 24.55
58-58-122 Twin Oaks Ranch Church Camp COM 97.8436100 30.0947200 0.05 0.01 0.04 0.06 0.02 0.08 0.07 0.07 0.03 0.03 0.05 0.03 0.54
58-58-125 Sosebee E.Y. PWS 97.8738900 30.0836100 0.02 0.01 0.01 0.01 0.00 0.07 0.01 0.02 0.01 0.02 0.02 0.01 0.22
58-58-126 Onion Creek Kennels COM 97.8702800 30.1036100 0.03 0.01 0.02 0.02 0.03 0.01 0.07 0.03 0.04 0.01 0.03 0.02 0.32
58-58-127 Hays Hills Baptist Church PWS 97.8736100 30.1175000 0.03 0.03 0.04 0.03 0.04 0.03 0.03 0.02 0.02 0.02 0.02 0.02 0.32
58-58-1JS Joe Sandoval DOM 97.8726700 30.1057800 0.00 0.00 0.00 0.00 0.00 0.00 0.00 0.02 0.01 0.00 0.01 0.00 0.04
58-58-1MT Michael Thames Custom Homes COM 97.8566700 30.1000000 0.01 0.01 0.01 0.01 0.00 0.01 0.01 0.00 0.00 0.00 0.00 0.00 0.06
58-58-202 Mystic Oak Water Co-op PWS 97.8137400 30.1245900 0.22 0.31 0.34 0.24 0.48 0.34 0.57 0.78 0.36 0.18 0.33 0.12 4.28
58-58-207 Onion Creek Meadows PWS 97.8207000 30.1202200 0.34 0.35 0.45 0.44 0.47 0.41 0.52 0.66 0.70 0.40 0.47 0.37 5.56
58-58-209 Onion Creek Meadows PWS 97.8161200 30.1193400 1.35 1.40 1.80 1.77 1.86 1.62 2.08 2.63 2.79 1.60 1.86 1.49 22.26
58-58-215 Arroyo Doble Water System PWS 97.8263900 30.1225000 1.29 1.23 1.39 1.40 1.74 1.71 2.27 2.85 2.37 1.51 1.18 1.29 20.22
58-58-220 Thomas Weatherford ABD 97.8144500 30.0933300 0.08 0.04 0.10 0.14 0.19 0.22 0.29 0.28 0.34 0.25 0.20 0.32 2.45
58-58-403 City Of Buda PWS 97.8427000 30.0818900 3.27 3.00 3.43 3.12 3.71 3.40 4.67 5.61 5.75 4.04 3.06 3.27 46.33
58-58-406 Spectrum IND 97.8560200 30.0620300 0.03 0.02 0.02 0.13 0.03 0.02 0.02 0.01 0.01 0.02 0.01 0.02 0.35
58-58-407 Plant IND 97.8555300 30.0534500 2.07 1.81 2.36 2.19 1.92 2.53 3.36 2.46 3.10 2.65 2.21 2.69 29.35
58-58-409 Monarch Utilities (Tecon) PWS 97.8344400 30.0766700 1.06 0.93 1.03 1.03 1.25 1.44 1.69 1.69 1.59 1.37 1.18 1.35 15.61
58-58-410 Shoal Creek Properties COM 97.8388200 30.0668300 0.20 0.00 0.00 0.00 0.00 0.00 0.38 0.53 0.00 0.00 0.46 0.24 1.82
58-58-413 City Of Buda PWS 97.8354900 30.0705100 3.27 3.00 3.43 3.12 3.71 3.40 4.67 5.61 5.75 4.04 3.06 3.27 46.33
58-58-414 Centex Materials, LP. IND 97.8627500 30.0678100 7.81 5.62 8.12 7.96 8.05 7.29 10.17 12.13 9.66 8.26 6.90 9.84 101.82
58-58-415 Centex Materials, LP. IND 97.8650000 30.0708300 0.87 0.62 0.90 0.88 0.89 0.81 1.13 1.35 1.07 0.92 0.77 1.09 11.31
Hays County Youth Athletic
BSEACD Data Series Report 2006-1005 36
Table 7: Tabulation of pumping (million gallons) in 2004 and locations used for numerical model in the Barton Springs segment of the Edwards Aquifer.
State WellNum System/Owner Name Class. DD Long DD Lat Jan Feb Mar Apr May Jun Jul Aug Sep Oct Nov Dec 2004 Total
58-58-426 Lowden Bob PWS 97.8698700 30.0800000 0.04 0.03 0.03 0.04 0.04 0.04 0.04 0.03 0.04 0.03 0.03 0.04 0.44
58-58-4GF Goforth Water Supply Company PWS 97.8501700 30.0469100 8.03 6.04 8.34 7.66 9.23 8.63 9.47 11.56 10.89 8.68 6.57 7.14 102.24
58-58-4LC Painted Horse Pavilion COM 97.8736100 30.0708300 0.00 0.01 0.00 0.00 0.00 0.00 0.00 0.00 0.01 0.00 0.00 0.00 0.02
58-58-4MC Manchaca Baptist Church COM 97.8358300 30.1394400 0.00 0.45 0.02 0.03 0.04 0.00 0.06 0.05 0.02 0.01 0.01 0.03 0.71
58-58-501 Goforth Water Supply Company PWS 97.8305600 30.0783300 8.03 6.04 8.34 7.66 9.23 8.63 9.47 11.56 10.89 8.68 6.57 7.14 102.24
58-58-509 Chatleff Controls, Inc. IND 97.8300000 30.0761100 0.10 0.09 0.10 0.11 0.13 0.13 0.12 0.19 0.14 0.12 0.10 0.09 1.40
58-58-510 Crestview R.V. PWS 97.8275800 30.0793800 0.00 0.08 0.12 0.08 0.08 0.09 0.07 0.15 0.12 0.09 0.12 0.18 1.18
58-58-708 Monarch Utilities (Tecon) PWS 97.8522900 30.0421400 9.52 8.40 9.26 9.27 11.26 12.95 15.17 15.25 14.35 12.30 10.63 12.12 140.49
Table 8: Tabulation of calendar year pumping (million gallons) from the Trinity Aquifer in the District (1988-2005)
Year 1988 1989 1990 1991 1992 1993 1994 1995 1996 1997 1998
Million gallons 17.37 39.96 32.82 30.66 18.57 42.82 37.35 36.45 36.56 45.74 46.16
Year 1999 2000 2001 2002 2003 2004 2005
Million gallons 48.72 48.06 43.90 38.86 49.02 38.92 44.37

Table 9: Synthetic monthly pumpage (million gallons) in the Barton Springs segment of the Edwards Aquifer, 1947-1987. Calendar
Year Jan Feb Mar Apr May Jun Jul Aug Sep Oct Nov Dec Total
1987 78.55 71.53 61.24 86.11 93.83 121.72 121.01 119.65 111.00 102.32 84.27 81.25 1,164.00
1986 76.45 69.61 59.69 83.74 91.23 118.21 117.53 116.21 107.83 99.45 81.97 79.05 1,100.98
1985 74.34 67.69 58.14 81.38 88.63 114.70 114.05 112.78 104.67 96.57 79.66 76.86 1,069.47
1984 72.23 65.77 56.59 79.01 86.03 111.18 110.58 109.35 101.50 93.70 77.36 74.66 1,037.96
1983 70.12 63.84 55.05 76.65 83.43 107.67 107.10 105.91 98.33 90.83 75.05 72.47 1,006.45
1982 68.02 61.92 53.50 74.28 80.83 104.16 103.62 102.48 95.16 87.95 72.75 70.27 974.94
1981 65.91 60.00 51.95 71.92 78.23 100.64 100.15 99.05 92.00 85.08 70.44 68.08 943.43
1980 63.80 58.08 50.40 69.55 75.63 97.13 96.67 95.61 88.83 82.20 68.13 65.89 911.92
1979 61.69 56.15 48.85 67.19 73.03 93.61 93.19 92.18 85.66 79.33 65.83 63.69 880.41
1978 59.59 54.23 47.30 64.82 70.43 90.10 89.71 88.75 82.49 76.45 63.52 61.50 848.90
1977 57.48 52.31 45.75 62.46 67.83 86.59 86.24 85.32 79.32 73.58 61.22 59.30 817.39
1976 55.37 50.39 44.20 60.09 65.23 83.07 82.76 81.88 76.16 70.71 58.91 57.11 785.88
1975 53.26 48.47 42.65 57.73 62.63 79.56 79.28 78.45 72.99 67.83 56.61 54.91 754.37
1974 51.16 46.54 41.10 55.36 60.03 76.04 75.81 75.02 69.82 64.96 54.30 52.72 722.86
1973 49.05 44.62 39.56 53.00 57.43 72.53 72.33 71.58 66.65 62.08 51.99 50.53 691.35
1972 46.94 42.70 38.01 50.63 54.83 69.02 68.85 68.15 63.48 59.21 49.69 48.33 659.84
1971 44.83 40.78 36.46 48.27 52.23 65.50 65.38 64.72 60.32 56.34 47.38 46.14 628.33
1970 42.73 38.85 34.91 45.90 49.63 61.99 61.90 61.28 57.15 53.46 45.08 43.94 596.82
1969 40.62 36.93 33.36 43.54 47.03 58.48 58.42 57.85 53.98 50.59 42.77 41.75 565.31
1968 38.51 35.01 31.81 41.17 44.43 54.96 54.95 54.42 50.81 47.71 40.47 39.55 533.80
1967 36.40 33.09 30.26 38.81 41.83 51.45 51.47 50.99 47.64 44.84 38.16 37.36 502.29
1966 34.30 31.17 28.71 36.44 39.23 47.93 47.99 47.55 44.48 41.96 35.85 35.17 470.78
BSEACD Data Series Report 2006-1005 37
1965 32.19 29.24 27.16 34.08 36.63 44.42 44.51 44.12 41.31 39.09 33.55 32.97 439.27
1964 30.08 27.32 25.61 31.72 34.03 40.91 41.04 40.69 38.14 36.22 31.24 30.78 407.76

BSEACD Data Series Repo
Table 9 Calendar
Year 1963
1962
1961
1960
1959
1958
1957
1956
1955
1954
1953
1952
1951
1950
1949
1948
1947
rt 2006-1005 38
: Synthetic monthly pumpage (million gallons) in the Barton Springs segment of the Edwards Aquifer, 1947-1987.
Jan Feb Mar Apr May Jun Jul Aug Sep Oct Nov Dec Total
27.97 25.40 24.07 29.35 31.42 37.39 37.56 37.25 34.97 33.34 28.94 28.58 376.25
25.87 23.48 22.52 26.99 28.82 33.88 34.08 33.82 31.80 30.47 26.63 26.39 344.75
23.76 21.55 20.97 24.62 26.22 30.37 30.61 30.39 28.64 27.59 24.32 24.19 313.24
21.65 19.63 19.42 22.26 23.62 26.85 27.13 26.95 25.47 24.72 22.02 22.00 281.73
19.54 17.71 17.87 19.89 21.02 23.34 23.65 23.52 22.30 21.85 19.71 19.81 250.22
17.44 15.79 16.32 17.53 18.42 19.82 20.18 20.09 19.13 18.97 17.41 17.61 218.71
15.33 13.87 14.77 15.16 15.82 16.31 16.70 16.66 15.96 16.10 15.10 15.42 187.20
13.22 11.94 13.22 12.80 13.22 12.80 13.22 13.22 12.80 13.22 12.80 13.22 155.69
11.12 10.02 11.67 10.43 10.62 9.28 9.75 9.79 9.63 10.35 10.49 11.03 124.18
9.01 8.10 10.12 8.07 8.02 5.77 6.27 6.36 6.46 7.47 8.18 8.83 92.67
6.90 6.18 8.58 5.70 5.42 2.25 2.79 2.92 3.29 4.60 5.88 6.64 61.16
4.79 4.25 7.03 3.34 2.82 2.00 2.00 2.00 2.00 2.00 3.57 4.45 40.25
2.69 2.33 5.48 2.00 2.00 2.00 2.00 2.00 2.00 2.00 2.00 2.25 28.75
2.00 2.00 3.93 2.00 2.00 2.00 2.00 2.00 2.00 2.00 2.00 2.00 25.93
2.00 2.00 2.38 2.00 2.00 2.00 2.00 2.00 2.00 2.00 2.00 2.00 24.38
2.00 2.00 2.00 2.00 2.00 2.00 2.00 2.00 2.00 2.00 2.00 2.00 24.00
2.00 2.00 2.00 2.00 2.00 2.00 2.00 2.00 2.00 2.00 2.00 2.00 24.00

BSEACD Data Series Report 2006-1005 39
Board, Report 296, 90 p.
ACKNOWLEDGMENTS This report is chiefly a product of the District’s sustainable yield evaluations (Smith and Hunt, 2004). Data in this report are the culmination of many years of data collection by a variety of District and other agencies. The Texas Water Development Board collected much of the data prior to creation of the District in 1987. Shu Liang (District) developed and originally populated the District databases with historic data from the Texas Water Development Board. Many district employees collected and entered well and pumping data into the District databases including: Shu Liang, Nico Hauwert, Joe Beery, Shannon DeLong, Ron Fieseler, Stefani Campbell, Beckie Morris, Brian Hunt, and Mark Mathis. Kirk Holland created Table 9, a synthetic pumpage data set from 1987 to 1947 that was used for evaluations in the District’s Habitat Conservation Plan. Joe Beery created Table 3, a list of 2006 permittees and their wells. REFERENCES Ashworth, J. B., 1983, Ground-Water Availability of the Lower Cretaceous Formations
in the Hill Country of South-Central Texas: Texas Department of Water Resources, Report 273, 172 p.
Ashworth, J.B., and J., Hopkins, 1995, Aquifers of Texas, Texas Water Development Board Report 345, 69 p., November, 1995.
Baker, E. T., Slade, R. M., Dorsey, M. E., Ruiz, L. M., and Duffin, G. L., 1986, Geohydrology of the Edwards Aquifer in the Austin Area, Texas: Texas Water Development Board, Report 293, 216 p.
Barker, R. A., Bush, P. W., and Baker, E. T., Jr., 1994, Geologic History and Hydrogeologic Setting of the Edwards-Trinity Aquifer System, West-Central Texas: U.S. Geological Survey, Water-Resource Investigations Report 94-4039, 51 p.
Brune, Gunnar and Duffin, Gail, 1983, Occurrence, Availability, and Quality of Ground Water in Travis County, Texas: Texas Department of Water Resources, Report 276, 219 p.
Caran, S.C., T. Housh, AlJ. Cherepon, 2006, Volcanic Features of the Austin Area, Texas: Austin Geological Society Fieldtrip Guidebook 26; 110 p.
DeCook, K. J., 1960, Geology and Ground-Water Resources of Hays County, Texas: Texas Board of Water Engineers, Bulletin 6004, 170 p.
Flores, R., 1990, Test Well Drilling Investigation to Delineate the Downdip Limits of Usable-Quality Groundwater in the Edwards Aquifer in the Austin Region, Texas: Texas Water Development Board, Report 325, 70 p.
Maclay, R. W., 1995, Geology and Hydrology of the Edwards Aquifer in the San Antonio Area, Texas: U.S. Geological Survey, Water-Resources Investigations Report 95-4186, 64 p.
Maclay, R. W., and Small, T. A., 1986, Carbonate Geology and Hydrogeology of the Edwards Aquifer in the San Antonio Area, Texas: Texas Water Development

Rose, P., 1972, Edwards Group, Surface and Subsurface, Central Texas. The University of Texas at Austin, Bureau of Economic Geology Report of Investigations No. 74.
Senger, R. K. and Kreitler, C. W., 1984, Hydrogeology of the Edwards Aquifer, Austin Area, Central Texas: The University of Texas at Austin, Bureau of Economic Geology Report of Investigations No. 141, 35 p.
Slade, Raymond, Jr., Dorsey, Michael, and Stewart, Sheree, 1986, Hydrology and Water Quality of the Edwards Aquifer Associated with Barton Springs in the Austin Area, Texas: U.S. Geological Survey Water-Resources Investigations, Report 86-4036, 117 p.
Slade, Raymond, Jr., Ruiz, Linda, and Slagle, Diana, 1985, Simulation of the Flow System of Barton Springs and Associated Edwards Aquifer in the Austin Area, Texas: U.S. Geological Survey, Water-Resources Investigations Report 85-4299, 49 p.
Slagle, D. L., Ardis, A. F., and Slade, R. M., Jr., 1986, Recharge Zone of the Edwards Aquifer Hydrologically Associated with Barton Springs in the Austin Area, Texas: U. S. Geological Survey Water-Resources Investigations, Report 86-4062, Plate.
Small, T. A., Hanson, J. A., and Hauwert, N. M., 1996, Geologic Framework and Hydrogeologic Characteristics of the Edwards Aquifer Outcrop (Barton Springs Segment), Northeastern Hays and Southwestern Travis Counties, Texas: U.S. Geological Survey Water-Resources Investigations, Report 96-4306, 15 p.
Smith, B., and Hunt, B., 2004, Evaluation of Sustainable Yield of the Barton Springs Segment of the Edwards Aquifer, Hays and Travis Counties, Central Texas. BSEACD Austin, Texas. http://www.bseacd.org/research.html>(June 6, 2005).
BSEACD Data Series Report 2006-1005 40

GLOSSARY (from District Rules and Bylaws, dated January 2006) “Abandoned Well” - a well that has not been used for a beneficial purpose for at least
six consecutive months and/or a well not registered with the District. A well is considered to be in use in the following cases:
1. A non-deteriorated well which contains the casing, pump and pump column in
good condition; or 2. A non-deteriorated well which has been capped; or 3. the well is used in the normal course and scope and with the intensity and
frequency of other similar users in the general community; or 4. the owner is participating in the Conservation Reserve Program authorized by
Sections 1231-1236, Food Security Act of 1985 (16 U.S.C. Sections 3831-3836), or a similar governmental program.
“Agricultural Well” - a well providing groundwater for agricultural livestock use or
agricultural irrigation use. (A non-exempt well.) “Aquifer” - a geologic formation that will yield water to a well in sufficient quantities to
make the production of water from this formation feasible for beneficial use. “Artesian Zone” - a zone where water is confined in an aquifer under pressure so that the
water will rise in the well casing or drilled hole above the bottom of the confining bed overlying the aquifer.
“Bad Water Line” - the eastern boundary of Edwards Aquifer water in the Barton
Springs segment of the Edwards Aquifer characterized by having more than 1,000 milligrams per liter (mg/l) of total dissolved solids.
“Barton Springs Segment” - that segment of the Edwards Aquifer which is
hydrologically connected to Barton Springs and is the term used to distinguish this segment from the San Antonio segment of the Edwards Aquifer and from the northern Edwards Aquifer.
“Closed Loop Well” - a well constructed for circulating water through a continuous
length of tubing, generally for earth coupled-heat exchange purposes. See also Earth Coupled Heat Exchange-Closed Loop System. (An exempt well).
“Commercial Use” – the use associated with supplying water to properties or
establishments, which are in business to build, supply, or sell products, or provide goods, services or repairs and which use water in those processes or used primarily for employee and customer conveniences (i.e. flushing of toilets, sanitary purposes, and limited landscape watering). This includes use in other
BSEACD Data Series Report 2006-1005 41

business enterprises for which monetary consideration is given or received, which will typically increase water demand compared to typical domestic use.
“Confining Bed” - a body of impermeable or distinctly less permeable material
stratigraphically adjacent to one or more aquifers. “Cubic Feet Per Second” (cfs) - the rate of discharge representing a volume of 1 cubic
foot passing a given point during 1 second of time. This rate is equivalent to approximately 7.48 gallons per second or 448.8 gallons per minute.
“Discharge” – means the amount of water that leaves an aquifer by natural or artificial
means. “District” - the Barton Springs/Edwards Aquifer Conservation District (BS/EACD). “Domestic Use”- water used by, and connected to a household for personal needs or for
household purposes such as drinking, bathing, heating, cooking, sanitation or cleaning, and landscape irrigation. Ancillary use may include watering of domestic animals.
“Drought” - a shortfall in Edwards Aquifer recharge, generally brought about by below-
normal rainfall for an extended period of time that is accompanied by high rates of pumping from the Aquifer, that has the potential for substantial negative impacts to water-supply wells and to endangered species at Barton Springs.
“Edwards Aquifer” - the water-bearing zone comprised of the Edwards and associated
limestone formations. “Exempt Well” - a well may be exempt if it is:
A. A well that is used solely to supply the domestic use needs of 5 or fewer households and a person who is a member of each household is either the owner of the well, a person related to the owner or a member of the owner’s household within the second degree by consanguinity, or an employee of the owner that is either drilled, completed or equipped so that it is incapable of producing more than 10,000 gallons of groundwater a day on a tract of land larger than 10 acres or;
B. A well that is used for providing water for livestock or poultry that is
either drilled, completed, or equipped so that it is incapable of producing more than 10,000 gallons of groundwater a day on a tract of land larger than 10 acres.
BSEACD Data Series Report 2006-1005 42

BSEACD Data Series Report 2006-1005 43
landscape irrigation not tied to domestic use.
“Fault” - a fracture or fracture zone in a rock or body of rock, along which there has been movement of the geologic formation on one side of the fault plane relative to the other side, parallel to the fracture.
“Fiscal Year” - the business year of the District begins on September 1 of each year and
ends on August 31 of the following year. “Groundwater or Underground Water” - water located beneath the earth's surface but
does not include water produced with oil and gas production. “Industrial Use” – the use of water in the building, production, manufacturing, or
alteration of a product or good. This includes the use associated with washing, cleansing, cooling, or heating such goods or products.
“Injection Well” - a well used to inject water or other material into a subsurface
formation or into pipe or tubing placed in the formation for the purpose of storage or disposal of the fluid. (An exempt well.) “Injection well” includes:
(1) an air-conditioning return flow well used to return water that has been used for heating or cooling in a heat pump to the aquifer that supplied the water;
(2) a cooling water return flow well used to inject water that has been used for cooling;
(3) a drainage well used to drain surface fluid into a subsurface formation;
(4) a recharge well used to replenish water in an aquifer;
(5) a saltwater intrusion barrier well used to inject water into a freshwater aquifer to prevent the intrusion of salt water into fresh water;
(6) a sand backfill well used to inject a mixture of water and sand, mill tailings, or other solids into subsurface mines; and
(7) a subsidence control well used to inject fluids into a non-oil-producing or non-gas-producing zone to reduce or eliminate subsidence associated with the overdraft of fresh water.
“Irrigation Use” - the application of water, not associated with agricultural irrigation
use, to plants or land in order to promote growth of plants, turf, or trees. Irrigation use includes but is not limited to athletic fields, parks, golf courses, and
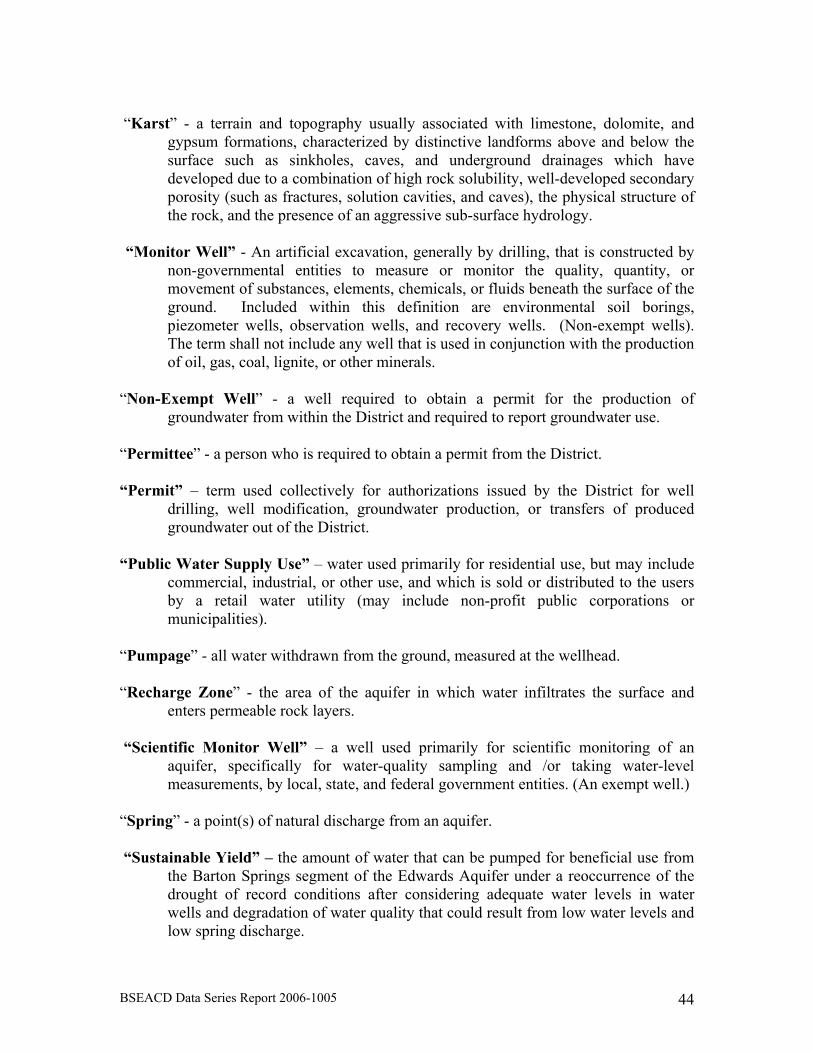
BSEACD Data Series Report 2006-1005 44
low spring discharge.
“Karst” - a terrain and topography usually associated with limestone, dolomite, and
gypsum formations, characterized by distinctive landforms above and below the surface such as sinkholes, caves, and underground drainages which have developed due to a combination of high rock solubility, well-developed secondary porosity (such as fractures, solution cavities, and caves), the physical structure of the rock, and the presence of an aggressive sub-surface hydrology.
“Monitor Well” - An artificial excavation, generally by drilling, that is constructed by
non-governmental entities to measure or monitor the quality, quantity, or movement of substances, elements, chemicals, or fluids beneath the surface of the ground. Included within this definition are environmental soil borings, piezometer wells, observation wells, and recovery wells. (Non-exempt wells). The term shall not include any well that is used in conjunction with the production of oil, gas, coal, lignite, or other minerals.
“Non-Exempt Well” - a well required to obtain a permit for the production of
groundwater from within the District and required to report groundwater use. “Permittee” - a person who is required to obtain a permit from the District. “Permit” – term used collectively for authorizations issued by the District for well
drilling, well modification, groundwater production, or transfers of produced groundwater out of the District.
“Public Water Supply Use” – water used primarily for residential use, but may include
commercial, industrial, or other use, and which is sold or distributed to the users by a retail water utility (may include non-profit public corporations or municipalities).
“Pumpage” - all water withdrawn from the ground, measured at the wellhead. “Recharge Zone” - the area of the aquifer in which water infiltrates the surface and
enters permeable rock layers. “Scientific Monitor Well” – a well used primarily for scientific monitoring of an
aquifer, specifically for water-quality sampling and /or taking water-level measurements, by local, state, and federal government entities. (An exempt well.)
“Spring” - a point(s) of natural discharge from an aquifer. “Sustainable Yield” – the amount of water that can be pumped for beneficial use from
the Barton Springs segment of the Edwards Aquifer under a reoccurrence of the drought of record conditions after considering adequate water levels in water wells and degradation of water quality that could result from low water levels and
“Total Dissolved Solids” (TDS) - a measurement of the quantity of minerals, chemical compounds, elements, or other matter contained in a state of solution by water. “Trinity Group Aquifer” - includes: the Upper Member of the Glen Rose Formation,
known as the Upper Trinity; the Lower Member of the Glen Rose Formation, and the Hensel Sand and Cow Creek Limestone Members of the Travis Peak Formation, known as the Middle Trinity; and the Sligo and Hosston Members of the Travis Peak Formation, known as the Lower Trinity.
BSEACD Data Series Report 2006-1005 45

BSEACD Data Series Report 2006-1005 46
APPENDIX Compact disk containing digital files of figures and tables within the report. In addition, the disk contains: 1) Pumping database 1988 to 2005; and 2) Well database containing basic well information. Software needed to open digital files include Microsoft Word and Excel, and Adobe Acrobat Reader.