Embed Size (px)
Citation preview

Lawrence Berkeley National Laboratory • Earth Sciences Division 1 Cyclotron Road, MS 90-1116 • Berkeley, CA 94720 • 510-486-6455
Well Stimulation in California
Preston Jordan State Water Resources Control Board
April 8, 2015

Preston Jordan 2 8 April 2015
• The California Council on Science and Technology – Provided oversight, scientific guidance and input for the project
• Lawrence Berkeley National Laboratory – Performed the majority of the analyses
• Subcontractors: – The Pacific Institute – Physicians, Scientists and Engineers for Healthy Energy – Stanford University – Dan Gautier (USGS retired) – Scripps Institute of Oceanography – CSU Stanislaus Endangered Species Recovery Program – University of the Pacific
Team Performing the Independent Scientific Review of Well Stimulation

Preston Jordan 3 8 April 2015
• CCST is a nonpartisan, impartial, not-for-profit 501(c)(3) corporation established via Assembly Concurrent Resolution (ACR 162) in 1988 by a unanimous vote of the California Legislature
• It is designed to offer expert advice to the state government and to recommend solutions to science and technology-related policy issues.
• CCST is governed by a Board of Directors composed of representatives from its sponsoring academic institutions, from the corporate and business community, and from the philanthropic community

Preston Jordan 4 8 April 2015
Lawrence Berkeley National Laboratory
Discovery science, energy innovation and environmental solutions ~$800 Million Budget; 4,200 Employees; 1,000 Students 13 Nobel Prizes – most recent in 2011 for the discovery of dark energy 70 members of the National Academy of Sciences (~3% of the Academy) 10,000 researchers from industry/universities annually use the Lab’s unique
research facilities.
Managed by the University of California for the U.S. Department of Energy
Earth Sciences at Berkeley Lab
MISSION ...to create new knowledge and capabilities
needed to enable sustainable stewardship of critical environmental systems and
judicious use of the Earth’s natural energy resources.

Preston Jordan 5 8 April 2015
Partial List of Researchers
1University of the Pacific, 2Lawrence Berkeley National Laboratory, 3Pacific Institute, 4California Council on Science & Technology
• Jens Birkholzer2 • Heather Cooley3 • Kristina Donnelly3 • Jeremy Domen1
• Laura Feinstein4
• Jeremy Hanlon1,2
• Jane Long4
• Matthew Heberger3 • James Houseworth2 • Matthew Reagan2
• Whitney Sandelin1
• Will Stringfellow1,2 • Charuleka
Varadharajan2

Preston Jordan 6 8 April 2015
• Data utilized • California versus elsewhere • Water use per operation • Number of operations • Geographic distribution • Water use by area • Number of constituents • Constituent properties • Produced water disposal release mechanisms • Subsurface release mechanisms
Outline

Preston Jordan 7 8 April 2015
Data Sources Utilized
HF = hydraulic fracturing; AF = acid fracturing; MA = matrix acidizing Department of Oil Gas & Geothermal regulation (DOGGR), Central Valley Regional Water Quality Control Board (CVRWQCB) , South Coast Air Quality Management District (SCAQMD)
Data source
Year
s
Req
uire
d
HF
AF
MA
API #
Loca
tion
Dat
e
Volu
me
Che
mic
als
Depth
DOGGR disclosures
2014 x x x x x x x x x x
DOGGR notices
2014 x x x x x x x x x
SCAQMD 2013-2014 x x x x partial x x x x
CVRWQCB 2012-2013 x x x x x x x x TVD
FracFocus 2011-2014 partial p x x x x partial TVD
Well record search
2002-2013 p x
DOGGR GIS well table
all p x x MD-
partial

Preston Jordan 8 8 April 2015
Data Sources Utilized
Data source
Year
s
Req
uire
d
HF
AF
MA
API #
Loca
tion
Dat
e
Volu
me
Che
mic
als
Depth
DOGGR disclosures
2014 x x x x x x x x x x
DOGGR notices
2014 x x x x x x x x x
SCAQMD 2013-2014 x x x x partial x x x x
CVRWQCB 2012-2013 x x x x x x x x TVD
FracFocus 2011-2014 partial p x x x x partial TVD
Well record search
2002-2013 p x
DOGGR GIS well table
all p x x MD-
partial
Each has its own advantages and disadvantages, but together they provide an accurate, if not complete and precise, understanding.

8 April 2015
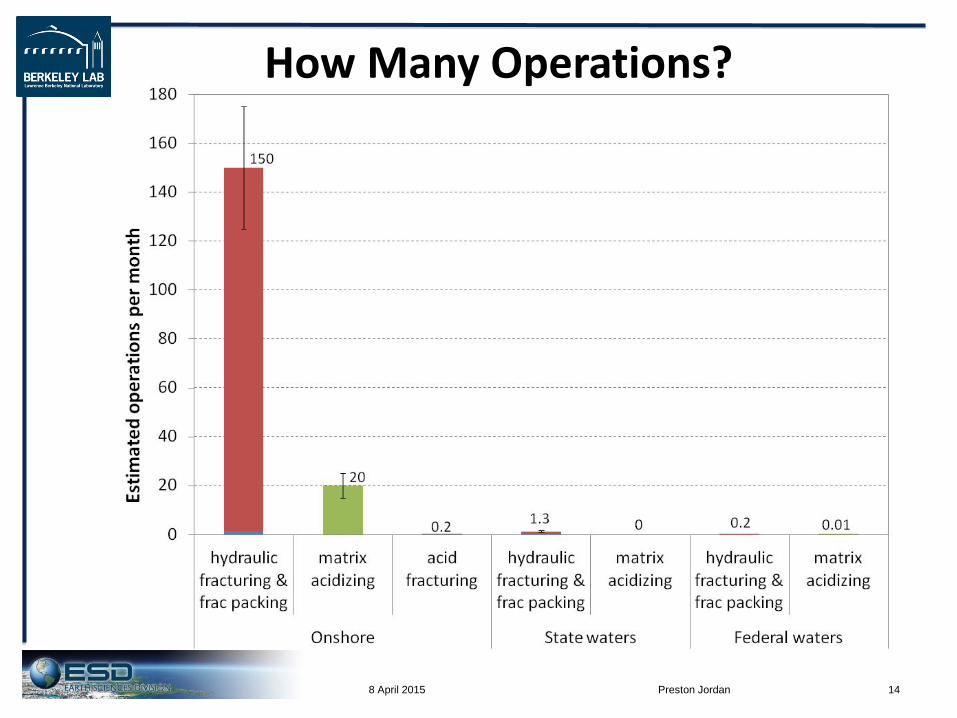
2002-2014: 100 million m3 oil (600 million bbl)
Cal
iforn
ia: v
ario
us g
eolo
gic
units
Hydraulic Fracturing Distribution
through 2013: 110 million m3 oil (700 million bbl)
http
://en
ergy
.usg
s.go
v/Po
rtals
/0/R
oom
s/oi
l_an
d_ga
s/no
ga/m
ultim
edia
/201
3_Ba
kken
_Thr
eeFo
rks_
Asse
ssm
ent.p
df
Preston Jordan 9
Nor
th D
akot
a an
d M
onta
na:
Bakk
en a
nd T
hree
For
ks

Preston Jordan 10 8 April 2015

Preston Jordan 11 8 April 2015
CA Hydraulic Fractures: Smaller and Simpler
• Smaller volumes of water • Gel-based (Guar gum)
additive • Simpler fractures with larger
aperture
• Larger volumes of water • Slick-water (detergents)
additives • Complex fracture
networks • (Banned in New York)
Typical California Vertical Well Application
High Volume – Horizontal Well Application

0 100,000 200,000 300,000 400,000 500,000
0 500 1,000 1,500
Frequency
Observations
Kernel Density
Water use per operation (m³)
Water use per operation (gallons)
Preston Jordan 12 8 April 2015
Distribution of water use per hydraulic fracturing operation in California?
1.5 acre feet
1,723 operations shown; 59 additional operations
CA Average: 530 m3 (140,000 gal)
Much less than the >4,000 m3 (3 acre feet) per operation typical elsewhere (e.g., Eagle Ford, Bakken)

0 100,000 200,000 300,000 400,000 500,000
0 500 1,000 1,500
Frequency
Observations
Kernel Density
Water use per operation (m³)
Water use per operation (gallons)
Preston Jordan 13 8 April 2015
New York State’s Definition of HVHF: 1,100 m3 (300,000 gallons)
Distribution of water use per hydraulic fracturing operation in California?
1.5 acre feet
CA Average: 530 m3 (140,000 gal)
Much less than the >4,000 m3 (3 acre feet) per operation typical elsewhere (e.g., Eagle Ford, Bakken)
Preston Jordan 14 8 April 2015
How Many Operations?
Preston Jordan 15 8 April 2015

Preston Jordan 16 8 April 2015

Preston Jordan 17 8 April 2015

Preston Jordan 18 8 April 2015

Preston Jordan 19 8 April 2015

Preston Jordan 20 8 April 2015
Planning Area
Estimated annual hydraulic fracturing Annual
supply for enabled EOR (m³)
Estimated annual water use
Water use in
Planning Area Operations
Water demand
(m³) (acre-feet)
Semitropic (Kern) 1,600 850,000 1,800,000 2,700,000 2,200 0.17%
Kern Delta (Kern) 4 2,100 2,100 1.7 0.00011%
Kern Valley Floor (Kern, Tulare) 34 18,000 18,000 15 0.0017%
Uplands (Fresno, Tulare, Kern) 18 9,500 9,500 7.7 0.015%
Western Uplands (San Benito, Fresno, Kings, Kern)
6 2,900 2,900 2.4 0.1%
San Luis West Side (Fresno, Kings) 1 270 270 0.22 0.000017%
Water Demand by Planning Area

Preston Jordan 21 8 April 2015
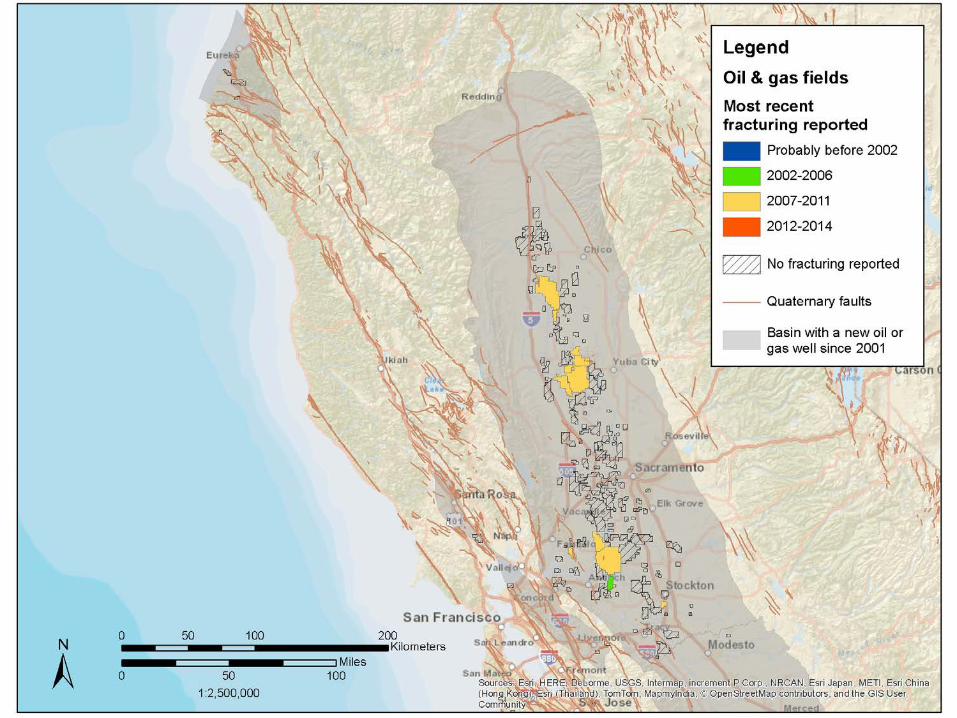
• The median number of constituents used in each hydraulic fracturing operation is less than 30
• Number of constituents each in North and South Belridge, Elk Hills, and Lost Hills fields ranged from 70 to 196
How Many Stimulation Constituents?
Preston Jordan 22 8 April 2015
• 300 unique constituents and constituent mixtures voluntarily disclosed
• Half are used in less than 1% of operations
• Some entries indicate there are more constituents undisclosed
How Many Stimulation Constituents?

Preston Jordan 23 8 April 2015
How Acutely Toxic Are Constituents?
The lower the Globally Harmonized System category number (GHS), the more acutely toxic the constituent. No constituents were identified that had an acute oral toxicity of 1, which is the most toxic, and few GHS 2. Some constituents had an acute aquatic toxicity of 1. Acute toxicity was not available for many constituents.
Acute Aquatic Toxicity (Daphnia Magna)
Acute Oral Toxicity (g. Rattus)

Preston Jordan 24 8 April 2015
Other Relevant Properties?
Biodegradability is relevant to a constituents persistence in the environment. Log Kow is relevant to the bioaccumulation potential of a constituent.
Availability of Log Kow
Biodegradability of Organic Chemicals

Wastewater Characteristics • “Recovered fluid” (water captured prior to
production, also defined as “flowback”) characteristics in stimulation completion reports – Fluids can represent a mixture of formation water,
returned stimulation fluids and well cleanout fluids – Volumes are small relative to stimulation fluid volume – Chemical analysis of some samples show high levels
of total carbohydrates (guar gum), TDS, trace elements, NORMs and organics.
• Most stimulation fluid returns are commingled and co-managed with other “produced water”
Preston Jordan 25 8 April 2015

Preston Jordan 26 8 April 2015
First month after hydraulic fracturing from 2011 to late 2014, however some operators have indicated they submitted data
indicating disposal in ponds that is actually by injection
How Is Produced Water from Hydraulically Fractured Wells Disposed?
Preston Jordan 27 8 April 2015
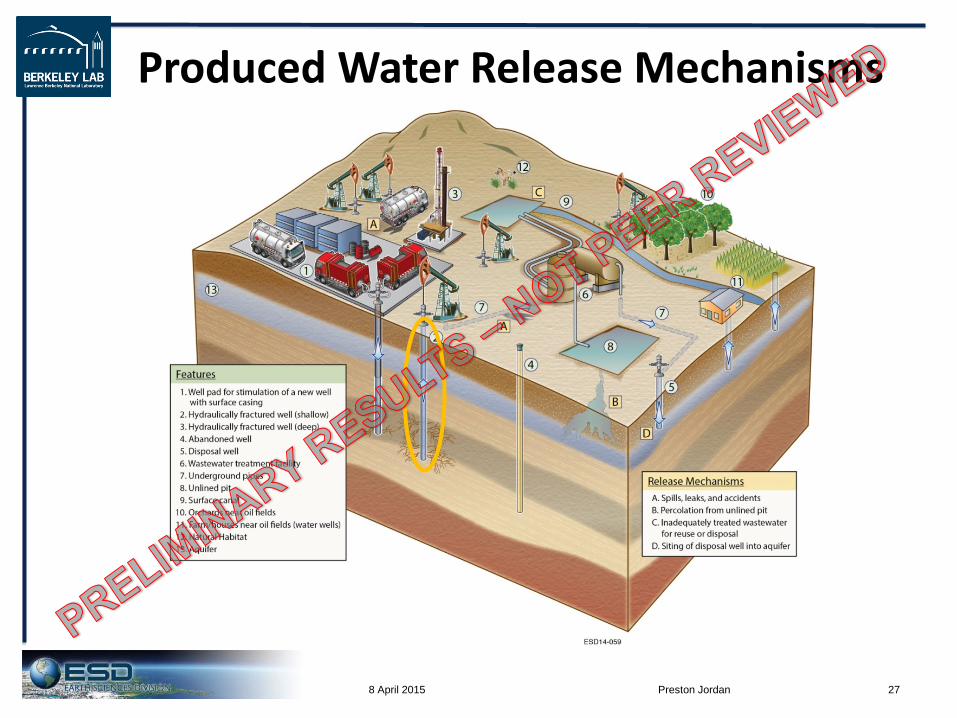
Produced Water Release Mechanisms

Preston Jordan 28 8 April 2015
Produced Water Release Mechanisms

Preston Jordan 29 8 April 2015
Produced Water Release Mechanisms

Unlined sumps in San Joaquin Valley
Preston Jordan 30 8 April 2015
• 933 sumps as of April 2015
• 62% active • 38% inactive
• 36% of active sumps are not permitted
• Spot checking indicates some sumps are not included
Data from Central Valley Regional Water Quality Board
Preston Jordan 31 8 April 2015
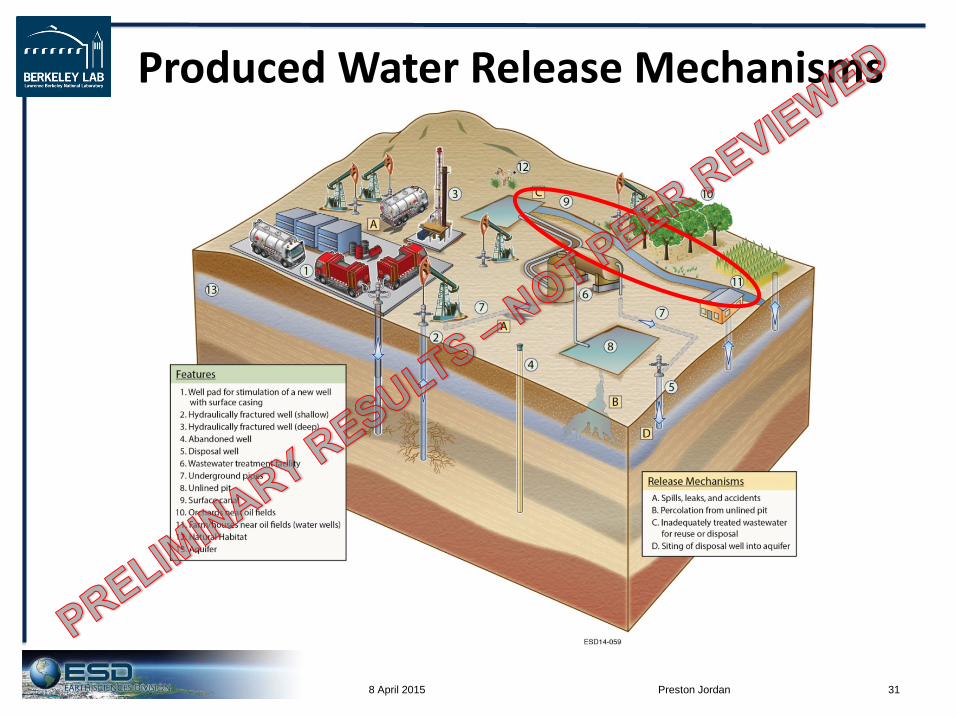
Produced Water Release Mechanisms

Preston Jordan 32 8 April 2015
Produced Water Release Mechanisms
http://blogs.kqed.org/science/audio/california-farmers-look-to-oil-industry-for-water/
Produced water used for irrigation in the Cawelo Water District
Preston Jordan 33 8 April 2015
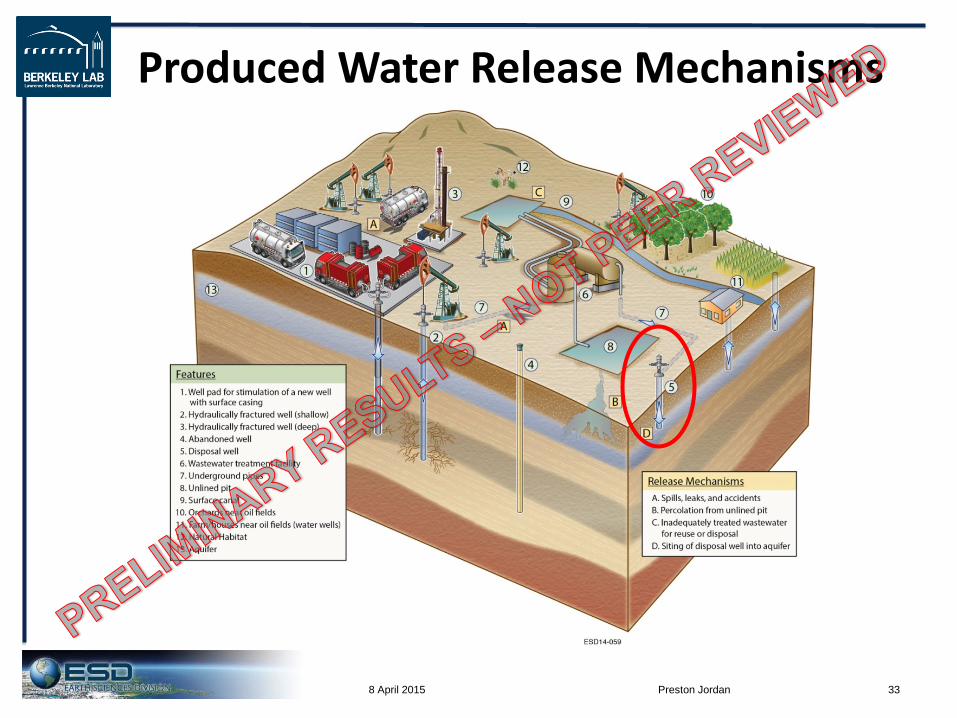
Produced Water Release Mechanisms

Preston Jordan 34 8 April 2015
Water Disposal Well Review by DOGGR

Preston Jordan 35 8 April 2015
Potential Subsurface Release
Mechanisms

Preston Jordan 36 8 April 2015
Potential Subsurface Release
Mechanisms - Driving Force Only During Fracturing

Preston Jordan 37 8 April 2015
Potential Subsurface Release
Mechanisms - Hydraulic Fractures

Preston Jordan 38 8 April 2015
Depth to Top of Fractured Interval

Preston Jordan 39 8 April 2015

Preston Jordan 40 8 April 2015
Potential Subsurface Release
Mechanisms - Fracturing Well

Preston Jordan 41 8 April 2015
Potential Subsurface Release
Mechanisms - Fracturing Well & Offset Wells

Preston Jordan 42 8 April 2015
Potential Leakage Via Wells • Well records indicate about an hour to fracture one stage
at an average flow rate of about 1,000 gallons/minute
• On the order of 1 out of 20 wells would likely have a detectable gas leak if gas were present (Watson and Bachu, 2009), but the volume of stimulation fluid that might be released would be practically undetectable
• On the order of 1 out of 20,000 steam injection wells blows out upon commencement of injection

Preston Jordan 43 8 April 2015
Potential Subsurface Release
Mechanisms - Fault
density suggests tens of
intersections per year

Preston Jordan 44 8 April 2015
Potential Subsurface Release
Mechanisms - Fault
sealing in natural state, but how do they respond to
being intersected?

Preston Jordan 45 8 April 2015
• Little water use • Tens of constituents per operation, a couple
hundred in regular use statewide • Basic, environmentally relevant parameters
needed for many constituents • Produced water is the main concern currently,
both what it contains and how it is disposed • Research is needed regarding propagation of
shallow fractures and fault response to fracture intersection (dedicated field site?)
Conclusions and Needs

Preston Jordan 46 8 April 2015
Acknowledgments We thank: • The California State Office of the Bureau of Land
Management for contracting the team in 2013 to review hydraulic fracturing technology, practice, and potential environmental impacts in onshore oil production in California,
• The California Department of Conservation for contracting with the same team to expand and extend the review to include production of gas and offshore along with potential human health impacts, and
• Lawrence Livermore National Laboratory and you for involving us in developing groundwater monitoring guideline recommendations regarding well stimulation