Embed Size (px)
Citation preview
Welding Research Sponsored by the Welding Research Counc
of the Engineering Foundation
S U P P L E M E N T TO THE W E L D I N G J O U R N A L , A P R I L 1972
The Establishment of Safe Welding Procedures for Steels
A study of the hydrogen cracking behavior of C-Mn and low alloy steels has led to the development of statistically based welding procedures for a range of C-Mn steel compositions
BY N. B A I L E Y
Introduction Organizations like The Welding In
stitute are frequently asked for guidance on how to weld steels which are new to a particular fabricator. It is therefore necessary to have a rational way of devising welding procedures which are safe, but which are not so conservative that they are uneconomic.
About 7 years ago Baker et al. laid down the steps needed to determine welding procedures1 for steels in which hydrogen induced delayed cold cracking was expected to be the major problem. The steps can be briefly summarized:
N. BAILEY is with the Metallurgical Laboratory of The Welding Institute, Cambridge, England.
4.
Establish the transformation characteristics of the steel so that heat affected zone (HAZ) hardness and microstructure can be predicted Determine the susceptibility of the steel to hydrogen cracking when welded Predict safe welding procedures Establish confidence in the predicted procedures by some form of welding test.
The present paper describes progress in this field since that time to test the validity of the above concept.2
This has led to a technique for the prediction of statistically based safe welding procedures for carbon-manganese steels, to a better understanding of hydrogen cracking and to an understanding of how more economical procedures can be developed.
Experimental Approach Four carbon-manganese and low al
loy steels were selected and an assessment made of their weldability as outlined in steps (1) and (2) above. Welding procedures designed to avoid hydrogen cracking were then devised and checked using the same casts of steel in a specially devised fillet welded fabrication.
Hydrogen cracking is closely associated with hardening of the HAZ as it cools rapidly after welding. A high speed dilatometer determined the continuous cooling transformation (CCT) behavior of the test steels at cooling rates typical of manual shielded metal-arc welding.3 Hollow cylindrical specimens, 0.95 m m(0.038 in.) thick were induction heated to 1325C (2417-F ) , cooled in argon at different rates and the microstructure examined and hardness measured. This enabled HAZ
W E L D I N G R E S E A R C H S U P P L E M E N T [ 169-s
test weld©.
Thermocouple
•* l-6mm thick shim
^ ^ S 76 mm
^
4 -
76mm
JViWrVr
102 mm
• 2 5 1 mm
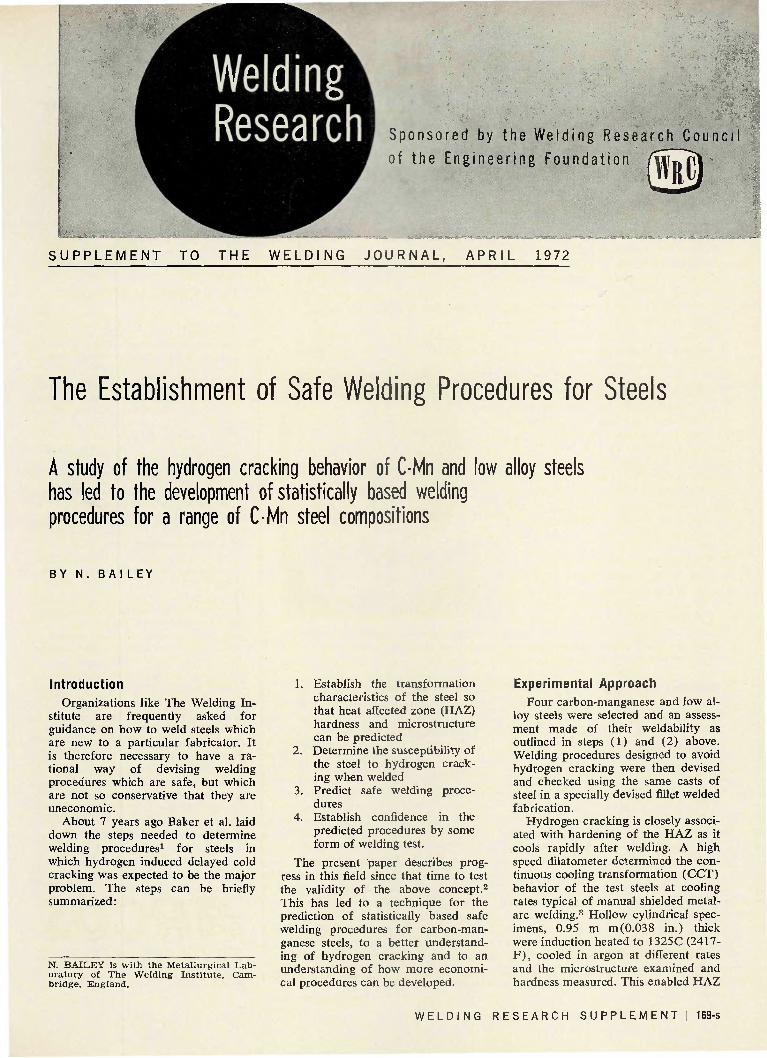
Fig. 1—CTS test assembly showing details of shim, position of thermocouple and method of cooling after welding. C = combined thickness of test weld; L = nominal leg length of test weld
hardnesses to be predicted from HAZ cooling rates which could be determined from welding parameters.*
Although a variety of tests are available to assess the susceptibility of a steel to hydrogen cracking, the controlled thermal severity (CTS) test was chosen so that dilatometric predictions could be compared with actual HAZ cooling rates, microstructures and hardnesses and also the boundary between cracking and no cracking obtained for welding processes of different hydrogen potentials.
The CTS test has long been used to examine hydrogen cracking behavior but it is important to point out two modifications that have been found necessary to simulate the behavior of real weldments more accurately. One is the presence of a root gap of 1.6 mm (1/64 in.) to represent poor fit which is present in most structures.
This has been shown5 to increase the risk of hydrogen cracking when using low hydrogen consumables in a fillet weld if the root gap exceeds 0.4 mm (1/16 in.) . The other modification is that the test piece is cooled after welding as shown in Fig. 1 to prevent the temperature of the test piece equalizing at a temperature above ambient, an effect which does not happen in large fabrications, particularly if the preheat is applied locally to the weld area.
Temperature equalization would reduce the risk of cracking in the CTS test because more hydrogen would diffuse out during the slower cool from the equalization temperature so that the HAZ would contain less hydrogen at the temperature at which cracking is most likely, about 20C (70F). In addition to the above modifications, limited thermal records
were made using a thermocouple in the HAZ near the toe of the test weld (a location easy to monitor in practice) to compare cooling rates with those taken near the root which had been done in previous work.4
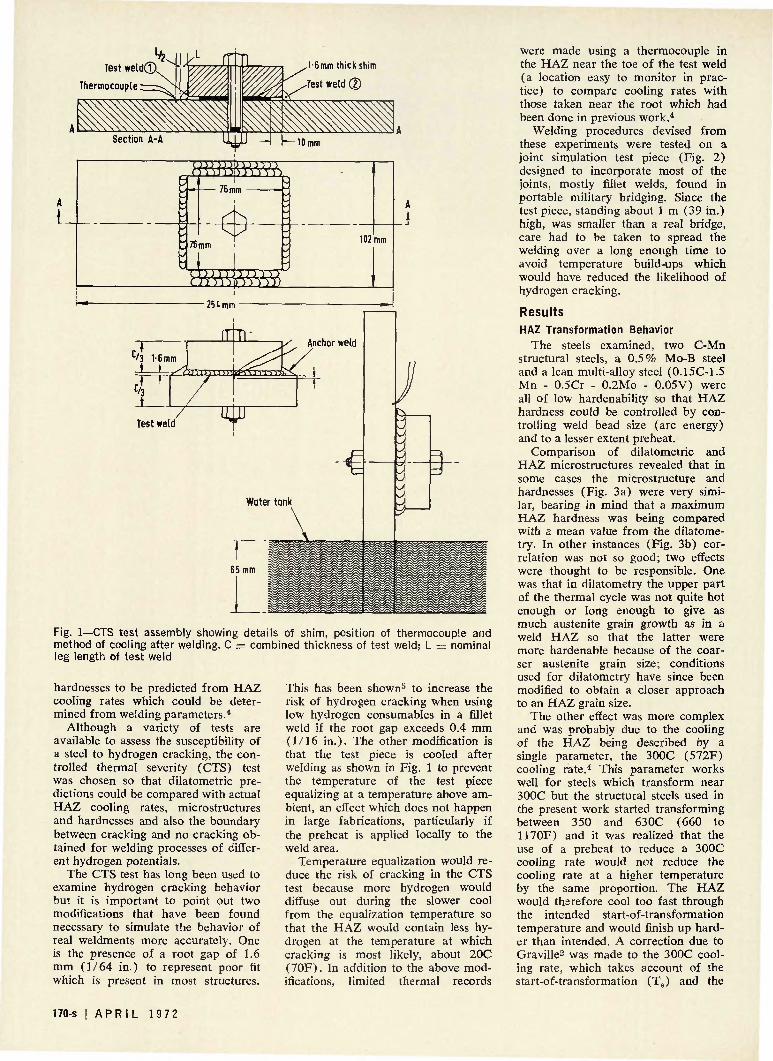
Welding procedures devised from these experiments were tested on a joint simulation test piece (Fig. 2) designed to incorporate most of the joints, mostly fillet welds, found in portable military bridging. Since the test piece, standing about 1 m (39 in.) high, was smaller than a real bridge, care had to be taken to spread the welding over a long enough time to avoid temperature build-ups which would have reduced the likelihood of hydrogen cracking.
Results HAZ Transformation Behavior
The steels examined, two C-Mn structural steels, a 0.5% Mo-B steel and a lean multi-alloy steel (0.15C-1.5 Mn - 0.5Cr - 0.2Mo - 0.05V) were all of low hardenability so that HAZ hardness could be controlled by controlling weld bead size (arc energy) and to a lesser extent preheat.
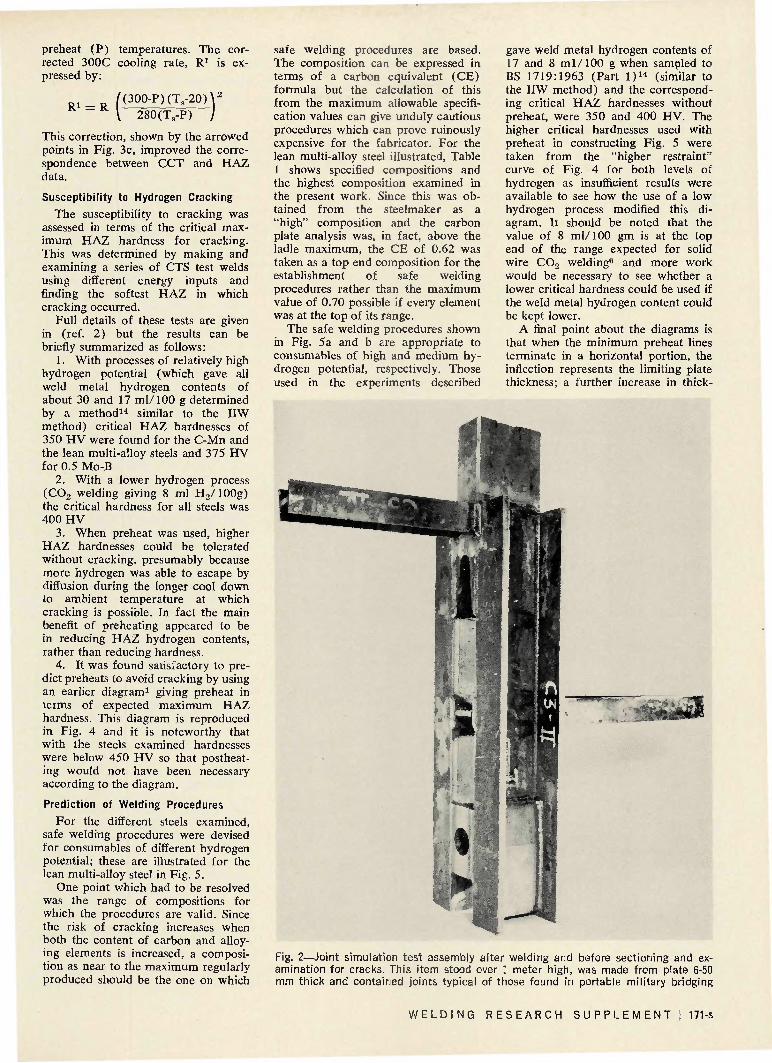
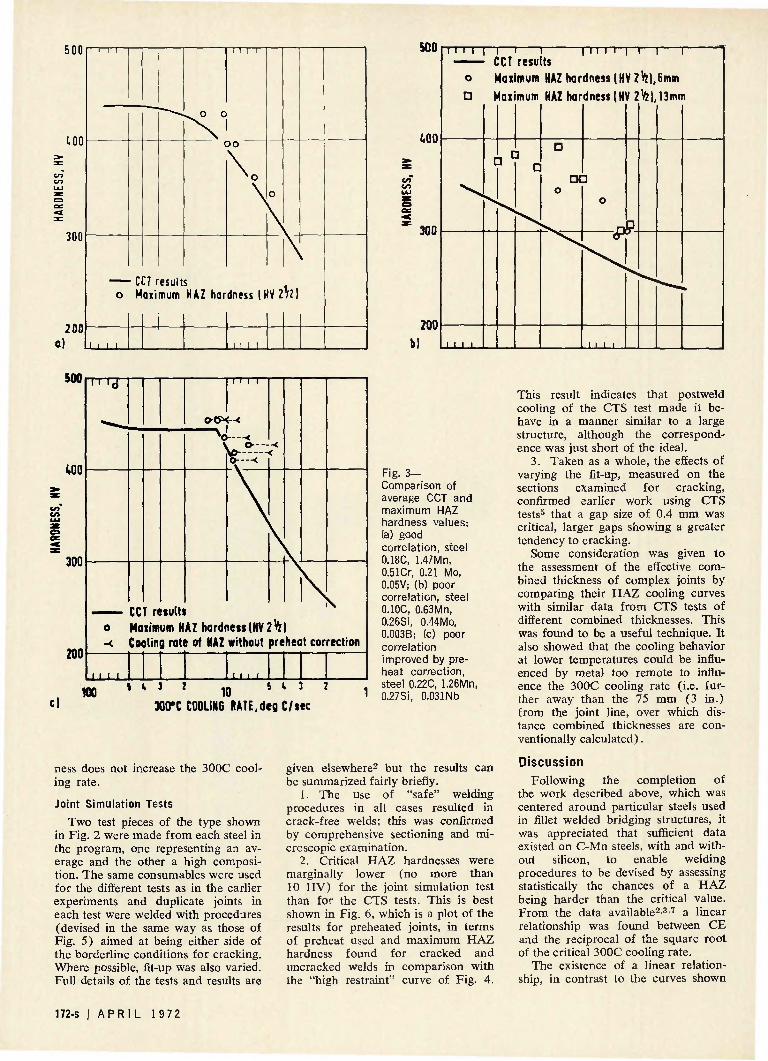
Comparison of dilatometric and HAZ microstructures revealed that in some cases the microstructure and hardnesses (Fig. 3a) were very similar, bearing in mind that a maximum HAZ hardness was being compared with a mean value from the dilatometry. In other instances (Fig. 3b) correlation was not so good; two effects were thought to be responsible. One was that in dilatometry the upper part of the thermal cycle was not quite hot enough or long enough to give as much austenite grain growth as in a weld HAZ so that the latter were more hardenable because of the coarser austenite grain size; conditions used for dilatometry have since been modified to obtain a closer approach to an HAZ grain size.
The other effect was more complex and was probably due to the cooling of the HAZ being described by a single parameter, the 300C (572F) cooling rate.4 This parameter works well for steels which transform near 300C but the structural steels used in the present work started transforming between 350 and 630C (660 to 1170F) and it was realized that the use of a preheat to reduce a 300C cooling rate would not reduce the cooling rate at a higher temperature by the same proportion. The HAZ would therefore cool too fast through the intended start-of-transformation temperature and would finish up harder than intended. A correction due to Graville2 was made to the 300C cooling rate, which takes account of the start-of-transformation (T s) and the
170-s | A P R I L 197 2
preheat (P) temperatures. The corrected 300C cooling rate, R1 is expressed by:
R1 / ( 300 -P ) (T s -20 ) \ 2
\ 280(TS-P) )
This correction, shown by the arrowed points in Fig. 3c, improved the correspondence between CCT and HAZ data.
Susceptibility to Hydrogen Cracking
The susceptibility to cracking was assessed in terms of the critical maximum HAZ hardness for cracking. This was determined by making and examining a series of CTS test welds using different energy inputs and finding the softest HAZ in which cracking occurred.
Full details of these tests are given in (ref. 2) but the results can be briefly summarized as follows:
1. With processes of relatively high hydrogen potential (which gave all weld metal hydrogen contents of about 30 and 17 ml/100 g determined by a method14 similar to the IIW method) critical HAZ hardnesses of 350 HV were found for the C-Mn and the lean multi-alloy steels and 375 HV for 0.5 Mo-B
2. With a lower hydrogen process ( C 0 2 welding giving 8 ml H2 /100g) the critical hardness for all steels was 400 HV
3. When preheat was used, higher HAZ hardnesses could be tolerated without cracking, presumably because more hydrogen was able to escape by diffusion during the longer cool down to ambient temperature at which cracking is possible. In fact the main benefit of preheating appeared to be in reducing HAZ hydrogen contents, rather than reducing hardness.
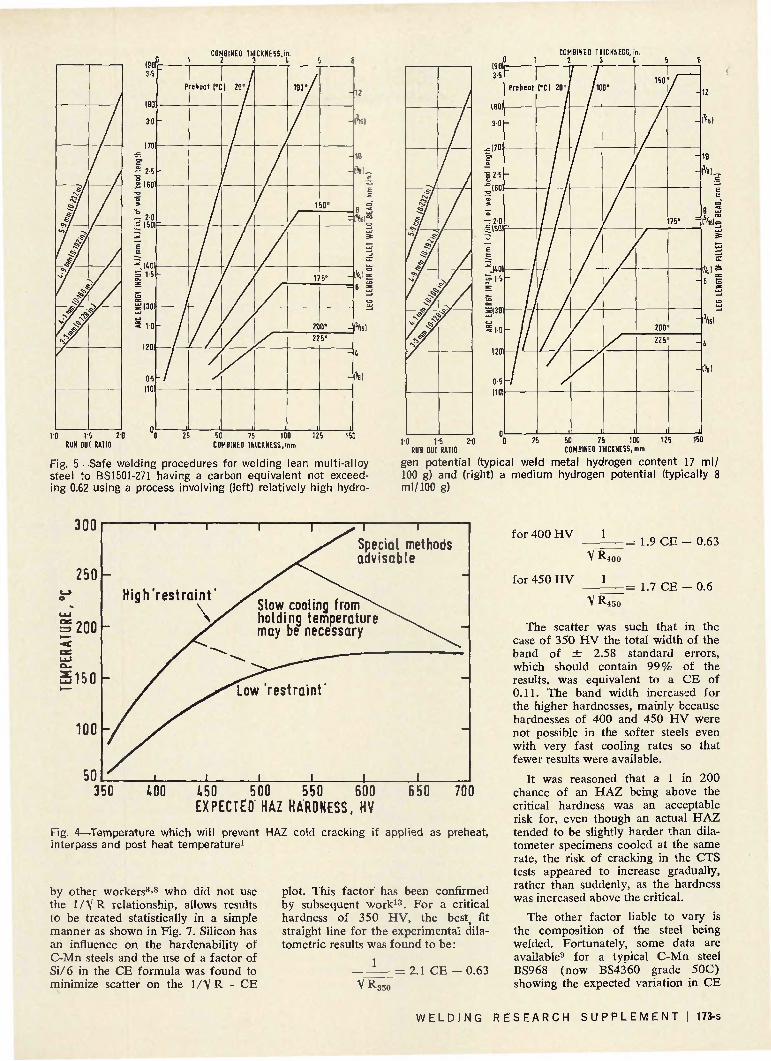
4. It was found satisfactory to predict preheats to avoid cracking by using an earlier diagram1 giving preheat in terms of expected maximum HAZ hardness. This diagram is reproduced in Fig. 4 and it is noteworthy that with the steels examined hardnesses were below 450 HV so that postheating would not have been necessary according to the diagram.
Prediction of Welding Procedures
For the different steels examined, safe welding procedures were devised for consumables of different hydrogen potential; these are illustrated for the lean multi-alloy steel in Fig. 5.
One point which had to be resolved was the range of compositions for which the procedures are valid. Since the risk of cracking increases when both the content of carbon and alloying elements is increased, a composition as near to the maximum regularly produced should be the one on which
safe welding procedures are based. The composition can be expressed in terms of a carbon equivalent (CE) formula but the calculation of this from the maximum allowable specification values can give unduly cautious procedures which can prove ruinously expensive for the fabricator. For the lean multi-alloy steel illustrated, Table 1 shows specified compositions and the highest composition examined in the present work. Since this was obtained from the steelmaker as a "high" composition and the carbon plate analysis was, in fact, above the ladle maximum, the CE of 0.62 was taken as a top end composition for the establishment of safe welding procedures rather than the maximum value of 0.70 possible if every element was at the top of its range.
The safe welding procedures shown in Fig. 5a and b are appropriate to consumables of high and medium hydrogen potential, respectively. Those used in the experiments described
gave weld metal hydrogen contents of 17 and 8 m l / 1 0 0 g when sampled to BS 1719:1963 (Part l ) 1 4 (similar to the IIW method) and the corresponding critical HAZ hardnesses without preheat, were 350 and 400 HV. The higher critical hardnesses used with preheat in constructing Fig. 5 were taken from the "higher restraint" curve of Fig. 4 for both levels of hydrogen as insufficient results were available to see how the use of a low hydrogen process modified this diagram. It should be noted that the value of 8 ml/100 gm is at the top end of the range expected for solid wire C 0 2 welding6 and more work would be necessary to see whether a lower critical hardness could be used if the weld metal hydrogen content could be kept lower.
A final point about the diagrams is that when the minimum preheat lines terminate in a horizontal portion, the inflection represents the limiting plate thickness; a further increase in thick-
Fig. 2—Joint simulation test assembly after welding and before sectioning and examination for cracks. This item stood over 1 meter high, was made from plate 6-50 mm thick and contained joints typical of those found in portable military bridging
W E L D I N G R E S E A R C H S U P P L E M E N T ! 171-s
bUU
100
300
200
i i i i
o
n i l
• C M
C T i Q X i
esult mum
i i i i
- 0 0
>L i <
s HAZ nor
DO
dness It
i i i i
o
V2 \l)
500
400
300
200 b)
i i i i I i—i 1— — — CCT results
I I I i i | i
o Maximum HAZ hardness ( H V 2 H 6 m m D Maximum HAZ hardness (HV Z H 13mm
500
400
300
ZOO
I I l<J
- —
CC T ri suit)
o-e*
' V \
M i l
——*
*"7--< <
\
o Maximum HAZ hardness (HV 2^1 -c Cooling rate of HAZ without preheat correction
. i , u - i . 11 i i 1 100 4 «. 3 2 10 i k 3 2
3Q0*C COOLING RATE,deg C/sec
Fig. 3 -Comparison of average CCT and maximum HAZ hardness values: (a) good correlation, steel 0.18C, 1.47Mn, 0.51Cr, 0.21 Mo, 0.05V; (b) poor correlation, steel 0.10C, 0.63Mn, 0.26Si, 0.44Mo, 0.003B; (c) poor correlation improved by preheat correction, steel 0.22C, 1.26Mn, 0.27Si, 0.031Nb
ness does not increase the 300C cooling rate.
Joint Simulation Tests
Two test pieces of the type shown in Fig. 2 were made from each steel in the program, one representing an average and the other a high composition. The same consumables were used for the different tests as in the earlier experiments and duplicate joints in each test were welded with procedures (devised in the same way as those of Fig. 5) aimed at being either side of the borderline conditions for cracking. Where possible, fit-up was also varied. Full details of the tests and results are
given elsewhere2 but the results can be summarized fairly briefly.
1. The use of "safe" welding procedures in all cases resulted in crack-free welds; this was confirmed by comprehensive sectioning and microscopic examination.
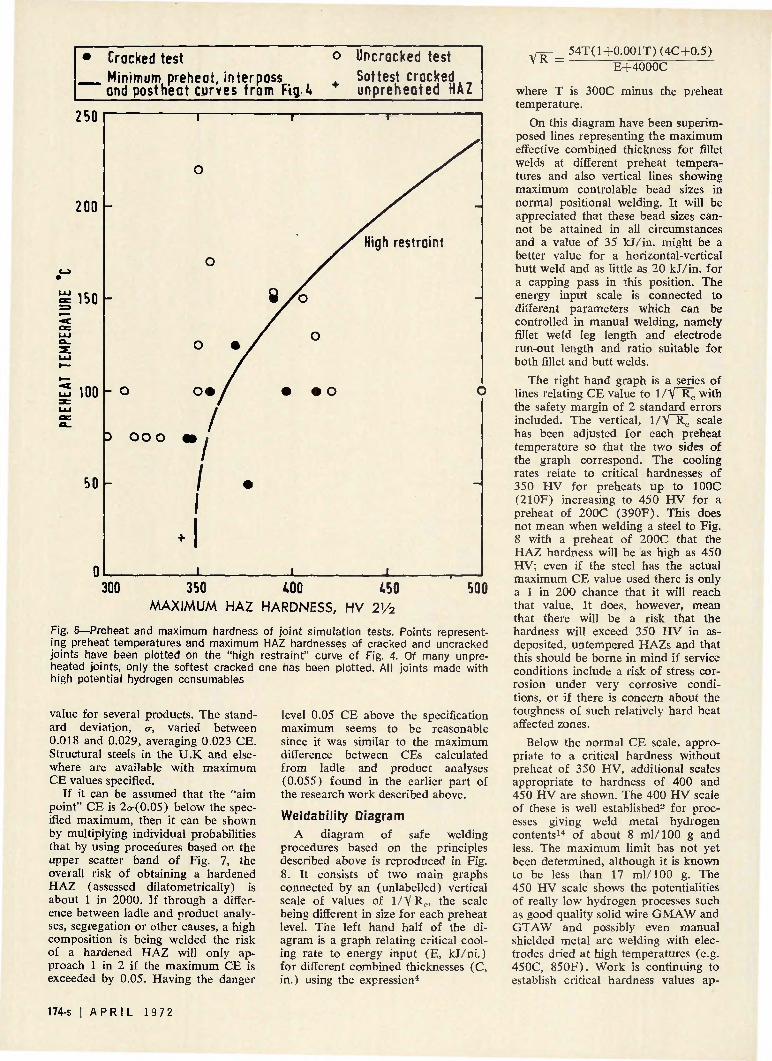
2. Critical HAZ hardnesses were marginally lower (no more than 10 HV) for the joint simulation test than for the CTS tests. This is best shown in Fig. 6, which is a plot of the results for preheated joints, in terms of preheat used and maximum HAZ hardness found for cracked and uncracked welds in comparison with the "high restraint" curve of Fig. 4.
This result indicates that postweld cooling of the CTS test made it behave in a manner similar to a large structure, although the correspondence was just short of the ideal.
3. Taken as a whole, the effects of varying the fit-up, measured on the sections examined for cracking, confirmed earlier work using CTS tests5 that a gap size of 0.4 mm was critical, larger gaps showing a greater tendency to cracking.
Some consideration was given to the assessment of the effective combined thickness of complex joints by comparing their HAZ cooling curves with similar data from CTS tests of different combined thicknesses. This was found to be a useful technique. It also showed that the cooling behavior at lower temperatures could be influenced by metal too remote to influence the 300C cooling rate (i.e. further away than the 75 mm (3 in.) from the joint line, over which distance combined thicknesses are conventionally calculated).
Discussion Following the completion of
the work described above, which was centered around particular steels used in fillet welded bridging structures, it was appreciated that sufficient data existed on C-Mn steels, with and without silicon, to enable welding procedures to be devised by assessing statistically the chances of a HAZ being harder than the critical value. From the data available2*3*7 a linear relationship was found between CE and the reciprocal of the square root of the critical 300C cooling rate.
The existence of a linear relationship, in contrast to the curves shown
172-s I A P R I L 1972
COMBINED THICKNESS.in. 1 2 3 4 5
-7
/ w w
—/
r /
10 IS 20 RUN OUT RATIO
50 75 100 COMBINED THICKNESS,mm
0 -7 / «y
-7 7 *./ / f w /
y - y
3-5
3-0
1 Z 5
^ (60
!
j i COMBINED THICKNESS,!
2 3 4
Preheot |°CI 20°i
-
-20 J50l=
'.n
= 15
| [ 3 0
h-o
/
- / /
0-5
no
n
-/
/too*
n. 6
_ 150* /
.
200
75*
6
-
-
--
225°
'
12
fol
io P'H.
K\
6
" I 3 «
i
4
(Ve 1
1-0 1*6 RUN OUT RATIO
20 50 75 100 COMBINED THICKNESS, mm
150
Fig. 5—Safe welding procedures for welding lean multi-alloy steel to BS1501-271 having a carbon equivalent not exceeding 0.62 using a process involving (left) relatively high hydro
gen potential (typical weld metal hydrogen content 17 ml/ 100 g) and (right) a medium hydrogen potential (typically 8 ml/IOO g)
Special methods advisable
for 400 HV 1
150 500 550 600 EXPECTED HAZ HARDNESS. HV
Fig. 4—Temperature which will prevent HAZ cold cracking if applied as preheat, interpass and post heat temperature1
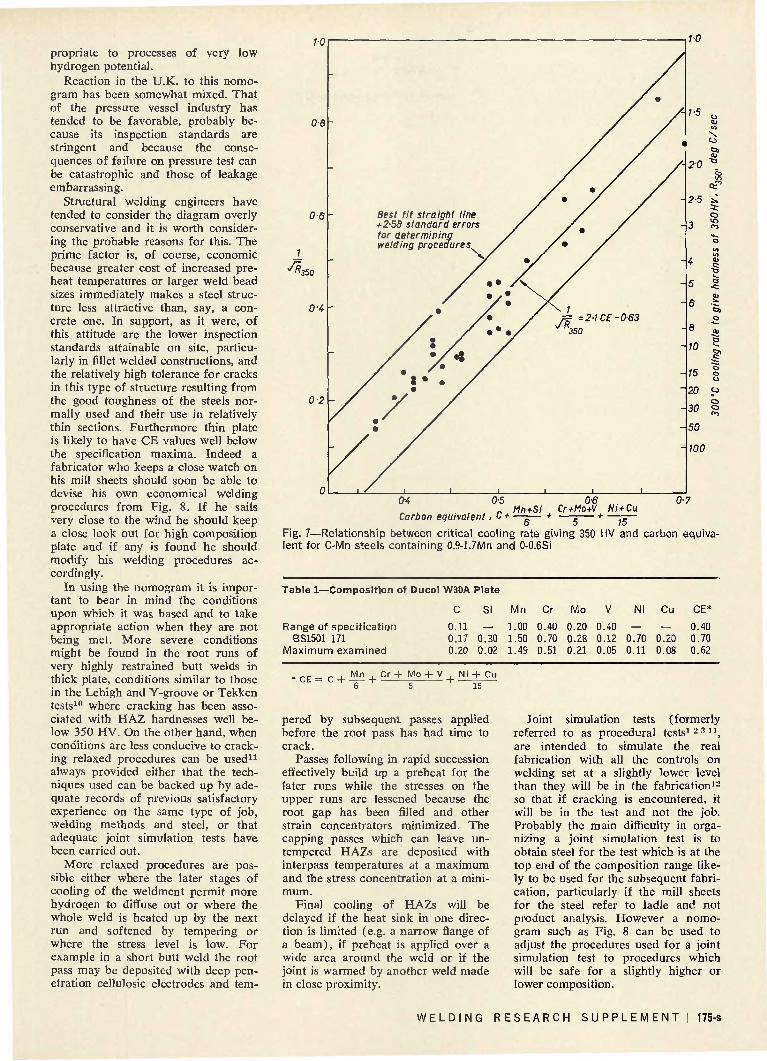
by other workers3*8 who did not use the 1/VR relationship, allows results to be treated statistically in a simple manner as shown in Fig. 7. Silicon has an influence on the hardenability of C-Mn steels and the use of a factor of Si/6 in the CE formula was found to minimize scatter on the 1/VR - CE
plot. This factor' has been confirmed by subsequent work13. For a critical hardness of 350 HV, the best, fit straight line for the experimental dilatometric results was found to be:
1
V RS50
2.1 CE - 0.63
-= 1.9 CE - 0.63 "V R400
for 450 HV 1
VR450
1.7 CE - O.t
The scatter was such that in the case of 350 HV the total width of the band of ± 2.58 standard errors, which should contain 99% of the results, was equivalent to a CE of 0.11. The band width increased for the higher hardnesses, mainly because hardnesses of 400 and 450 HV were not possible in the softer steels even with very fast cooling rates so that fewer results were available.
It was reasoned that a 1 in 200 chance of an HAZ being above the critical hardness was an acceptable risk for, even though an actual HAZ tended to be slightly harder than dilatometer specimens cooled at the same rate, the risk of cracking in the CTS tests appeared to increase gradually, rather than suddenly, as the hardness was increased above the critical.
The other factor liable to vary is the composition of the steel being welded. Fortunately, some data are available9 for a typical C-Mn steel BS968 (now BS4360 grade SOC) showing the expected variation in CE
W E L D I N G R E S E A R C H S U P P L E M E N T ! 173-s
• Cracked test Minimum preheat, interpass and postheat curves from Fig. 4
o Uncracked test
Softest cracked unpreheated HAZ
VR 54T(1+0.001T) (4C+0.5)
E+4000C
ZbU
ZOO
150
100
50
n
- o
3 o o o
1
o
o
o
091
1 • /
/
1 • 1
1
• /
•
T" • " " "
•
%/o
' o
• • o
1
T
High restraint
-
o
~ •
1 300 350 400 450
MAXIMUM HAZ HARDNESS, HV 2V2
500
Fig. 6—Preheat and maximum hardness of joint simulation tests. Points representing preheat temperatures and maximum HAZ hardnesses of cracked and uncracked joints have been plotted on the "high restraint" curve of Fig. 4. Of many unpreheated joints, only the softest cracked one has been plotted. All joints made with high potential hydrogen consumables
value for several products. The standard deviation, o-, varied between 0.018 and 0.029, averaging 0.023 CE. Structural steels in the U.K and elsewhere are available with maximum CE values specified.
If it can be assumed that the "aim point" CE is 2o-(0.05) below the specified maximum, then it can be shown by multiplying individual probabilities that by using procedures based on the upper scatter band of Fig. 7, the overall risk of obtaining a hardened HAZ (assessed dilatometrically) is about 1 in 2000. If through a difference between ladle and product analyses, segregation or other causes, a high composition is being welded the risk of a hardened HAZ will only approach 1 in 2 if the maximum CE is exceeded by 0.05. Having the danger
level 0.05 CE above the specification maximum seems to be reasonable since it was similar to the maximum difference between CEs calculated from ladle and product analyses (0.055) found in the earlier part of the research work described above.
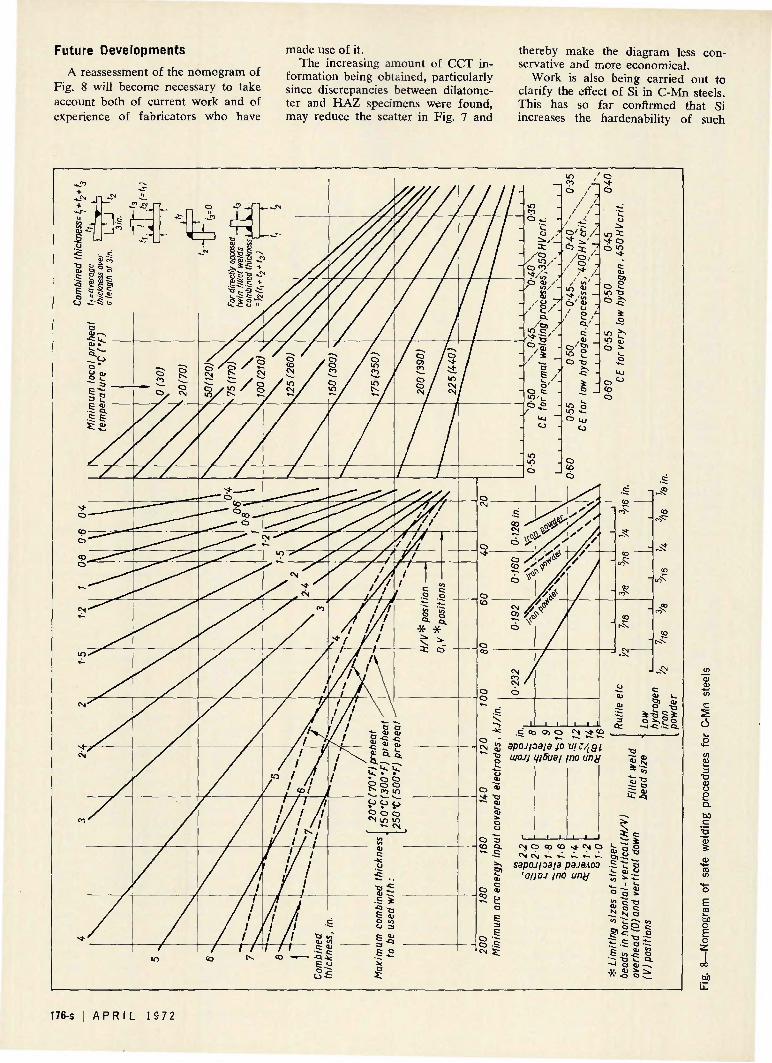
Weldability Diagram A diagram of safe welding
procedures based on the principles described above is reproduced in Fig. 8. It consists of two main graphs connected by an (unlabelled) vertical scale of values of 1/1/R,, the scale being different in size for each preheat level. The left hand half of the diagram is a graph relating critical cooling rate to energy input (E, kl /ni . ) for different combined thicknesses (C, in.) using the expression4
where T is 300C minus the preheat temperature.
On this diagram have been superimposed lines representing the maximum effective combined thickness for fillet welds at different preheat temperatures and also vertical lines showing maximum controlable bead sizes in normal positional welding. It will be appreciated that these bead sizes cannot be attained in all circumstances and a value of 35 kJ/in. might be a better value for a horizontal-vertical butt weld and as little as 20 kl / in. for a capping pass in this position. The energy input scale is connected to different parameters which can be controlled in manual welding, namely fillet weld leg length and electrode run-out length and ratio suitable for both fillet and butt welds.
The right hand graph is a series of lines relating CE value to l / \ Rc with the safety margin of 2 standard errors included. The vertical, l / \ Rc scale has been adjusted for each preheat temperature so that the two sides of the graph correspond. The cooling rates relate to critical hardnesses of 350 HV for preheats up to 100C (210F) increasing to 450 HV for a preheat of 200C (390F). This does not mean when welding a steel to Fig. 8 with a preheat of 200C that the HAZ hardness will be as high as 450 HV; even if the steel has the actual maximum CE value used there is only a 1 in 200 chance that it will reach that value. It does, however, mean that there will be a risk that the hardness will exceed 350 HV in as-deposited, untempered HAZs and that this should be borne in mind if service conditions include a risk of stress corrosion under very corrosive conditions, or if there is concern about the toughness of such relatively hard heat affected zones.
Below the normal CE scale, appropriate to a critical hardness without preheat of 350 HV, additional scales appropriate to hardness of 400 and 450 HV are shown. The 400 HV scale of these is well established2 for processes giving weld metal hydrogen contents14 of about 8 ml/100 g and less. The maximum limit has not yet been determined, although it is known to be less than 17 ml/100 g. The 450 HV scale shows the potentialities of really low hydrogen processes such as good quality solid wire GMAW and GTAW and possibly even manual shielded metal arc welding with electrodes dried at high temperatures (e.g. 450C, 850F). Work is continuing to establish critical hardness values ap-
174-s I A P R I L 1 9 7 2
propriate to processes of very low hydrogen potential.
Reaction in the U.K. to this nomo-gram has been somewhat mixed. That of the pressure vessel industry has tended to be favorable, probably because its inspection standards are stringent and because the consequences of failure on pressure test can be catastrophic and those of leakage embarrassing.
Structural welding engineers have tended to consider the diagram overly conservative and it is worth considering the probable reasons for this. The prime factor is, of course, economic because greater cost of increased preheat temperatures or larger weld bead sizes immediately makes a steel structure less attractive than, say, a concrete one. In support, as it were, of this attitude are the lower inspection standards attainable on site, particularly in fillet welded constructions, and the relatively high tolerance for cracks in this type of structure resulting from the good toughness of the steels normally used and their use in relatively thin sections. Furthermore thin plate is likely to have CE values well below the specification maxima. Indeed a fabricator who keeps a close watch on his mill sheets should soon be able to devise his own economical welding procedures from Fig. 8. If he sails very close to the wind he should keep a close look out for high composition plate and if any is found he should modify his welding procedures accordingly.
In using the nomogram it is important to bear in mind the conditions upon which it was based and to take appropriate action when they are not being met. More severe conditions might be found in the root runs of very highly restrained butt welds in thick plate, conditions similar to those in the Lehigh and Y-groove or Tekken tests10 where cracking has been associated with HAZ hardnesses well below 350 HV. On the other hand, when conditions are less conducive to cracking relaxed procedures can be used11
always provided either that the techniques used can be backed up by adequate records of previous satisfactory experience on the same type of job, welding methods and steel, or that adequate joint simulation tests have been carried out.
More relaxed procedures are possible either where the later stages of cooling of the weldment permit more hydrogen to diffuse out or where the whole weld is heated up by the next run and softened by tempering or where the stress level is low. For example in a short butt weld the root pass may be deposited with deep penetration cellulosic electrodes and tem-
Carbon equivalent, - - „ ,
Fig. 7—Relationship between critical cooling rate giving 350 HV and carbon equivalent for C-Mn steels containing 0.9-1.7Mn and 0-0.6Si
Table 1—Composition of Ducol W30A Plate
C Si Mn Cr Mo Ni Cu CE*
Range of specification BS1501-171
Maximum examined
0.11 — 1.00 0.17 0.30 1.50 0.20 0.02 1.49
0.40 0.70 0.51
0.20 0.28 0.21
0.40 0.12 0.05
0.70 0.11
0.20 0.08
0.40 0.70 0.62
CE • Mn Cr + Mo + V Ni + Cu
pered by subsequent passes applied before the root pass has had time to crack.
Passes following in rapid succession effectively build up a preheat for the later runs while the stresses on the upper runs are lessened because the root gap has been filled and other strain concentrators minimized. The capping passes which can leave un-tempered HAZs are deposited with interpass temperatures at a maximum and the stress concentration at a minimum.
Final cooling of HAZs will be delayed if the heat sink in one direction is limited (e.g. a narrow flange of a beam), if preheat is applied over a wide area around the weld or if the joint is warmed by another weld made in close proximity.
Joint simulation tests (formerly referred to as procedural t e s t s 1 2 3 u , are intended to simulate the real fabrication with all the controls on welding set at a slightly lower level than they will be in the fabrication12
so that if cracking is encountered, it will be in the test and not the job. Probably the main difficulty in organizing a joint simulation test is to obtain steel for the test which is at the top end of the composition range likely to be used for the subsequent fabrication, particularly if the mill sheets for the steel refer to ladle and not product analysis. However a nomogram such as Fig. 8 can be used to adjust the procedures used for a joint simulation test to procedures which will be safe for a slightly higher or lower composition.
W E L D I N G R E S E A R C H S U P P L E M E N T ' 175-s
Future Developments
A reassessment of the nomogram of Fig. 8 will become necessary to take account both of current work and of experience of fabricators who have
made use of it. The increasing amount of CCT in
formation being obtained, particularly since discrepancies between dilatometer and HAZ specimens were found, may reduce the scatter in Fig. 7 and
thereby make the diagram less conservative and more economical.
Work is also being carried out to clarify the effect of Si in C-Mn steels. This has so far confirmed that Si increases the hardenability of such
+
it \ *—*
6 D J< C n Cj <U
cj , r £ D
I" <3s
6 £ * £
«->
^ a: ' 'S
o a j ' t o /
JV O I
/ P / t~ '
' ' O l CO c
"5 6 c .
o c V'>~ ps.
Cu o
t o ID o
-
__ 7
*
~
IO o i
6 / /
/ / /
'o'fa 2: ' 6 a; / o . / o
•' 7*. / <o'
"> Si
/ o / k ~ •
~ 7
_ -
—
" . _
O 13
£ i o
w fe IO **-o c
O
O co o
/ -> -}
—f 1 -
^
', ' -
_
-_
o V ) .
cb
o
-* © O IO
s f
c
^ P CD c. JO "O
6 £ i .o
io f
o Uj
o " <P o
.c
. c oo Ci> O <N "4- g
a i c O) OJ
£ "° i-sga. -i-c t o . Si 2 apojjoaiajo wat
*" "g WOJI Q)Buai wo liny -g »> c, o 3>
O " -+ -o «- Q,
fc ^ o CJ
~ t : i J • • • •
*$ *"H U - < J
1 ^ N ? <?
o CO Q. *~ .P
6
csj O <*> to ^ - <N O j j C\| <\^ « - ^- «^ *-- * - O)
sapojjoa/a pajaAoo S •OIIDJ )no uny •j;
,6 .
* .
i : =t
: "o > c i c
la s - o . "O C : a •-
<u io >*c 2 i c: P .
a> o o
OJO
c
cu
176-s | APR I L 1972
steels13 but suggests that it may also decrease the susceptibility to cracking. If this is the case, and tests are being made to check the point, then the easiest solution might be to exclude Si from the CE formula on the grounds that the increased hardenability balances the decreased susceptibility to a sufficient degree for practical purposes.
Further work is aimed at establishing or confirming the critical hardness values, not only for different welding processes and hydrogen levels, but also for different joint configurations and strength levels.
However, the greatest debate will result from the statistical treatment of cracking. Are customers prepared to accept that different joints will be welded with procedures in which there is a risk of cracking, however small? It may seem a strange philosophy to be propounding but, in essence, it is not very different from the results of researches into fracture mechanics which can give the purchaser estimates of the size of crack which can be tolerated with safety in a structure. Nor is it very different from the long established custom that structures upon which life and limb depend should be the ones most thoroughly inspected and tested.
Summary A study of the hydrogen cracking
behavior of C-Mn and low alloy steels has led to the development of statistically based welding procedures for a range of C-Mn steel compositions. The nomogram should not be regarded as a rigid set of instructions on how to weld any C-Mn steel but as a set of guidelines against which to compare current welding procedures so that new ones can be devised for new steels, processes and products with the minimum of risk and the maximum speed and economy.
Acknowledgements This paper was based largely on
work made possible through the support of the Military Vehicles and Engineering Establishment, Christchurch, England. The author is also grateful to colleagues at The Welding Institute for help and advice.
References 1. Baker, R. G., Watkinson, F., and
Newman, R. P., "The Metallurgical Implications of Welding Practice as Related to Low Alloy Steels," Proceedings 2nd Commonwealth, Welding Conference 1966, 125-131, Institute of Welding, London.
2. Bailey, N., "Welding Procedures for Low Alloy Steels," The Welding Institute Report Series, July 1970.
3. Watkinson, F., and Baker, R. G., "Welding of Steel to BS 968: 1962, a Dilatometric Investigation," British Welding Journal 1967, Vol. 14, No. 11, pp. 603-613.
4. Cottrell, C. L. M., and Bradstreet, B. J., "A Method for Calculating the Effect of Preheat on Weldability," British Welding Journal 1955, Vol. 2. No. 7, pp. 305-309.
5. Graville, B. A., "Effect of Fit-up on Heat Affected Zone Cold Cracking," British Welding Journal 1968, Vol. 15, No. 4, pp. 183-190.
6. Coe, F. R.. and Watkinson, F., "Weld Metal Hydrogen Levels." The Welding Institute Res. Bulletin 1969, Vol. 10, No. 2, pp. 43-45.
7. Watkinson, F., "Atlas of High Speed CCT Data," The Welding Institute internal document, 1971.
8. Blodgett. O. W., "Design of Welded Structures," "Weldability and Welding Procedures," section 7.2, 1966. Cleveland, Ohio.
9. Gledhill. P. K. and Goult. E. L., "Production of Universal Beams and Columns in High Yield Stress Steel." "Strong Tough Structural Steels" ISI publication 104, 1967. pp. 182-187 and discussion p. 243.
10. Kihara. H . Suzuki. H. and Nakamura. H.. "Weld Cracking Tests of High Strength Steels," Welding Research 1962, Vol. 27, No. 1, pp. 36s-48s.
11. Bailey. N.. "Welding Carbon Manganese Steels." Metal Construction 1970, Vol. 2, No. 10, pp. 442-446.
12. Bailey, N., "Joint Simulation Testing against Hydrogen Cracking" The Welding Institute Research Bulletin 1971, Vol. 12. No. 10, pp. 278-283.
13. Watkinson, F., et al., to be published.
14. British Standard BS 1719 -Part 1: "Classification, Coding and Marking of Covered Electrodes for Metal Arc Welding," 1963, Appendix B.
WRC Bulletin
No. 170 February 1972
"Mig Welding with Pulsed Power"
By A. Lesnewich
This report, prepared for the Interpretive Reports Committee of the Welding Research Council, presents a concise summary of the present state-of-the-art of pulsed-arc MIG welding. The effect of pulsed current on MIG welding is so significant that some authorities accord the technique the status of a new welding process, calling it pulsed spray to differentiate it from other forms of pulsed power. Actual changes associated with this method involve a new concept in power supply design and, to a minor degree, some adaptations in the way the welding equipment is used.
Included in the report is an explanation of why pulsed power was developed for welding and how the pulsed spray technique works. The effect of variables such as pulse frequency, pulse amplitude and pulse width are described in detail. Also covered are the fundamentals of the power supply and the adaptability of the process for welding steel, aluminum, magnesium and copper.
The price of Bulletin 170 is $2.00 per copy. Orders for single copies should be sent to the American Welding Society, 2501 N.W. 7th St., Miami, Fla. 33125. Orders for bulk lots, 10 or more copies, should be sent to the Welding Research Council, 345 East 47th Street, New York, N. Y. 10017.
W E L D I N G R E S E A R C H S U P P L E M E N T ! 177-s