Embed Size (px)
Citation preview
11
Welcome to the
2017

2
Platinum Sponsors
2
3
Gold Sponsors
3

4
Silver – Executive Focus Group Sponsors
4
• 360• Agricultural Utilization Research
Institute (AURI)• Alexandria Area Economic Development
Commission• Alexandria Lakes Area Chamber of
Commerce• Alexandria Technical & Community College• Center for Rural Policy and Development• G&A Partners• Gray Plant Mooty
• Iron Range Resources & Rehabilitation Board (IRRRB)
• Marvin Windows and Doors• Minnesota AgriGrowth Council• Minnesota Precision Manufacturing
Association (MPMA)• Northwest Minnesota Foundation (NWMF)• Pine Technical & Community College• Saint Paul Port Authority (SPPA)• Southwest Initiative Foundation (SWIF)• TEAM Industries• West Central Initiative (WCI)
5
Silver – Student Focus Group Sponsors
5
• Alexandria Area Economic Development Commission• Alexandria Lakes Area Chamber of Commerce• Alexandria Technical & Community College• Clow Stamping Company• Dunwoody College of Technology• Pequot Tool & Manufacturing• Productivity Inc.• Wilson Tool

6
Bronze – Manufacturing Sponsors
6
• Absolute Quality Manufacturing, Inc.• Delmar Company• Hed Cycling Products• Mactech, Inc.• Mars Supply• Tolerance Masters• Tri-State Manufacturers’ Association (TSMA)• Ultra Machining Company, Inc. (UMC)• Von Ruden Manufacturing, Inc.

7
Reception Beer Sponsor
7

8
Enterprise Minnesota Board of Directors
8
CHAIR MEMBERSJoel Wittenbraker Greg Buck
President – Mactech Inc. President – Productivity Inc.Jeanne Crain
VICE-CHAIR President and CEO – Bremer BankTom Schabel Mike Jensen
President and CEO – President and CEO – Gauthier IndustriesAlexandria Industries Bob Kill
President and CEO – Enterprise MinnesotaKent Mogler
Manufacturing ConsultantJoe Mulford
President – Pine Technical & Community CollegeSteve Palmer
President – North Central Door

9
Northwest Minnesota Foundation
Northland Foundation
Initiative Foundation
West Central
Initiative
Southwest Initiative
Foundation
Southern Minnesota Initiative Foundation
9
Minnesota Initiative Foundations

1010
2017 Survey ofMinnesota Manufacturing Executives
11
On behalf of Enterprise Minnesota, Meeting Street Research is pleased to present the key findings from the ninth annual survey of manufacturing executives in Minnesota.
The survey was conducted March 1-21, 2017, among 400 manufacturing executives; it has a margin of error of +4.9%. Respondent titles included owners, CEOs, CFOs, COOs, presidents, vice presidents, and managing officers.
Rob Autry is the founder of Meeting Street Research, a public opinion research firm based in Charleston, SC.
12
State of the Economy

13
79% 78% 83% 82% 82% 84% 89% 90% 94%
21% 21% 16% 17% 17% 15% 11% 9% 6%
December2008
January2010
January2011
January2012
March2013
March2014
March2015
March2016
March2017
Confident Not Confident
“From a financial perspective, how do you feel right now about the future for your company?”
After rising for the fourth straight year, financial confidence is at an all-time high.
14
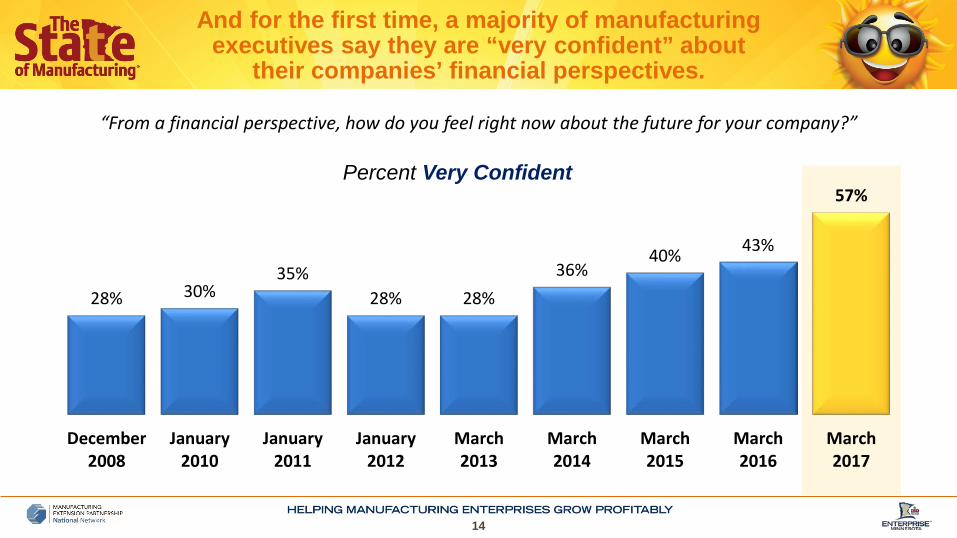
“From a financial perspective, how do you feel right now about the future for your company?”
And for the first time, a majority of manufacturing executives say they are “very confident” about
their companies’ financial perspectives.
28% 30%35%
28% 28%36%
40% 43%
57%
December2008
January2010
January2011
January2012
March2013
March2014
March2015
March2016
March2017
Percent Very Confident

15
8%
26%
40%32% 34% 37%
42%
32%
58%
34%
53%49%
55%
46%54%
42%
48%
32%
56%
19% 9% 10%15%
7%13% 15%
4%
December2008
January2010
January2011
January2012
March2013
March2014
March2015
March2016
March2017
Economic Expansion Flat Economy Recession“Thinking about the upcoming year, in 2017, do you anticipate economic expansion, a flat economy, or a recession?”
Also for the first time, a majority of manufacturing executives expect an economic expansion this year.
16
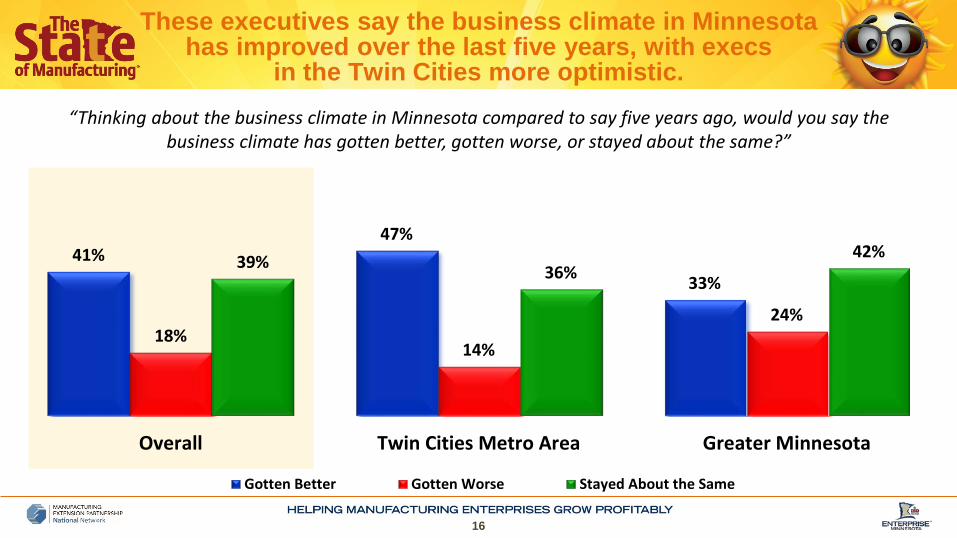
“Thinking about the business climate in Minnesota compared to say five years ago, would you say the business climate has gotten better, gotten worse, or stayed about the same?”
These executives say the business climate in Minnesota has improved over the last five years, with execs
in the Twin Cities more optimistic.
41%47%
33%
18%14%
24%
39% 36%42%
Overall Twin Cities Metro Area Greater Minnesota
Gotten Better Gotten Worse Stayed About the Same

17
23%
44%
51%47%
41%45% 45% 44%
55%
17%
36%39%
31% 32%35%
30%
37%
44%
19%24%
32%27% 28% 27% 27% 25% 23%
2008 2010 2011 2012 2013 2014 2015 2016 2017
Gross Revenue Profitability Capital Expenditures
Percent Expecting Increases That Year
More than ever, these executives expect increases in gross revenue and profitability this year, though
few expect increases in their capital expenditures.

18
11%
29% 30%
25% 25%23%
25% 25%
35%
9%
21% 21%
17% 16%18%
14%
20%
27%
9%
16%
20%
15%17% 17%
14%17%
15%
2008 2010 2011 2012 2013 2014 2015 2016 2017
Gross Revenue Profitability Capital Expenditures
Percent Expecting Increases More than 10% That Year
The number of executives expecting double-digit growth in revenue and profitability are at an all-time high.
19
Assessing Key Issue Areas
20
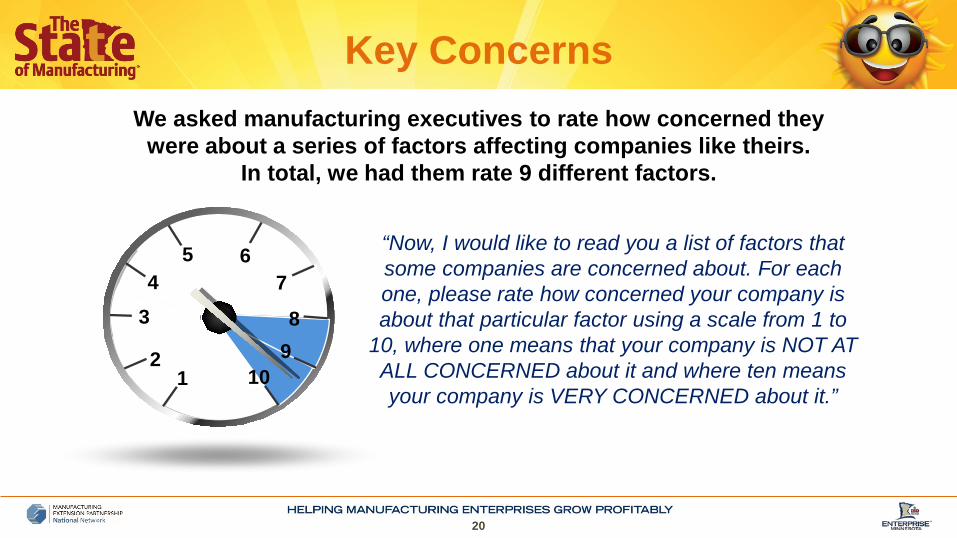
We asked manufacturing executives to rate how concerned they were about a series of factors affecting companies like theirs.
In total, we had them rate 9 different factors.
“Now, I would like to read you a list of factors that some companies are concerned about. For each one, please rate how concerned your company is about that particular factor using a scale from 1 to
10, where one means that your company is NOT AT ALL CONCERNED about it and where ten means your company is VERY CONCERNED about it.”
12
34
580
90
100
110
67
89
10
Key Concerns

21
59%
32%
31%
26%
20%
17%
12%
12%
11%
Concerns Ranked by % Concern (8-10)
The costs of health care coverage
Government policies and regulations
Attracting and retaining qualified workers
Current and future leaders
Costs of employee salaries and benefits, not including health insurance
Economic and global uncertainty
Competition from foreign sources
The shipping and logistics of getting your products to market
Managing supply chain relationships
The cost of health care coverage is the top factor thatexecutives say their companies are concerned about.

22
Concerns Among Manufacturing Executives (% Concern 8-10)
While concerns about health care are growing, concerns about government regulation are softening.
71% 68% 67%59% 56%
51%59%
61%56% 58% 55%
46%41%
32%
14%
31%
30%34% 33% 32% 31%20%
21%17% 16% 15% 17%
12%
2011 2012 2013 2014 2015 2016 2017
Health Care Costs Gov't Policies and Regulations Qualified Workers Foreign Competition

23
Finding qualified workers rises in importance among the higher revenue and larger size companies.
Top Concerns Among Manufacturing Executives (% Concern 8-10)
Revenue <$1m
Revenue $1–5m
Revenue $5m+
<50 Employees
51+ Employees
Health care costs(57%)
Health care costs(60%)
Health care costs(60%)
Health care costs(59%)
Health care costs(57%)
Gov’t policies and regulations
(30%)
Gov’t policies and regulations
(36%)
Qualified workers(42%)
Gov’t policies and regulations
(32%)
Qualified workers(41%)
Current & future leaders(26%)
Qualified workers(33%)
Gov’t policies and regulations
(27%)
Qualified workers(29%)
Gov’t policies and regulations
(36%)
Qualified workers(25%)
Current & future leaders(25%)
Current & future leaders(24%)
Current & future leaders(25%)
Current & future leaders(33%)
24
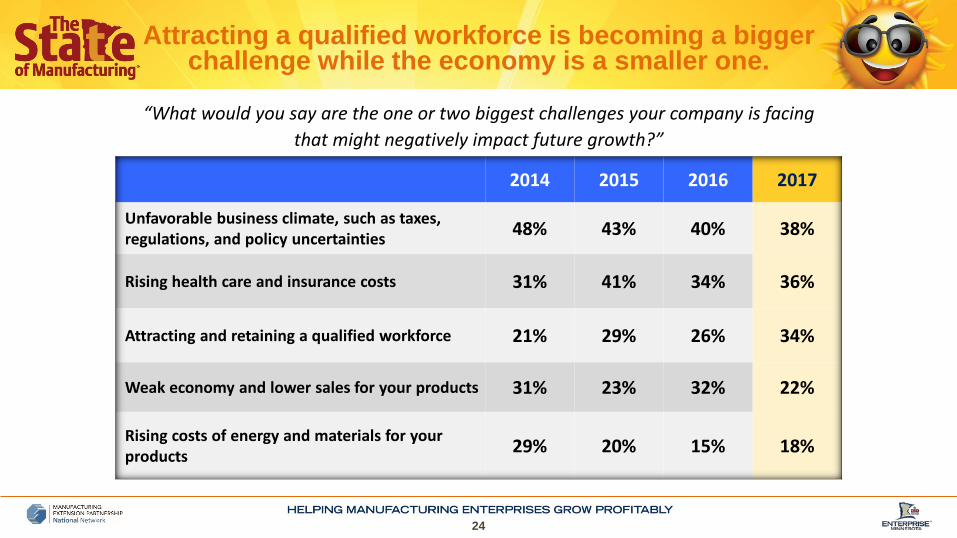
Attracting a qualified workforce is becoming a bigger challenge while the economy is a smaller one.
“What would you say are the one or two biggest challenges your company is facing that might negatively impact future growth?”
2014 2015 2016 2017
Unfavorable business climate, such as taxes, regulations, and policy uncertainties 48% 43% 40% 38%
Rising health care and insurance costs 31% 41% 34% 36%
Attracting and retaining a qualified workforce 21% 29% 26% 34%
Weak economy and lower sales for your products 31% 23% 32% 22%
Rising costs of energy and materials for your products 29% 20% 15% 18%

Biggest Challenges
Here again, the biggest challenge facing larger companies is attracting and retaining
a qualified workforce.
25
Unfav. Business Climate
Rising Health
Care Costs
Qualified Workforce
Weak Economy/
Sales
Costs of Energy and Materials
Less than $1 million in revenue 36% 34% 26% 22% 23%
$1-5 million in revenue 42% 38% 38% 23% 16%
Over $5 million in revenue 39% 36% 56% 10% 13%
50 or fewer employees 37% 36% 31% 21% 19%
Over 50 employees 44% 36% 46% 23% 16%

26
Challenges in the Southwest region are different from the rest of the state.
Biggest Challenges
IF Initiative Northland Northwest South Southwest West Central
Unfavorable business climate, such as taxes, regulations, and policy uncertainties 37% 41% 32% 43% 17% 31%
Rising health care and insurance costs 38% 29% 26% 47% 43% 32%
Attracting and retaining a qualified workforce 35% 20% 36% 37% 57% 36%
Weak economy and lower sales for your products 28% 24% 10% 14% 19% 19%
Rising costs of energy and materials for your products 18% 15% 22% 21% 15% 17%
27
The Workforce
28
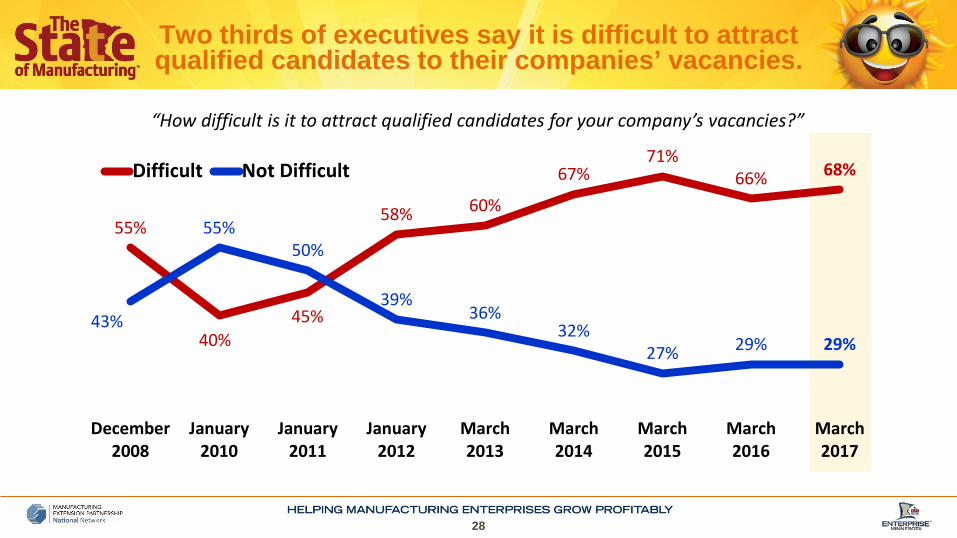
“How difficult is it to attract qualified candidates for your company’s vacancies?”
Two thirds of executives say it is difficult to attract qualified candidates to their companies’ vacancies.
55%
40%45%
58% 60%
67%71%
66% 68%
43%
55%50%
39%36%
32%27% 29% 29%
December2008
January2010
January2011
January2012
March2013
March2014
March2015
March2016
March2017
Difficult Not Difficult

29
54% 55%63%
71%62%
75%
43% 43%
30% 27%34%
22%
Metro Firms Greater MinnesotaFirms
Metro Firms Greater MinnesotaFirms
Metro Firms Greater MinnesotaFirms
Difficult Not Difficult
“How difficult is it to attract qualified candidates for your company’s vacancies?”
The difficulty remains greater outside the Twin Cities.
December 2008 March 2016 March 2017

30
Initiative Foundation (N=54)
Difficult to Attract 69%
Wages Have/Will Go Up This Year 56%
Northland (N=50)
Difficult to Attract 69%
Wages Have/Will Go Up This Year 33%
Northwest (N=50)
Difficult to Attract 78%
Wages Have/Will Go Up This Year 30%
South (N=51)
Difficult to Attract 80%
Wages Have/Will Go Up This Year 57%
Southwest (N=50)
Difficult to Attract 83%
Wages Have/Will Go Up This Year 45%
West Central (N=50)
Difficult to Attract 73%
Wages Have/Will Go Up This Year 52%
Minnesota Initiative Foundations

31
Concern Over the Ability to Attract and Retain Qualified Workers (% Concern 8-10)
The gap between the Twin Cities and Greater Minnesota in concern over attracting and
retaining qualified workers has grown.
21% 23%24%
40%
Metro Firms Greater Minnesota Firms2008 2017
32
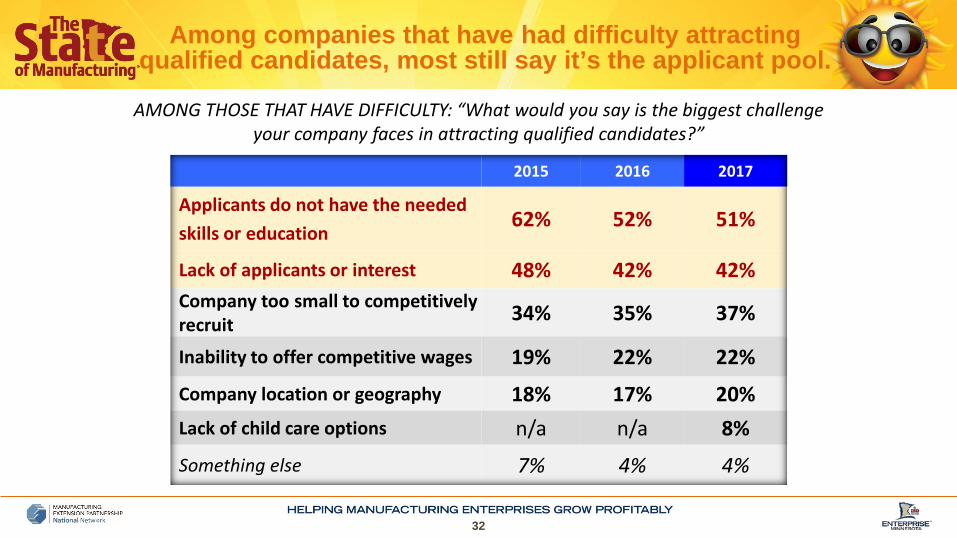
2015 2016 2017
Applicants do not have the needed skills or education
62% 52% 51%
Lack of applicants or interest 48% 42% 42%Company too small to competitively recruit 34% 35% 37%
Inability to offer competitive wages 19% 22% 22%
Company location or geography 18% 17% 20%Lack of child care options n/a n/a 8%
Something else 7% 4% 4%
AMONG THOSE THAT HAVE DIFFICULTY: “What would you say is the biggest challenge your company faces in attracting qualified candidates?”
Among companies that have had difficulty attractingqualified candidates, most still say it’s the applicant pool.

33
Twin CitiesMetro Area
Greater Minnesota
Applicants do not have the neededskills or education 55% 46%
Lack of applicants or interest 39% 45%Company too small to competitively recruit 32% 42%Inability to offer competitive wages 25% 18%Company location or geography 8% 34%Lack of child care options 8% 8%Something else 4% 5%
Companies in Greater Minnesota report having a larger challenge with a lack of applicants
and interest, and with their location.Biggest Challenges Facing Company in Attracting Qualified
Candidates by Metro Region AMONG THOSE THAT HAVE DIFFICULTY
34
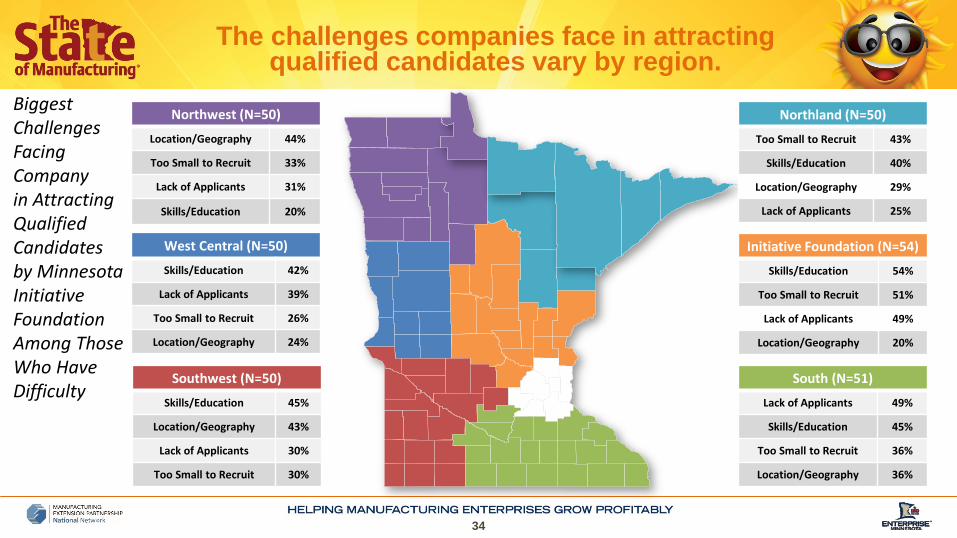
The challenges companies face in attracting qualified candidates vary by region.
Initiative Foundation (N=54)
Skills/Education 54%
Too Small to Recruit 51%
Lack of Applicants 49%
Location/Geography 20%
Northland (N=50)
Too Small to Recruit 43%
Skills/Education 40%
Location/Geography 29%
Lack of Applicants 25%
Northwest (N=50)
Location/Geography 44%
Too Small to Recruit 33%
Lack of Applicants 31%
Skills/Education 20%
South (N=51)
Lack of Applicants 49%
Skills/Education 45%
Too Small to Recruit 36%
Location/Geography 36%
Southwest (N=50)
Skills/Education 45%
Location/Geography 43%
Lack of Applicants 30%
Too Small to Recruit 30%
West Central (N=50)
Skills/Education 42%
Lack of Applicants 39%
Too Small to Recruit 26%
Location/Geography 24%
Biggest Challenges Facing Companyin Attracting Qualified Candidates by Minnesota Initiative FoundationAmong Those Who Have Difficulty
35
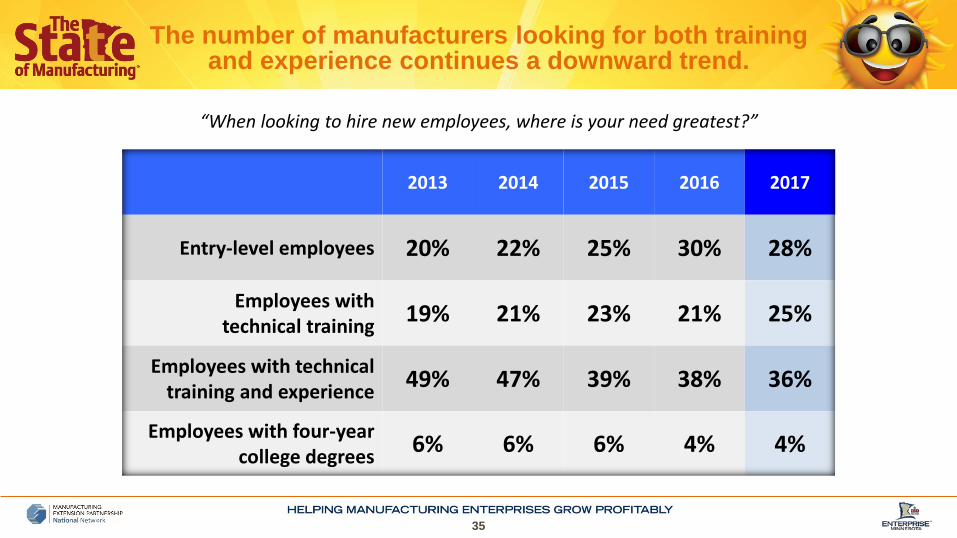
“When looking to hire new employees, where is your need greatest?”
The number of manufacturers looking for both training and experience continues a downward trend.
2013 2014 2015 2016 2017
Entry-level employees 20% 22% 25% 30% 28%
Employees withtechnical training 19% 21% 23% 21% 25%
Employees with technicaltraining and experience 49% 47% 39% 38% 36%
Employees with four-yearcollege degrees 6% 6% 6% 4% 4%
36
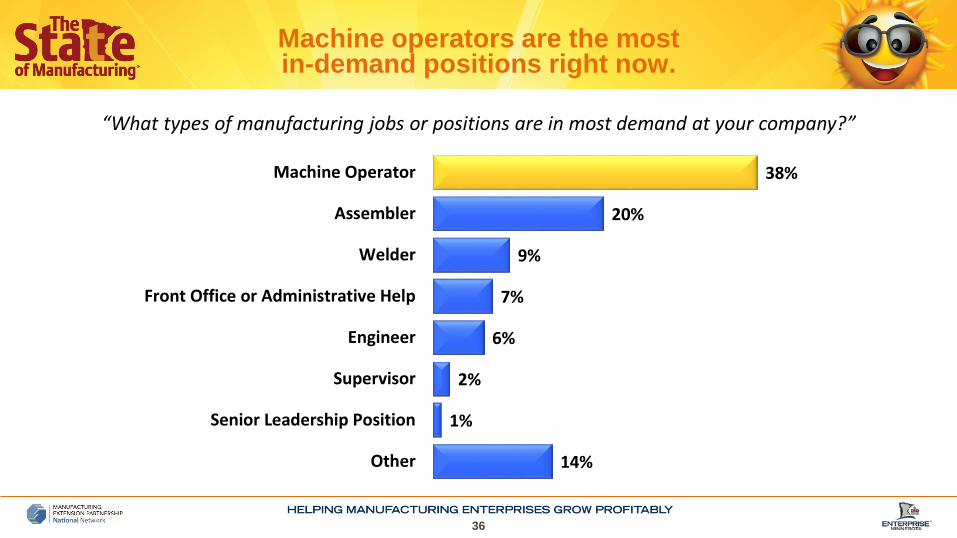
38%
20%
9%
7%
6%
2%
1%
14%
Machine Operator
Assembler
Welder
Front Office or Administrative Help
Engineer
Supervisor
Senior Leadership Position
Other
“What types of manufacturing jobs or positions are in most demand at your company?”
Machine operators are the most in-demand positions right now.

37
Demand for machine operators continues to rise.
2015 2016 2017
Machine Operator 29% 32% 38%
Assembler 23% 25% 20%
Welder 9% 9% 9%
Front office or administrative help n/a n/a 7%
Engineer 10% 7% 6%
Supervisor 4% 4% 2%
Senior Leadership Position n/a n/a 1%
Other 22% 17% 14%
Most In-Demand Jobs

38
Companies feel prepared to handle the departure of managers and skilled workers, but not so much the departure of a CEO or owner.
“Would you say you are very well, somewhat well, or not well prepared to handle that person’s departure?”
57%
74% 74% 77%
36%
19% 18% 17%
The CEOor Owner
Members ofManagement
A Manageror Supervisor
A SkilledWorker
Total Well Total Not Well

39
“On a different topic, does your company have a succession plan for when the President/Owner/CEO or top management positions retire or move on?”
A paltry half of all companies have a succession plan in place for the retirement of senior leadership.
Yes
Metro Companies 54%
Greater Minnesota Companies 45%
Less than $1 million in revenue 34%
$1-5 million in revenue 58%
Over $5 million in revenue 70%
50 or fewer employees 45%
Over 50 employees 70%
50% 48%
OverallYes No
40
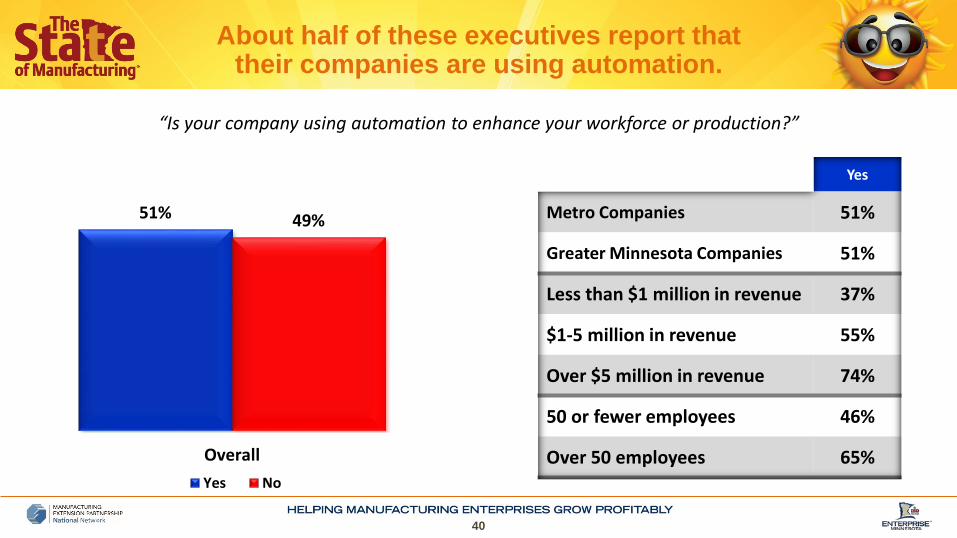
About half of these executives report that their companies are using automation.
“Is your company using automation to enhance your workforce or production?”
Yes
Metro Companies 51%
Greater Minnesota Companies 51%
Less than $1 million in revenue 37%
$1-5 million in revenue 55%
Over $5 million in revenue 74%
50 or fewer employees 46%
Over 50 employees 65%
51% 49%
OverallYes No

41
But, most do not expect automation to increase much over the next five years.
“And, in the next five years, how much do you expect automation to increase in your company?”
Overall
Increase A Lot 14%
Some 22%
Only A Little 32%
Not Increase At All 31%
36%A Lot/Some
42
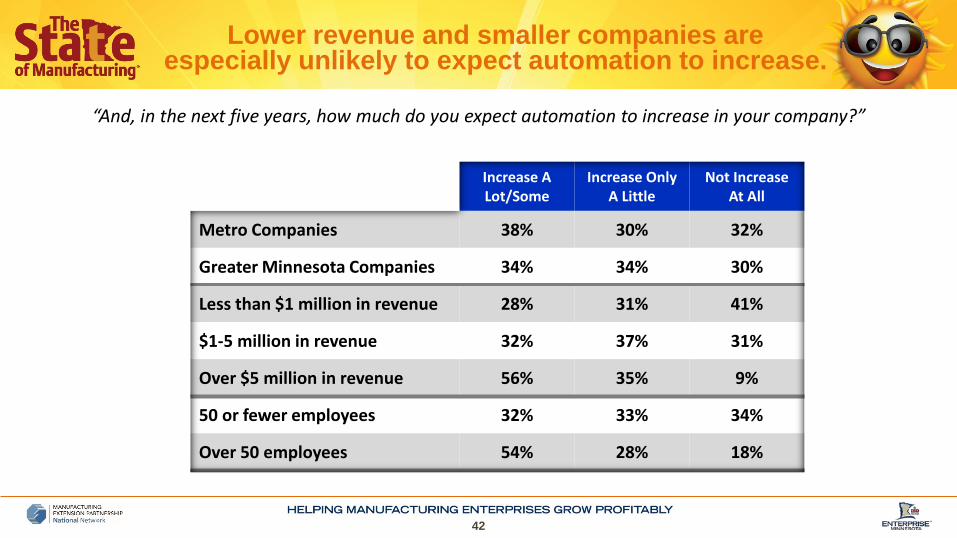
Lower revenue and smaller companies are especially unlikely to expect automation to increase.
“And, in the next five years, how much do you expect automation to increase in your company?”
Increase A Lot/Some
Increase Only A Little
Not Increase At All
Metro Companies 38% 30% 32%
Greater Minnesota Companies 34% 34% 30%
Less than $1 million in revenue 28% 31% 41%
$1-5 million in revenue 32% 37% 31%
Over $5 million in revenue 56% 35% 9%
50 or fewer employees 32% 33% 34%
Over 50 employees 54% 28% 18%
43
Wages
44
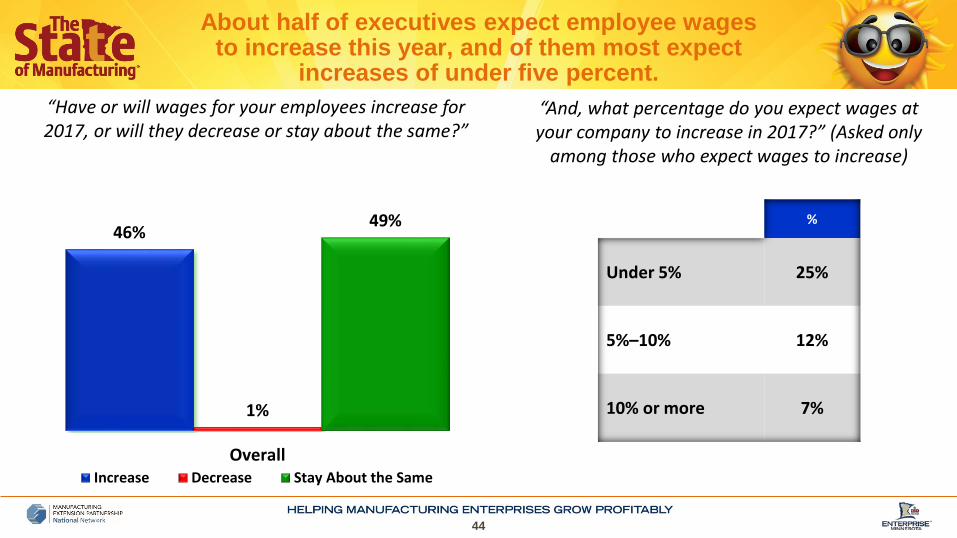
About half of executives expect employee wages to increase this year, and of them most expect
increases of under five percent.
%
Under 5% 25%
5%–10% 12%
10% or more 7%
46%
1%
49%
OverallIncrease Decrease Stay About the Same
“And, what percentage do you expect wages at your company to increase in 2017?” (Asked only
among those who expect wages to increase)
“Have or will wages for your employees increase for 2017, or will they decrease or stay about the same?”

45
“Have or will wages for your employees increase for 2017, or will they decrease or stay about the same?”
Wages at smaller companies are more likely to stay the same this year, while larger companies expect increases.
Increase Decrease Stay Same
Metro Companies 45% 1% 50%
Greater Minnesota Companies 48% 1% 48%
Less than $1 million in revenue 31% 2% 63%
$1-5 million in revenue 54% 0% 44%
Over $5 million in revenue 70% 0% 29%
50 or fewer employees 41% 1% 53%
Over 50 employees 69% 0% 31%
46
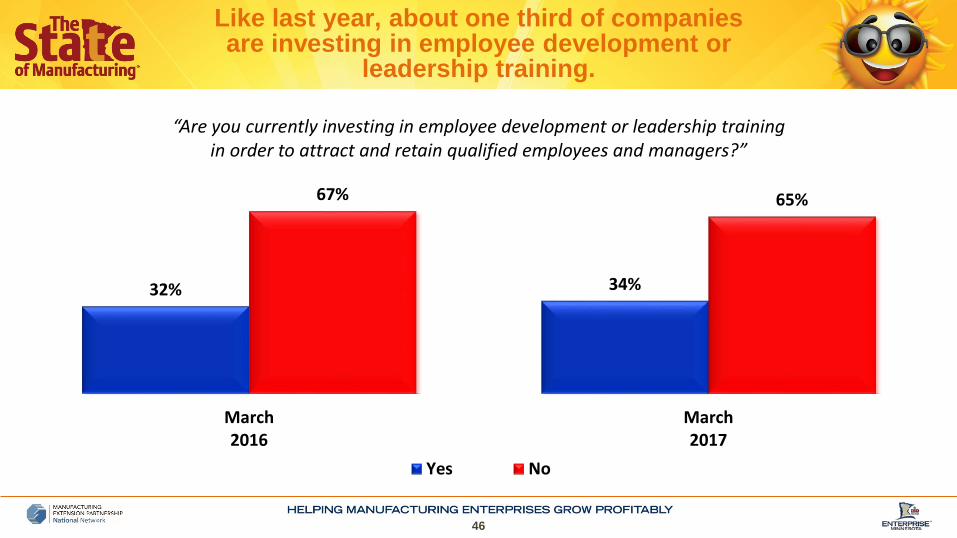
“Are you currently investing in employee development or leadership training in order to attract and retain qualified employees and managers?”
Like last year, about one third of companies are investing in employee development or
leadership training.
32% 34%
67% 65%
March2016
March2017
Yes No

47
“Are you currently investing in employee development or leadership training in order to attract and retain qualified employees and managers?”
Larger companies are much more likely than smaller ones to say they’re investing in employee
development or leadership training.
34% 34%
21%28%
67%
27%
67%64% 66%76%
71%
33%
71%
33%
Metro Firms GreaterMinnesota Firms
Revenue < $1Million
Revenue $1-5Million
Revenue $5Million +
50 or feweremployees
Over 50employees
Yes No
48
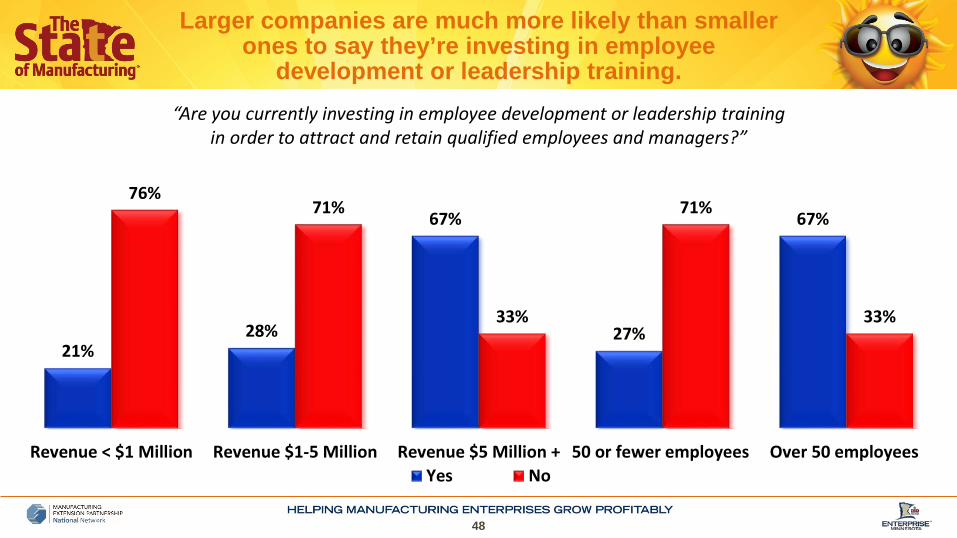
“Are you currently investing in employee development or leadership training in order to attract and retain qualified employees and managers?”
Larger companies are much more likely than smaller ones to say they’re investing in employee
development or leadership training.
21%28%
67%
27%
67%76%
71%
33%
71%
33%
Revenue < $1 Million Revenue $1-5 Million Revenue $5 Million + 50 or fewer employees Over 50 employeesYes No
49
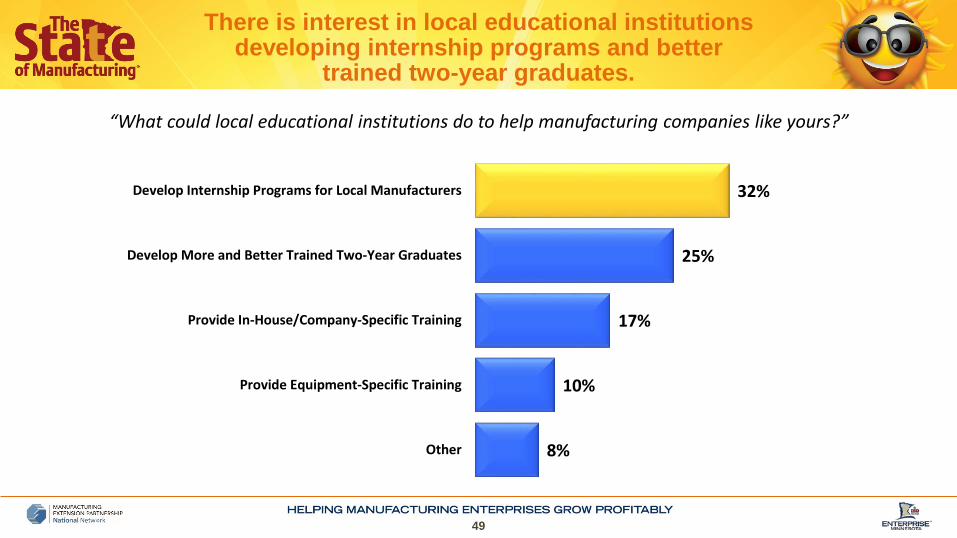
32%
25%
17%
10%
8%
Develop Internship Programs for Local Manufacturers
Develop More and Better Trained Two-Year Graduates
Provide In-House/Company-Specific Training
Provide Equipment-Specific Training
Other
“What could local educational institutions do to help manufacturing companies like yours?”
There is interest in local educational institutions developing internship programs and better
trained two-year graduates.

50
Companies outside the Twin Cities are more interested in local educational institutions developing internship
programs for local manufacturers.
36%
21%
16%
9%
11%
30%
27%
17%
11%
5%
Develop Internship Programs for Local Manufacturers
Develop More and Better Trained Two-Year Graduates
Provide In-House/Company-Specific Training
Provide Equipment-Specific Training
Other
Metro Companies Greater MN Companies
“What could local educational institutions do to help manufacturing companies like yours?”

51
16% 19% 18% 17% 18%25% 22% 22% 21%
13% 10% 8% 8% 12% 7% 6% 5% 3%
69% 67% 71% 72% 68% 67% 71% 72% 75%
December2008
January2010
January2011
January2012
March2013
March2014
March2015
March2016
March2017
Will Invest More Will Invest Less Will Stay the Same
“Generally speaking, would you say that as a percentage of payroll your company will invest MORE in employee skills, talent, and leadership development or
LESS next year compared to 2016, or will it stay about the same?”
Three fourths of companies expect to spend the same on employee development as they did last year.
52
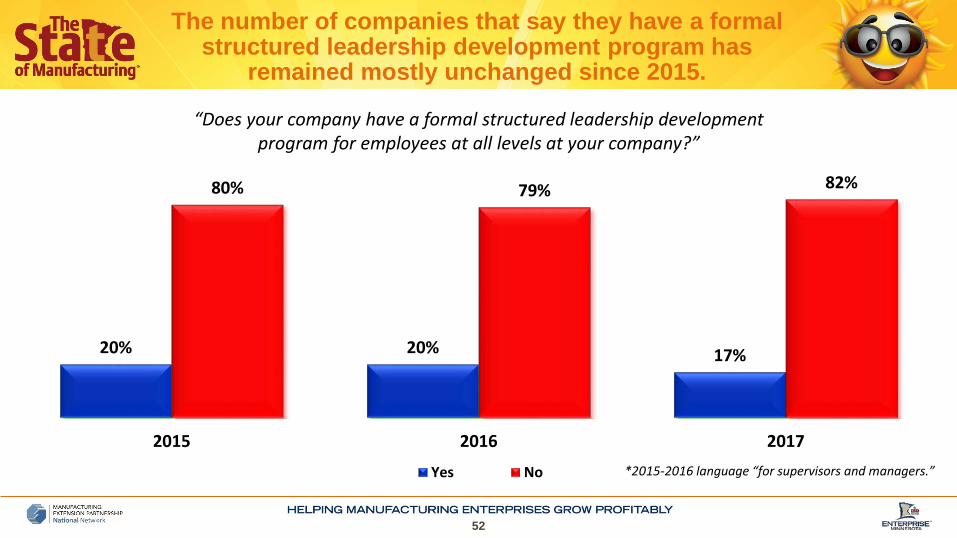
The number of companies that say they have a formal structured leadership development program has
remained mostly unchanged since 2015.
“Does your company have a formal structured leadership development program for employees at all levels at your company?”
20% 20% 17%
80% 79% 82%
2015 2016 2017
Yes No *2015-2016 language “for supervisors and managers.”

53
2015 2016 2017
Metro Firms 21% 21% 16%
Greater Minnesota Firms 17% 19% 18%
Less than $1 million in revenue 7% 12% 9%
$1-5 million in revenue 26% 20% 22%
Over $5 million in revenue 32% 38% 27%
50 or fewer employees 16% 15% 14%
Over 50 employees 37% 50% 33%
The percentage of larger companies with formal structured leadership program has decreased.
Formal Structured Leadership Development Programs % Yes by Key Sub-Groups
54
Trade and Supply Chain Relationships

55
“Have you gained new OEM business from customers wanting to have suppliers closer to their location?”
The percentage of companies that have gained new OEM business from customers wanting to have
more local suppliers continues to tick up.
26%32% 34%
71%64% 62%
2015 2016 2017Yes No
56
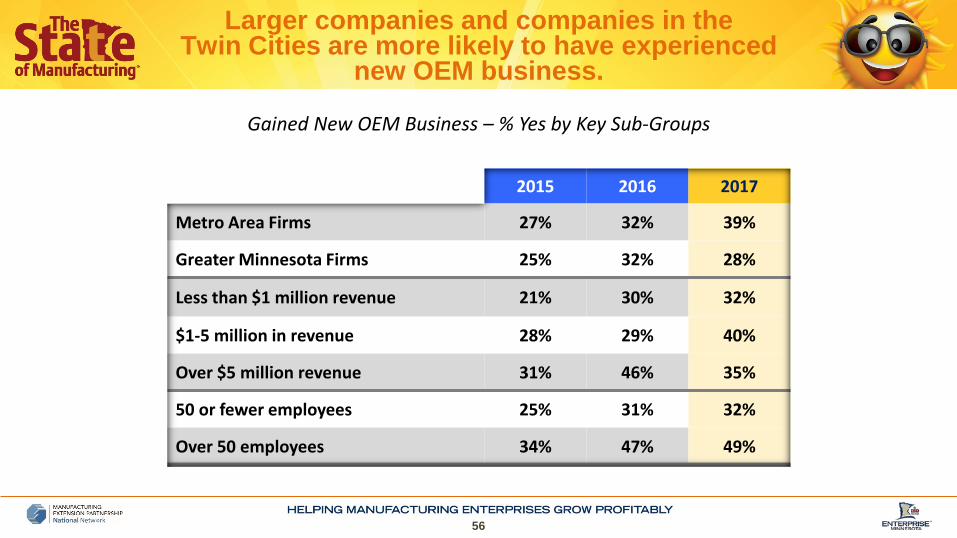
Gained New OEM Business – % Yes by Key Sub-Groups
Larger companies and companies in the Twin Cities are more likely to have experienced
new OEM business.
2015 2016 2017
Metro Area Firms 27% 32% 39%
Greater Minnesota Firms 25% 32% 28%
Less than $1 million revenue 21% 30% 32%
$1-5 million in revenue 28% 29% 40%
Over $5 million revenue 31% 46% 35%
50 or fewer employees 25% 31% 32%
Over 50 employees 34% 47% 49%

57
33%
26%
20%
12%
Shorter Lead Times
Total Costs Versus Only Product Costs
Closer Relationships/Regional Suppliers
Better Inventory Management
The main driver of this trend continues to be shorter lead times.
AMONG THOSE THAT GAINED NEW BUSINESS: “What would you say is the main reason why your supply chain relationships changed?”

Manufacturing executives say free trade agreements don’t make much difference.
“Changing topics again, in general, do you think free trade agreements help manufacturers like your company, hurt manufacturers like your company, or not make much of a difference either way?”
17% 19%
58%
March 2017Help Hurt Make No Difference
Help
Metro Companies 21%
Greater Minnesota Companies 11%
50 or fewer employees 15%
Over 50 employees 23%
58

59
Strategic Growth Plan
60
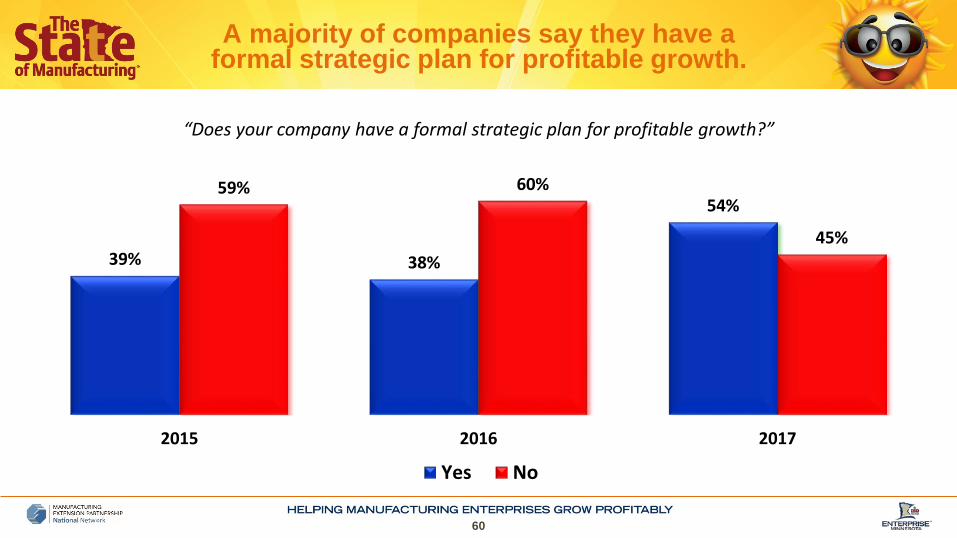
A majority of companies say they have a formal strategic plan for profitable growth.
39% 38%
54%59% 60%
45%
2015 2016 2017
Yes No
“Does your company have a formal strategic plan for profitable growth?”

61
Also similar to last year, larger companies are more likely to have formal strategic growth plans.
Formal Strategic Growth Plan– % Yes by Key Sub-Groups
2016 2017 Increase
Metro Area Companies 42% 55% +13
Greater Minnesota Companies 34% 53% +19
Less than $1 million revenue 23% 40% +17
$1-5 million in revenue 42% 58% +16
Over $5 million revenue 65% 77% +12
50 or fewer employees 35% 49% +14
Over 50 employees 69% 77% +8

62
Final Thoughts
63
Lifted by their perceptions of positive conditions in the U.S. economy and their own business circumstances, manufacturers report the highest confidence number we have registered in the history of our survey.
Also in record numbers, they are optimistic about the economy and their projections of revenue and profitability. Their concerns about the global economy are at all-time lows, as is their worry about government regulations.
Final Thoughts
64
The cost of health care coverage is the top concern for manufacturing executives, and its resurgence may be attributed to the fact that our interview schedule coincided with highly visible attempts by the House of Representatives to kill Obamacare.
“Attracting and retaining a qualified workforce” experienced the largest bump up when manufacturers were asked to name the one or two biggest challenges that might negatively impact future growth. It is especially worrisome for higher revenue and larger size companies.
Final Thoughts
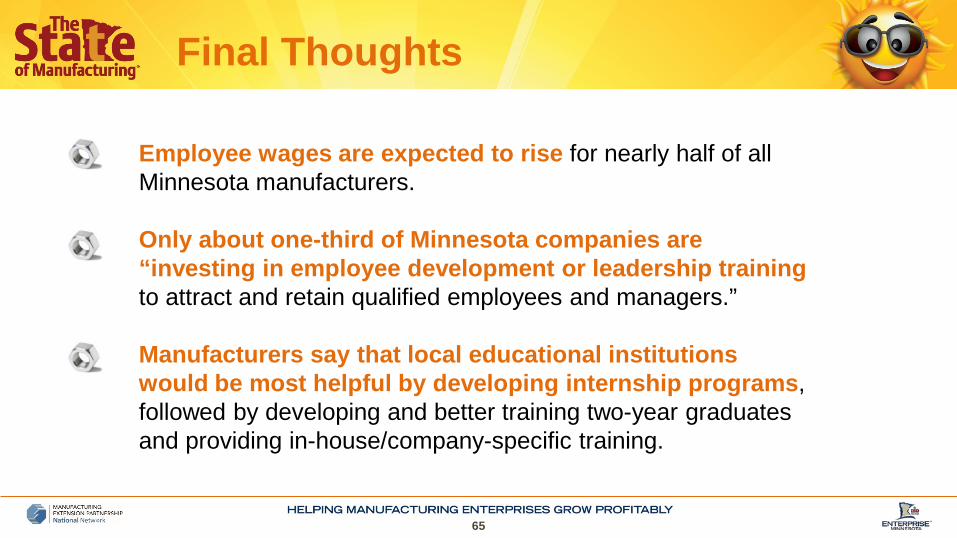
65
Employee wages are expected to rise for nearly half of all Minnesota manufacturers.
Only about one-third of Minnesota companies are “investing in employee development or leadership training to attract and retain qualified employees and managers.”
Manufacturers say that local educational institutions would be most helpful by developing internship programs, followed by developing and better training two-year graduates and providing in-house/company-specific training.
Final Thoughts

66
Thirty-four percent of companies say they have gained new business from customers wanting to have suppliers closer to their location, up from 26 percent in 2015 and 32 percent in 2016.
Companies are strategically planning for greater growth by a large margin. Fifty-four percent of manufacturers now have created strategic plans, fully 16 percent higher than 2016.
Final Thoughts
The 2017 State of Manufacturing® survey was sponsored by:
Full results can be viewed at www.enterpriseminnesota.org
67