Embed Size (px)
Citation preview
WELCOME TO PHYC 307LJunior Lab II
Spring Semester 2019
Instructor: Dr Michael Hasselbeck
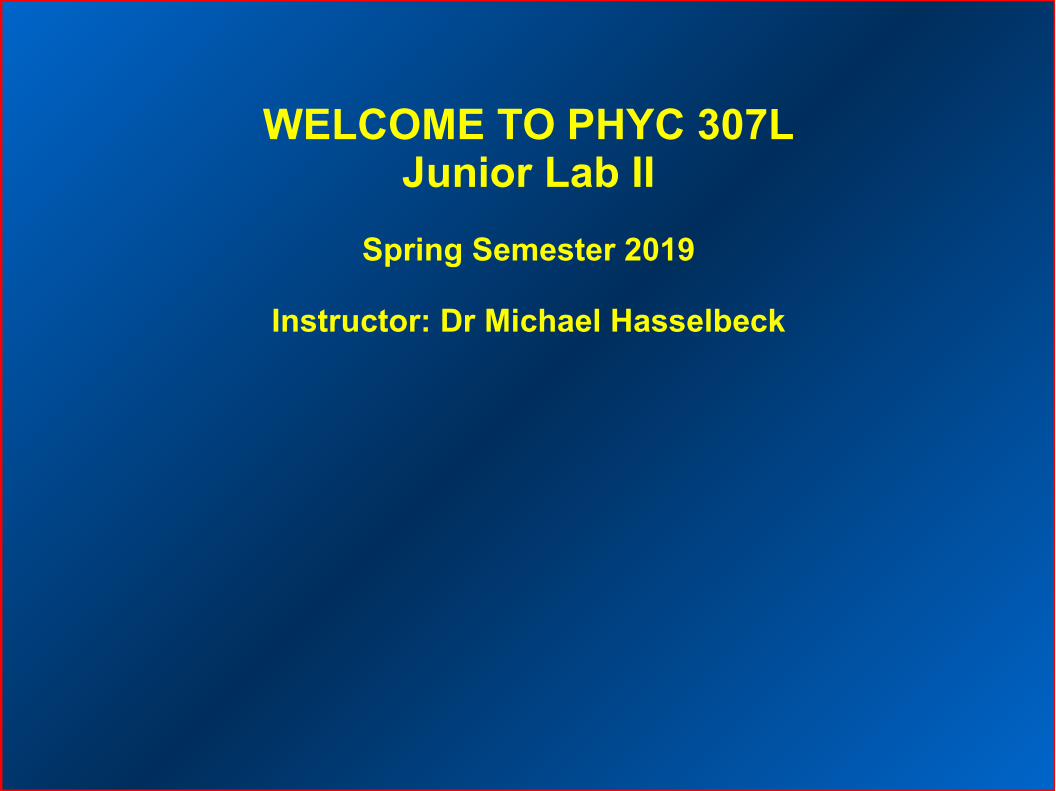
Challenging Modern Physics experiments
Require independent problem solving – harder than intro physics labs
10 experiments available; must do 6
1) Speed of Light2) Balmer Series3) Poisson Statistics4) Planck's Constant5) Compton Scattering6) Electron Diffraction7) Ratio e/m8) Franck-Hertz experiment*9) Electron spin resonance*10) Millikan oil drop: electron charge*
* Should be attempted later in semester
First week lab (everyone): Review of oscilloscope and R-C circuits

Students work in teams of no more than 2
Teams change every 2 weeks (except morning session)
There is a free week at end of semester for makeup
UNM policy prevents access to labs outside of scheduled times
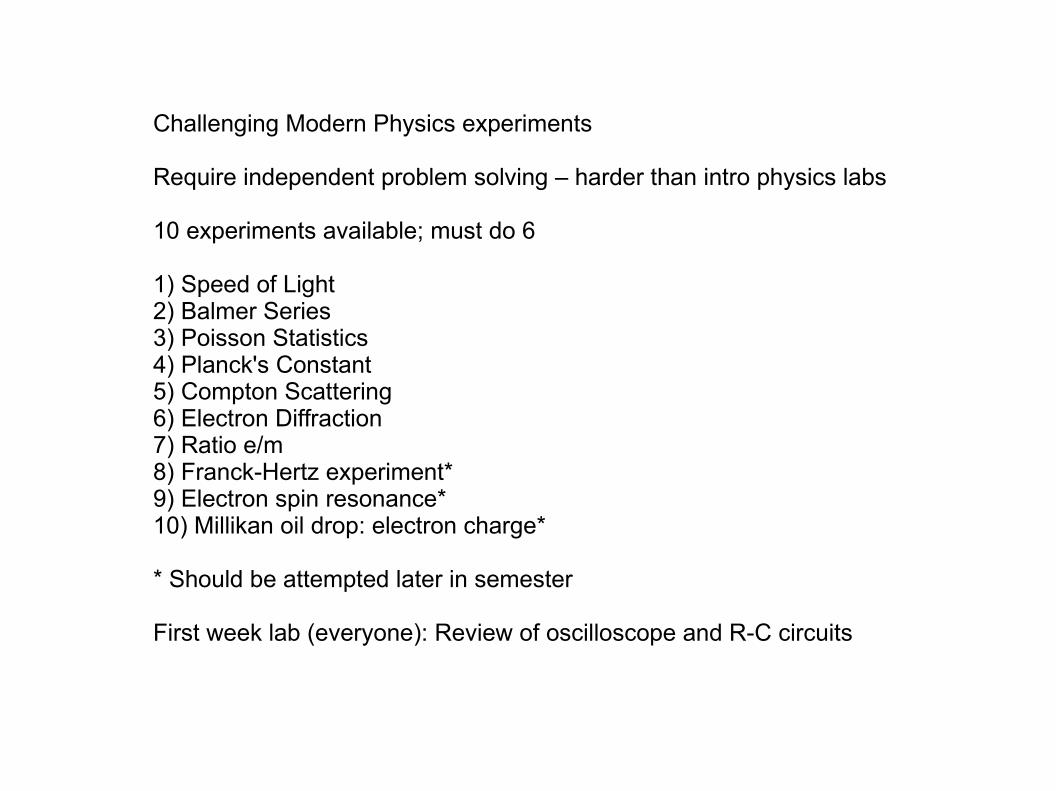
Course material: Laboratory Composition BookUNM bookstore, office supply stores, online
THIS NOT THIS
Everything else you will need is on the class webpage (Lab instructions, Syllabus, etc)
Linked on the Physics & Astronomy Dept website
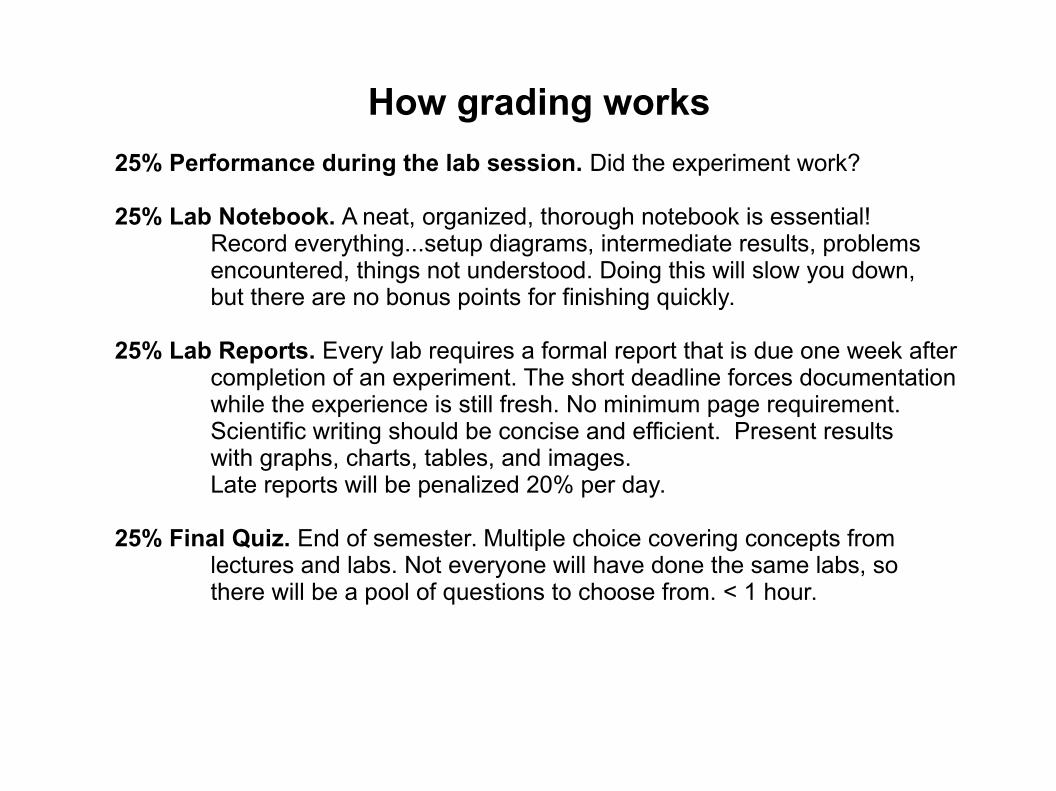
How grading works
25% Performance during the lab session. Did the experiment work?
25% Lab Notebook. A neat, organized, thorough notebook is essential! Record everything...setup diagrams, intermediate results, problems encountered, things not understood. Doing this will slow you down, but there are no bonus points for finishing quickly.
25% Lab Reports. Every lab requires a formal report that is due one week after completion of an experiment. The short deadline forces documentationwhile the experience is still fresh. No minimum page requirement. Scientific writing should be concise and efficient. Present results with graphs, charts, tables, and images. Late reports will be penalized 20% per day.
25% Final Quiz. End of semester. Multiple choice covering concepts from lectures and labs. Not everyone will have done the same labs, sothere will be a pool of questions to choose from. < 1 hour.
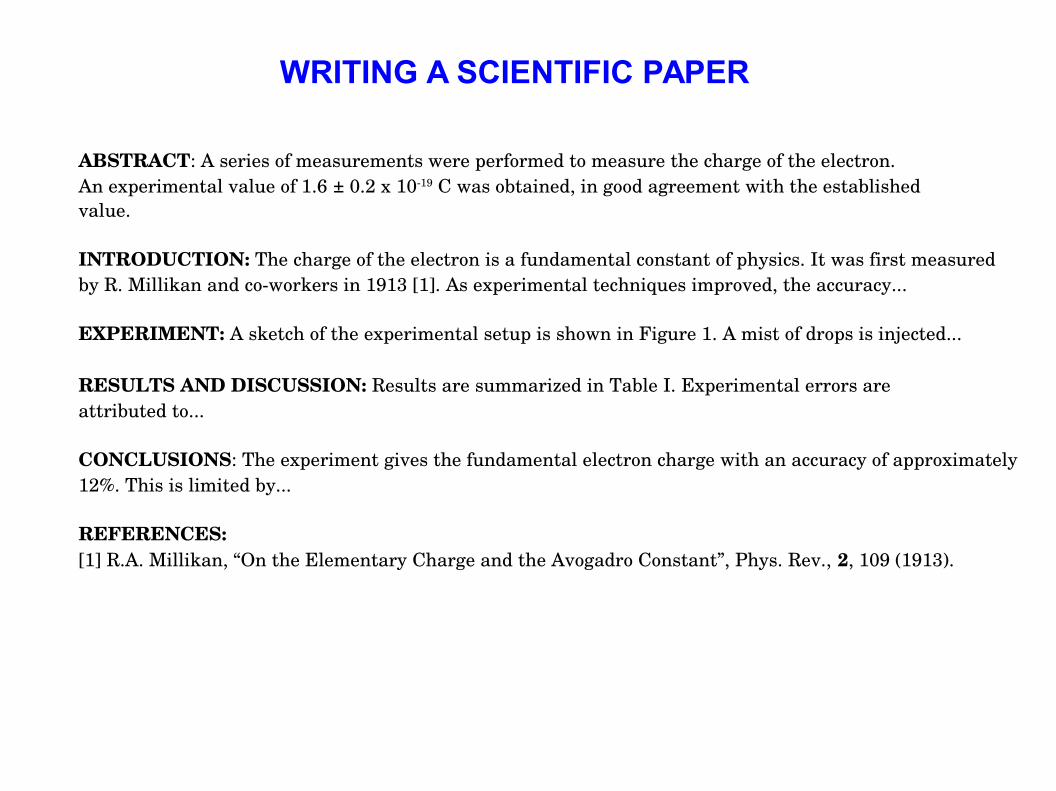
WRITING A SCIENTIFIC PAPER
ABSTRACT: A series of measurements were performed to measure the charge of the electron. An experimental value of 1.6 ± 0.2 x 10¹⁹ C was obtained, in good agreement with the establishedvalue.
INTRODUCTION: The charge of the electron is a fundamental constant of physics. It was first measuredby R. Millikan and coworkers in 1913 [1]. As experimental techniques improved, the accuracy...
EXPERIMENT: A sketch of the experimental setup is shown in Figure 1. A mist of drops is injected...
RESULTS AND DISCUSSION: Results are summarized in Table I. Experimental errors areattributed to...
CONCLUSIONS: The experiment gives the fundamental electron charge with an accuracy of approximately12%. This is limited by...
REFERENCES: [1] R.A. Millikan, “On the Elementary Charge and the Avogadro Constant”, Phys. Rev., 2, 109 (1913).
Will cover error analysis, probability, statistics, and scientific writing
Some lecture material will be on the final quiz
Lectures will happen only in the first part of the semester. When the lecturesconclude, students in Tuesday session do not need to attend on Mondays. Monday sessions will start at 14:00 instead of 13:00.
MONDAY LECTURES
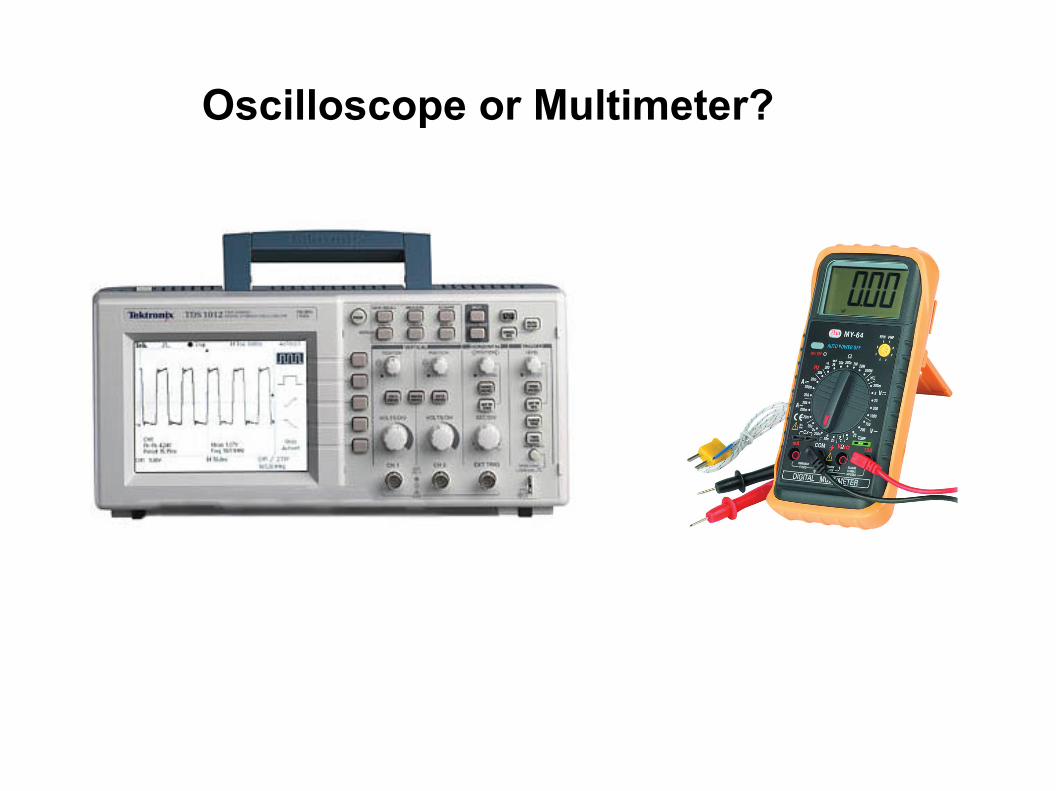
Oscilloscope or Multimeter?
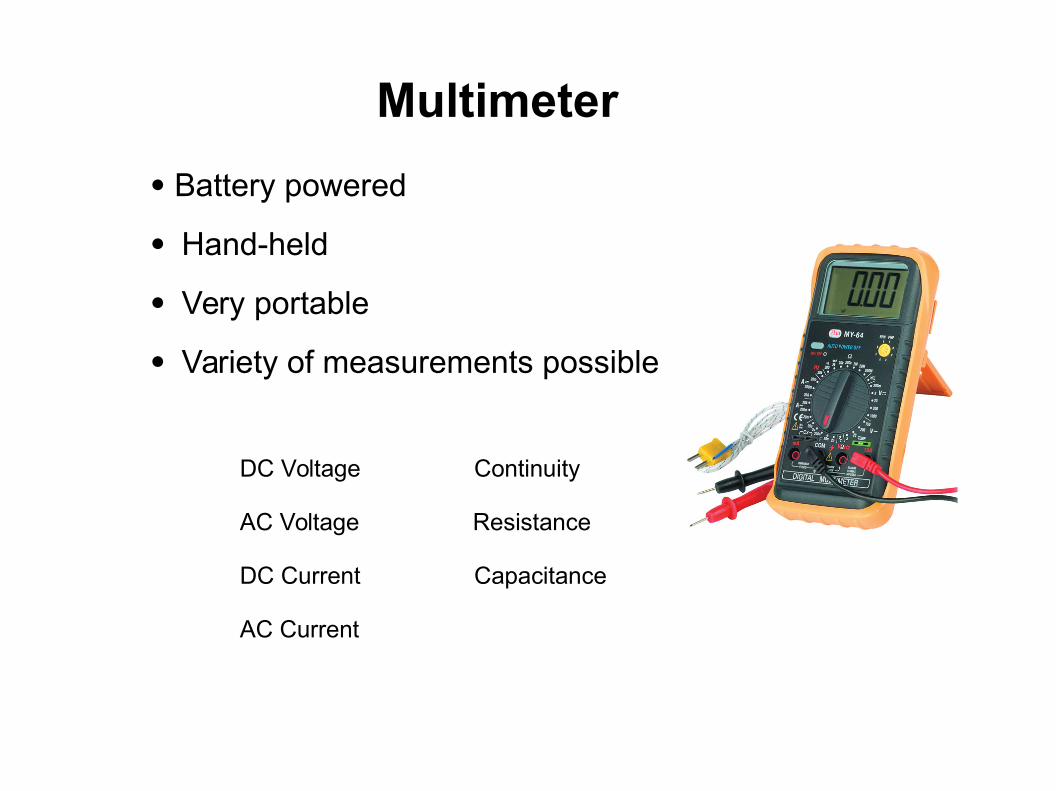
Multimeter
· Battery powered
· Hand-held
· Very portable
· Variety of measurements possible
DC Voltage Continuity
AC Voltage Resistance
DC Current Capacitance
AC Current
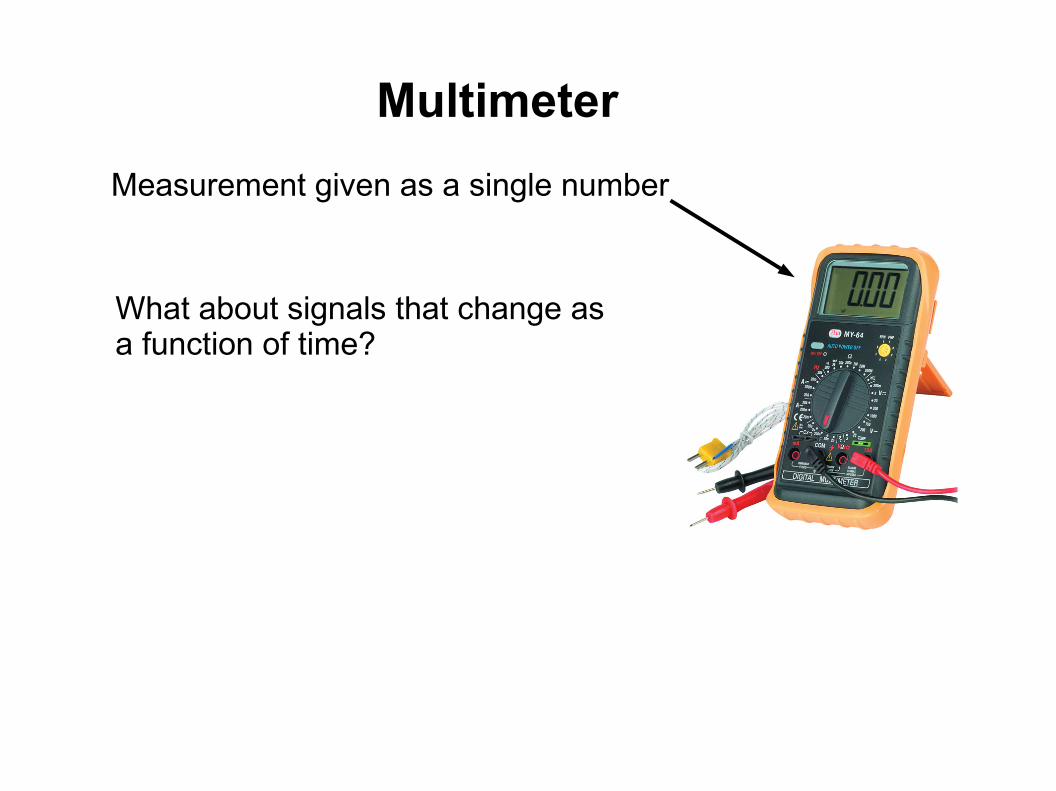
Multimeter
Measurement given as a single number
What about signals that change asa function of time?
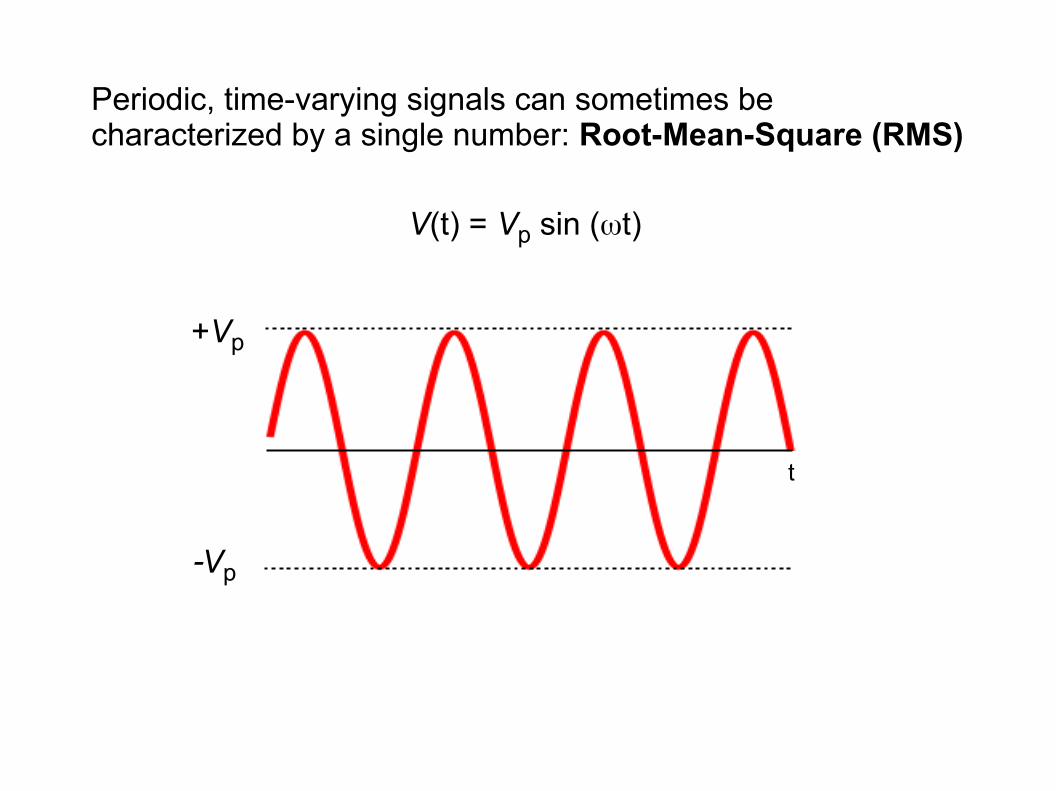
Periodic, time-varying signals can sometimes be characterized by a single number: Root-Mean-Square (RMS)
V(t) = Vp sin (wt)
t
+Vp
-Vp
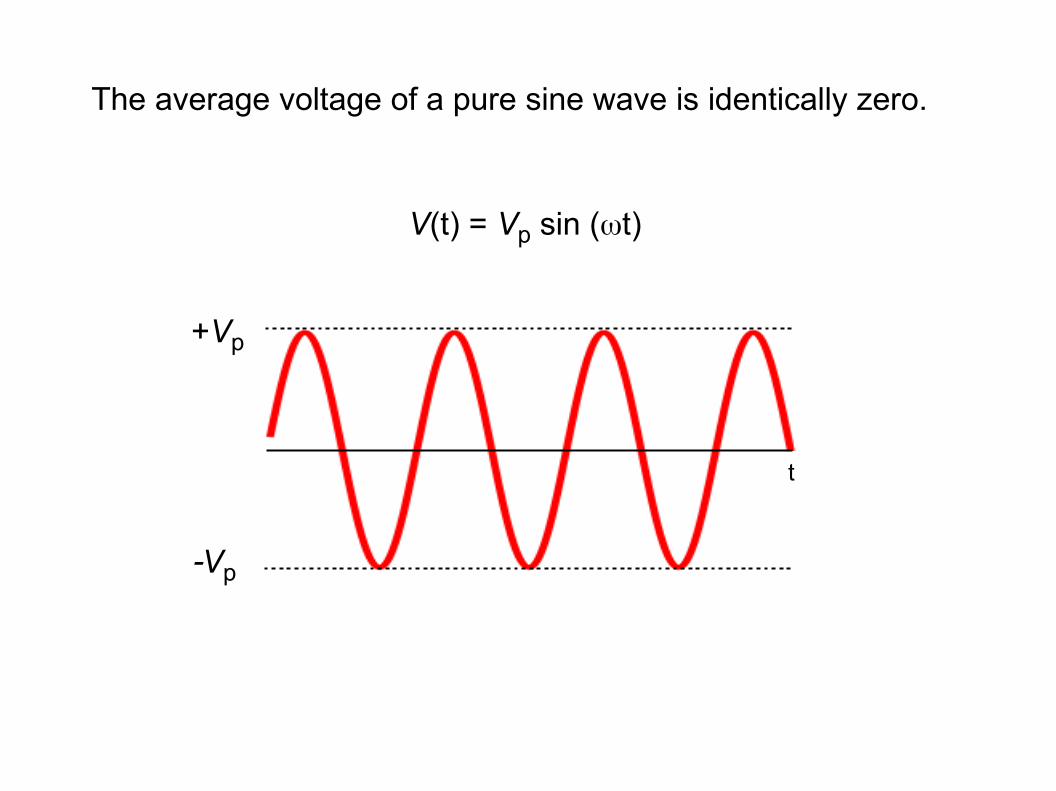
The average voltage of a pure sine wave is identically zero.
V(t) = Vp sin (wt)
t
+Vp
-Vp
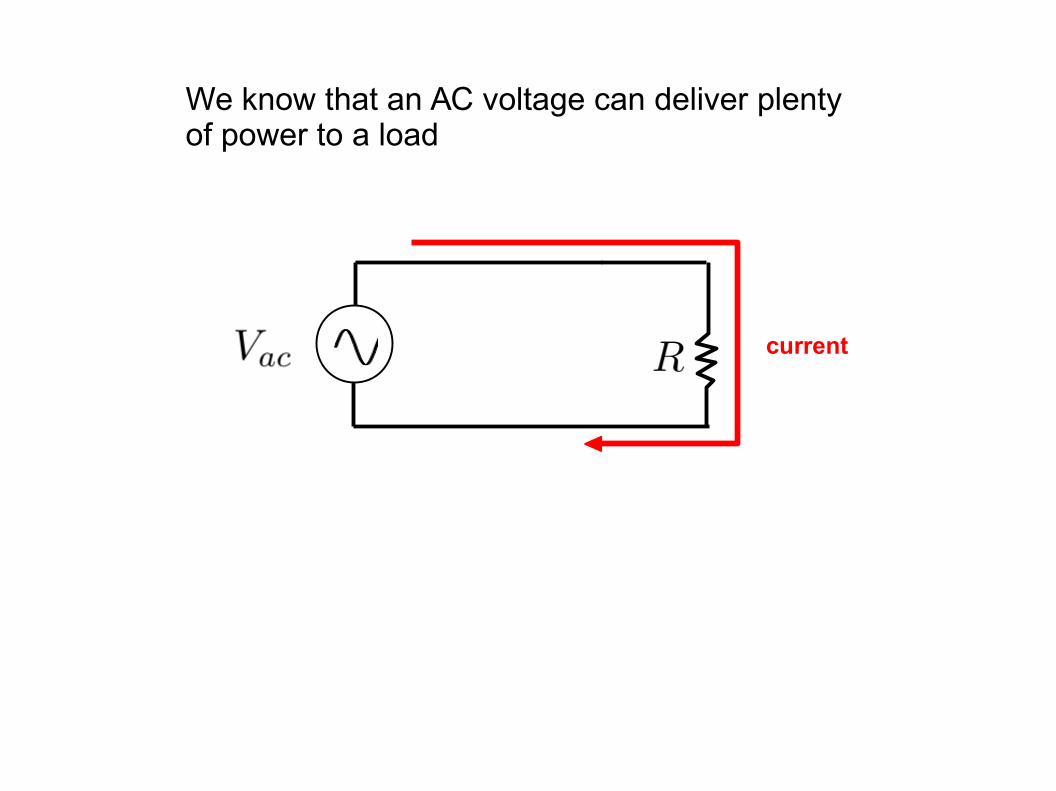
We know that an AC voltage can deliver plenty of power to a load
current
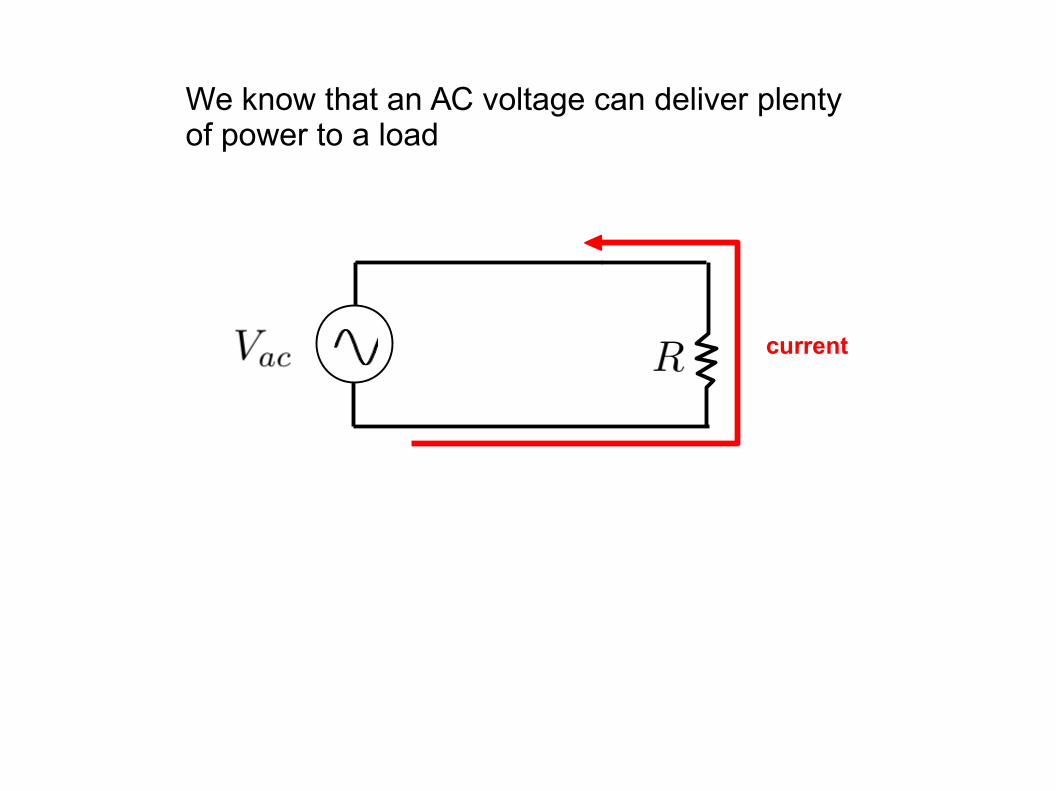
current
We know that an AC voltage can deliver plenty of power to a load
current
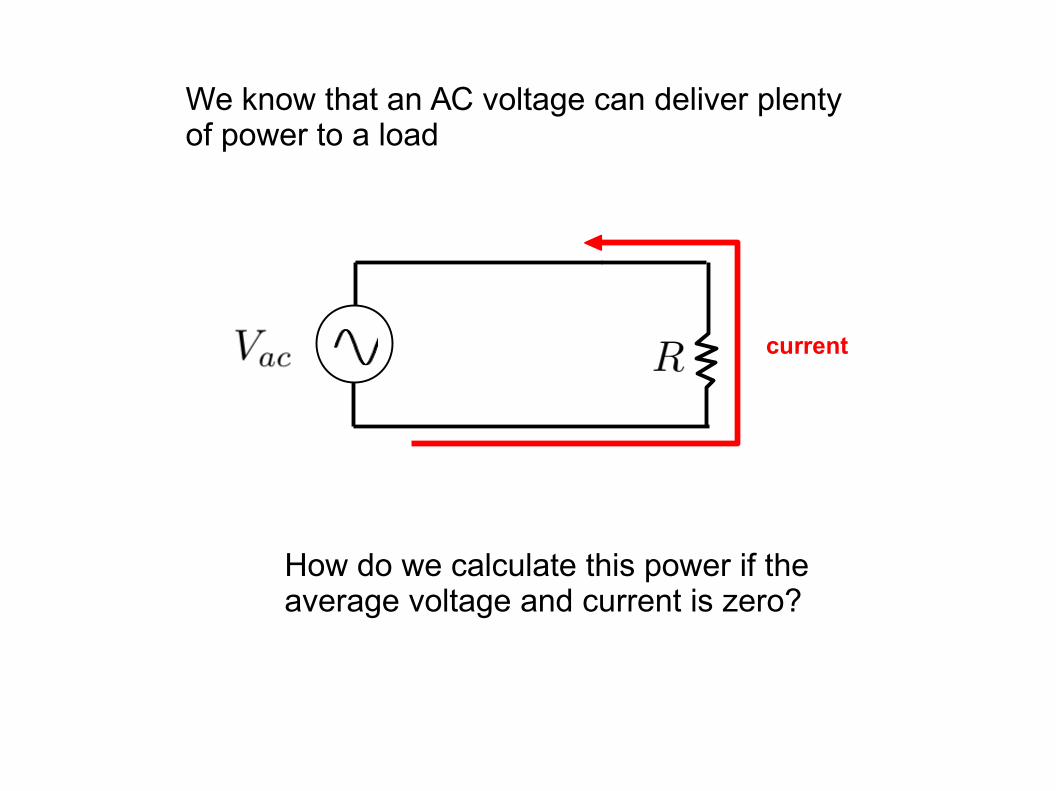
We know that an AC voltage can deliver plenty of power to a load
How do we calculate this power if the average voltage and current is zero?
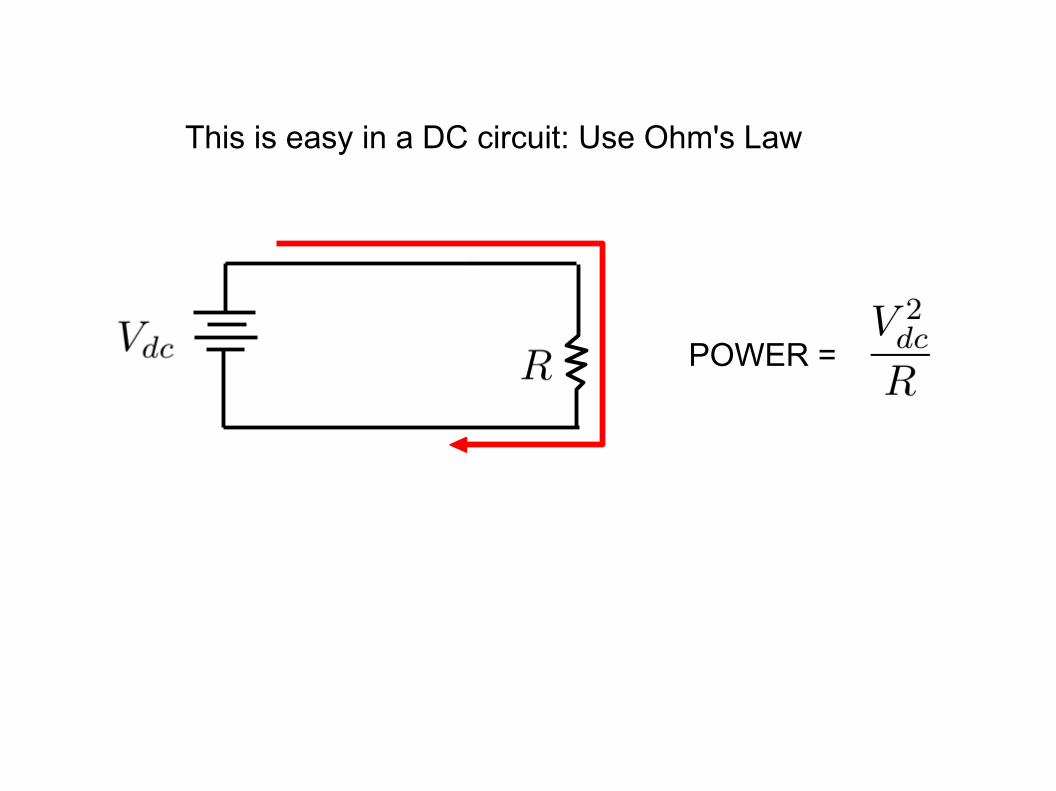
POWER =
This is easy in a DC circuit: Use Ohm's Law
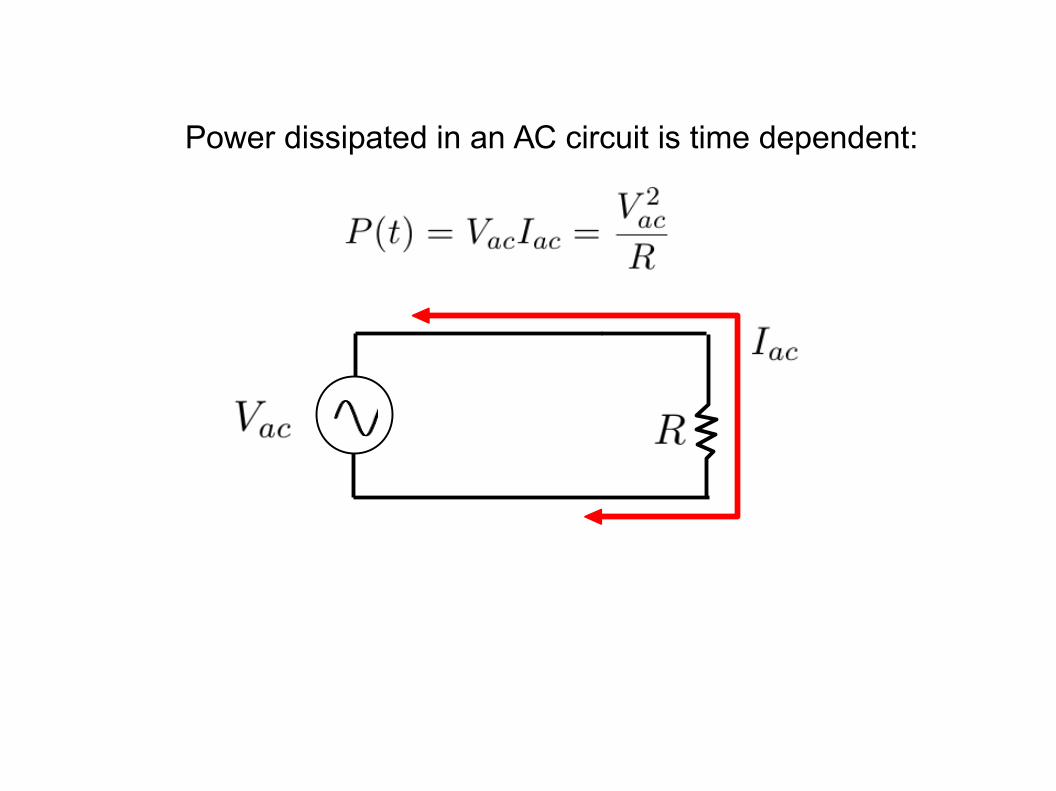
Power dissipated in an AC circuit is time dependent:
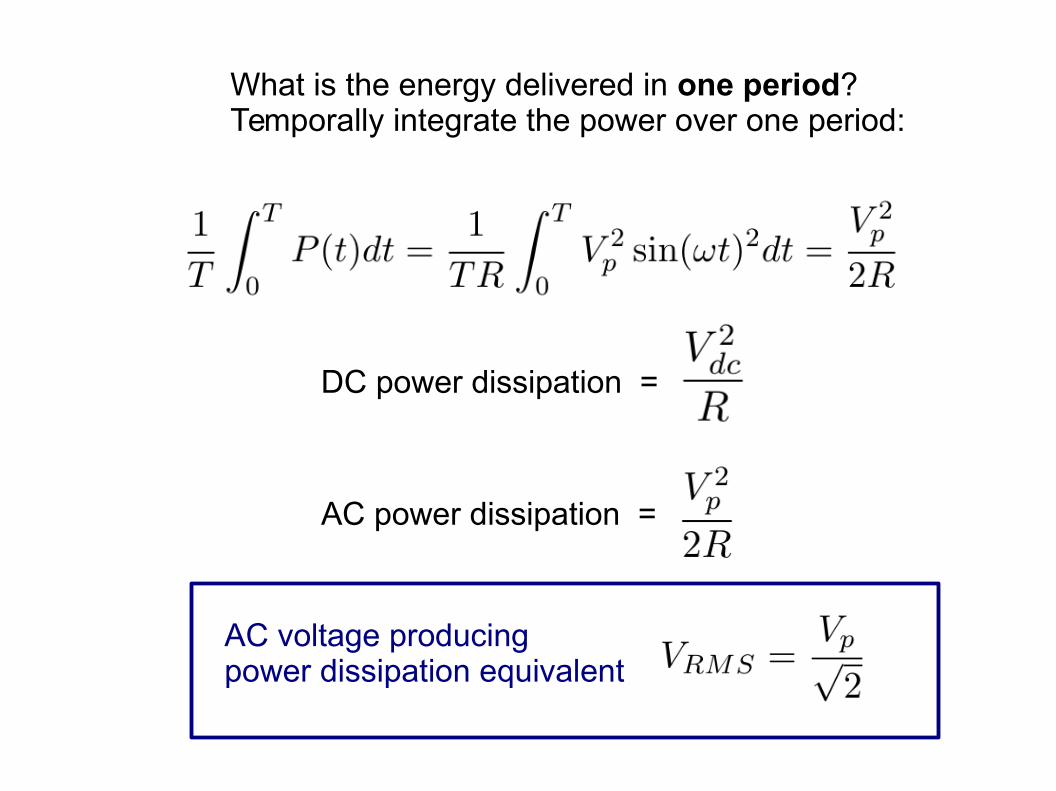
What is the energy delivered in one period?Temporally integrate the power over one period:
DC power dissipation =
AC power dissipation =
AC voltage producing power dissipation equivalent
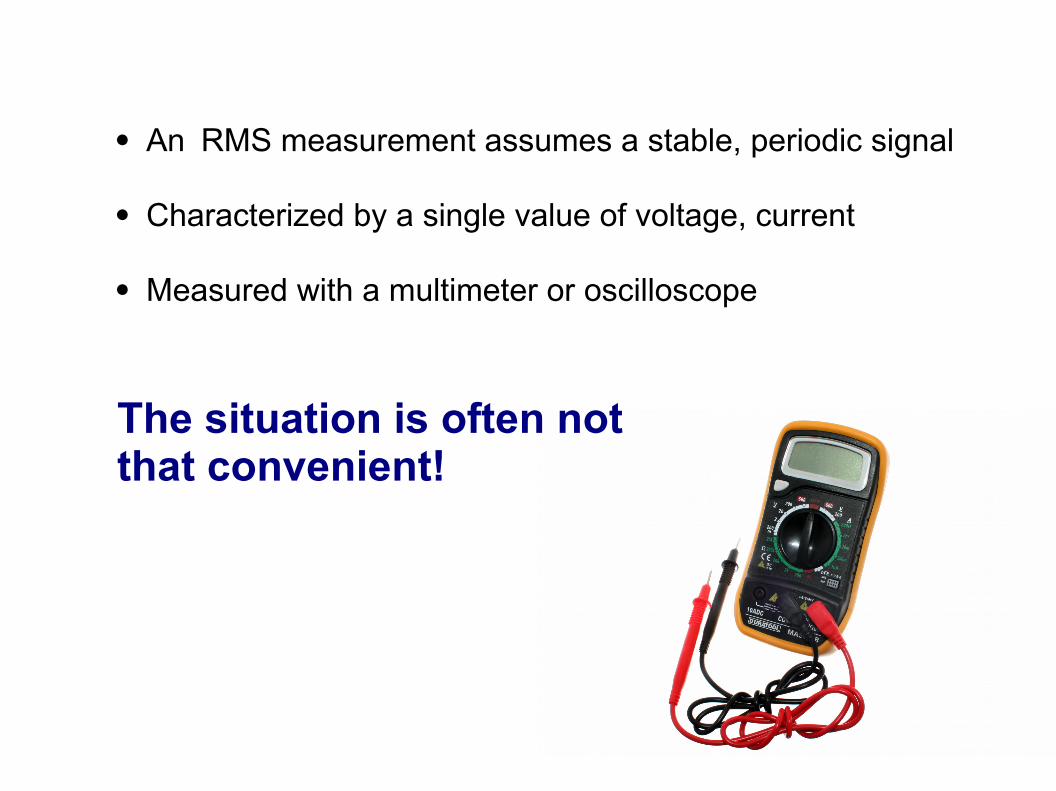
· An RMS measurement assumes a stable, periodic signal
· Characterized by a single value of voltage, current
· Measured with a multimeter or oscilloscope
The situation is often not that convenient!
TIME
VO
LTA
GE
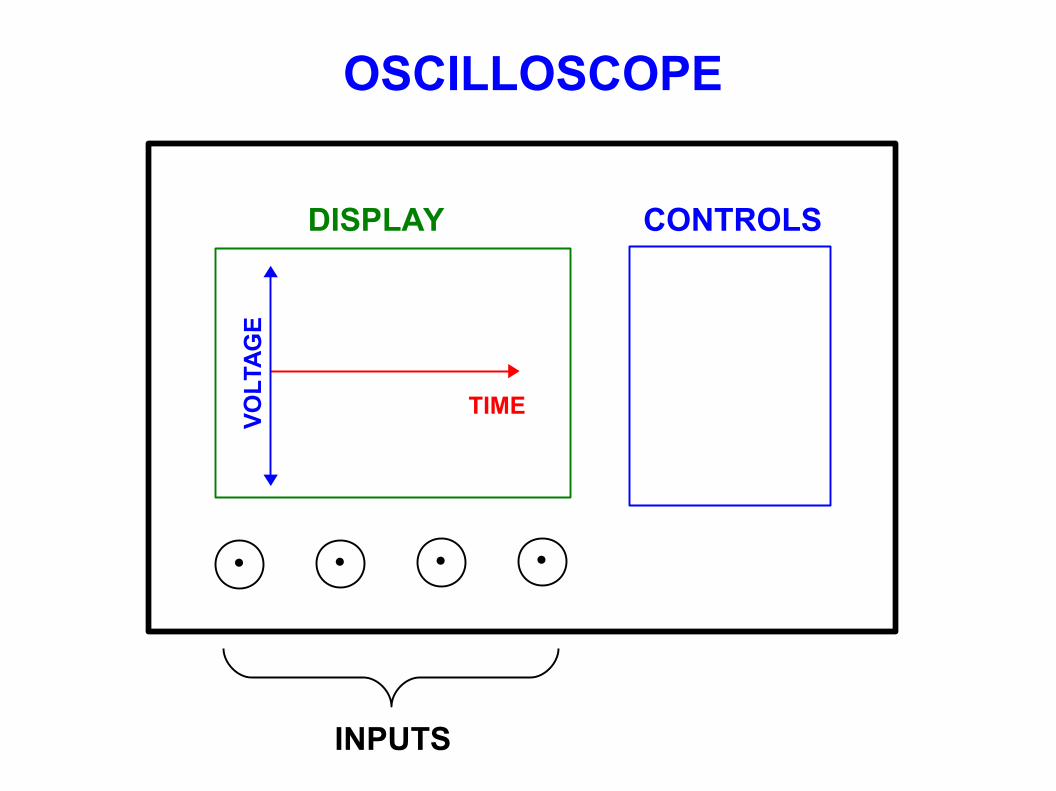
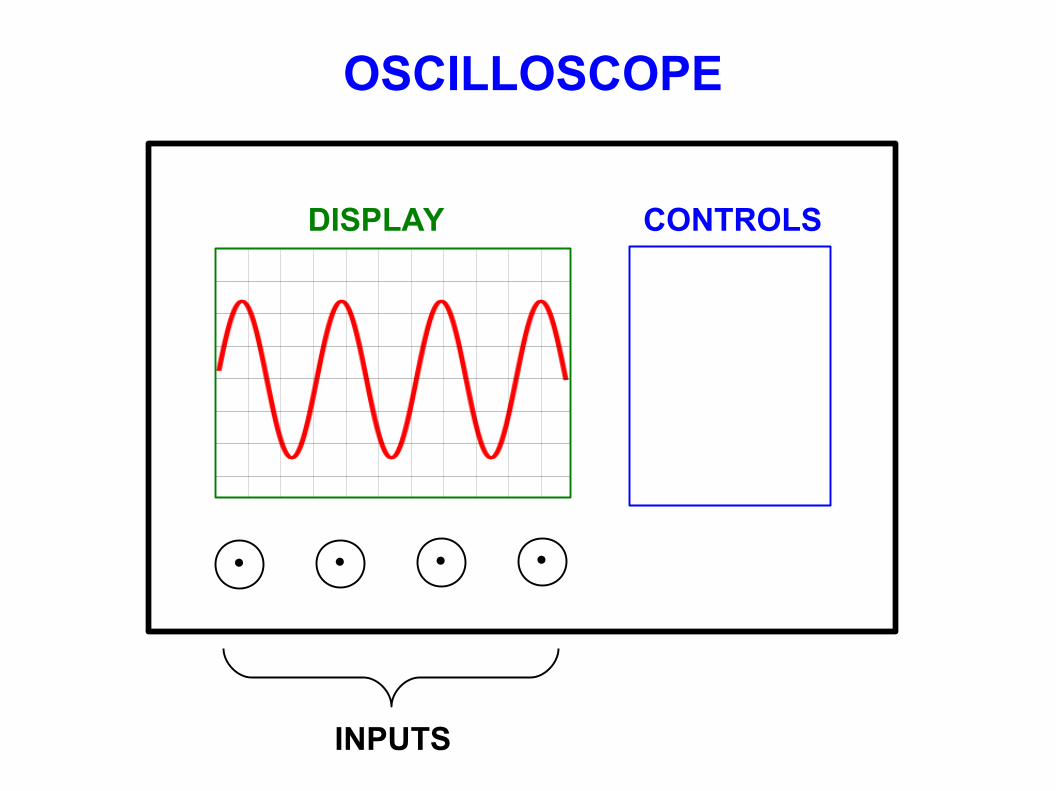
DISPLAY
· · · ·
CONTROLS
INPUTS
OSCILLOSCOPE
DISPLAY
· · · ·
CONTROLS
INPUTS
OSCILLOSCOPE
ANALOG: Cathode ray tube, swept electron beam
DIGITAL: A/D converter, LCD display
Although physical operation is completely different, controls are nearly identical
· · · ·
CONTROLS
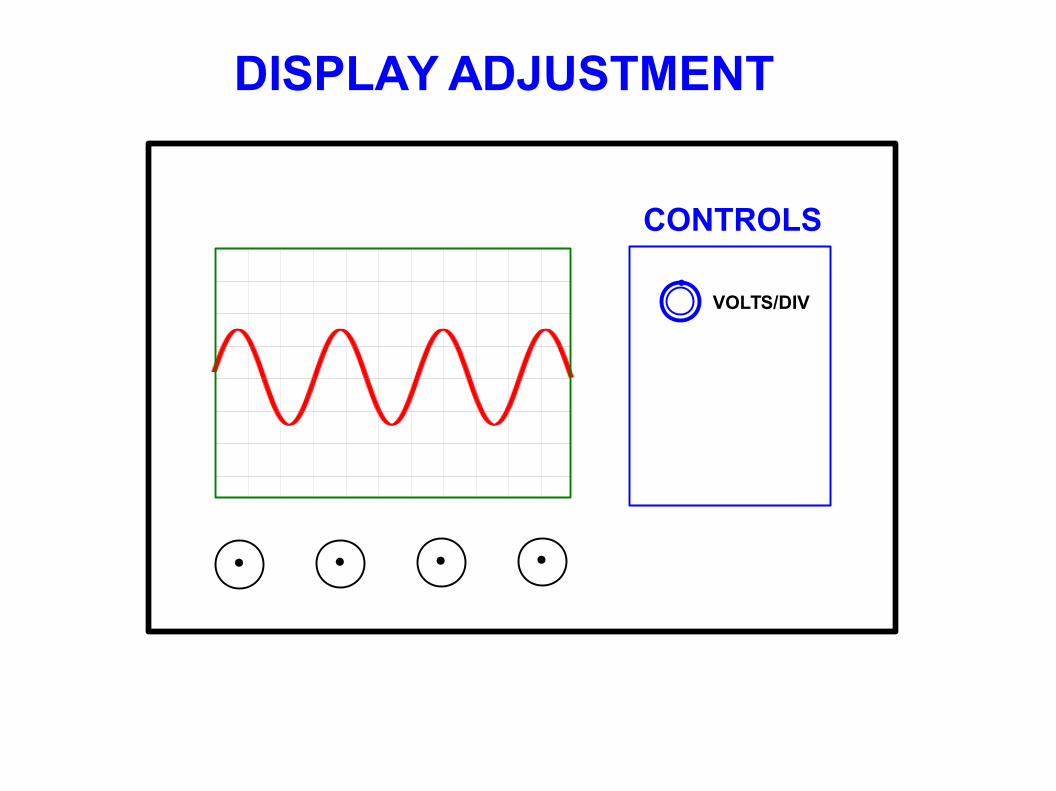
DISPLAY ADJUSTMENT
VOLTS/DIV·
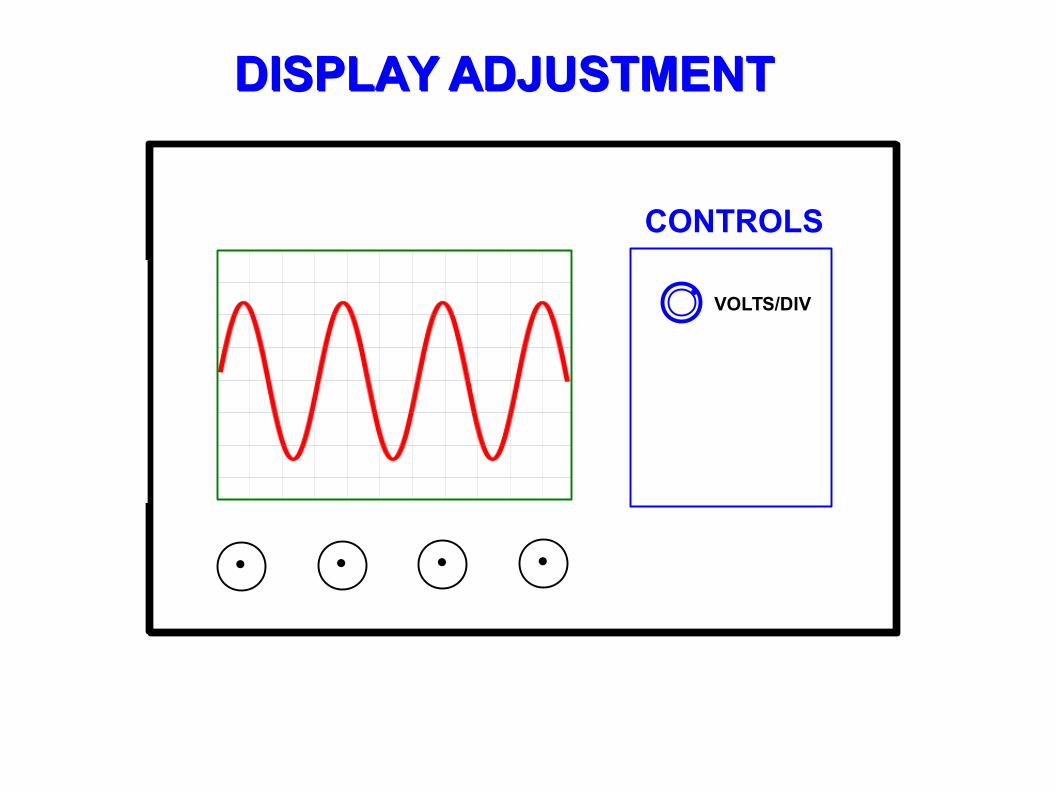
DISPLAY ADJUSTMENT
· · · ·
CONTROLS
DISPLAY ADJUSTMENT
VOLTS/DIV·
· · · ·
CONTROLS
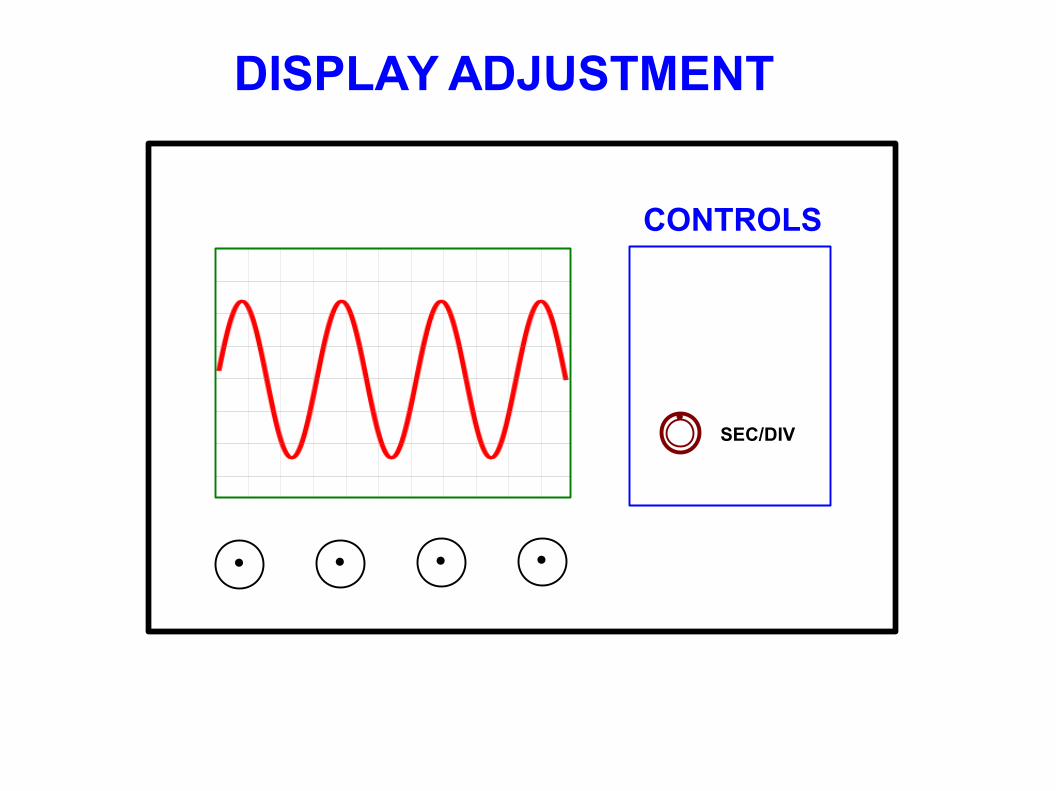
DISPLAY ADJUSTMENT
SEC/DIV·

· · · ·
CONTROLS
DISPLAY ADJUSTMENT
SEC/DIV·
DISPLAY
· · · ·
CONTROLS
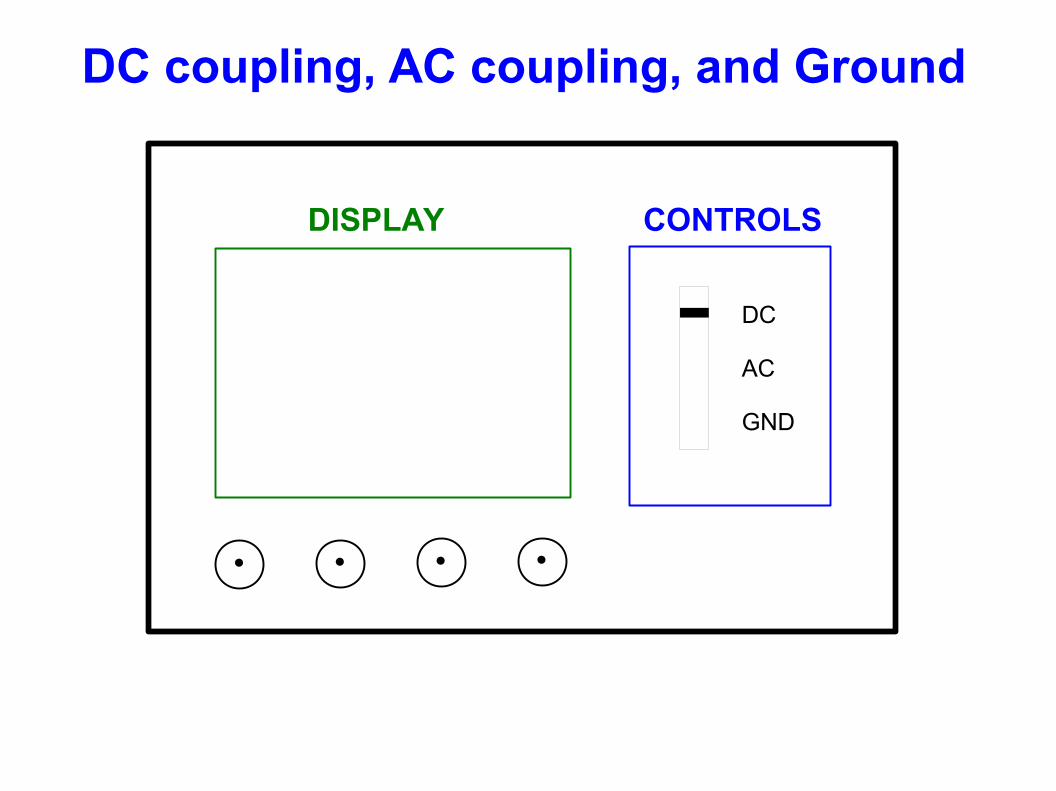
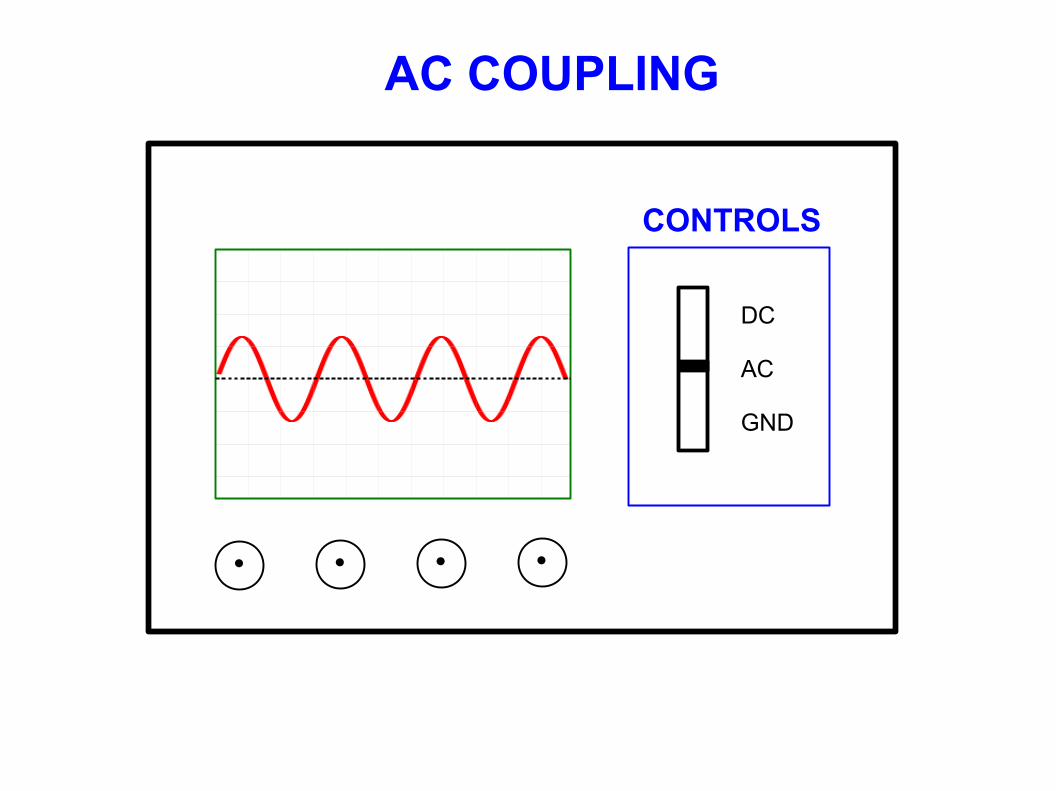
DC coupling, AC coupling, and Ground
DC
AC
GND
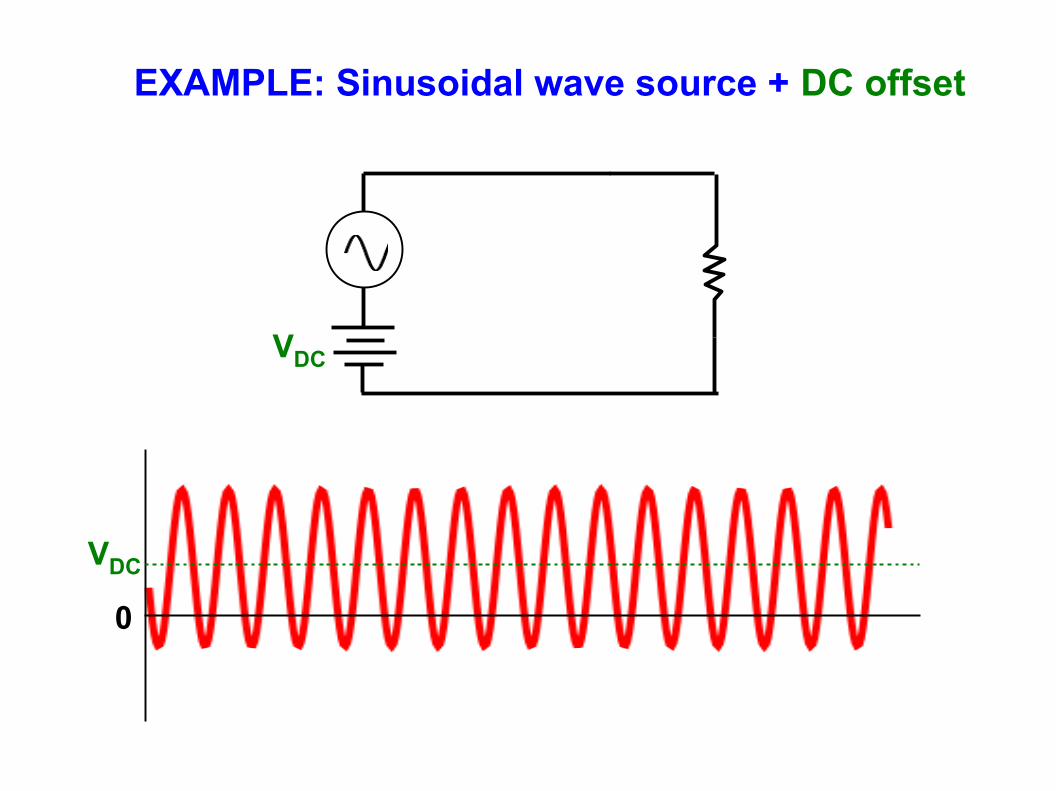
EXAMPLE: Sinusoidal wave source + DC offset
VDC
VDC
0
· · · ·
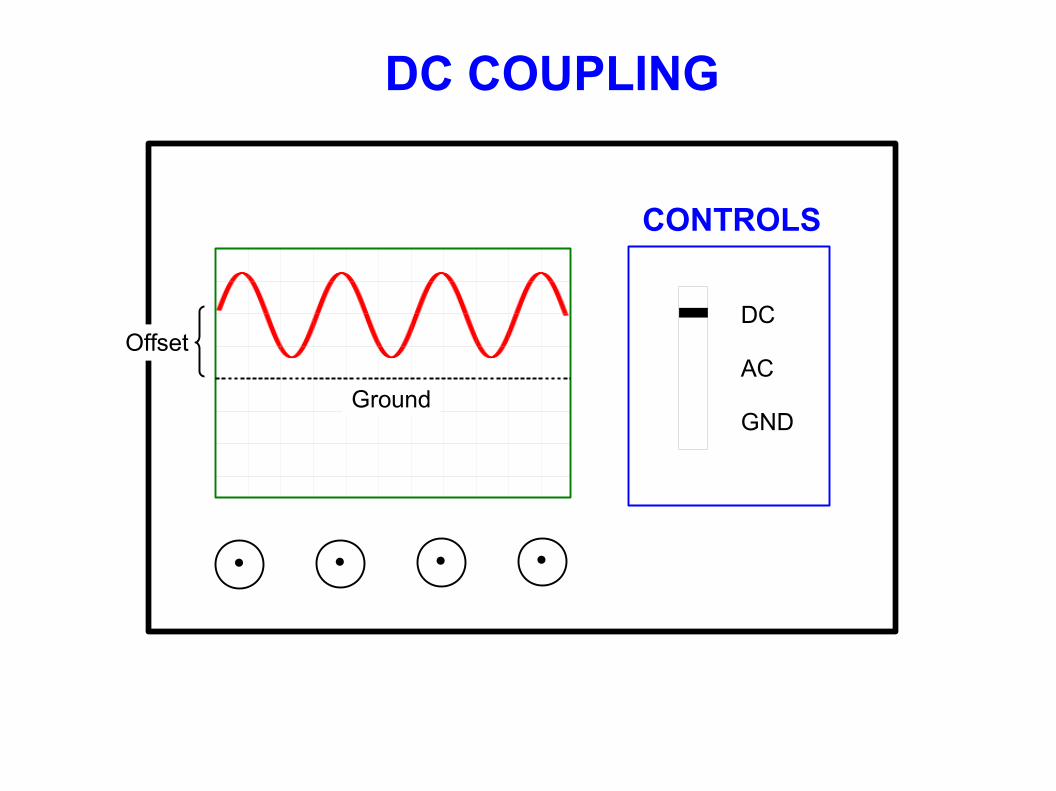
DC COUPLING
Ground
Offset
CONTROLS
DC
AC
GND
· · · ·
CONTROLS
DC
AC
GND
AC COUPLING
· · · ·
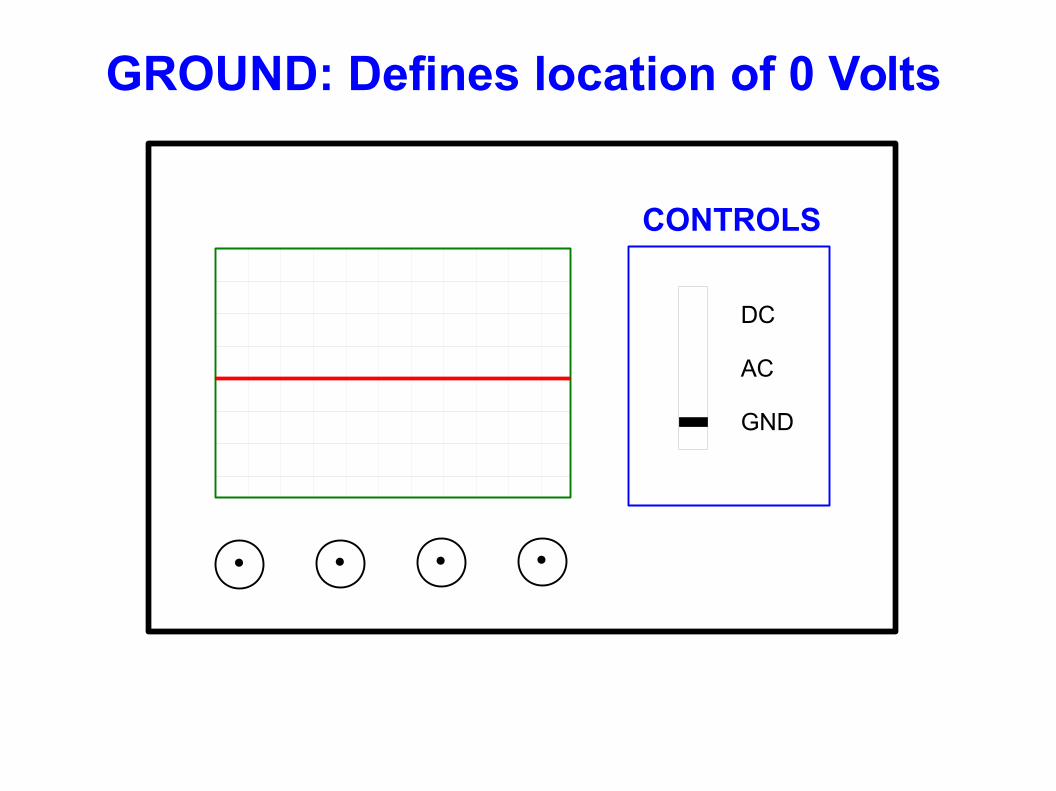
GROUND: Defines location of 0 Volts
CONTROLS
DC
AC
GND
· · · ·
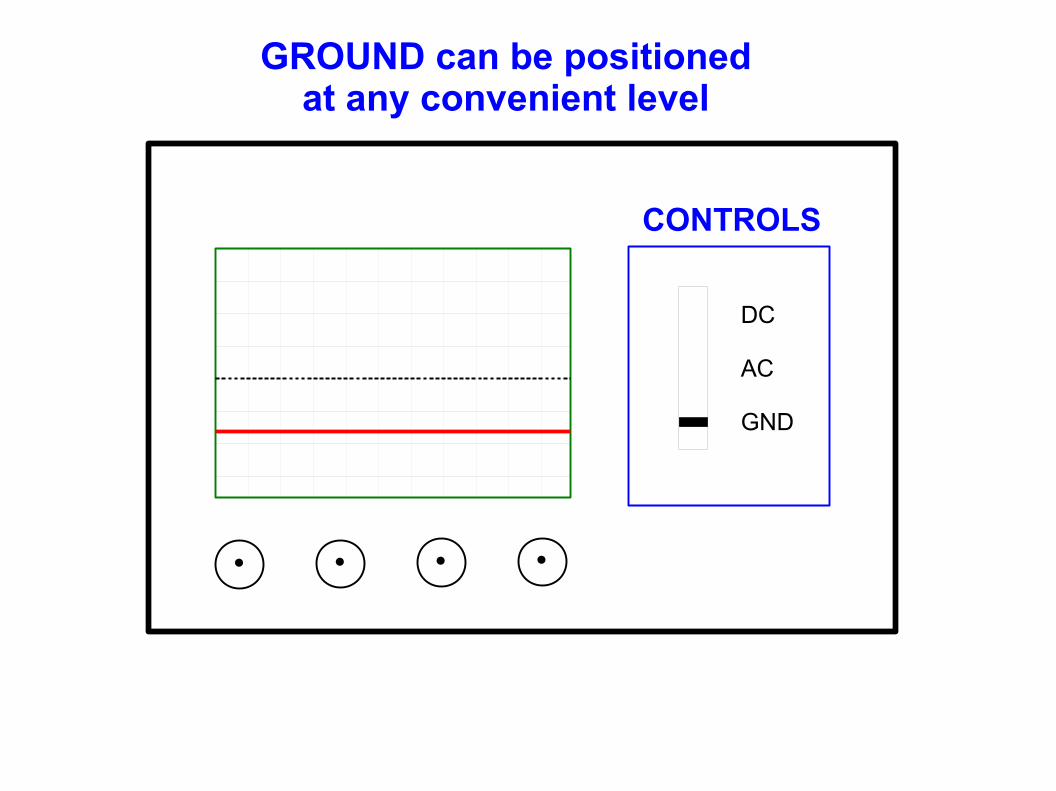
GROUND can be positionedat any convenient level
CONTROLS
DC
AC
GND
· · · ·
Ground
CONTROLS
DC
AC
GND
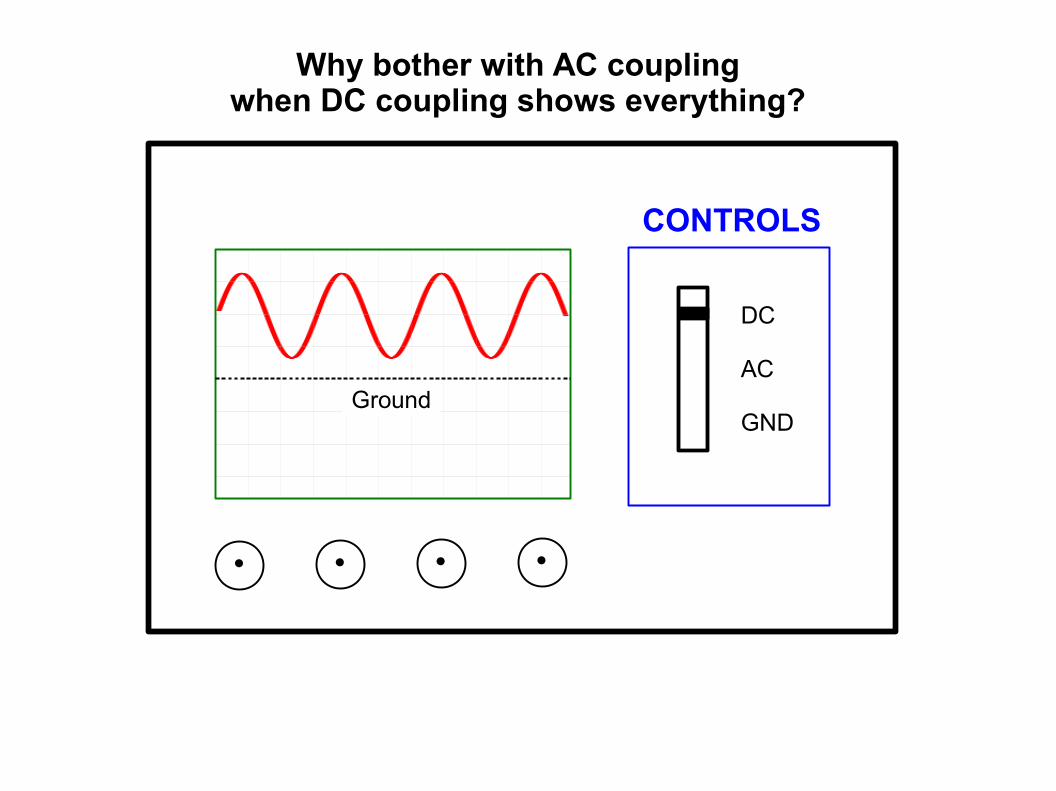
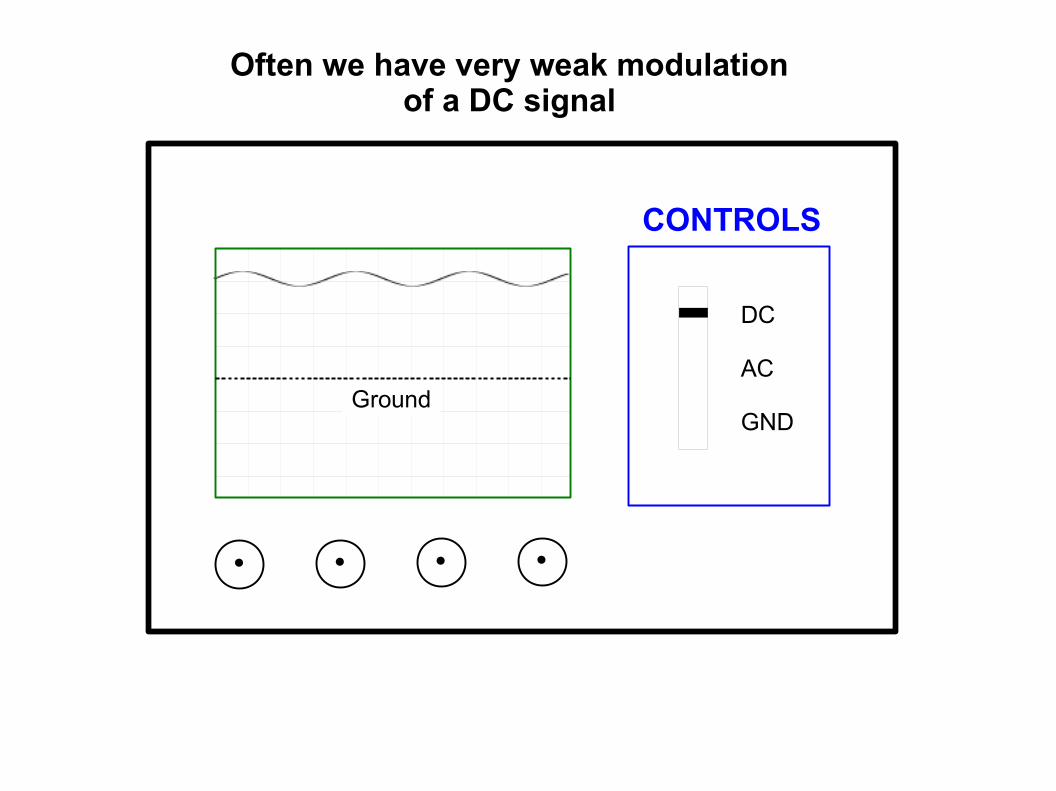
Why bother with AC couplingwhen DC coupling shows everything?
· · · ·
Often we have very weak modulationof a DC signal
Ground
CONTROLS
DC
AC
GND
· · · ·
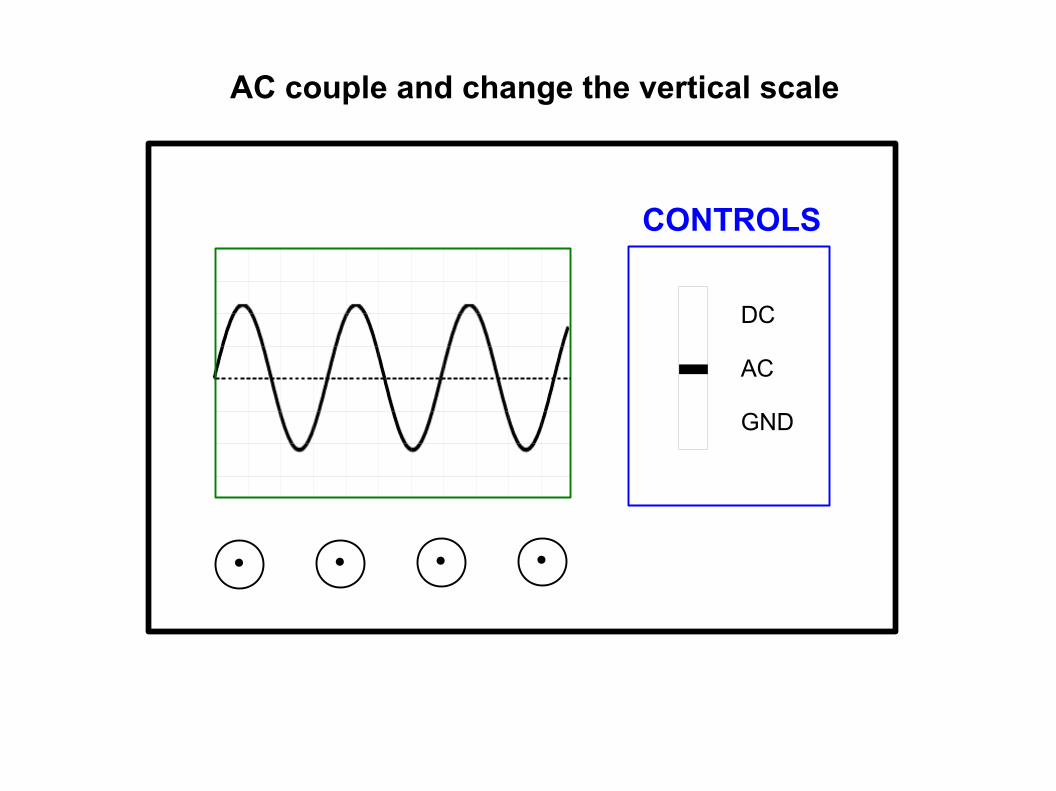
AC couple and change the vertical scale
CONTROLS
DC
AC
GND
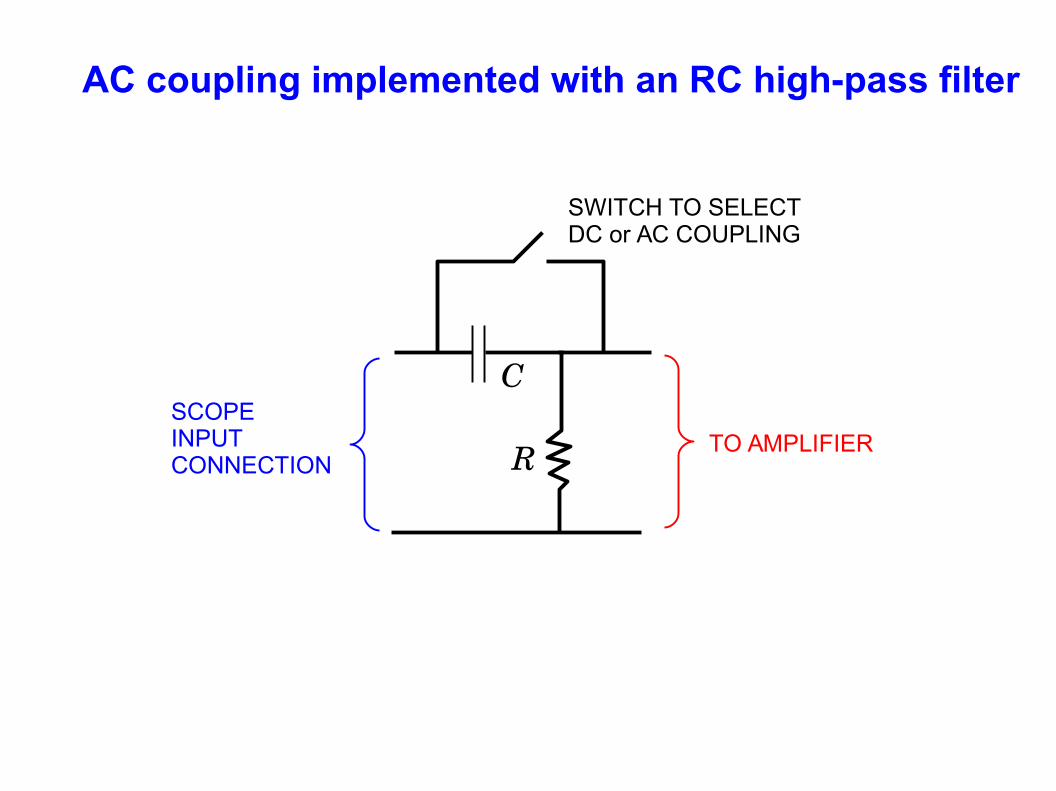
AC coupling implemented with an RC high-pass filter
C
R TO AMPLIFIERSCOPEINPUTCONNECTION
SWITCH TO SELECTDC or AC COUPLING
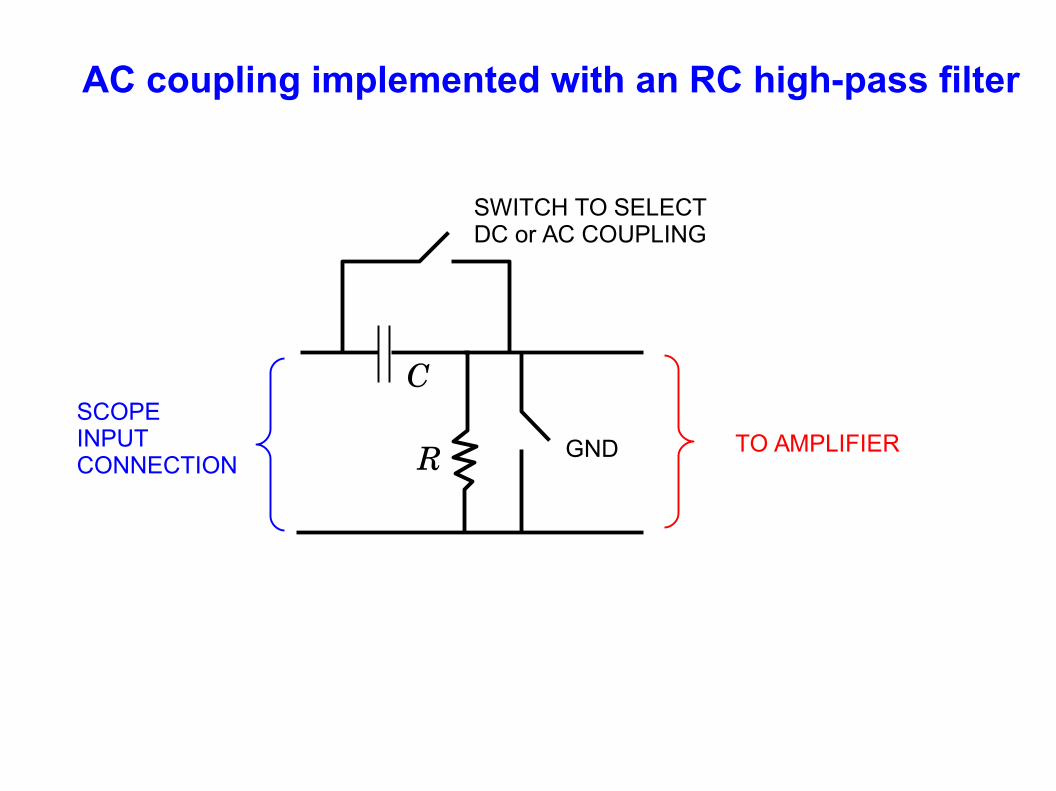
AC coupling implemented with an RC high-pass filter
C
R TO AMPLIFIERSCOPEINPUTCONNECTION
SWITCH TO SELECTDC or AC COUPLING
GND
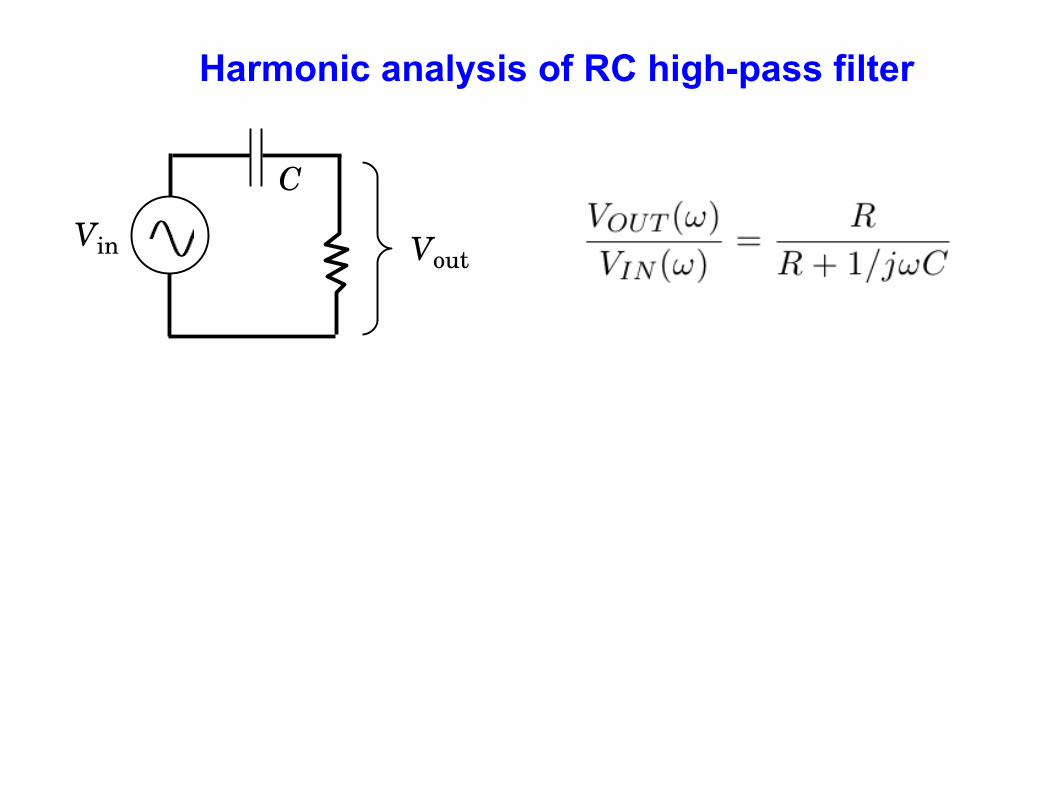
Harmonic analysis of RC high-pass filter
C
Vin Vout
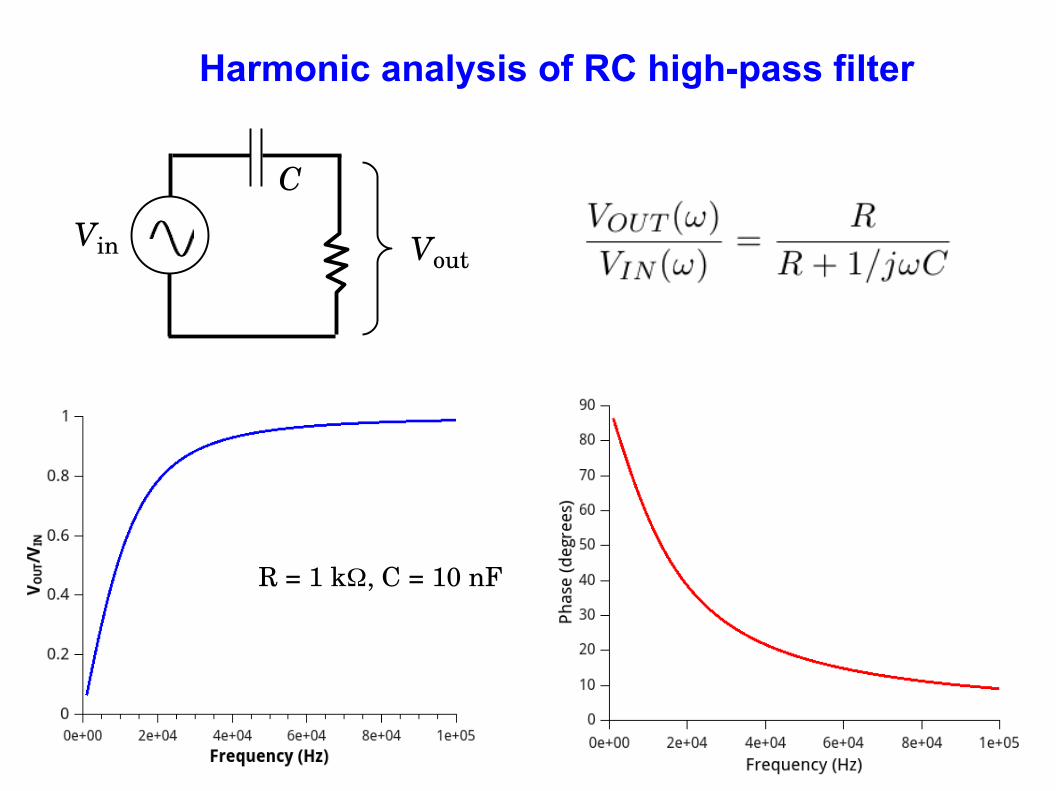
Harmonic analysis of RC high-pass filter
C
Vin Vout
R = 1 kW, C = 10 nF
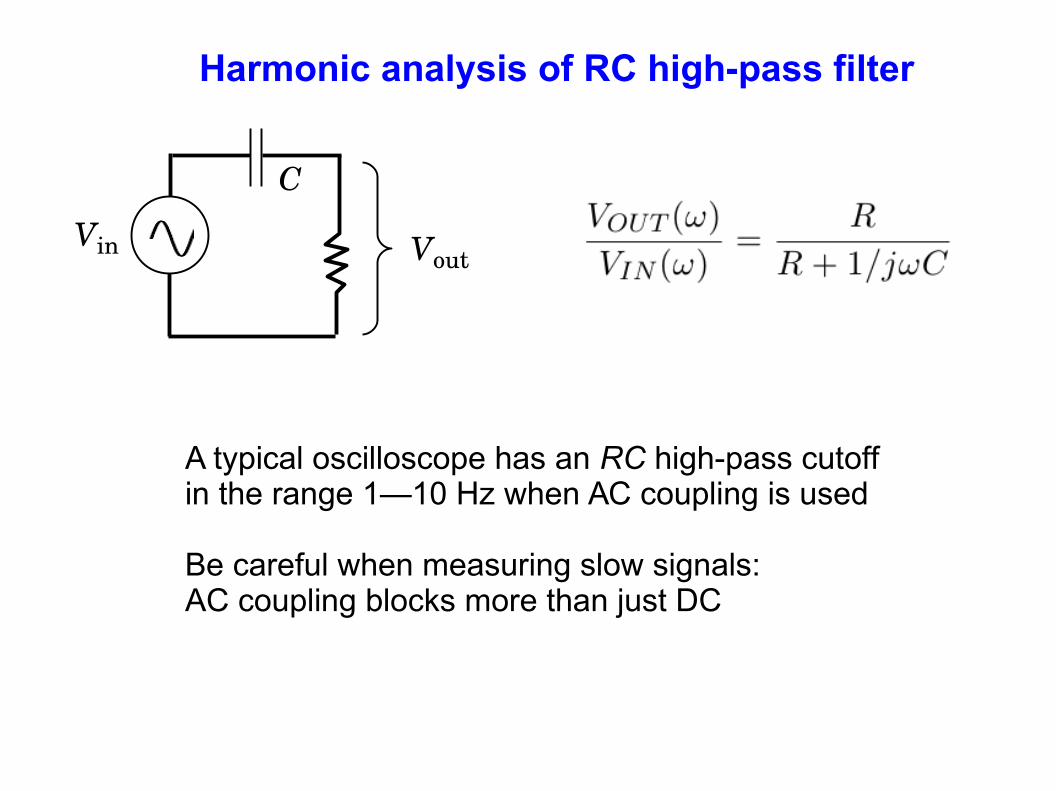
Harmonic analysis of RC high-pass filter
C
Vin Vout
A typical oscilloscope has an RC high-pass cutoff in the range 1—10 Hz when AC coupling is used
Be careful when measuring slow signals:AC coupling blocks more than just DC
DISPLAY
· · · ·
CONTROLS
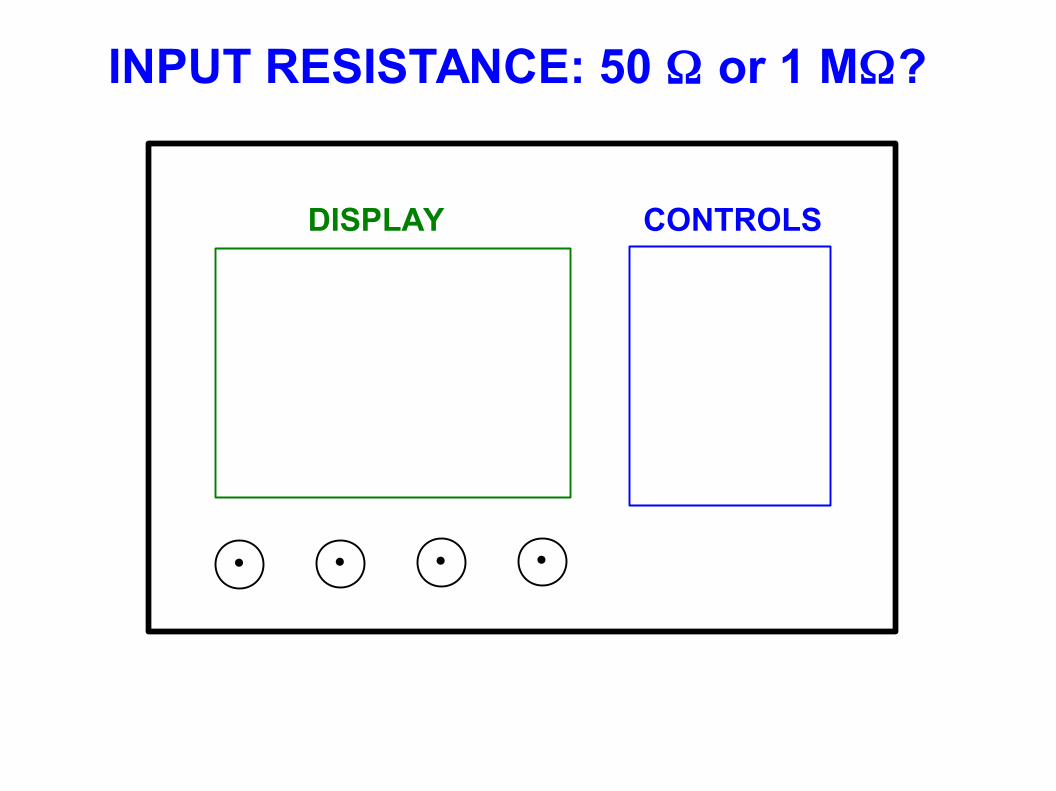
INPUT RESISTANCE: 50 W or 1 MW?
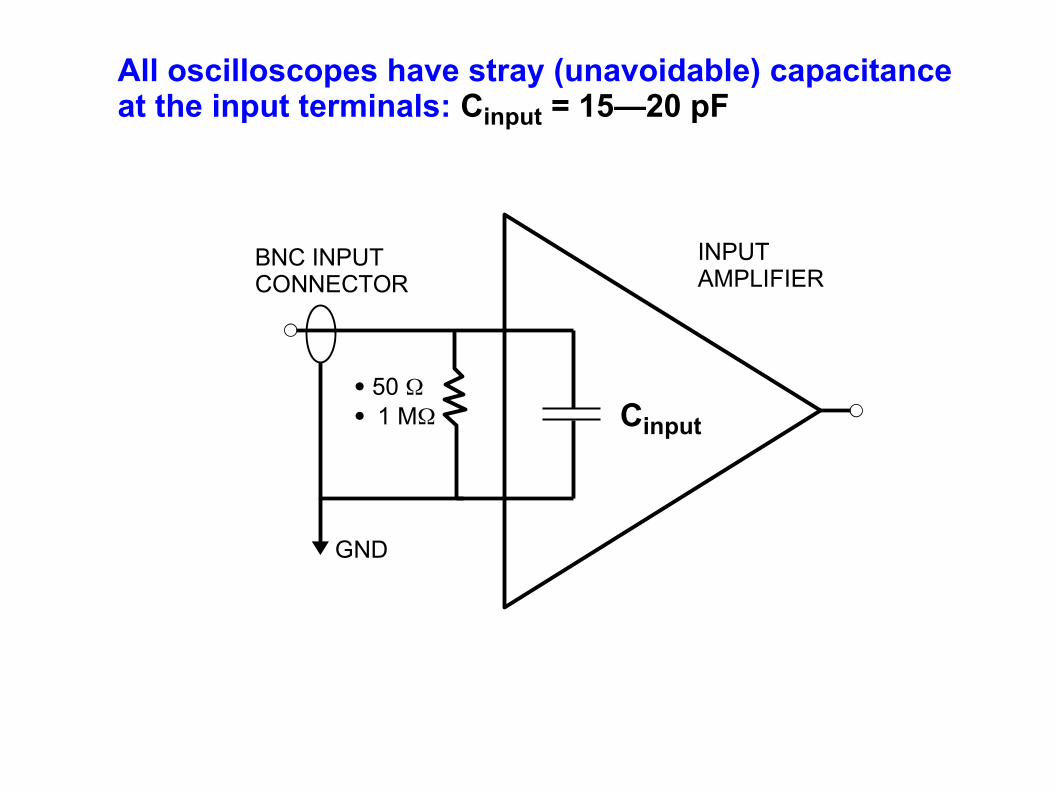
All oscilloscopes have stray (unavoidable) capacitanceat the input terminals: Cinput = 15—20 pF
Cinput
INPUTAMPLIFIER
BNC INPUTCONNECTOR
GND
· 50 W· 1 MW
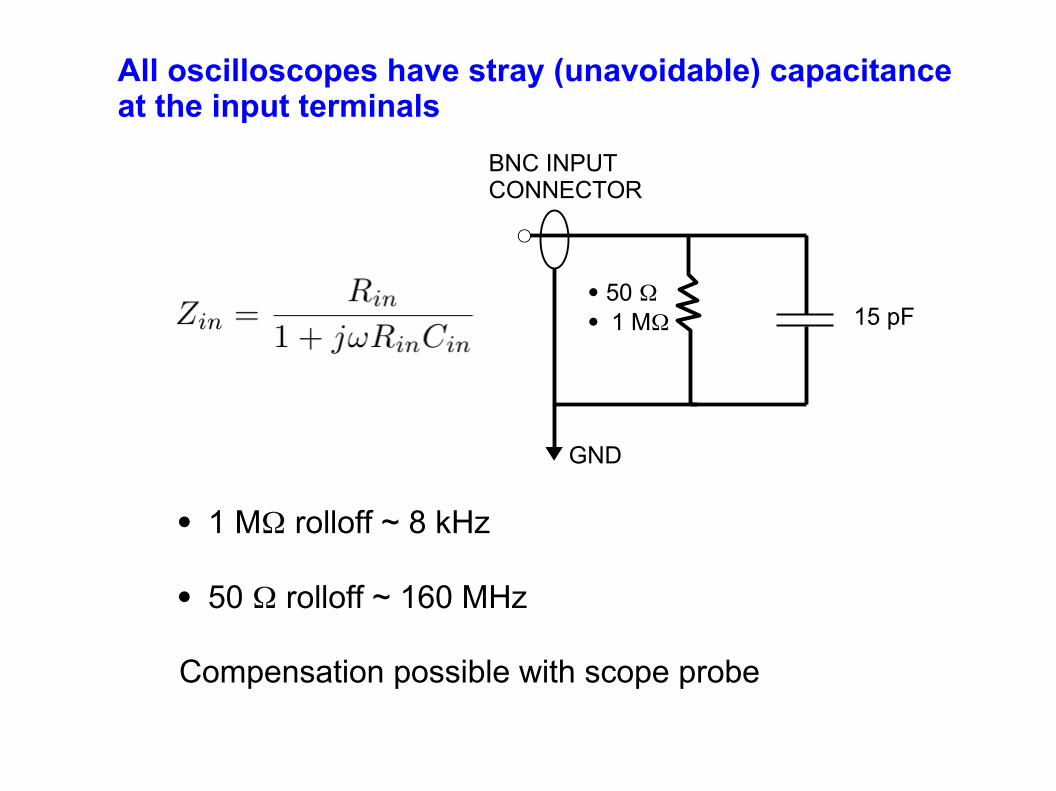
All oscilloscopes have stray (unavoidable) capacitanceat the input terminals
15 pF
BNC INPUTCONNECTOR
GND
· 50 W· 1 MW
· 1 MW rolloff ~ 8 kHz
· 50 W rolloff ~ 160 MHz
Compensation possible with scope probe
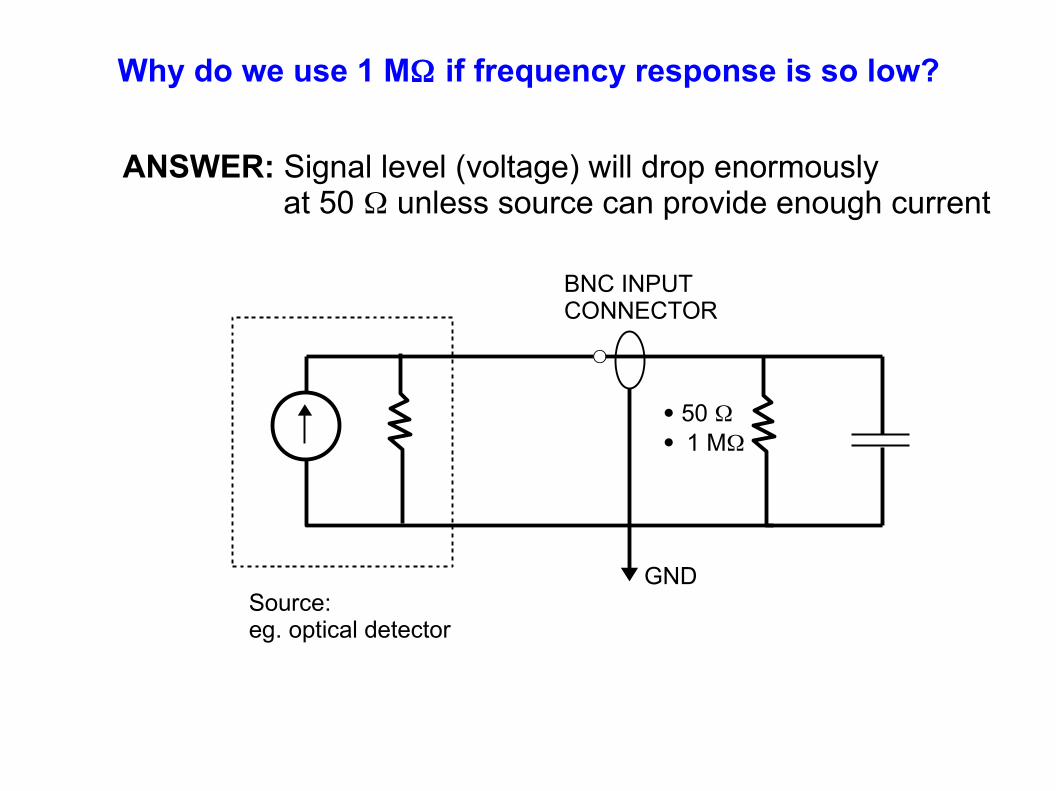
Why do we use 1 MW if frequency response is so low?
BNC INPUTCONNECTOR
GND
· 50 W· 1 MW
ANSWER: Signal level (voltage) will drop enormously at 50 W unless source can provide enough current
Source:eg. optical detector
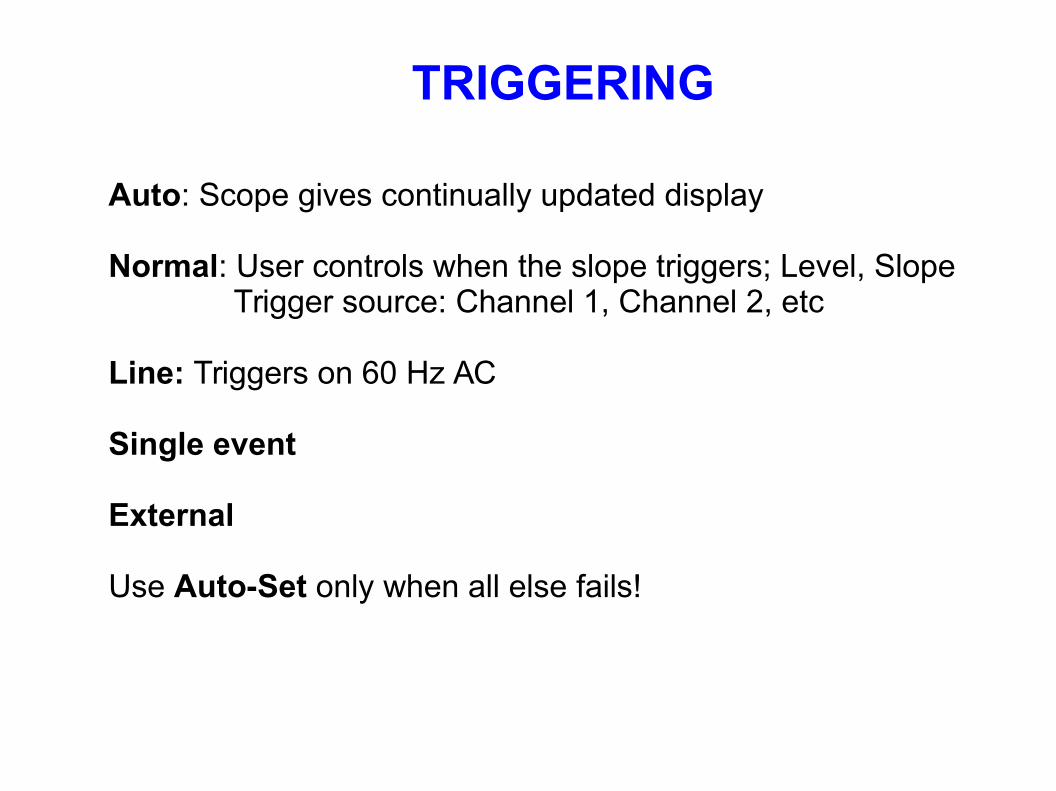
Auto: Scope gives continually updated display
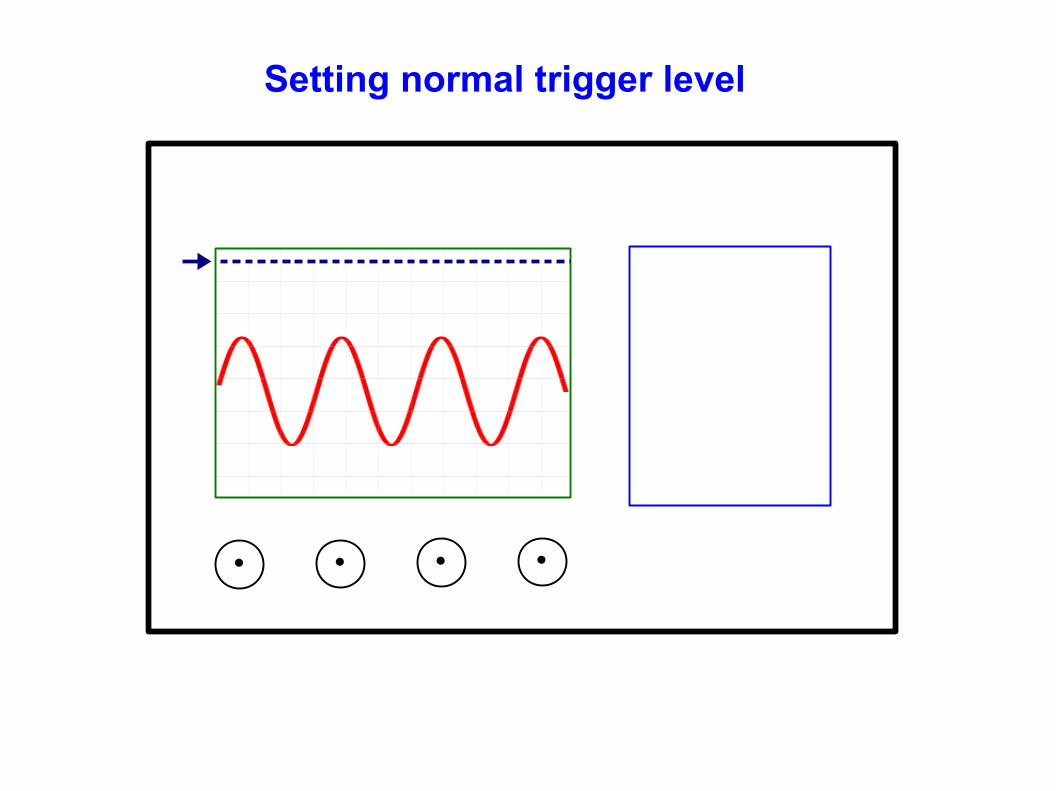
Normal: User controls when the slope triggers; Level, Slope Trigger source: Channel 1, Channel 2, etc
Line: Triggers on 60 Hz AC
Single event
External
Use Auto-Set only when all else fails!
TRIGGERING
· · · ·
Setting normal trigger level
· · · ·
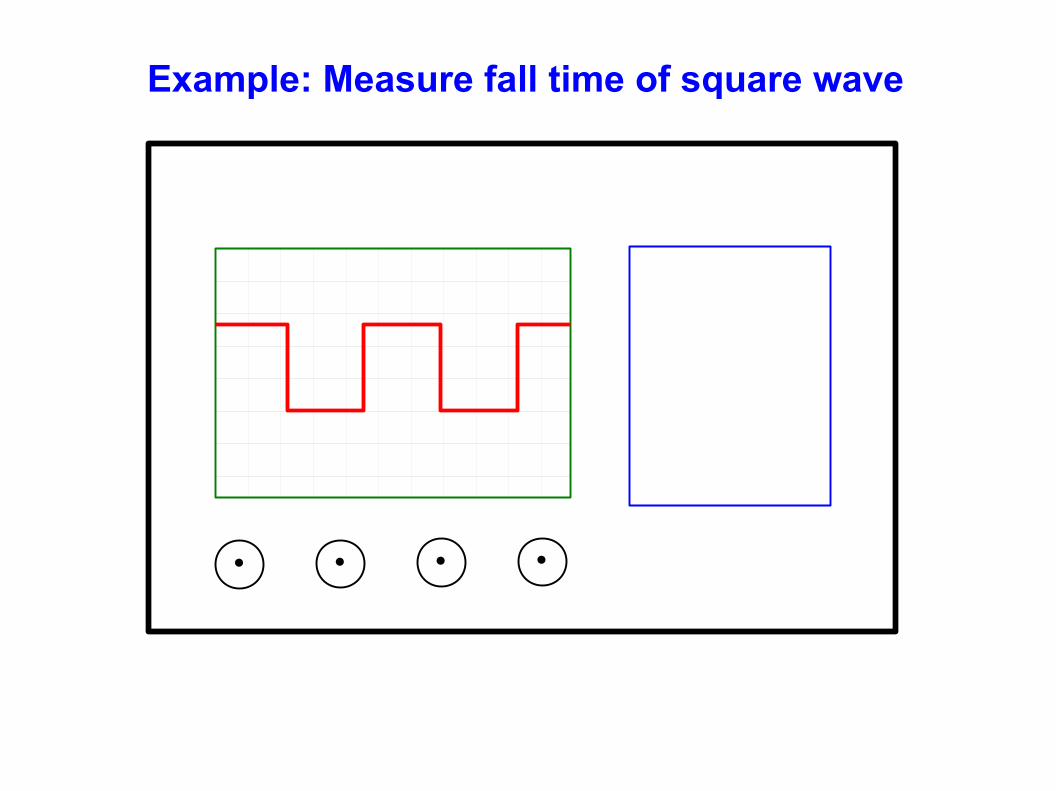
Example: Measure fall time of square wave
· · · ·
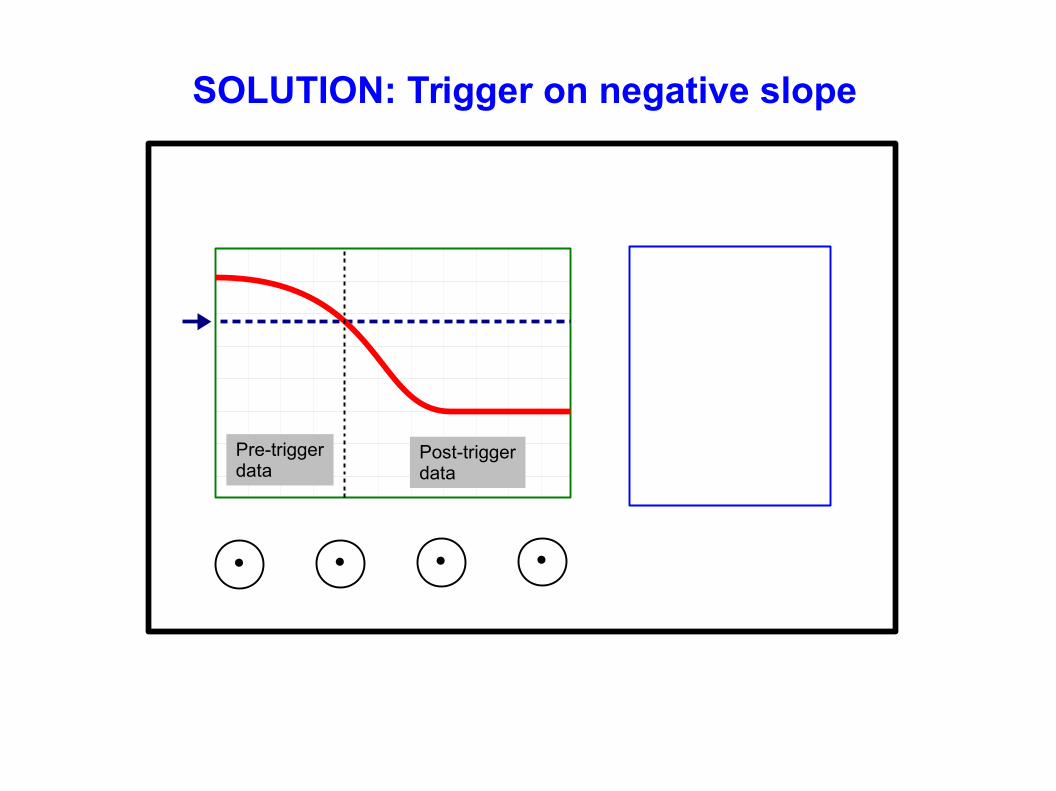
SOLUTION: Trigger on negative slope
Pre-triggerdata
Post-triggerdata
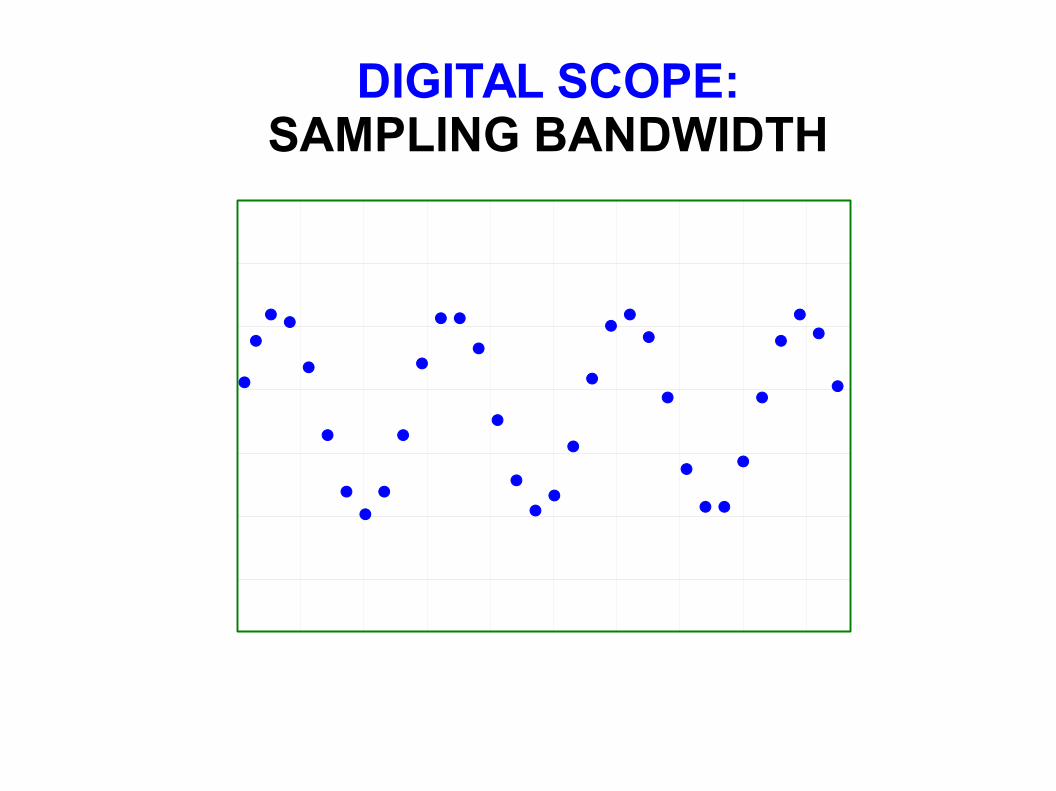
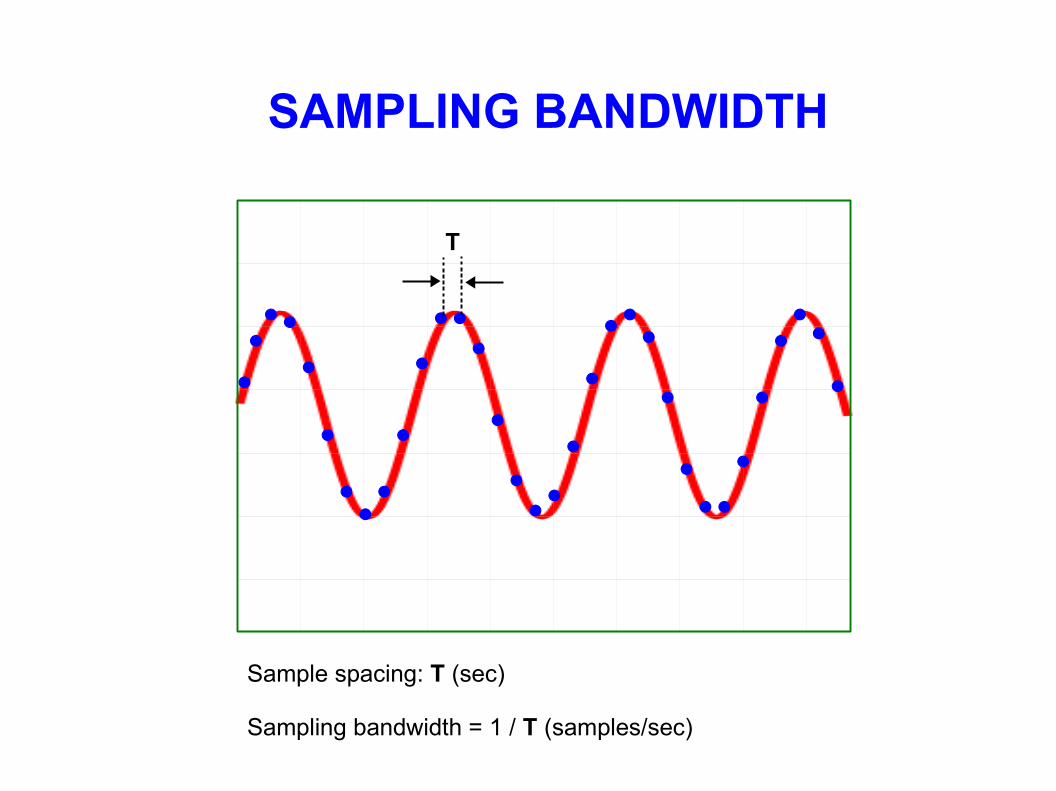
DIGITAL SCOPE:SAMPLING BANDWIDTH
·
·· ·
·
·
···
·
·
· ··
·
·· ·
·
·
· · ·
·
·· ·
·
·
···
·
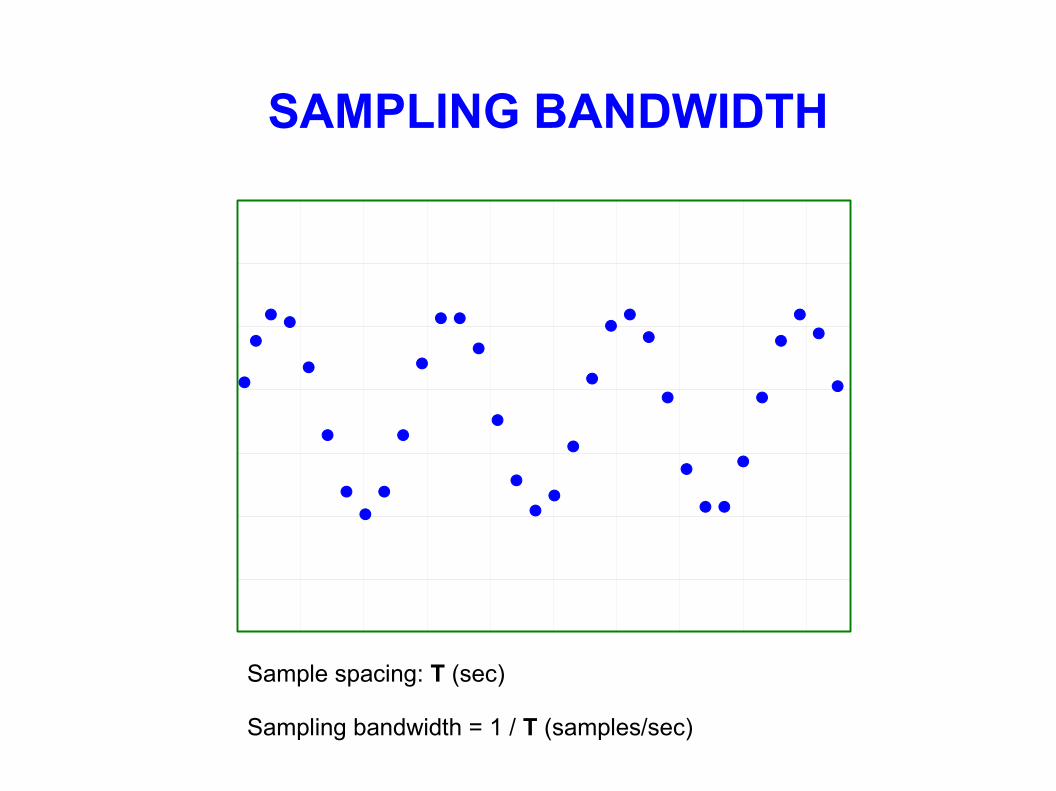
SAMPLING BANDWIDTH
·
·· ·
·
·
···
·
·
· ··
·
·· ·
·
·
· · ·
·
·· ·
·
·
···
·
Sample spacing: T (sec) Sampling bandwidth = 1 / T (samples/sec)
T
SAMPLING BANDWIDTH
·
·· ·
·
·
···
·
·
· ··
·
·· ·
·
·
· · ·
·
·· ·
·
·
···
·
Sample spacing: T (sec) Sampling bandwidth = 1 / T (samples/sec)
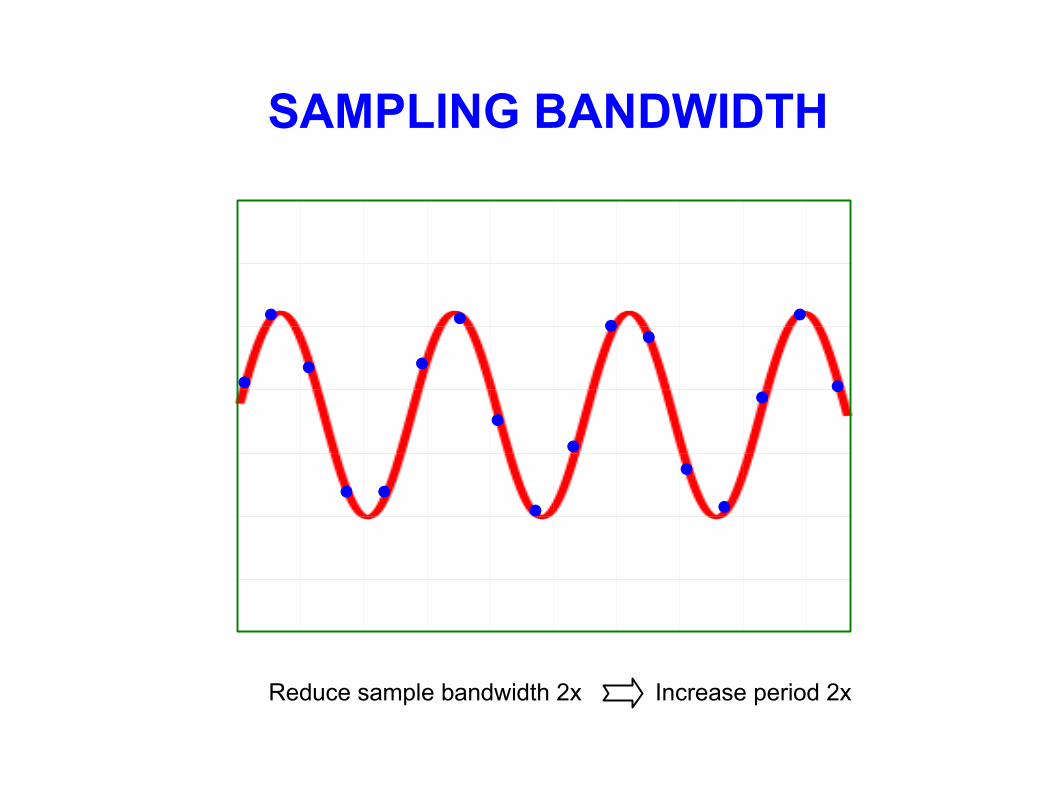
SAMPLING BANDWIDTH
·
·
·
· ·
·
·
·
·
·
· ·
··
·
·
·
Reduce sample bandwidth 2x Increase period 2x
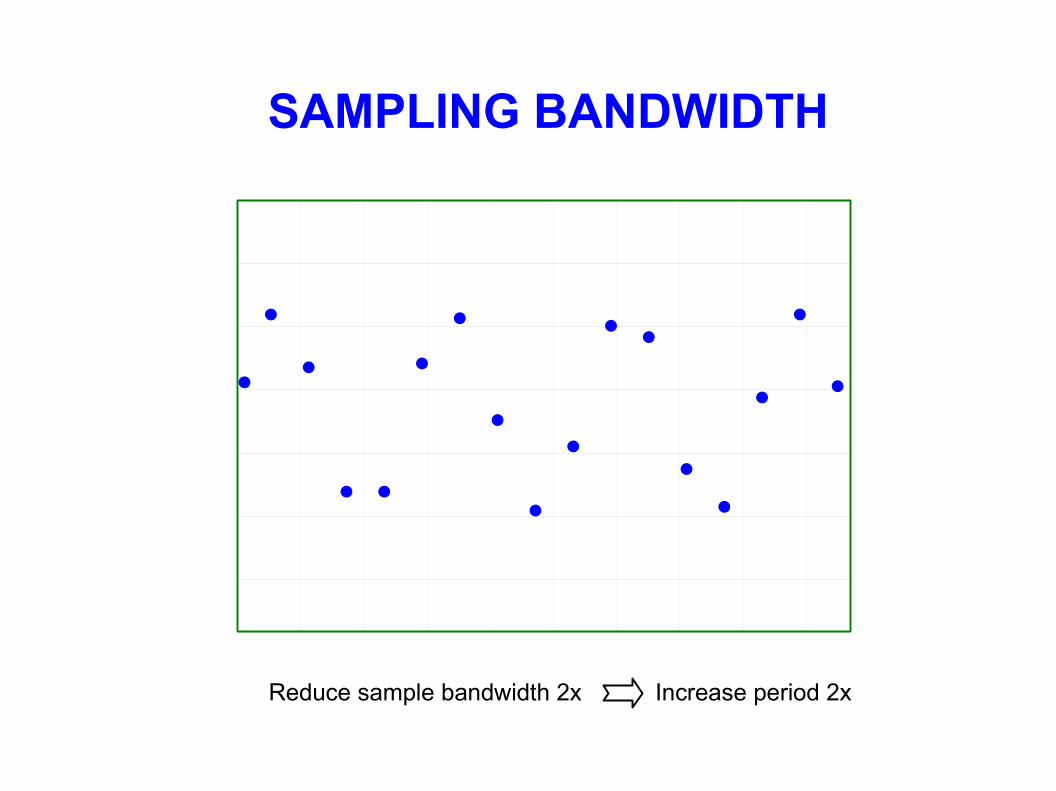
SAMPLING BANDWIDTH
·
·
·
· ·
·
·
·
·
·
· ·
··
·
·
·
Reduce sample bandwidth 2x Increase period 2x
·································
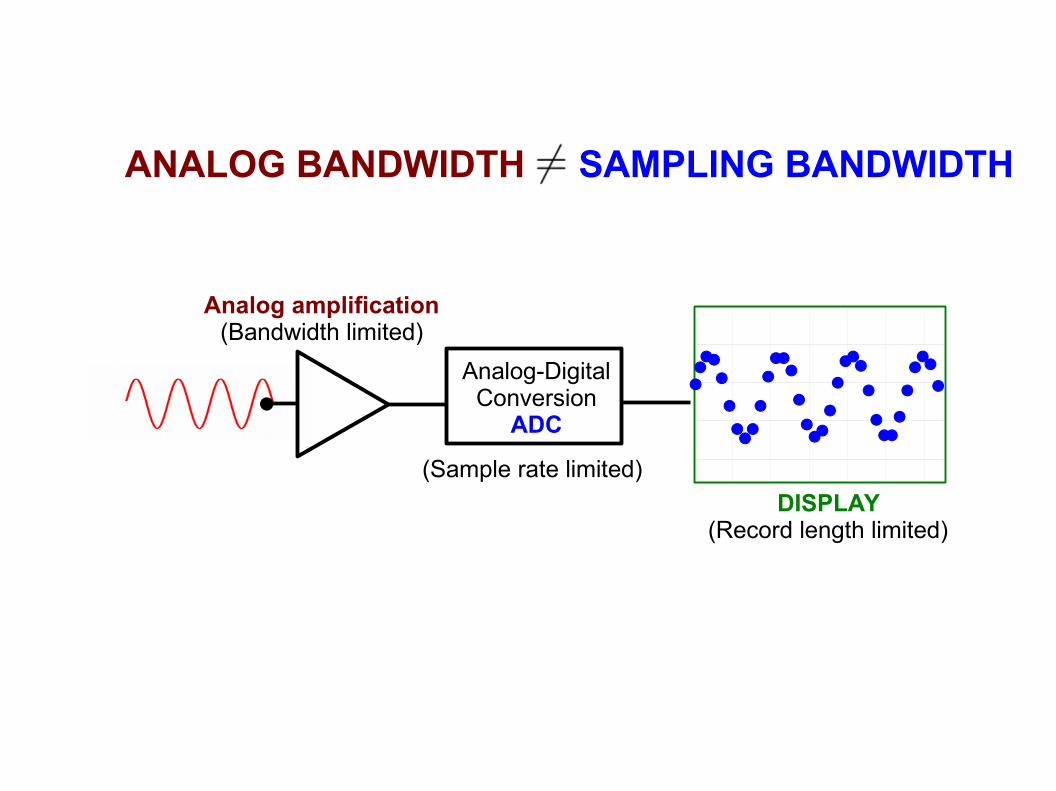
Analog amplification(Bandwidth limited)
Analog-DigitalConversion
ADC
DISPLAY (Record length limited)
(Sample rate limited)
ANALOG BANDWIDTH SAMPLING BANDWIDTH
·································
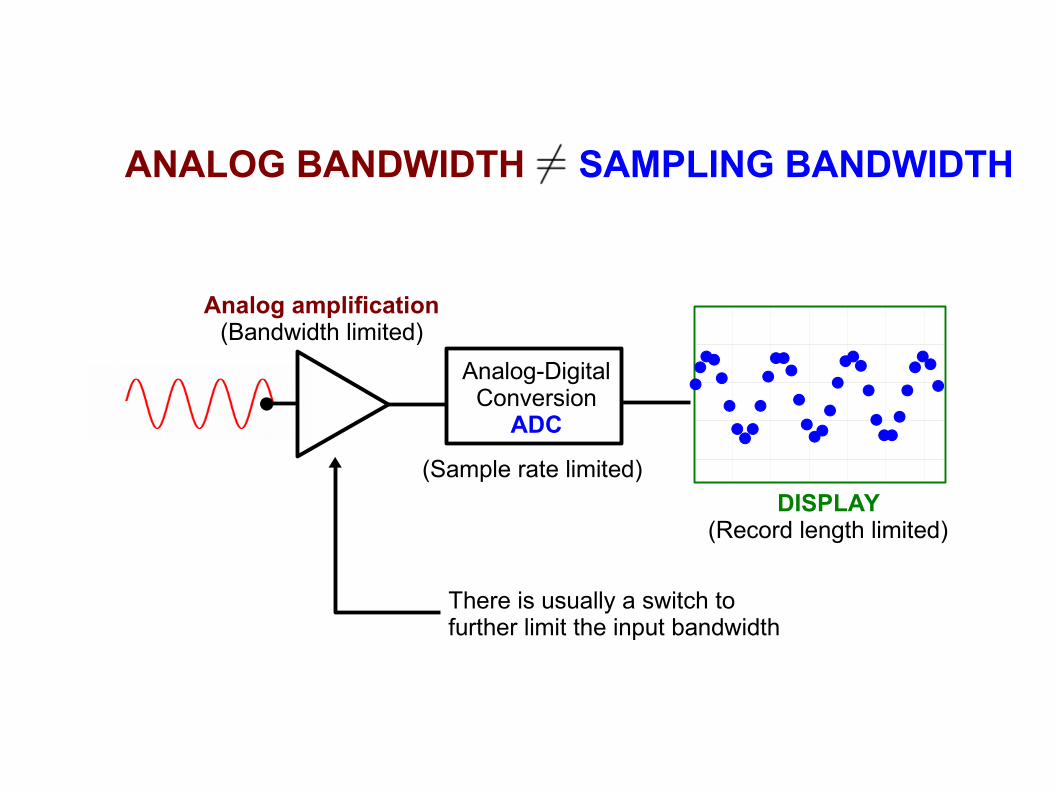
Analog amplification(Bandwidth limited)
Analog-DigitalConversion
ADC
DISPLAY (Record length limited)
(Sample rate limited)
ANALOG BANDWIDTH SAMPLING BANDWIDTH
There is usually a switch tofurther limit the input bandwidth
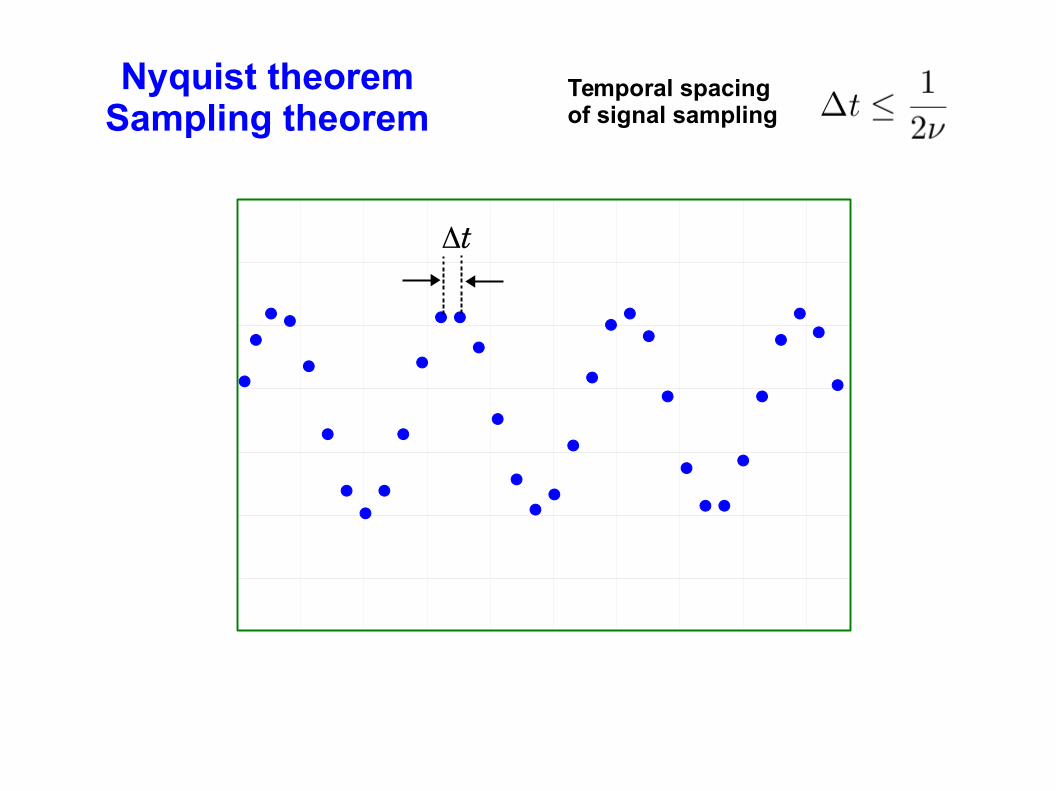
Nyquist theoremSampling theorem
Temporal spacing of signal sampling
·
·· ·
·
·
···
·
·
· ··
·
·· ·
·
·
· · ·
·
·· ·
·
·
···
·
Dt
Nyquist theoremSampling theorem
Temporal spacing of signal sampling
·
·
·
·
·Dt
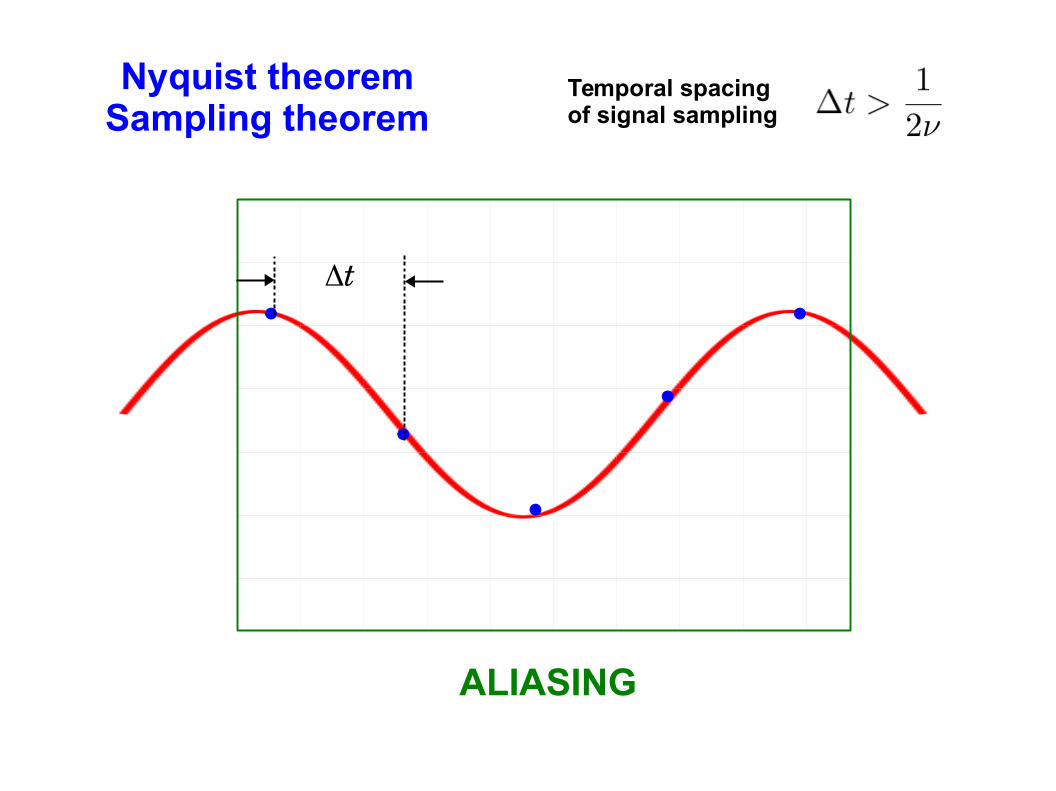
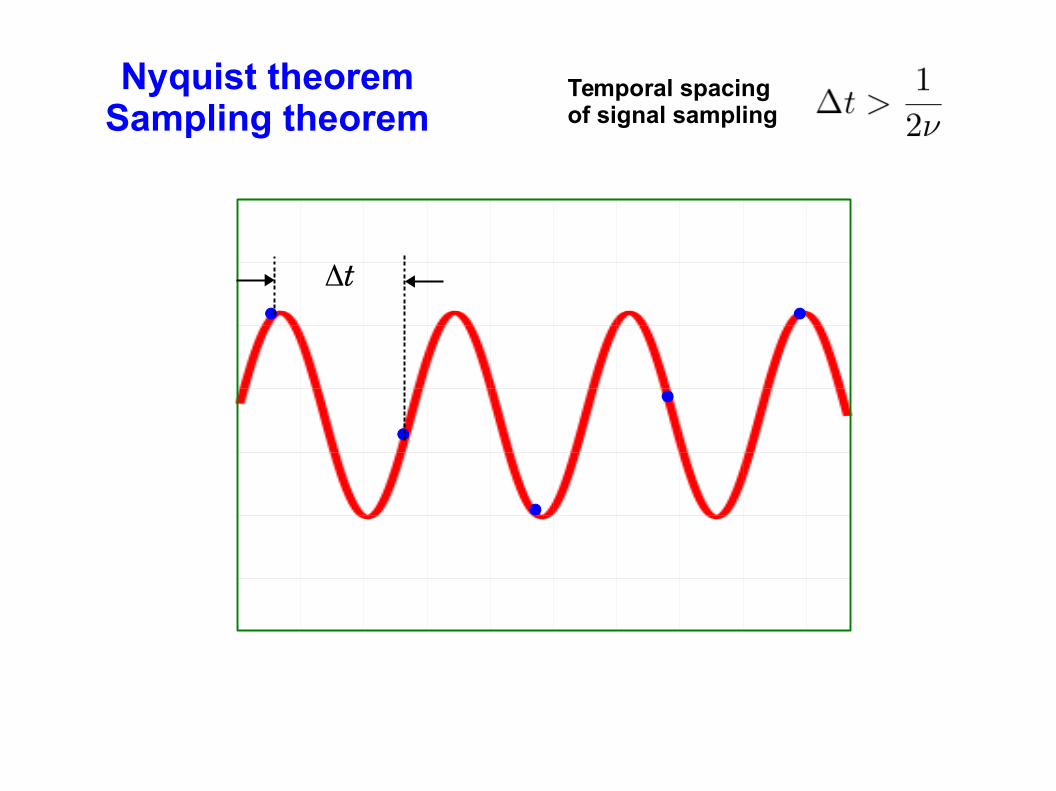
Nyquist theoremSampling theorem
Temporal spacing of signal sampling
·
·
·
·
·
ALIASING
Dt
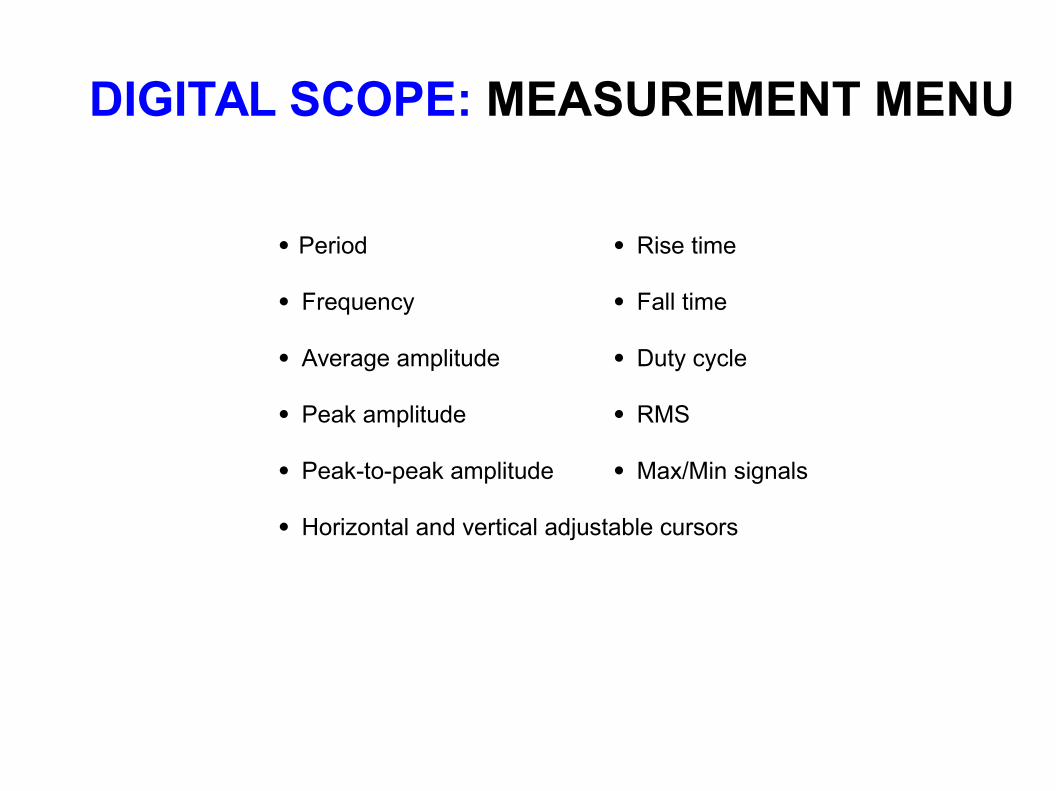
DIGITAL SCOPE: MEASUREMENT MENU
· Period · Rise time
· Frequency · Fall time
· Average amplitude · Duty cycle
· Peak amplitude · RMS
· Peak-to-peak amplitude · Max/Min signals
· Horizontal and vertical adjustable cursors
DIGITAL SCOPE: MATH MENU
Channel addition
Channel subtraction
Fast Fourier Transform (FFT):Observe frequency spectrum of time signal