Embed Size (px)
Citation preview

WELCOME TO OUR WORLD.

1986: 73M
2016: 172M
HUGE ADMISSIONS GROWTH OVER THE LAST 30 YEARS


WHY CINEMA.

A STELLAR PERFORMANCE

EMOTIONALLY CONNECTED

UNDIVIDED ATTENTION

MULTIPLE CROSS-MEDIA TOUCHPOINTS

THE CINEMA
MARKETPLACE.
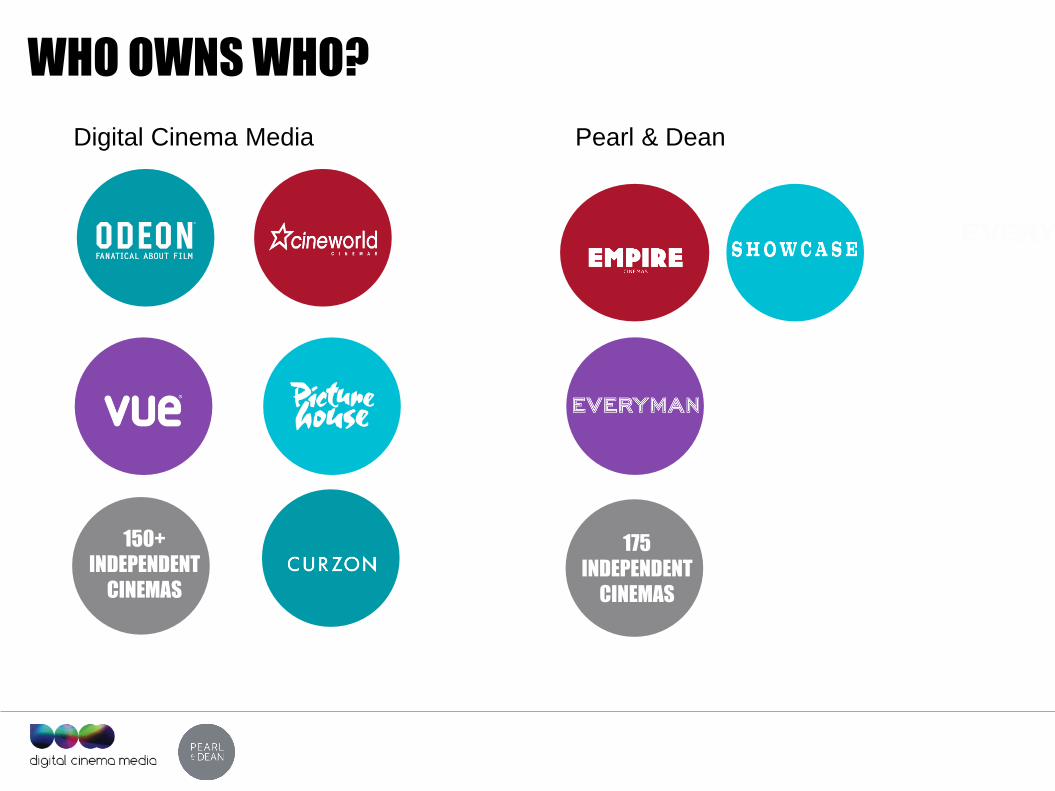
150+
INDEPENDENT
CINEMAS
175
INDEPENDENT
CINEMAS
WHO OWNS WHO?
Pearl & Dean Digital Cinema Media

753 SITES CA. 4,092 SCREENS CA. 800,000 SEATS
UK CINEMA - THE NUMBERS
Source: IHS Screen Digest
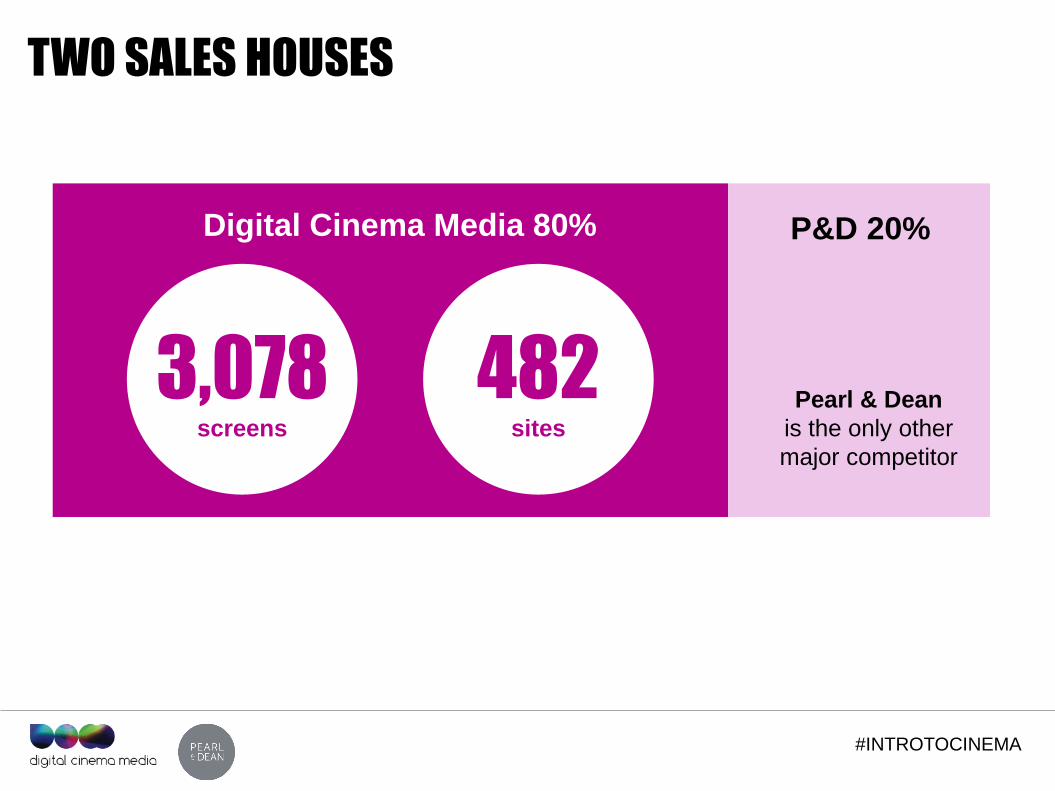
TWO SALES HOUSES
3,078 screens
482 sites
P&D 20% Digital Cinema Media 80%
Pearl & Dean
is the only other
major competitor
#INTROTOCINEMA

UNDERSTANDING CINEMAGOERS

FAME 4+
4,000 RESPONDENTS PREVIEW TO REVIEW FILM TOUCHPOINTS
Source: CAA FAME 2014

MULTIBASED TO TGI

“ “


Attend 3 Average group size 45% Friends 37% As a couple
Admissions & frequency 75.8m admissions per year 44% of all UK admissions 7.5 Visits per year vs. ave. of 6
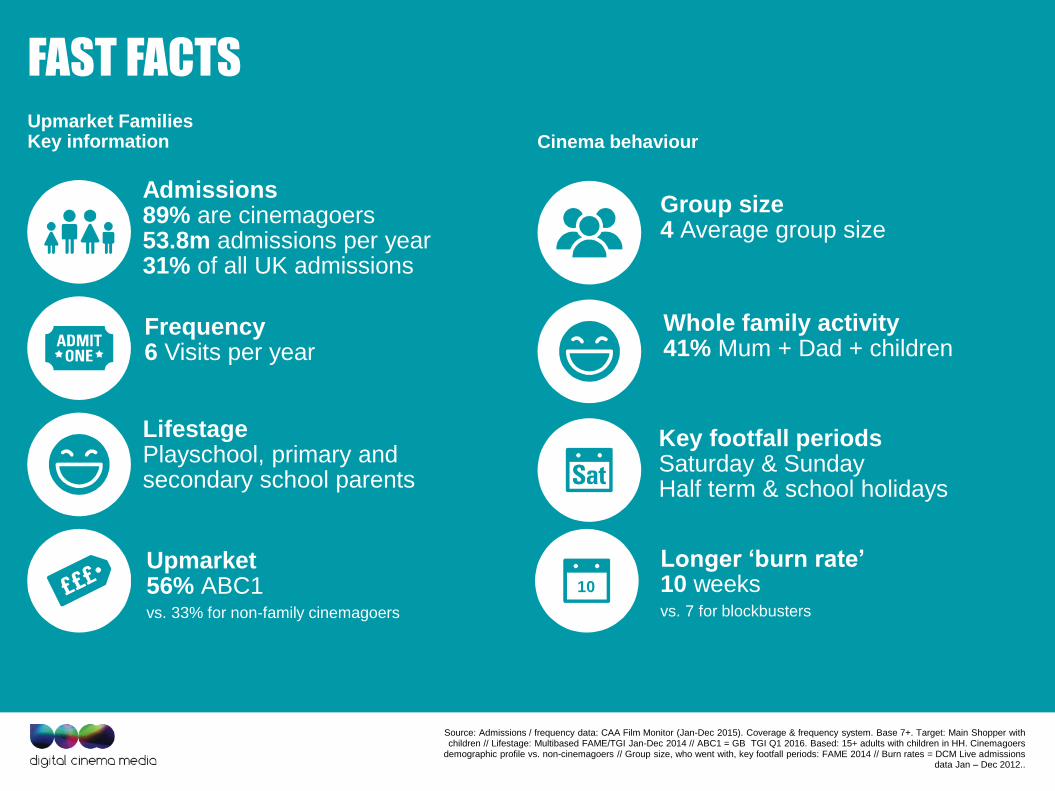
FAST FACTS
Audience 91% are cinemagoers 50/50 Male/Female
Technology 95% Own a smartphone 76% Heavy social media
Source: Admissions / frequency data: CAA Film Monitor (Jan-Dec 2015). Coverage & frequency system. Base 7+. Target 16-34 Year Olds Lifestage: Multibased FAME/TGI Jan-Dec 2014 smartphone ownership, social network access at least once a day: TGI Q1 2016. cinemagoers vs.
non-cinemagoers
The Millennials Key information Cinema behaviour
Upmarket 55% ABC1
Regional skew 39% London SE
Key footfall periods Opening week + Wednesday, Friday, Saturday
Foyer Average dwell time 17 minutes

“ “

Source: Admissions / frequency data: CAA Film Monitor (Jan-Dec 2015). Coverage & frequency system. Base 7+. Target: Main Shopper with children // Lifestage: Multibased FAME/TGI Jan-Dec 2014 // ABC1 = GB TGI Q1 2016. Based: 15+ adults with children in HH. Cinemagoers
demographic profile vs. non-cinemagoers // Group size, who went with, key footfall periods: FAME 2014 // Burn rates = DCM Live admissions data Jan – Dec 2012..
Group size 4 Average group size
Frequency 6 Visits per year
Lifestage Playschool, primary and secondary school parents
FAST FACTS
Longer ‘burn rate’ 10 weeks vs. 7 for blockbusters
Whole family activity 41% Mum + Dad + children
Admissions 89% are cinemagoers 53.8m admissions per year 31% of all UK admissions
Key footfall periods Saturday & Sunday Half term & school holidays
Upmarket 56% ABC1 vs. 33% for non-family cinemagoers
Upmarket Families Key information Cinema behaviour
10

“ “
THE WEEKENDERS QUALITY BONDING TIME
AN EXPERIENCE TAKES CHILDREN ‘OFF-LINE’
CREATES MEMORIES


Source: Admissions / frequency data: CAA Film Monitor (Jan-Dec 2012). Coverage & frequency system. Base 7+. Target: Adults with children // Lifestage: Multibased FAME/TGI Jan-Dec 2012 // ABC1 = GB TGI 2013. Based: 15+ adults with children in HH. Cinemagoers demographic profile
vs. non-cinemagoers // Group size, who went with, key footfall periods: FAME 2012 // Burn rates = DCM Live admissions data Jan – Dec 2012..
Group size 4 Average group size
Frequency 5.5 Visits per year
Lifestage Playschool, primary and secondary school parents
FAST FACTS
Longer ‘burn rate’ 10 weeks vs. 7 for blockbusters
Whole family activity 42% Mum + Dad + children
Admissions 86% are cinemagoers 75.6m admissions per year 45% of all UK admissions
Key footfall periods Saturday & Sunday Half term & school holidays
Upmarket 55% ABC1 vs. 37% for non-family cinemagoers
We’re The Weekenders Key information Cinema behaviour

FILM MONITOR 7+
27,000 RESPONDENTS FILM-AUDINCE PROFILE
FUTURE PREDICTOR
Source: CAA FAME 2014
IT WORKS.
THE POWER OF CINEMA.

BUILDING BOX OFFICE BRANDS Our partnership with Millward Brown CrossMedia team
Evaluate cinema’s role for brands in a wider multi-media mix • Rapidly being seen as global
industry standard in multi-media
brand measurement
• Designed to evaluate how paid
marketing activities affect equity
measures such as awareness,
engagement and consideration
• Uses WPP Meaningfully Different
Frame work (MDF)
• WPP Brand Z
• 183 European case studies
including 88 from UK
Source: Arial 8pt

1 2 3 4 5
CINEMA MAKES
BRANDS
MEMORABLE
CINEMA
CREATES A
BRAND LOVE
STORY
CINEMA MAKES
BRANDS FEEL
DIFFERENT
CINEMA TURNS
AUDIENCES
INTO
CUSTOMERS
CINEMA WINS
INFLUENTIAL
FANS FOR
BRANDS
FIVE KEY TAKEAWAYS
#INTROTOCINEMA

Cinema Return on Investment – UK Results 2012. Source:: BrandScience UK Results Vault
Tertiles based on % of cinema used in the media mix. Number of cases in each tertile – 0-5% = 20 / 5-10% = 7 / 10+% = 5
OPTIMUM CINEMA INVESTMENT = 5-10% Both Cinema and Total Comms generate the best ROI when 5-10% of total budget is invested in Cinema
£0.87
£1.60
£0.82
£1.62
£1.85
£0.60
0.00
0.20
0.40
0.60
0.80
1.00
1.20
1.40
1.60
1.80
2.00
0-5% 5-10% 10+%
Cinema ROI Total Comms ROI
Retu
rn o
n In
ve
stm
en
t
% of Total budget invested in cinema as part of media mix
DIGITAL CINEMA IS
LOCAL.

LOCAL TARGETING
Using Cinemapper, DCM's Award
Winning cinema proximity planning tool,
you can run national campaigns with a
local spin for every region, city, town or
cinema across the UK via local end
frame messaging.
#INTROTOCINEMA

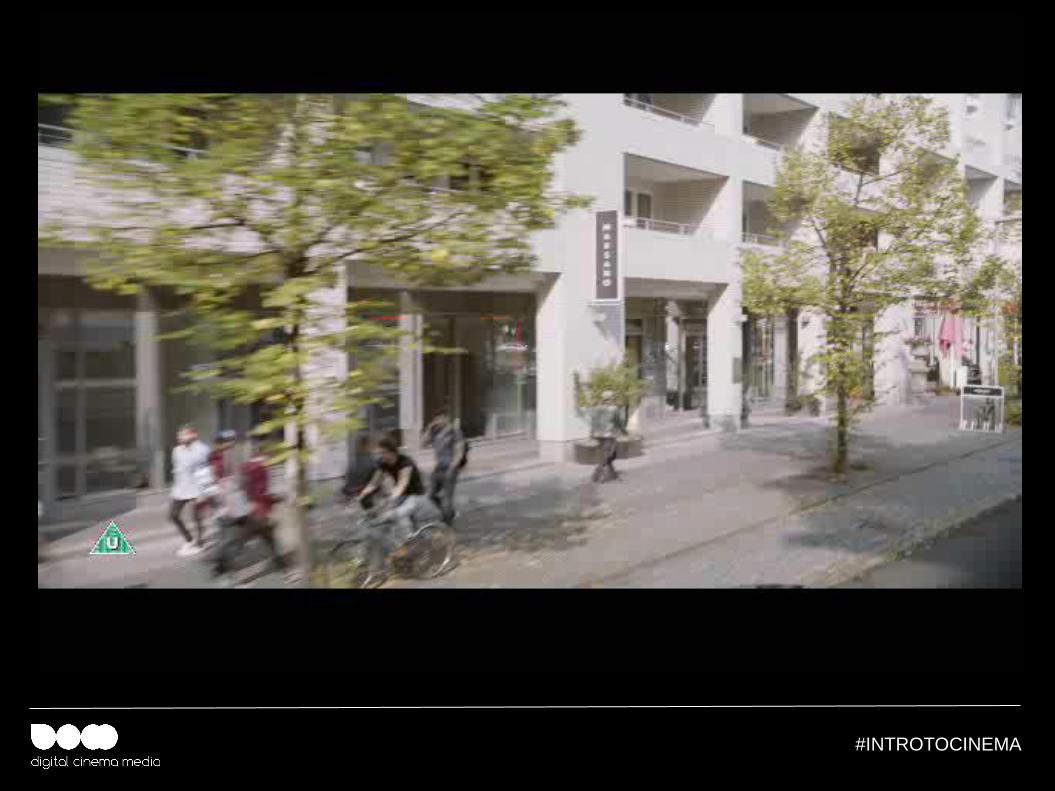
WHERE YOUR JOURNEY BEGINS
Source: Coverage: CAA end Q3 2014. Proximity: Source: Cinemapper/Retail Locations.
Proximity
95%
Scheduling
1 copy
= 300 end frames
Coverage
482
#INTROTOCINEMA

QUIZ ROUND…

Q1. WHAT IS THE
BIGGEST FILM OF
THE YEAR SO FAR?

Q2. WHO WON
BEST FILM AT THE
OSCARS?
#INTROTOCINEMA
Q3. WHICH ACTOR
PLAYS EDDIE THE
EAGLE?

THANK YOU! QUESTIONS PLEASE.

THE REALLY BIG
FILMS.
#INTROTOCINEMA

THE BFG 22 July 2016

FANTASTIC BEASTS AND WHERE TO FIND THEM 18 November 2016

STAR WARS: ROGUE ONE 16 December 2016