Embed Size (px)
Citation preview

Welcome to NASA Applied Remote Sensing Training Program
(ARSET)Webinar Series
Introduction to Remote Sensing Data for Land Management
Course Dates: Every Tuesday, May 20-June 17Time: 12-1PM EDT
ARSET
Applied Remote SEnsing Training
A project of NASA Applied Sciences
Important Information
• Presentations URL:– Http://arset.gsfc.nasa.gov/webinars
• Contact for requesting recorded link for the webinars:– Marines Martins: [email protected]
• ARSET Land ListServ URL:– https://lists.nasa.gov/mailman/listinfo/nasa-water-training
• Homework update: I will send you a link to access a Google document.
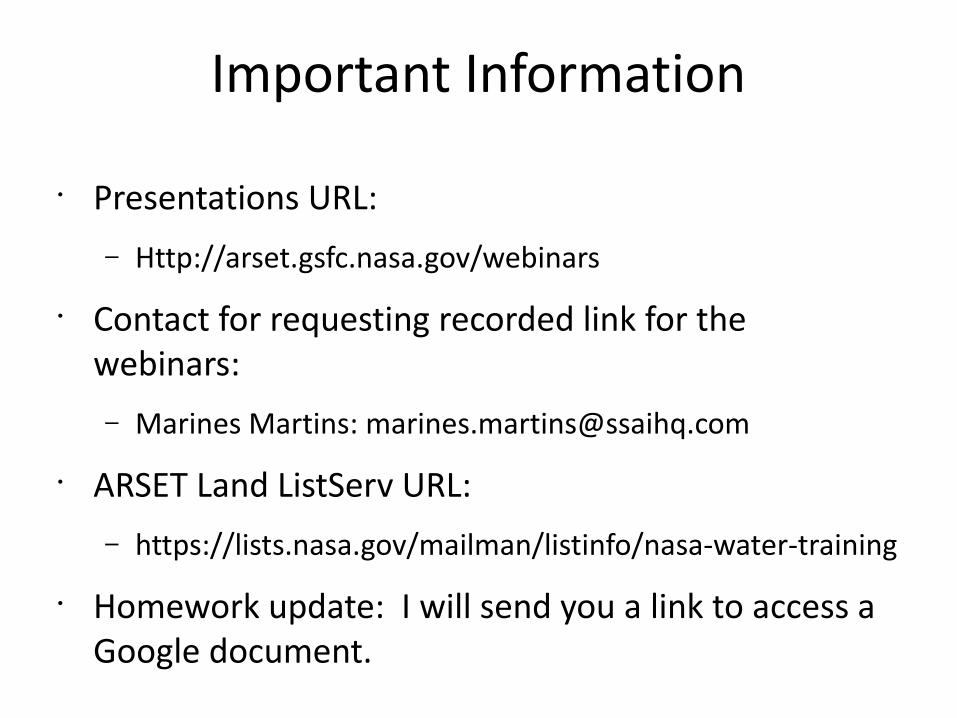
Week 1
Intro. & Background:Satellite Remote Sensing
Week 2
Soil Moisture and Evapotranspiration
Week 3
Week 5
Web tools for data access/Importing data into GIS
Land Cover Mapping/Web tools for
data access
Course Outline
Change Detection
Week 4
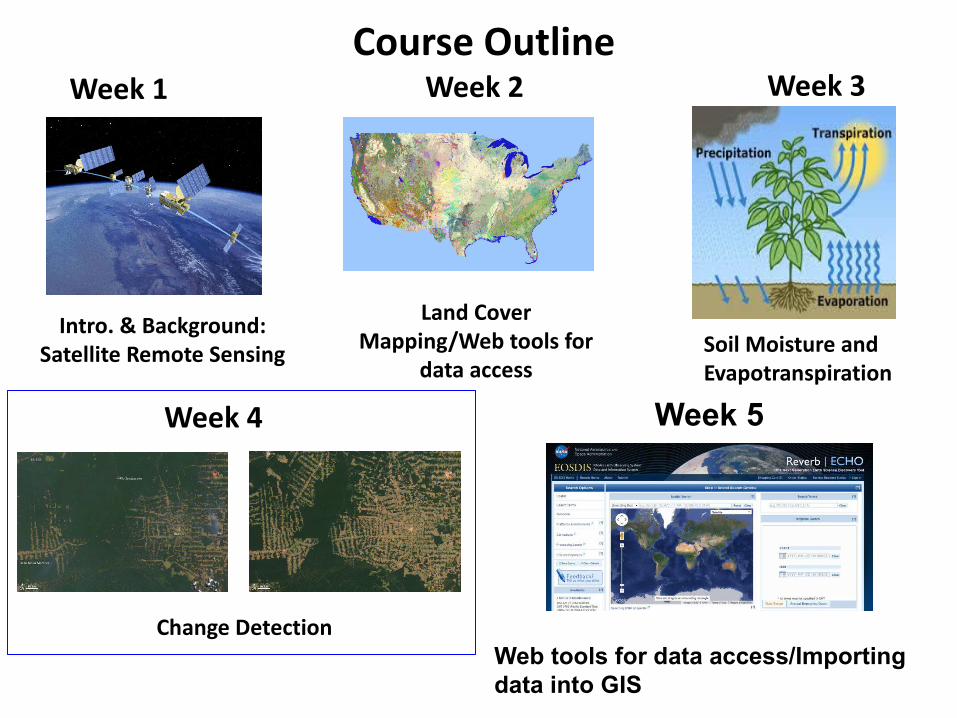
ARSET Land Resource Management http
://arset.gsfc.nasa.gov/eco/webinars/land-management
Course Instructors for Today
• Cindy Schmidt (ARSET) – [email protected]
• For more information about the ARSET program contact: Ana Prados [email protected]
Outline
• Definition and applications• Methods• Where to obtain and visualize change
detection datasets• Live demo
Change Detection: Definitions and Applications
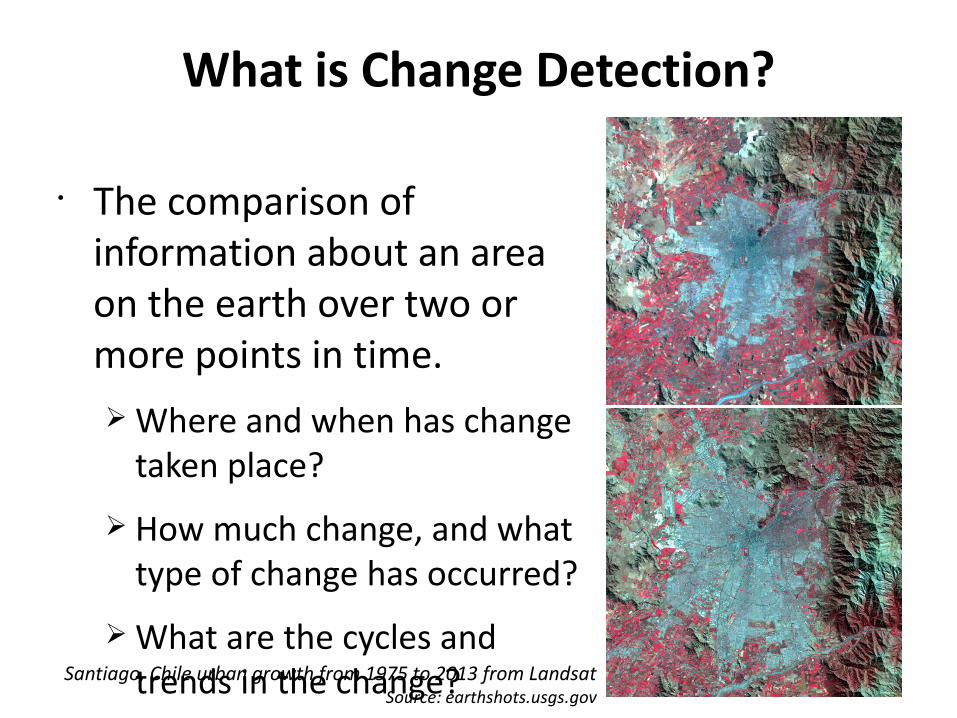
What is Change Detection?
• The comparison of information about an area on the earth over two or more points in time.Ø Where and when has change
taken place?
Ø How much change, and what type of change has occurred?
Ø What are the cycles and trends in the change?Santiago, Chile urban growth from 1975 to 2013 from Landsat
Source: earthshots.usgs.gov
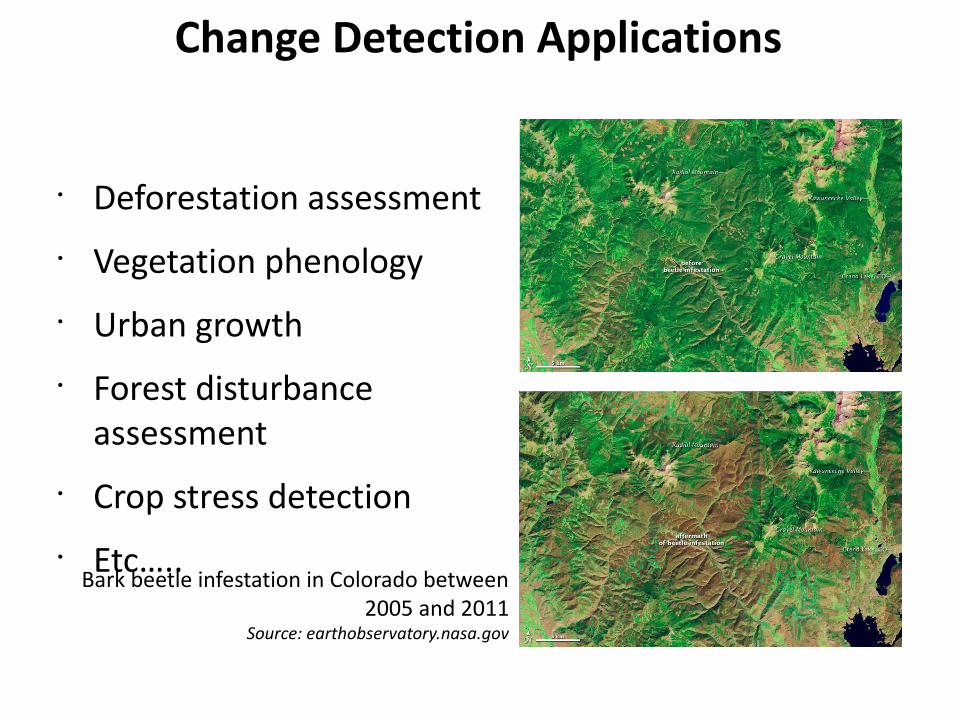
Change Detection Applications
• Deforestation assessment• Vegetation phenology• Urban growth• Forest disturbance
assessment• Crop stress detection• Etc…..
Bark beetle infestation in Colorado between 2005 and 2011
Source: earthobservatory.nasa.gov
Change Detection Methods
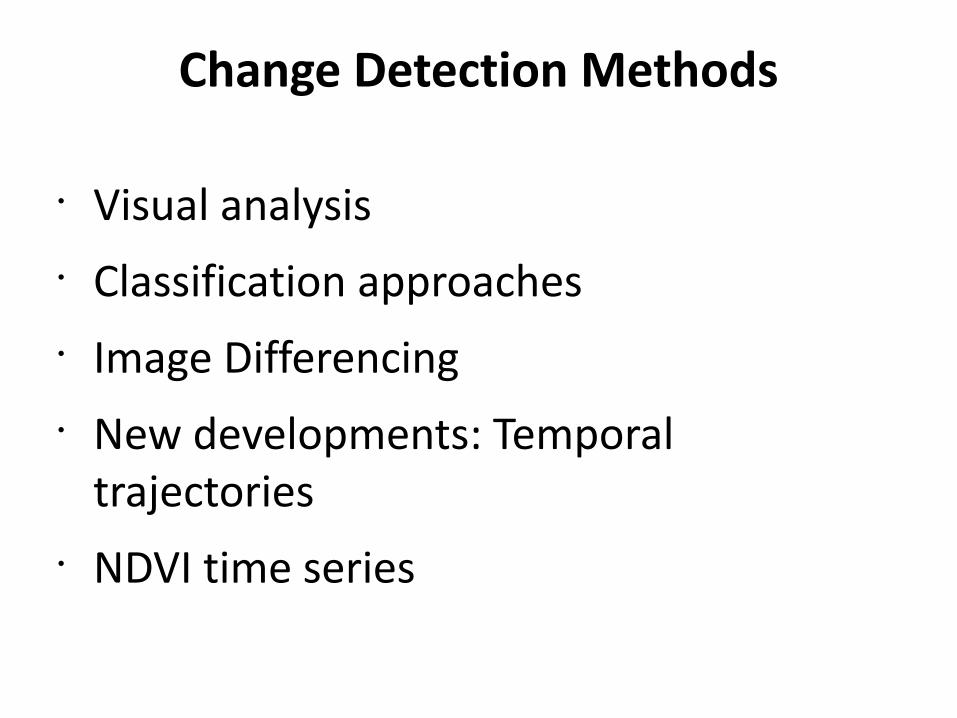
Change Detection Methods
• Visual analysis• Classification approaches• Image Differencing• New developments: Temporal
trajectories• NDVI time series
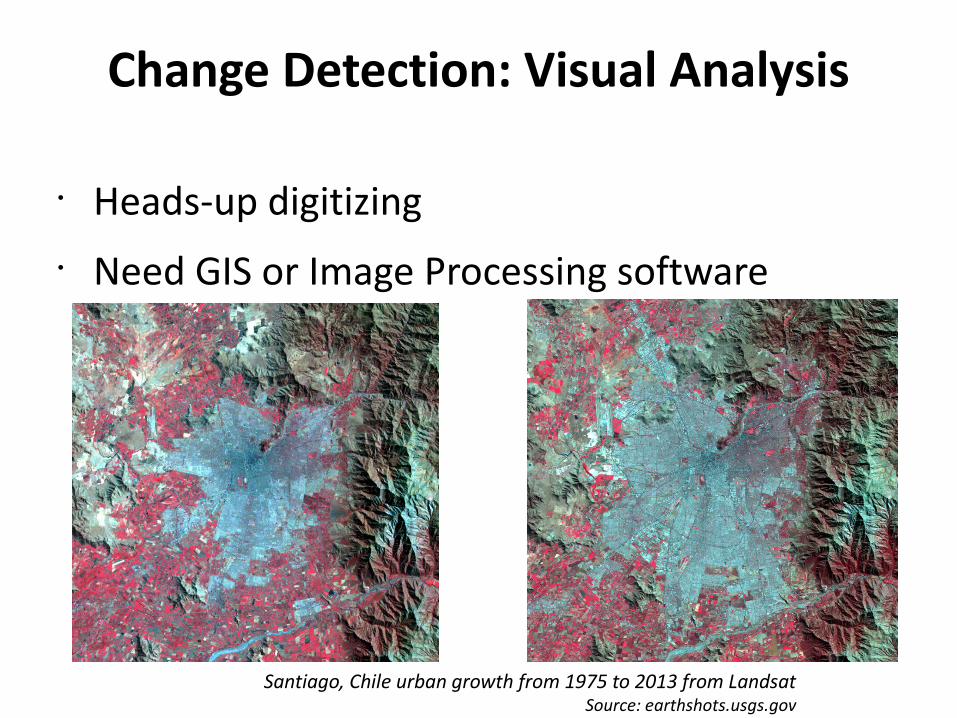
Change Detection: Visual Analysis
• Heads-up digitizing• Need GIS or Image Processing software
Santiago, Chile urban growth from 1975 to 2013 from LandsatSource: earthshots.usgs.gov
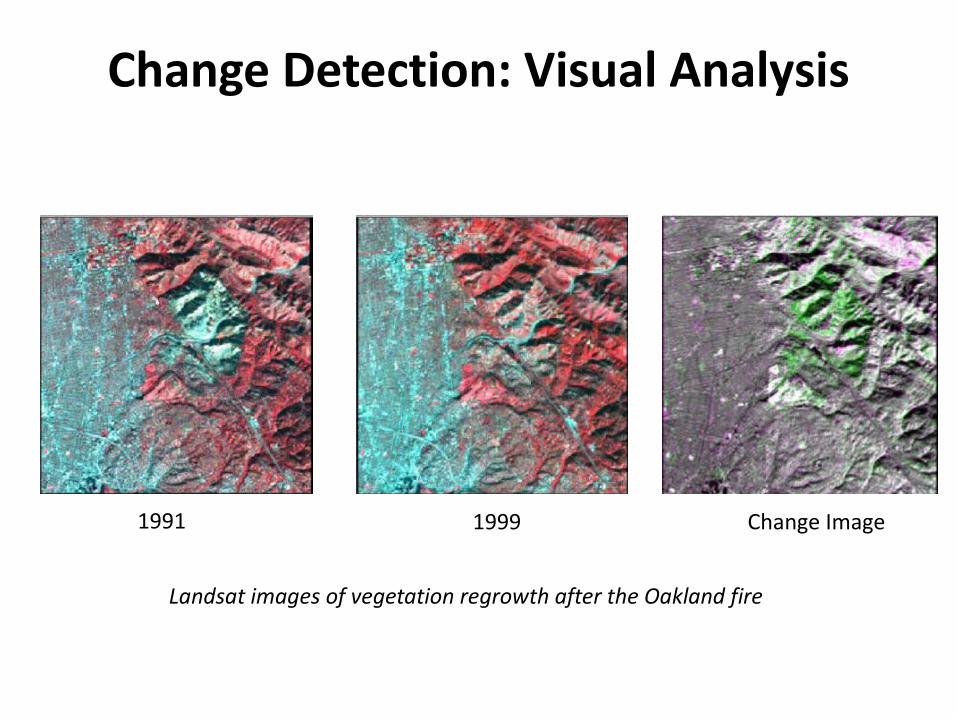
Change Detection: Visual Analysis
1991 1999 Change Image
Landsat images of vegetation regrowth after the Oakland fire
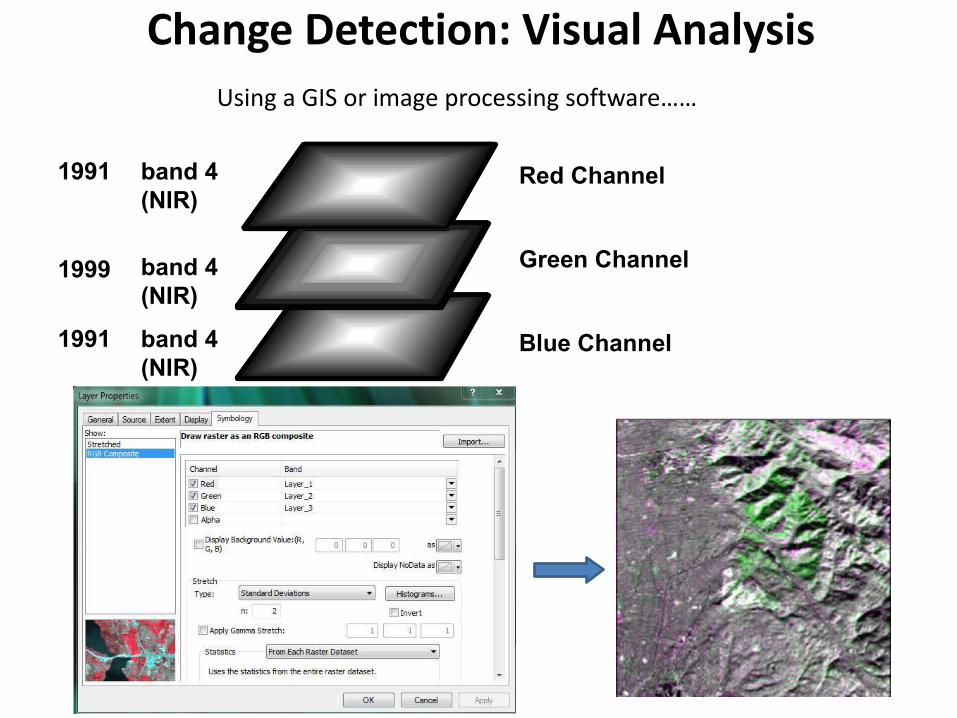
Change Detection: Visual Analysis
1991 band 4(NIR)
1999 band 4(NIR)
1991 band 4(NIR)
Red Channel
Green Channel
Blue Channel
Using a GIS or image processing software……
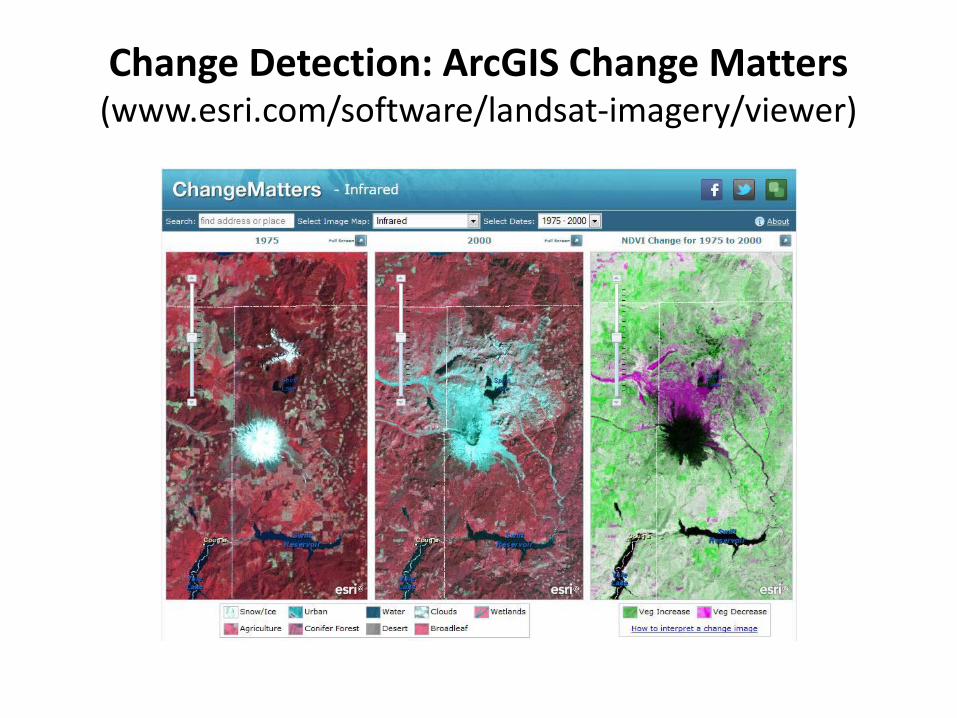
Change Detection: ArcGIS Change Matters(www.esri.com/software/landsat-imagery/viewer)
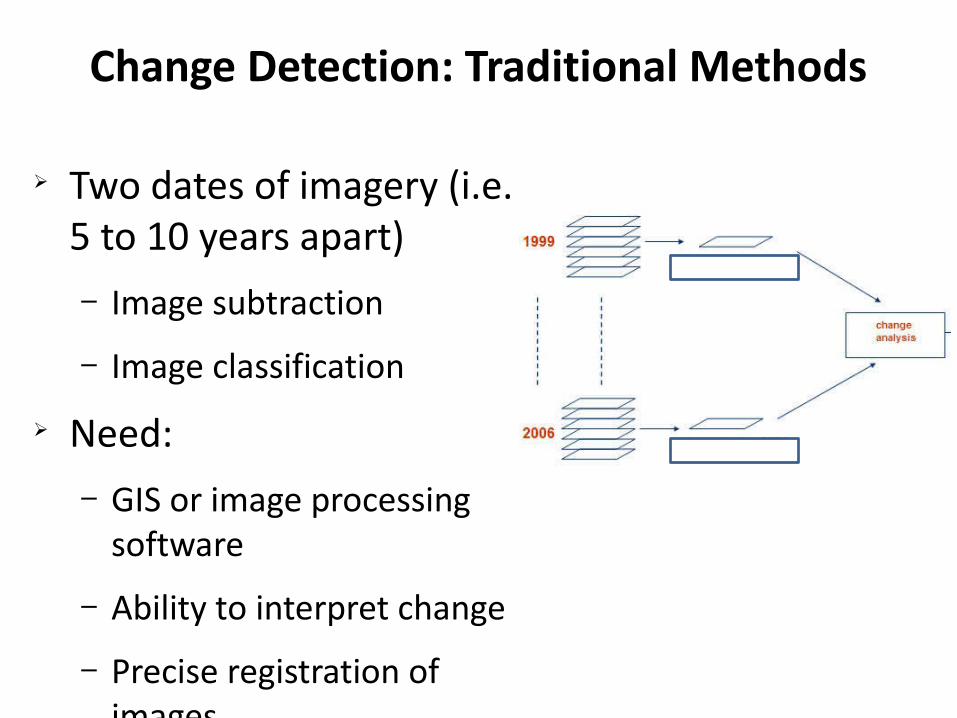
Change Detection: Traditional Methods
Ø Two dates of imagery (i.e. 5 to 10 years apart)– Image subtraction
– Image classification
Ø Need:– GIS or image processing
software
– Ability to interpret change
– Precise registration of images
NDVI
NDVI
Change Detection Methods: Recent Developments
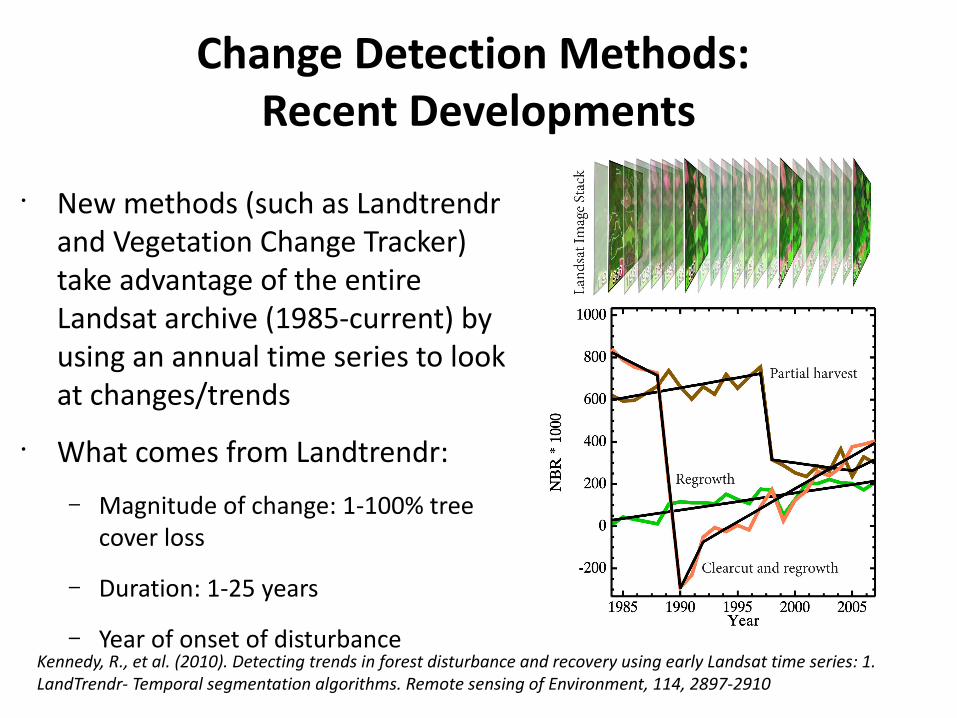
• New methods (such as Landtrendr and Vegetation Change Tracker) take advantage of the entire Landsat archive (1985-current) by using an annual time series to look at changes/trends
• What comes from Landtrendr:– Magnitude of change: 1-100% tree
cover loss
– Duration: 1-25 years
– Year of onset of disturbance Kennedy, R., et al. (2010). Detecting trends in forest disturbance and recovery using early Landsat time series: 1. LandTrendr- Temporal segmentation algorithms. Remote sensing of Environment, 114, 2897-2910
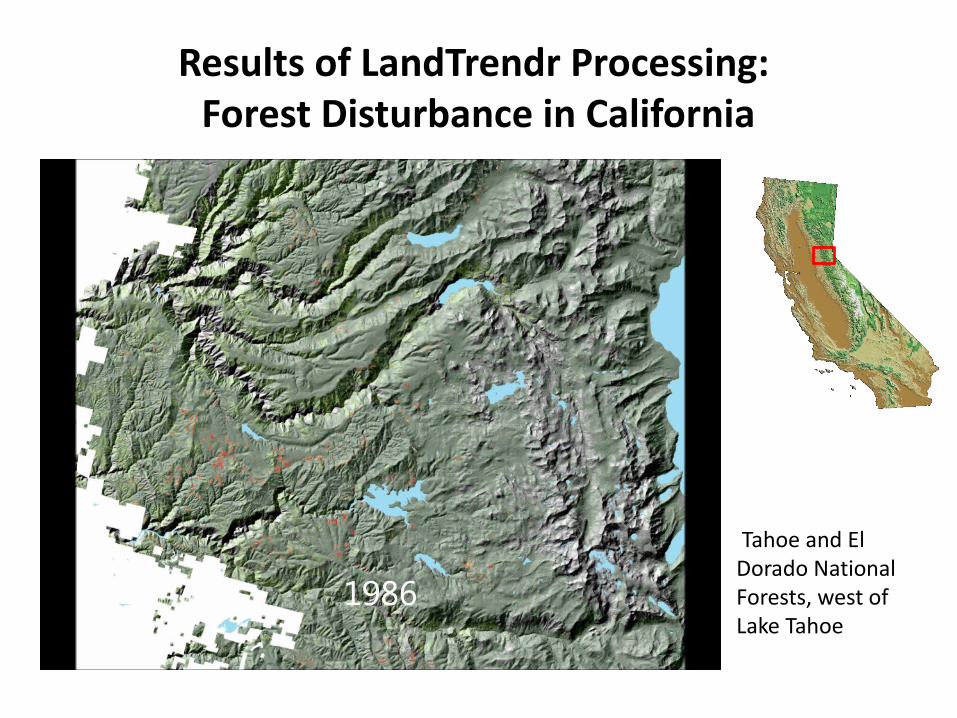
Results of LandTrendr Processing: Forest Disturbance in California
Tahoe and El Dorado National Forests, west of Lake Tahoe
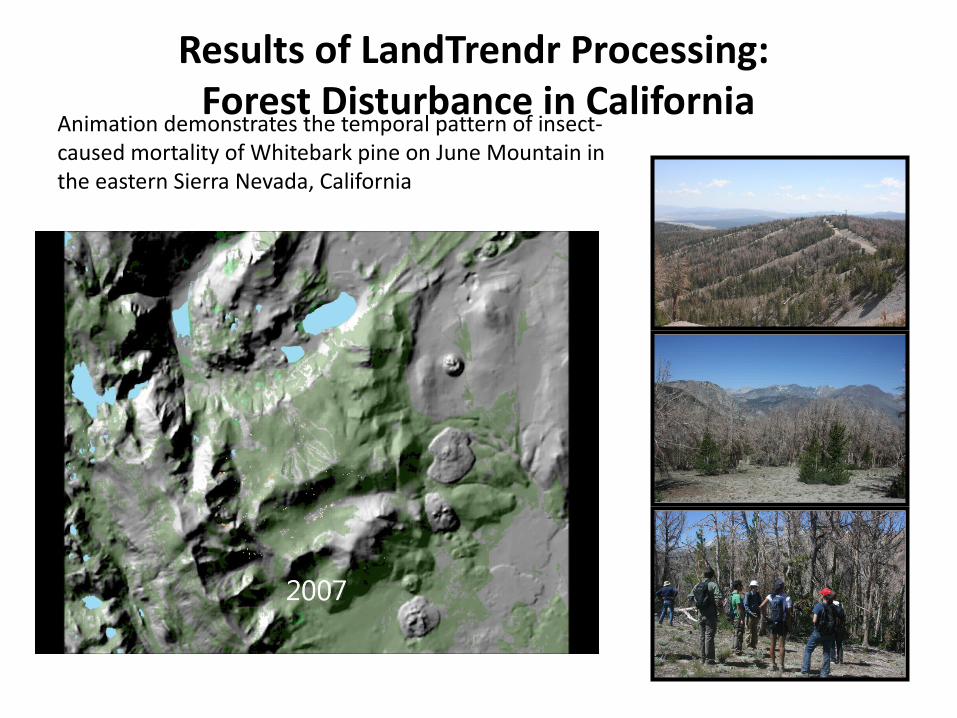
Results of LandTrendr Processing: Forest Disturbance in California
Animation demonstrates the temporal pattern of insect-caused mortality of Whitebark pine on June Mountain in the eastern Sierra Nevada, California
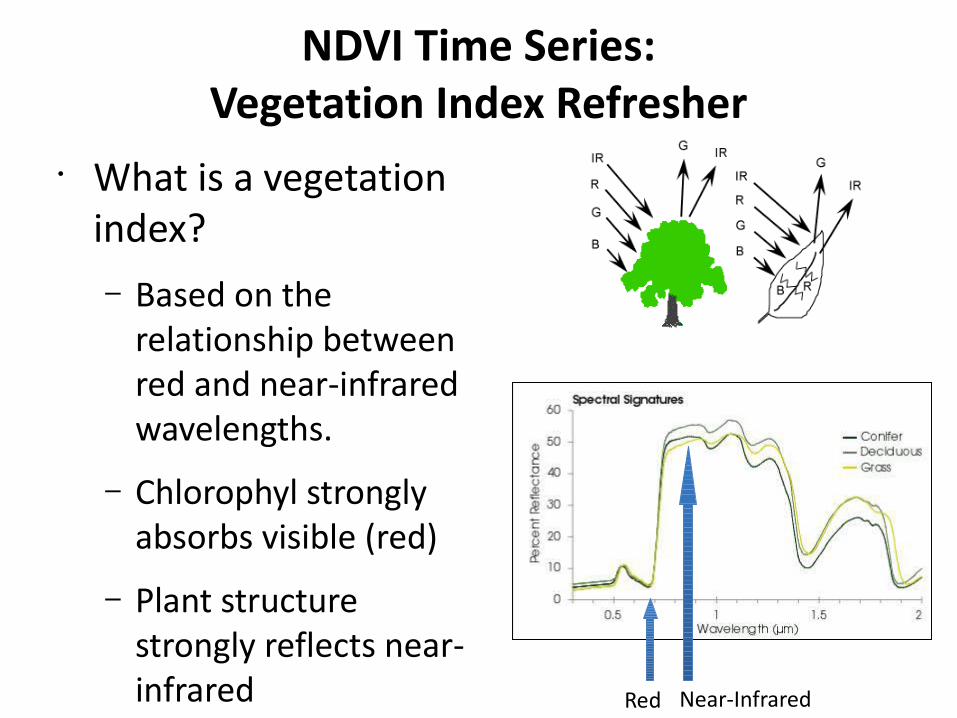
NDVI Time Series:Vegetation Index Refresher
• What is a vegetation index? – Based on the
relationship between red and near-infrared wavelengths.
– Chlorophyl strongly absorbs visible (red)
– Plant structure strongly reflects near-infrared Red Near-Infrared
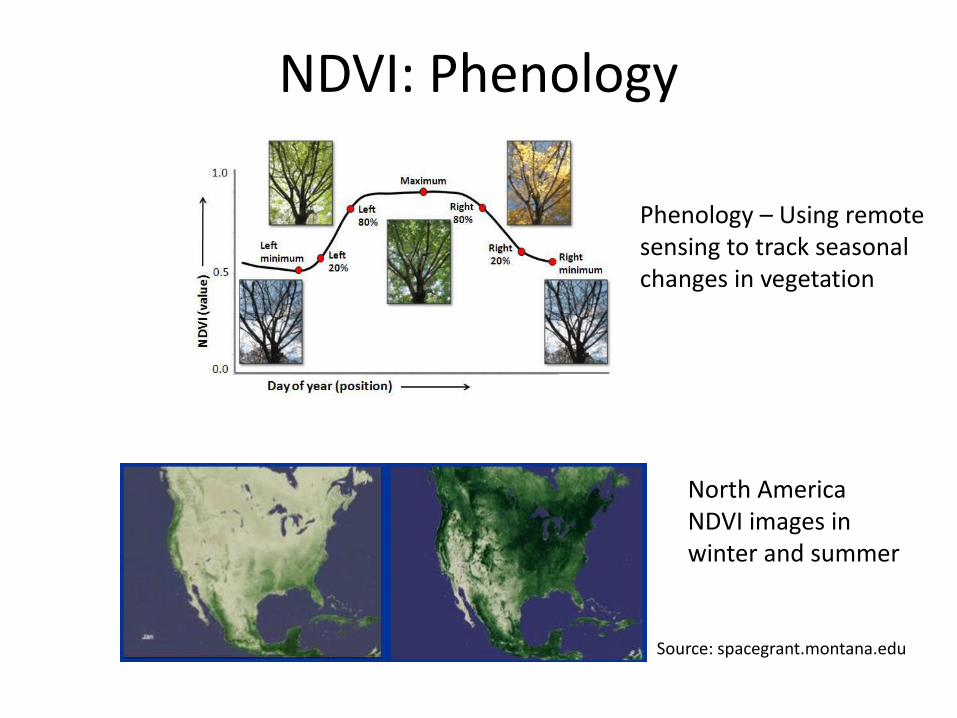
NDVI: Phenology
Phenology – Using remote sensing to track seasonal changes in vegetation
North America NDVI images in winter and summer
Source: spacegrant.montana.edu
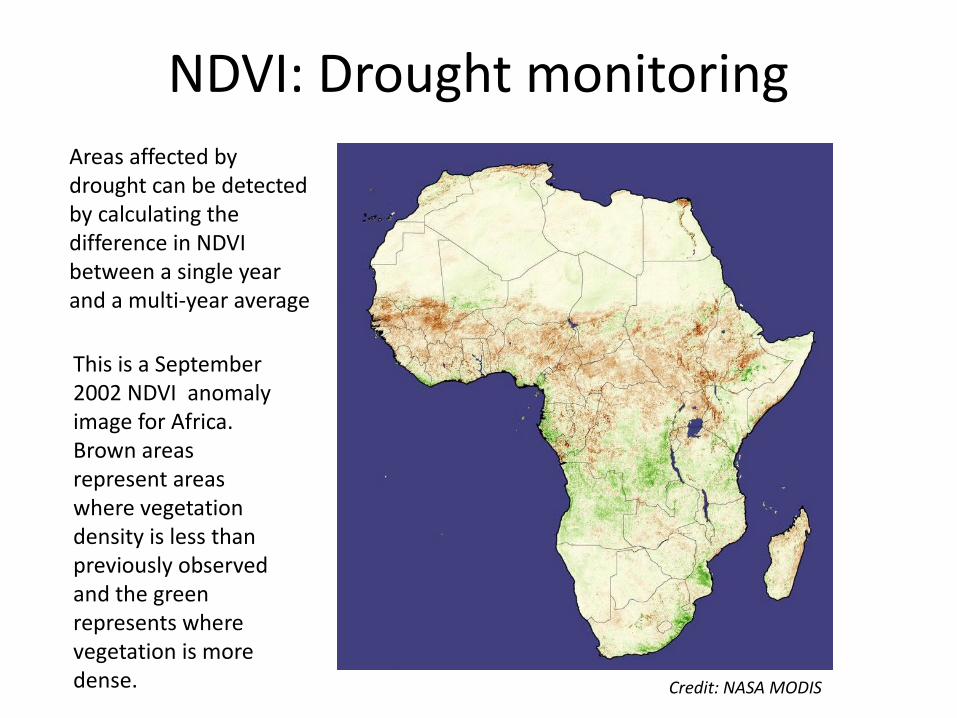
NDVI: Drought monitoringAreas affected by drought can be detected by calculating the difference in NDVI between a single year and a multi-year average
This is a September 2002 NDVI anomaly image for Africa. Brown areas represent areas where vegetation density is less than previously observed and the green represents where vegetation is more dense. Credit: NASA MODIS
Where to Obtain and Visualize Change Detection Datasets
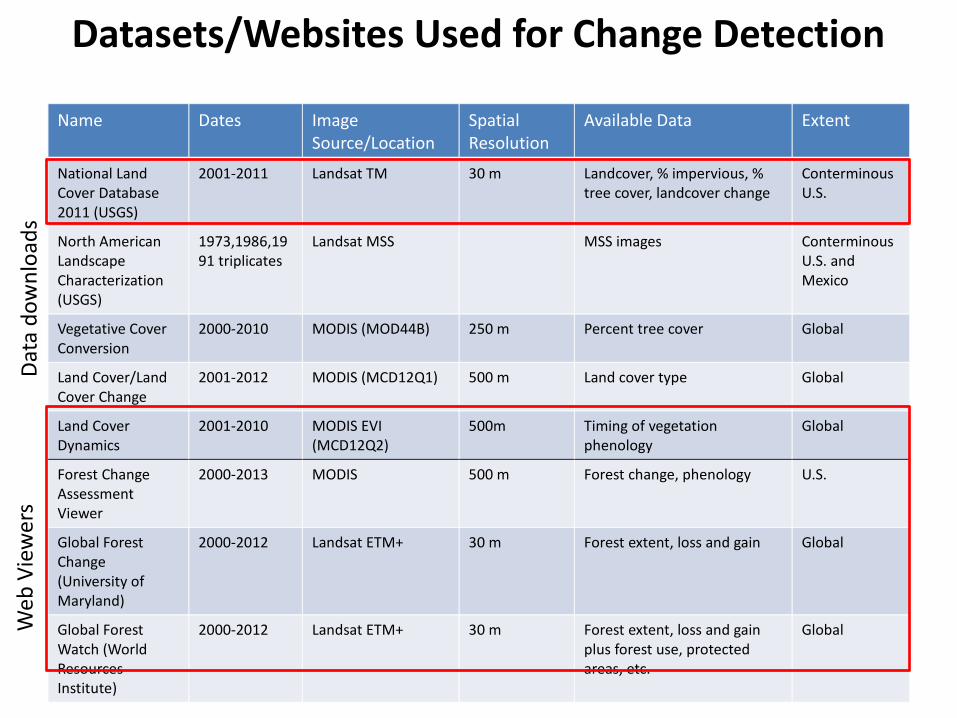
Datasets/Websites Used for Change Detection
Name Dates Image Source/Location
Spatial Resolution
Available Data Extent
National Land Cover Database 2011 (USGS)
2001-2011 Landsat TM 30 m Landcover, % impervious, % tree cover, landcover change
Conterminous U.S.
North American Landscape Characterization (USGS)
1973,1986,1991 triplicates
Landsat MSS MSS images Conterminous U.S. and Mexico
Vegetative Cover Conversion
2000-2010 MODIS (MOD44B) 250 m Percent tree cover Global
Land Cover/Land Cover Change
2001-2012 MODIS (MCD12Q1) 500 m Land cover type Global
Land Cover Dynamics
2001-2010 MODIS EVI (MCD12Q2)
500m Timing of vegetation phenology
Global
Forest Change Assessment Viewer
2000-2013 MODIS 500 m Forest change, phenology U.S.
Global Forest Change (University of Maryland)
2000-2012 Landsat ETM+ 30 m Forest extent, loss and gain Global
Global Forest Watch (World Resources Institute)
2000-2012 Landsat ETM+ 30 m Forest extent, loss and gain plus forest use, protected areas, etc.
GlobalWeb
Vie
wer
sD
ata
dow
nloa
ds
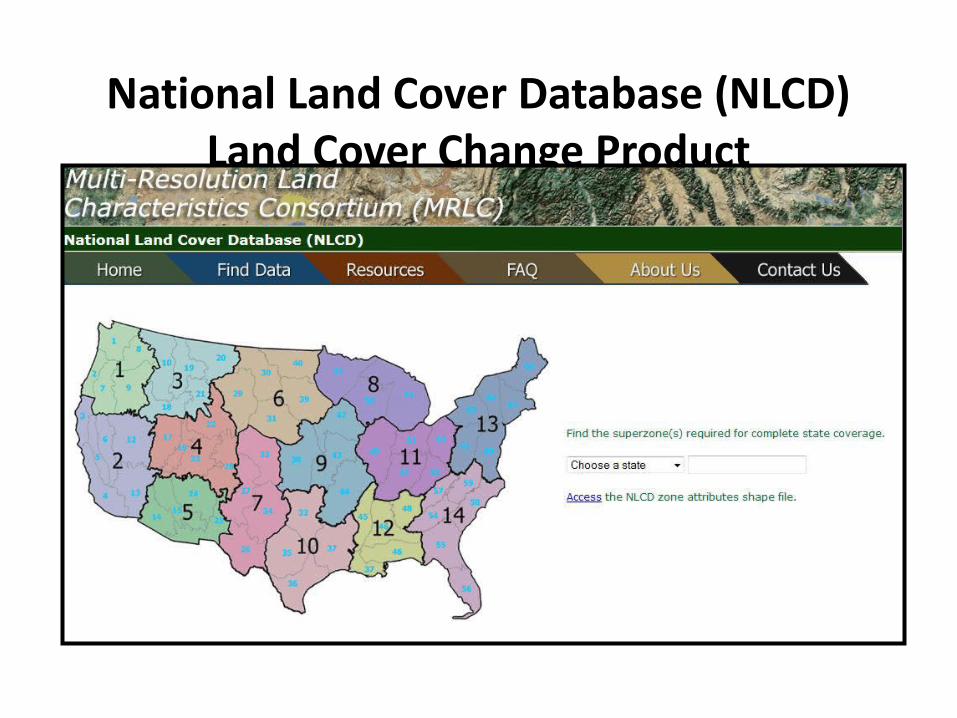
National Land Cover Database (NLCD) Land Cover Change Product
http://www.mrlc.gov
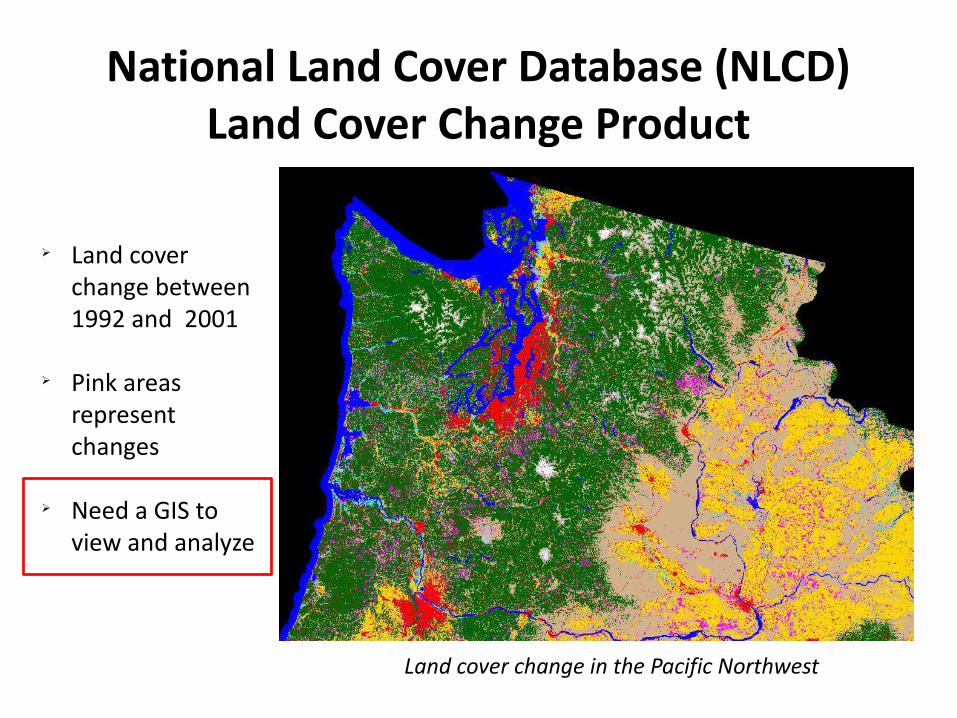
National Land Cover Database (NLCD)Land Cover Change Product
Ø Land cover change between 1992 and 2001
Ø Pink areas represent changes
Ø Need a GIS to view and analyze
Land cover change in the Pacific Northwest
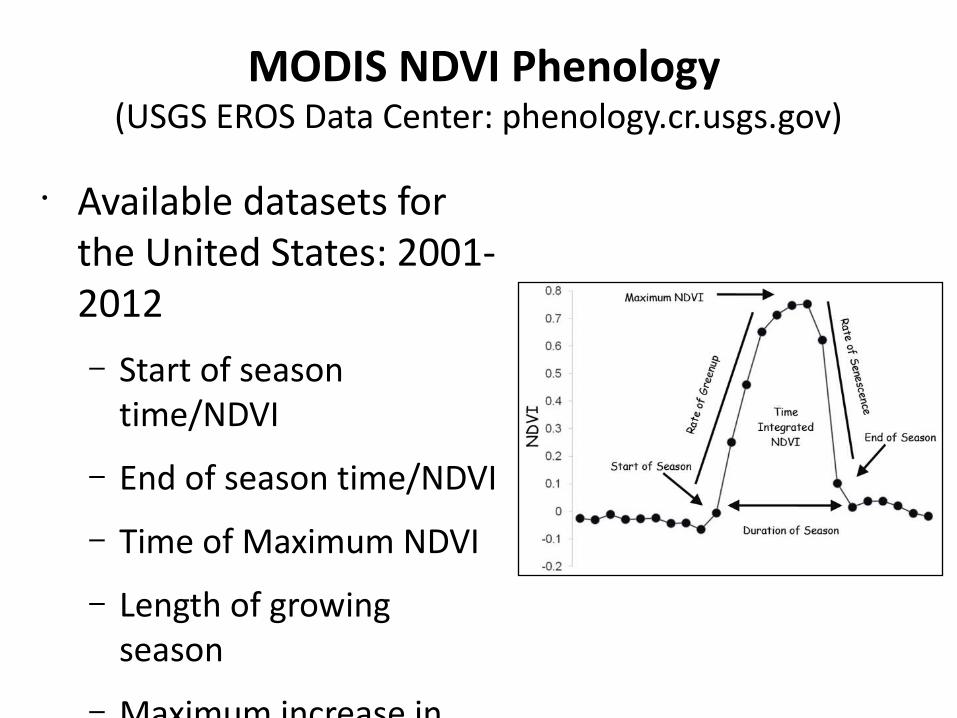
MODIS NDVI Phenology(USGS EROS Data Center: phenology.cr.usgs.gov)
• Available datasets for the United States: 2001-2012– Start of season
time/NDVI
– End of season time/NDVI
– Time of Maximum NDVI
– Length of growing season
– Maximum increase in canopy
– Photosynthetic activity across entire growing season
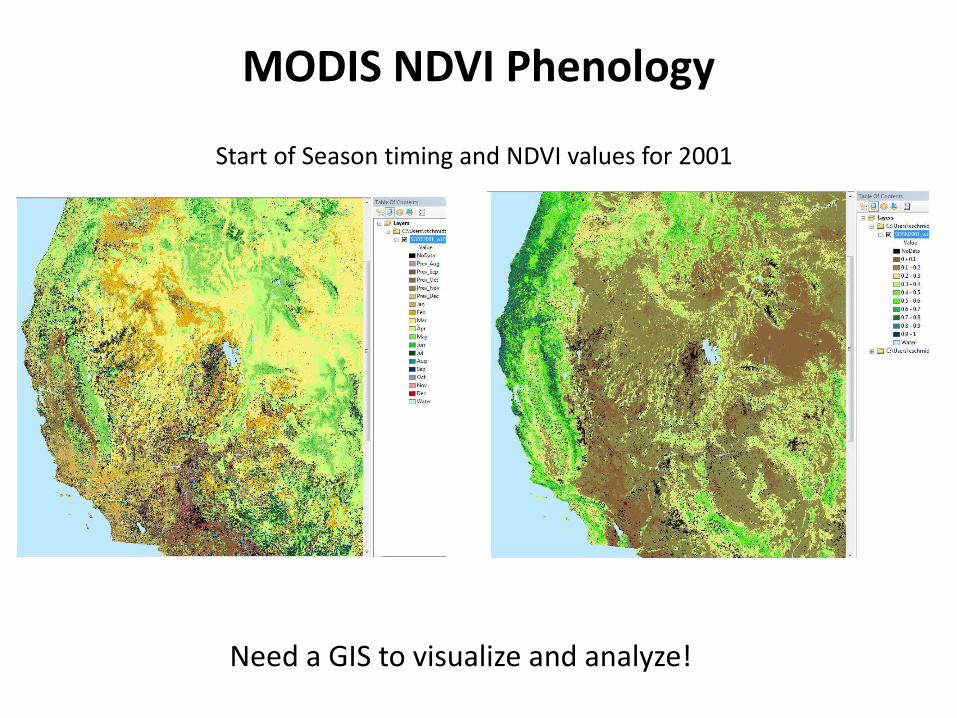
MODIS NDVI Phenology
Start of Season timing and NDVI values for 2001
Need a GIS to visualize and analyze!
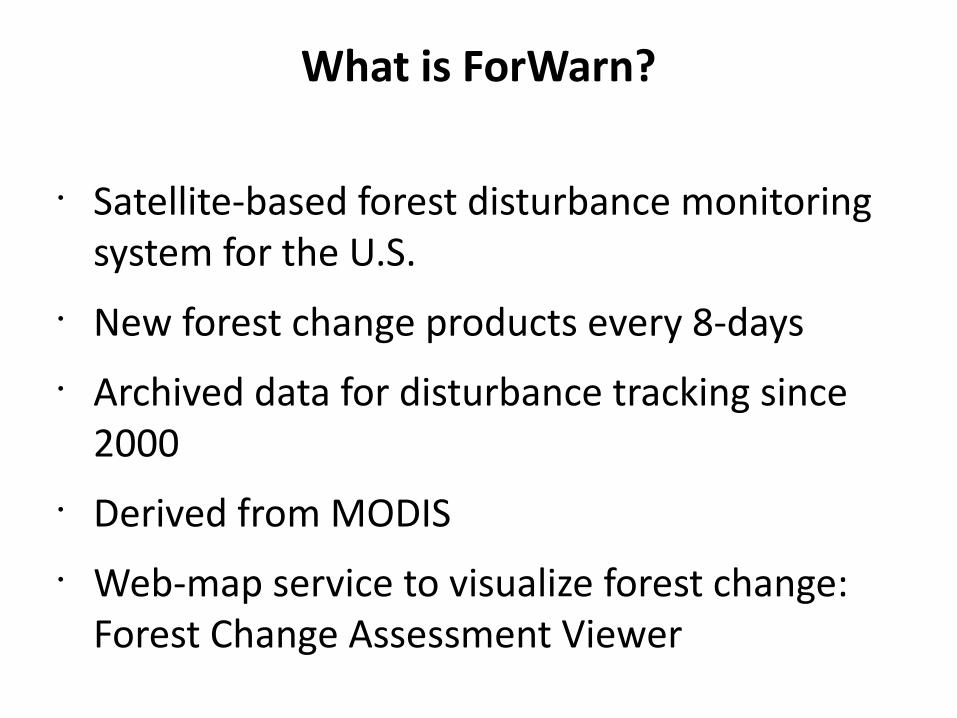
What is ForWarn?
• Satellite-based forest disturbance monitoring system for the U.S.
• New forest change products every 8-days• Archived data for disturbance tracking since
2000• Derived from MODIS• Web-map service to visualize forest change:
Forest Change Assessment Viewer
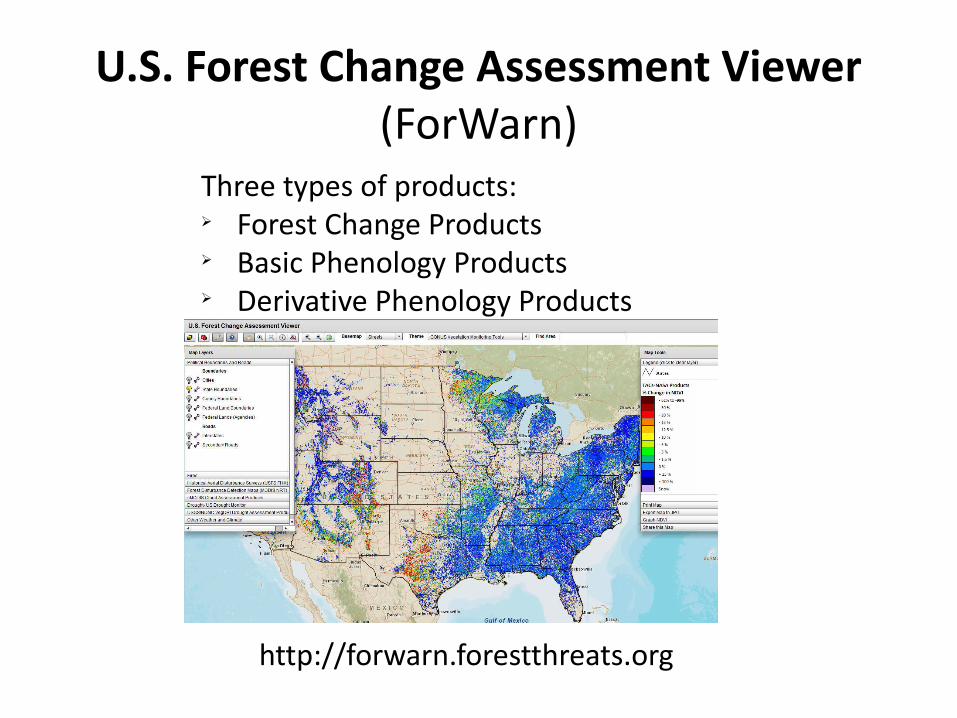
U.S. Forest Change Assessment Viewer (ForWarn)
http://forwarn.forestthreats.org
Three types of products:Ø Forest Change ProductsØ Basic Phenology ProductsØ Derivative Phenology Products
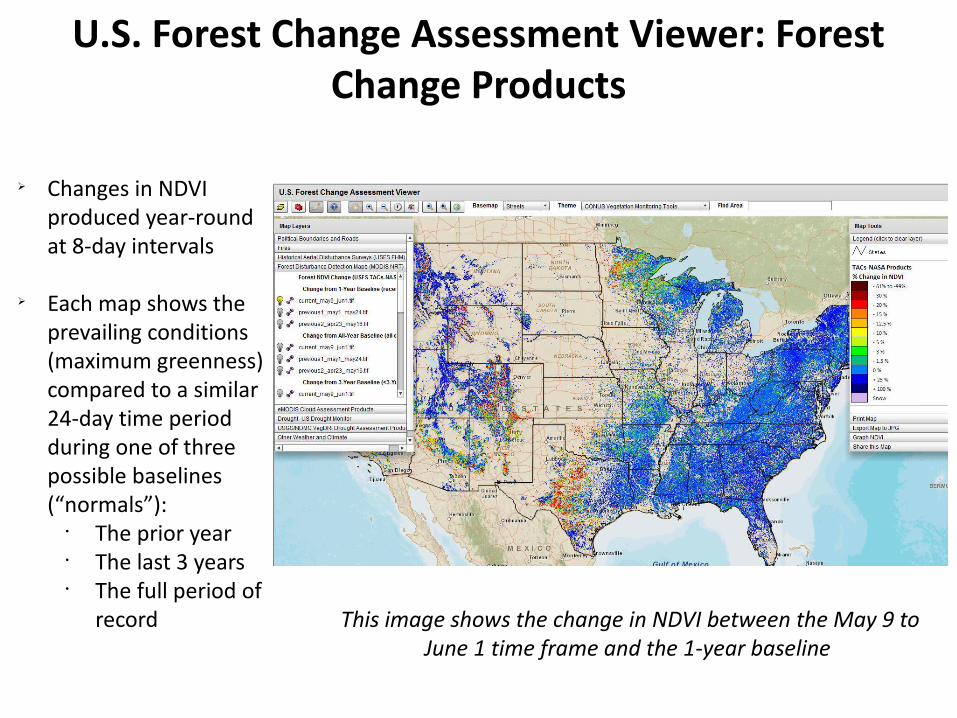
U.S. Forest Change Assessment Viewer: Forest Change Products
Ø Changes in NDVI produced year-round at 8-day intervals
Ø Each map shows the prevailing conditions (maximum greenness) compared to a similar 24-day time period during one of three possible baselines (“normals”):
• The prior year• The last 3 years• The full period of
record This image shows the change in NDVI between the May 9 to June 1 time frame and the 1-year baseline
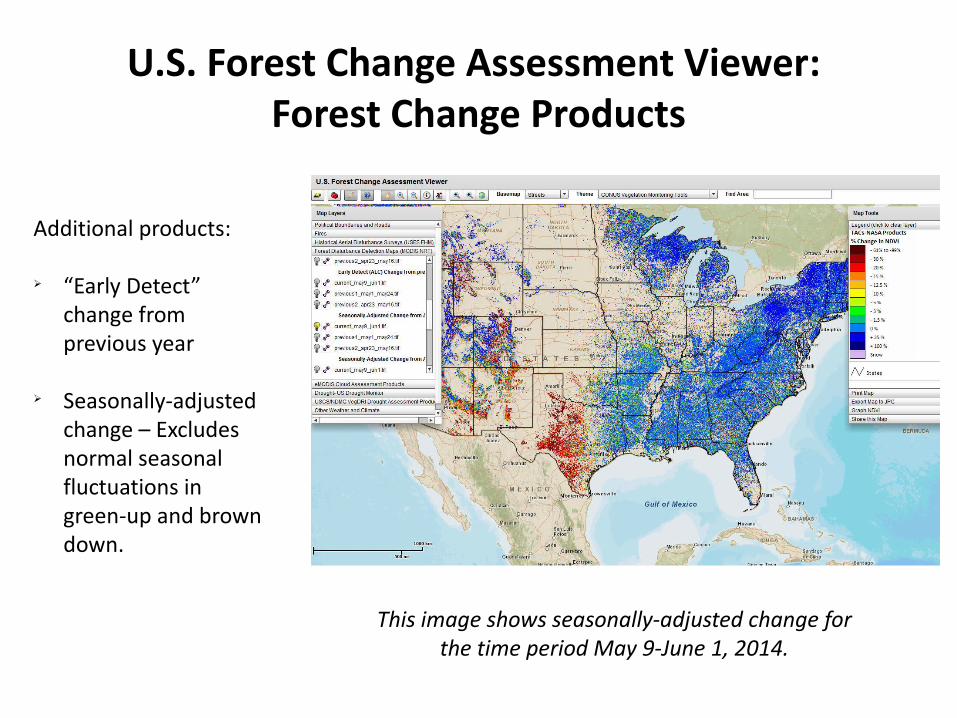
U.S. Forest Change Assessment Viewer: Forest Change Products
Additional products:
Ø “Early Detect” change from previous year
Ø Seasonally-adjusted change – Excludes normal seasonal fluctuations in green-up and brown down.
This image shows seasonally-adjusted change for the time period May 9-June 1, 2014.
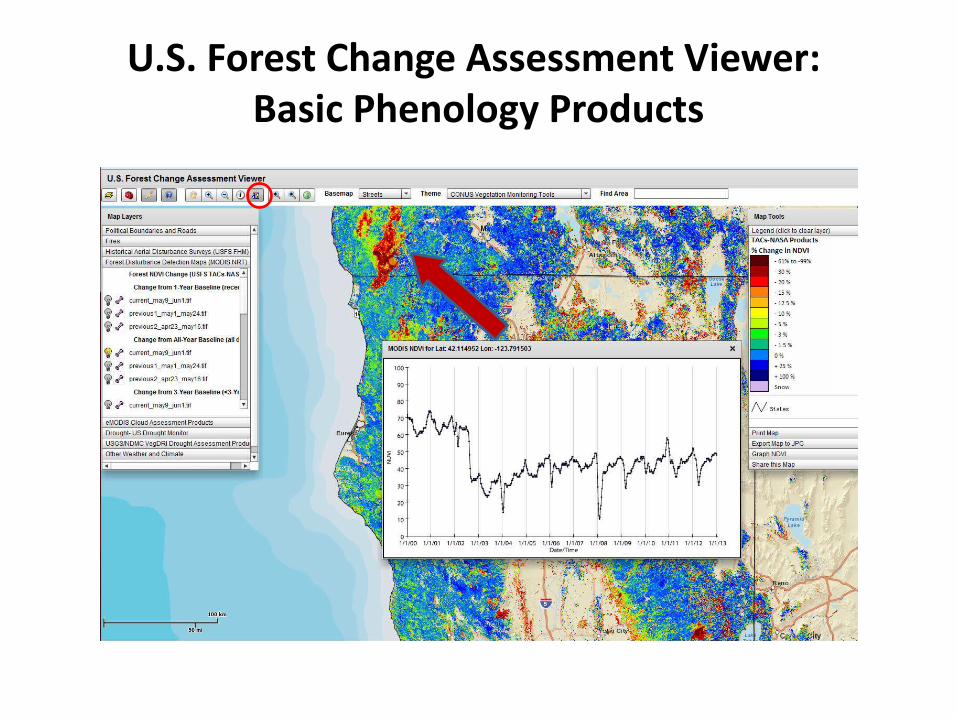
U.S. Forest Change Assessment Viewer: Basic Phenology Products
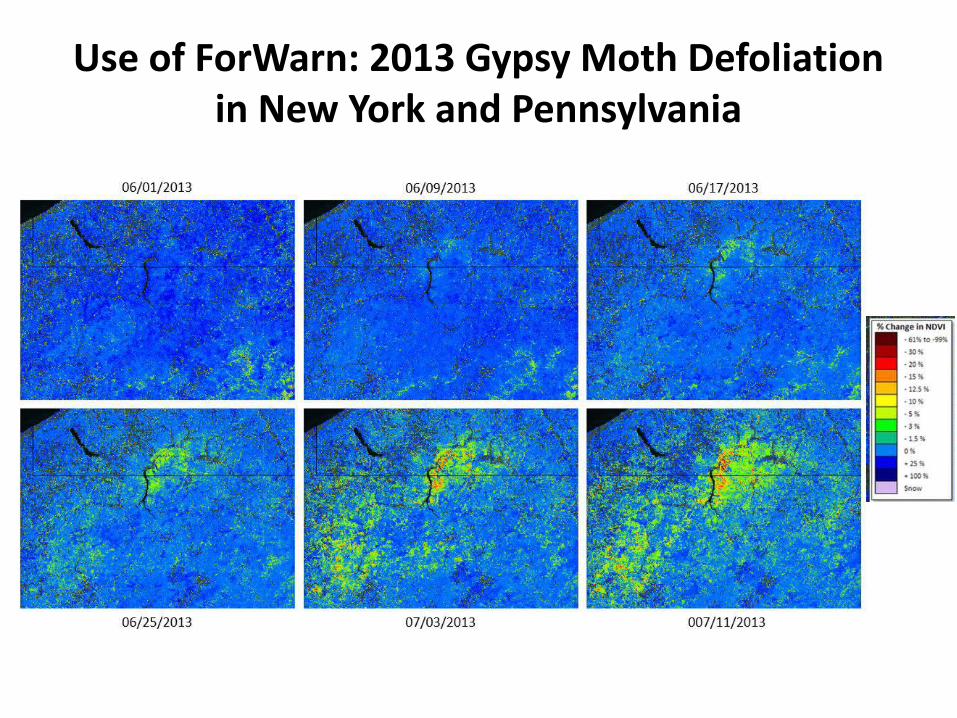
Use of ForWarn: 2013 Gypsy Moth Defoliation in New York and Pennsylvania
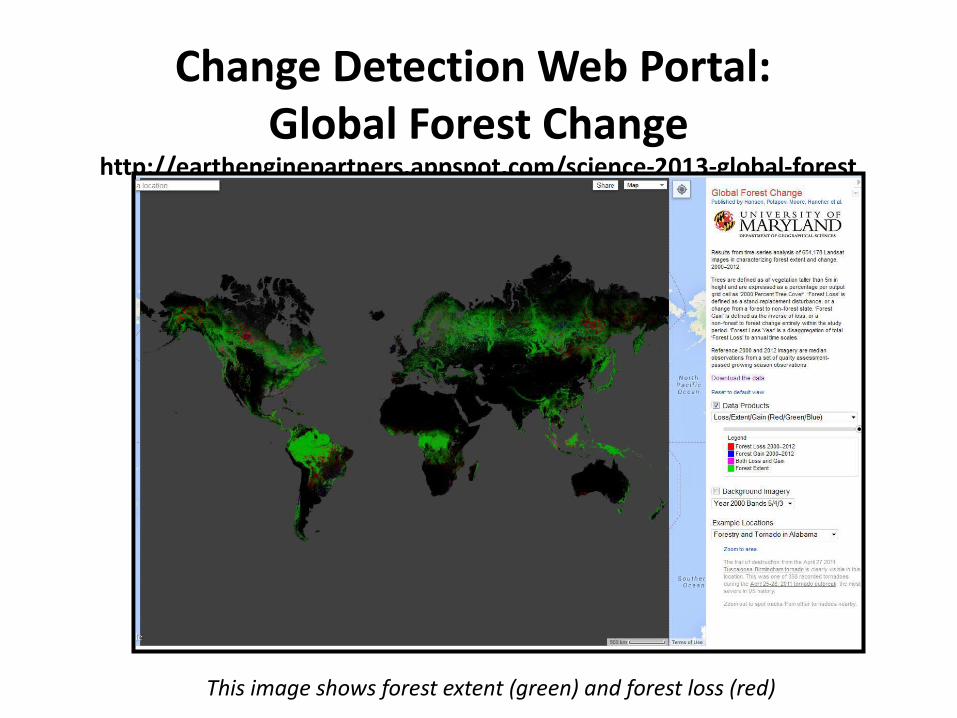
Change Detection Web Portal: Global Forest Change
http://earthenginepartners.appspot.com/science-2013-global-forest
This image shows forest extent (green) and forest loss (red)
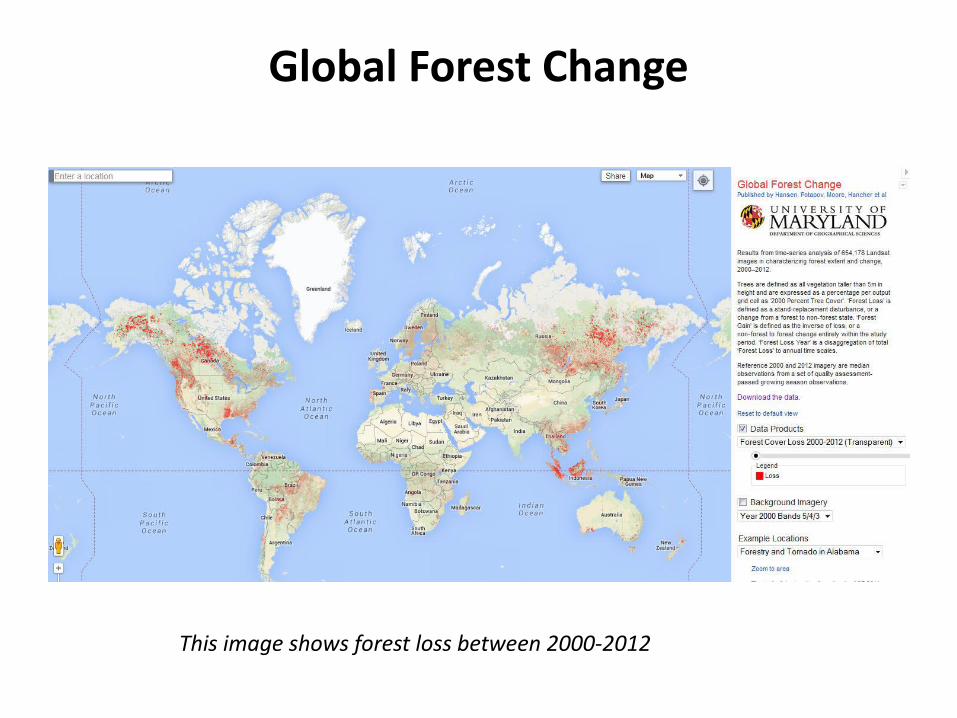
Global Forest Change
This image shows forest loss between 2000-2012
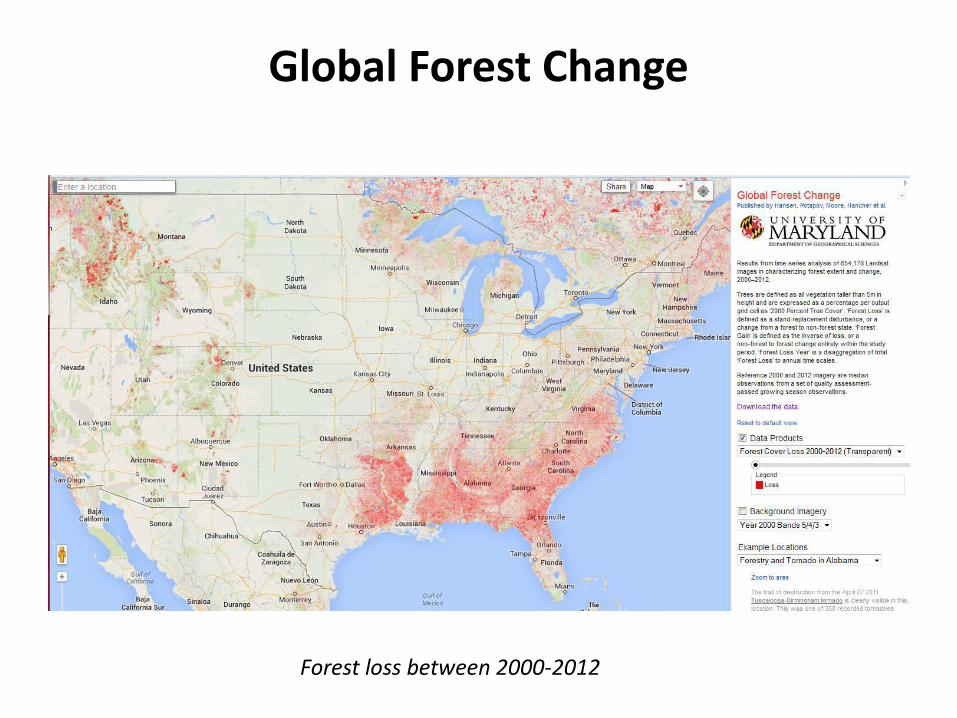
Global Forest Change
Forest loss between 2000-2012
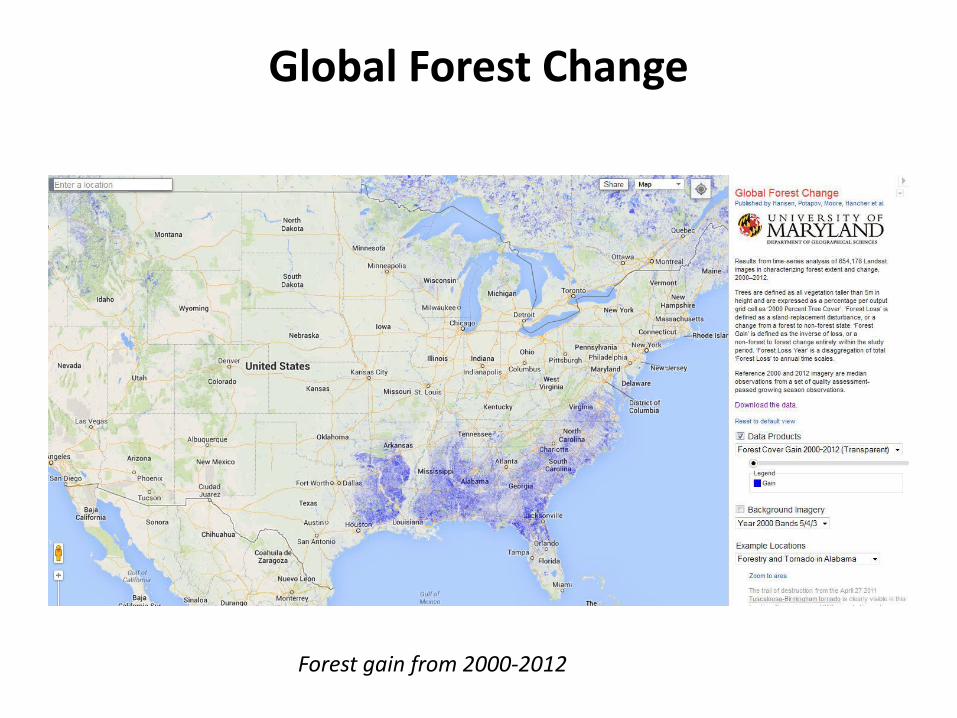
Global Forest Change
Forest gain from 2000-2012
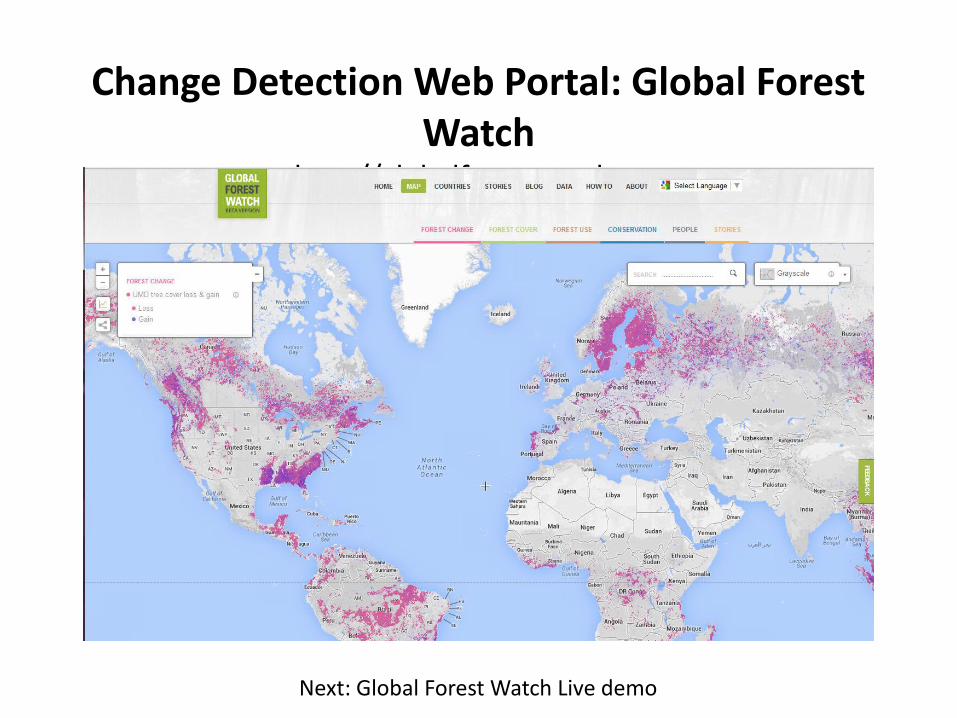
Change Detection Web Portal: Global Forest Watch
http://globalforestwatch.org
Next: Global Forest Watch Live demo
Coming up next week!
Week 5 (17 June 2014)
Live demonstrations of data access and visualization web
portals