Embed Size (px)
Citation preview

Welcome to IFSAC’s webinar:
Please stand by – we will be starting the presentation soon.
• Name: Please log into the Adobe Connect software with your first and last name. • Audio: We are not using Adobe Connect for audio. To listen, please call 1-301-796-7777, passcode: 665113• Q & A: Please submit questions by typing them into the Q & A Box. Content questions can be submitted at
any time and will be answered at the end of the presentation in the order received. We have a large number of registrants, but will attempt to answer as many questions as possible in the time allotted. Any unaddressed questions should be directed to the IFSAC email address: [email protected]
• Recording: An audiovisual recording of this webinar session will be posted online in the near future.• Technical Difficulties: If you experience problems with the Adobe Connect software, please submit your
technical issue in the Q & A Box and someone will assist you.
Foodborne illness source attribution estimates for 2013 for Salmonella, Escherichia coli O157,
Listeria monocytogenes, and Campylobacter
1

Today’s Presenters• Dr. Kis Robertson Hale, Deputy Assistant Administrator in the Office of Public Health
Science (OPHS) within the Food Safety and Inspection Service (FSIS) at the United States Department of Agriculture (USDA).
• Dr. Joanna Zablotsky Kufel, Public Health Food Safety Analyst in the Office of Data Integration and Food Protection (ODIFP) within the Food Safety and Inspection Service (FSIS) at the United States Department of Agriculture (USDA).
• Mr. Michael Batz, Operations Research Analyst in the Risk Analytics Team within the Office of Resource Planning and Strategic Management (RPSM) in the Office of Food and Veterinary Medicine (OFVM) at the U.S. Food and Drug Administration (FDA).
• Dr. LaTonia Richardson, Statistician in the Enteric Diseases Epidemiology Branch (EDEB) within the Division of Foodborne, Waterborne, and Environmental Diseases (DFWED) in the National Center for Emerging and Zoonotic Infectious Diseases (NCEZID) at the Centers for Disease Control & Prevention (CDC).
2

INTERAGENCY FOOD SAFETY ANALTYICS COLLABORATION (IFSAC)
Foodborne illness source attribution estimates for 2013 for Salmonella, Escherichia coli O157, Listeria monocytogenes, and Campylobacter
December 15, 2017
3

Overview of IFSAC
4
Dr. Kis Robertson HaleUSDA Food Safety and Inspection Service

IFSAC History• IFSAC was established in 2011 by:
−The Centers for Diseases Control and Prevention (CDC); −The U.S. Department of Agriculture’s Food Safety and Inspection
Service (USDA-FSIS); and−The Food and Drug Administration (FDA).
• Guided by a Charter written in 2011 and updated in 2016.• Developed Strategic Plans for 2012-2016 and 2017-2021.
5

Why IFSAC is NeededPurpose• Work collectively to:
− Analyze and interpret human surveillance and food contamination data;− Share data and methods; and− Monitor progress toward the goal of preventing foodborne illness.
Goals• Identify, plan, and conduct selected food safety and foodborne illness
analytic projects recognized as high priority by all three agencies.− Foodborne illness source attribution (the proportion of foodborne illnesses that can be
attributed to specific foods) is the current focus of IFSAC’s activities.• Improve coordination of federal food safety analytic efforts.• Address cross-cutting priorities for food safety data collection, analysis, and
use.6

How IFSAC WorksInteragency collaboration that:
−Builds on a history of working together on source attribution.−Applies advances in source attribution methods.−Leverages knowledge, expertise, and data among agencies.−Drives an efficient structure guided by strategy.−Prioritizes communications and stakeholder input.
7

Shared Structure and StrategySteering Committee (SC)
− Senior members from each Agency able to commit resources.− Annual rotation of chairperson among agencies.− Assesses, approves and oversees IFSAC projects.
Technical Workgroup (TWG)− Designated group of Agency experts and analysts.− Develops proposals and executes plans for IFSAC projects.− Coordinates IFSAC activities within each Agency.
Communications Workgroup (CWG)− Develops communication materials (conference materials, webinars, press releases, etc.).− Coordinates with Agency communications specialists to ensure harmonization of
materials and messaging.− Develops harmonized responses to media or other external inquires.
Project Teams− Assigned Agency experts performing specific projects.
8

Outreach and Information SharingEstablished IFSAC website
− https://www.cdc.gov/foodsafety/ifsac/index.htmlPublications, Manuscripts, and Reports
− IFSAC. 2015. Foodborne illness source attribution estimates for Salmonella, E. coli O157, Listeria monocytogenes, and Campylobacter using outbreak surveillance data: Report.
− Comparing Characteristics of Sporadic and Outbreak-Associated Foodborne Illnesses, United States, 2004–2011. Emerging Infectious Diseases. July 2016.
− An Updated Scheme for Categorizing Foods Implicated in Foodborne Disease Outbreaks: A Tri-Agency Collaboration. Foodborne Pathogens and Disease. December 2017.
− Working Title: Statistical Modeling to Attribute Foodborne Illnesses Caused by Four Pathogens to Food Sources. In development.
Invited Presentations− UGA Industry Safe Foods Forum− National Restaurant Association Panel − Poultry Health, Processing, and Live Production Meeting
9

Outreach and Information Sharing, ContinuedScientific Presentations
− Society for Risk Assessment (SRA)− Council for State and Territorial Epidemiologists (CSTE)− International Association of Food Protection (IAFP)− Association of Food and Drug Officials (AFDO)
Media Appearances− Emerging Infectious Diseases Journal Podcast (2016)− Food Chemical News (2017)
Public Meetings − 2012, 2015
Webinars− 2013: Improving the Categories Used to Classify Foods Implicated in Outbreaks− 2014: Are Outbreak Illnesses Representative of Sporadic Illnesses?− 2017: Strategic Plan and Future Directions
10
Introduction
11
Dr. Joanna Zablotsky KufelUSDA Food Safety and Inspection Service

Approaches to Foodborne Illness Source Attribution
• Analysis of aggregated outbreak data• Sporadic epidemiological studies
−Case-control, case-case, case exposure ascertainment
• Pathogen subtype matching models• Quantitative microbial risk assessment• Structured expert elicitation
12

Outbreak-based Source Attribution• A foodborne outbreak occurs when two or more people get
the same illness from the same contaminated food or drink.• Outbreak data is useful for attribution studies because it
explicitly links illnesses to identified food vehicles.• Data are collected at the national level and are available over
time.• Outbreak-based source attribution presumes that food sources
of outbreaks are similar to those of sporadic disease.
13

IFSAC Estimates for 2012 • We developed a robust and novel approach for estimating foodborne illness
source attribution for Salmonella, E. coli O157, Listeria monocytogenes, and Campylobacter based on 15 years (1998-2012) of FDOSS outbreak data. This approach:−Used a food categorization scheme aligned with regulatory needs;−Addressed biases and adjusted for outbreak size;−Down-weighted the influence of older data; and−Used Bayesian bootstrapping to calculate uncertainty around estimates
• In 2015, IFSAC published these estimates:−Presented at a public meeting − Short Report published on IFSAC webpage −Media coverage−Developing manuscript on this method
14

Developing Estimates for 2013• Building on this approach, IFSAC developed a framework to publicly
provide regularly updated, harmonized attribution estimates.• Today, IFSAC is providing updated estimates for 2013 using the same
data source and modeling approach, with some modifications.
15

MethodsMichael BatzU.S. Food and Drug Administration
16

Our Overall Approach• Follows the approach we used in estimates for 2012, published in 2015.
• U.S. foodborne outbreaks with single pathogen & single food vehicle, 1998-2013.
• Most outbreak-based efforts calculate proportions of outbreak events or outbreak-associated illnesses that can be attributed to a food category.
• Rather than use reported illnesses, we use statistical modeling to mitigate the influence of outliers and incorporate epidemiological factors into estimates.
• We also give greater weight in the estimates to more recent outbreaks, which is different than previous efforts.
• We then use model-estimated illnesses as the basis for attribution calculations.
• Manuscript is in development, so the methods may evolve based on peer review, and we may incorporate further enhancements in the future.
17

U.S. Outbreak Data• Public health agencies in states and localities have primary
responsibility for identifying and investigating outbreaks and use a standard form to report outbreaks to CDC.
• Electronic reporting started in 1998, now done through the National Outbreak Reporting System (NORS).
• Foodborne outbreak reports are collected in FDOSS and include data on:− Date of first illness− Location (state or states)− Causal pathogen(s) − Food vehicle(s) implicated− Number of reported and laboratory-confirmed illnesses− Additional contributing factors
18

Data DecisionsThree key assumptions about which data to include in the analysis1. Include outbreaks with suspected and confirmed etiology (causal pathogen)
• “Confirmed” means the pathogen has been confirmed by laboratory analysis of isolates from multiple patients or from an epidemiologically implicated food.
• 90% of outbreaks have confirmed pathogen; of those without confirmed pathogen, 95% have one lab-confirmed illness.
• No significant differences found between outbreaks with confirmed and suspected pathogen.
• Including outbreaks with suspected pathogens does not change estimates, but does tighten credibility intervals.
2. Include outbreaks with suspected and confirmed implicated foods3. Include all reported outbreak illnesses, not only those that were
laboratory-confirmed
19

17,342 foodborne disease outbreaks, 1998-2013
2,919 (16.8%) outbreaks due tonon-typhoidal Salmonella, STEC O157, Listeria
monocytogenes, or Campylobacter
2,831 (97.0%) outbreaks due toa single pathogen
1,748 (61.7%) outbreaks with identified food vehicles
1,046 (59.8%) outbreaks could be assigned to a single food category
1,043 (99.7%) outbreaksreported by U.S. states
176 (16.9%) outbreaks due to Campylobacter
26 (2.5%) outbreaks due to
Listeria monocytogenes
203 (19.5%) outbreaks due to
STEC O157
451 (43.2%) outbreaks due to other Salmonella
serotypes
187 (17.9%)outbreaks due to
Salmonella Enteritidis
3 (0.3%) reported by U.S. outlying territories
702 (40.2%) could not be assigned to single food
1,083 (38.3%)without associated foods
88 (3.0%) due to multiple pathogens
14, 423 (83.2%)due to other etiologies
Data preparation
20
1,043 outbreaks used in analysis representabout 37% of the 2,831 outbreaks caused by one of the four priority pathogens

Food hierarchy
21
All foods
Land Animals
Meat-Poultry
Meat
Beef
Pork
Other meat
Poultry
Chicken
Turkey
Other poultry
Game Dairy Eggs
Aquatic Animals
Fish
Shellfish
Other aquatic animals
Plants
Grains-beans Nuts-seeds Oils-sugars Produce
Fruits Vegetables
Fungi
Herbs
Root-underground
Seeded vegetables
Sprouts
Vegetable row crops
Other
* Food categories aggregated due to sparse data
Other produce*Other seafood*
Other meat and poultry*
For more on the IFSAC food categorization scheme, see Richardson et al. 2017 https://doi.org/10.1089/fpd.2017.2324 Visit the IFSAC webpage at https://www.cdc.gov/foodsafety/ifsac/projects/food-categorization-scheme.html for a text version of the chart

Number of reported outbreaks by pathogen, food category, and year
22See data tables at https://www.cdc.gov/foodsafety/ifsac/files/Page22data.csv

Variance in Outbreak Size
• Highly variable outbreaksize (2 to 1,939 illnesses peroutbreak).
• Highly skewed –many small outbreaks, afew huge ones.
• Log-transformationnormalizes the distributionof outbreak size.
23See data tables at https://www.cdc.gov/foodsafety/ifsac/files/Page23data.csv

Epidemiological Factors• Implicated foods
− 17 food categories
• Geographical information− Multi-state: exposures occurred in multiple states− Single-state: exposures occurred in a single state
• Location of food preparation− Private homes− Restaurants− Other (e.g. banquet, hospital, school, prison)− Multiple locations− Unknown
24

Variation in Outbreak Size Across Epidemiological Factors
25
Each line in each panel represents a single outbreak by pathogen and categorical variable. Within each panel, the grouped means of outbreak size by category (for that pathogen) are on the left, with reported values of individual outbreaks (by pathogen) to the right. See date tables at https://www.cdc.gov/foodsafety/ifsac/files/dataforPage25_msfoodprep_v2.xlsx
Salmonella

Variation in Outbreak Size Across Epidemiological Factors
26
Each line in each panel represents a single outbreak by pathogen and categorical variable. Within each panel, the grouped means of outbreak size by category (for that pathogen) are on the left, with reported values of individual outbreaks (by pathogen) to the right. See data tables at https://www.cdc.gov/foodsafety/ifsac/files/dataforPage26_msfoodprep_v2.xlsx

Modelling Outbreak Illnesses• For each pathogen, an analysis of variance (ANOVA) model of the log-
transformed number of illnesses has the form:Log ill = α +β1(Multi-state) + β2(Prep location) + β3(Food category)
where Multi-state: whether an outbreak occurred in a single state or multiple states Prep location: Type of food preparation location (restaurant, private home, etc.) Food category: one of 17 food categories
• Log ill are back-transformed (eLog ill) to obtain model-estimated illnesses.• Each outbreak was thus assigned a model-estimated number of
illnesses. For example:− All single-state (β1) Campylobacter outbreaks in which food was prepared in a
restaurant (β2) and the implicated food was Chicken (β3) were assigned the same model-estimated number of illnesses.
27

FigureLegend Proportion of total information by time period
Exponential Factor (a) Years of Data1998 - 2003 2004 - 2008 2009 - 2013
8/10 (0.8) 11% 31% 58%
5/7 (0.71) 5% 28% 67%
1/2 (0.5) <1% 16% 83%
1/5 (0.2) 0% 5% 95%
Down-weighting Older Outbreaks• Outbreaks from most recent
5 years given full weight.
• Outbreaks from each earlieryear given exponentiallylower weight.
• Weighting factor w for year yis given by:
where Y is 2013 (the final year of data)
28See data tables at https://www.cdc.gov/foodsafety/ifsac/files/Page28data.csv

Attribution Percentages & Uncertainty• For a given pathogen, we calculate the attribution percentage for a
specific food category as the weighted sum (only the early years are down-weighted) of model-estimated illnesses for that food category divided by the total weighted sum of model-estimated illnesses over all food categories.− For example, of the total 6,159 (down-weighted, model-estimated) outbreak
illnesses due to Salmonella, 1,022 of these illnesses were associated with Seeded Vegetables; therefore, we attribute 16.6% (1,022/6,159) of foodborne Salmonellaillnesses to Seeded Vegetables.
• We account for uncertainty in the estimates by forming 90% credible intervals around the estimates using Bayesian bootstrap resampling.
29

Excluding Campylobacter/Dairy• We exclude outbreaks associated with the Dairy category from attribution
percentage calculations for Campylobacter:− The majority of Campylobacter outbreaks were associated with unpasteurized milk, but
raw milk is a high-risk product not widely consumed by the general population.− Thus, these outbreaks likely over-represent Dairy as a source of overall (e.g. non-
outbreak) Campylobacter illness.− Epidemiological studies of sporadic campylobacteriosis assign very low attribution
percentages to dairy products and identify chicken as the most significant food vehicle.− Structured expert elicitations also quantify the attribution percentage to dairy products
overall to be quite low.
• We, therefore, estimated attribution percentages for non-Dairy food categories.
• Removing Dairy outbreaks resulted in Campylobacter attribution percentages more consistent with the published literature.
30

ResultsDr. LaTonia RichardsonU.S. Centers for Disease Control and Prevention
31
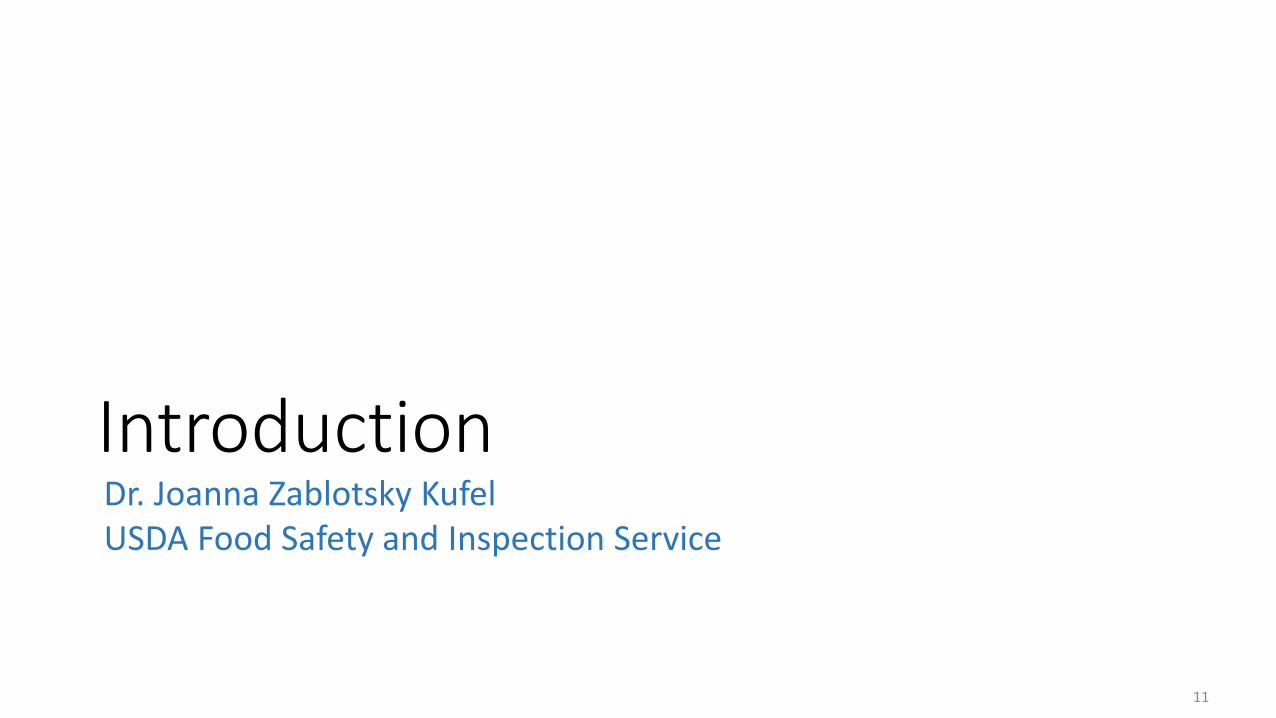
Foodborne Illness Source Attribution Estimates for 2013
32Updated 4/27/2018

Based on a model using multi-year outbreak data that gives equal weight to each of the most recent five years of data (2009 – 2013) and exponentially less weight to each earlier year (1998–2008).
• Over 75% of illnessesattributed to sevenfood categories.
• No statisticallysignificant differencesin the estimatedattribution amongmost food categories.
33
SalmonellaSource Attribution Estimates and 90% Credibility Intervals

Based on a model using multi-year outbreak data that gives equal weight to each of the most recent five years of data (2009 – 2013) and exponentially less weight to each earlier year (1998–2008).
• 80% of illnesses attributed to Vegetable Row Crops and Beef.
• Credibility intervals for Beef and Vegetable Row Crops categories overlap; no statistically significant difference between their estimated attribution percentages.
• No illnesses attributed to Pork, Eggs, Other Seafood, Grains-Beans, or Oils-Sugars.
34
E. coli O157Source Attribution Estimates and 90% Credibility Intervals

Based on a model using multi-year outbreak data that gives equal weight to each of the most recent five years of data (2009 – 2013) and exponentially less weight to each earlier year (1998–2008).
• Nearly 90% of illnesses attributed to Fruits and Dairy.
• Credibility intervals for Fruits and Dairy categories were wide and overlapped.
• No illnesses attributed to Other Meat/Poultry, Game, Eggs, Fish, Other Seafood, Grains-Beans, Oils-Sugars, Seeded Vegetables, or Other Produce.
35
Listeria monocytogenesSource Attribution Estimates and 90% Credibility Intervals

† Campylobacter estimates exclude results derived from Dairy outbreak data
• Almost 80% of non-Dairy illnesses attributed to five food categories.
• No statistically significant differences in the estimated attribution were found among most food categories.
• Attribution percentage for Dairy not presented because most foodborne Campylobacteroutbreaks were associated with unpasteurized milk, which is not widely consumed.
36
CampylobacterSource Attribution Estimates and 90% Credibility Intervals

Discussion
37

Key Findings• Illnesses from Salmonella and Campylobacter are broadly attributed
across multiple food categories, which suggests that interventions designed to reduce illnesses from these pathogens need to target a variety of food categories.
• In contrast, E. coli O157 and Listeria monocytogenes illnesses were attributed to fewer food categories, which suggests more targeted interventions.
• The occurrence of outbreaks due to novel pathogen-food category pairs, such as an E. coli O157 outbreak due to soy nut butter in 2017, mandates vigilance in seeking unrecognized food sources of outbreaks and illnesses.
38

Campylobacter Results• The attribution percentage for Dairy is not presented in the
Campylobacter figure for several reasons: − Most Campylobacter outbreaks included in the database were associated with
unpasteurized milk, which is not widely consumed by the general population, and− Campylobacter outbreaks in the Dairy food category (which accounted for 68% of
the total Campylobacter attribution) appear to over-represent Dairy as a source of Campylobacter illness.
• After removing the Dairy outbreaks, the Chicken attribution increased from 9% to 29%, which is consistent with published literature.
39

Evaluating our Methods• We compared results based on model-estimated illnesses to those
based on reported illnesses.• We conducted a number of sensitivity analyses around model
assumptions and data:− Down-weighting older data;− Alternative ANOVA model specifications;− Sensitivity to outliers; and− Etiology status (confirmed/suspected).
• We found our estimates robust to outliers, with a single exception:− A single large outbreak linked to cantaloupes in 2011 had a major influence on the
Listeria monocytogenes attribution estimates.
40

Limitations• Outbreaks account for a small proportion of overall foodborne illnesses.
− Jones et al. 2004 https://doi.org/10.1086/381599
• Many outbreaks don’t implicate a single food.• For pathogens with a small number of outbreaks, very large outbreaks can
have substantial influence on the attribution point estimate.• This analysis only included 36% of reported outbreaks caused by the four
priority pathogens, which may not be representative of all outbreaks from these pathogens.
• Nearly 10% of illnesses in our analysis occurred among institutionalized populations, such as those in prisons, hospitals, and schools; these populations allow easier identification of cases, allow for more complete data collection, have fewer food options, and are not representative of the general population.
41

Conclusions• Our approach addresses a number of issues with outbreak-based
foodborne illness source attribution:− Used a food categorization scheme aligned with regulatory needs;− Addressed biases and adjusted for outbreak size;− Down-weighted the influence of older data; and− Calculated uncertainty around estimates.
• Nevertheless, our estimates are subject to limitations, uncertainties, and biases.
42

Conclusions, Continued• These estimates should not be interpreted as suggesting that all foods in
a specific food category are equally likely to transmit pathogens.• Caution should also be exercised when comparing estimates across
years, as a decrease in a percentage may result, not from a decrease in the number of illnesses attributed to that food, but from an increase in illnesses attributed to another food.
• These estimates are for 2013 and do not include recently reported outbreaks from 2014-2017.
43

Conclusions, Continued• This robust analytic approach facilitates IFSAC’s ability to produce regularly
updated, harmonized attribution estimates, which provide consistency in the use and interpretation of estimates across agencies.
• These estimates can inform food safety decision-making and provide pathogen-specific direction for reducing foodborne illness.
• Annual updates to these estimates will enhance IFSAC’s efforts to inform and engage stakeholders, and further the ability to assess whether prevention measures are working.
• IFSAC continues to enhance attribution efforts by working on projects that address limitations, including further exploration of Campylobacterattribution, and inclusion of foods with ingredients assigned to more than one food category.
44

Question and Answer Period
45

Please contact us!
IFSAC E-Mail Address: [email protected]
IFSAC Webpage: http://www.cdc.gov/foodsafety/ifsac/index.html
46