Embed Size (px)
Citation preview

Welcome to E.ON AG‘s Conference CallNine Months ResultsJanuary 1 – September 30, 2002
November 14, 2002

These charts contain certain forward-looking statements that are subject to risk and uncertainties. For information identifying economic, currency, regulatory, technological, competitive, and some other important factors that could cause actual results to differ materially from those anticipated in the forward-looking statements, you should refer to E.ON’s filings to the Securities and Exchange Commission (Washington, DC), as updated from time to time, in particular to the discussion included in the section of E.ON’s 2001 Annual Report on Form 20-F entitled ”Item 3. Key Information: Basic Risk Factors”.

Major changes in the scope of consolidation
1
Fully consolidated As of
July 1, 2002
May 1, 2001June 1, 2001April 1, 2002June 1, 2002July 1, 2002
August 1, 2002
April 1, 2001
October 1, 2001January 1, 2002January 1, 2002
EnergyPowergenE.ON Energie
SydkraftHeingasEspoon SähköEnergie Aktiengesellschaft Mitteldeutschland (EAM)Elektrizitätswerke Wesertal (EWW)Elektrizitätswerke Minden-Ravensberg (EMR)
ChemicalsLaporte
Real EstateViterra
WohnBau Rhein-Main (WBRM)DeutschbauFrankfurter Siedlungsgesellschaft (FSG)

+/- %2002
E.ON Group – SalesNine Months in million €
E.ON Energie*
Powergen
Other Activities
Chemicals
Real Estate
Other/Consolidation
Total
2001
14,077
1,521
10,088
8,903
1,185
50
25,736
11,988
-
14,601
13,720
881
3,771**
30,360
+17
-
-31
-35
+35
-99
-15
2
*) Results from energy trading activities are recognized net due to the application of EITF 98-10. Sales for the current and prior year were adjusted to facilitate comparability
**) includes Telecommunications and Klöckner & Co

+/- %2002
E.ON Group - Internal Operating ProfitNine Months in million €
E.ON Energie
Powergen
Other Activities
Chemicals
Real Estate
Other/Consolidation*
Total
2,286
143
734
517
217
15
3,178
2001
1,506
-
688
571
117
147
2,341
+52
-
+7
-9
+85
-90
+36
3*) includes Telecommunications and Klöckner & Co (in 2001)
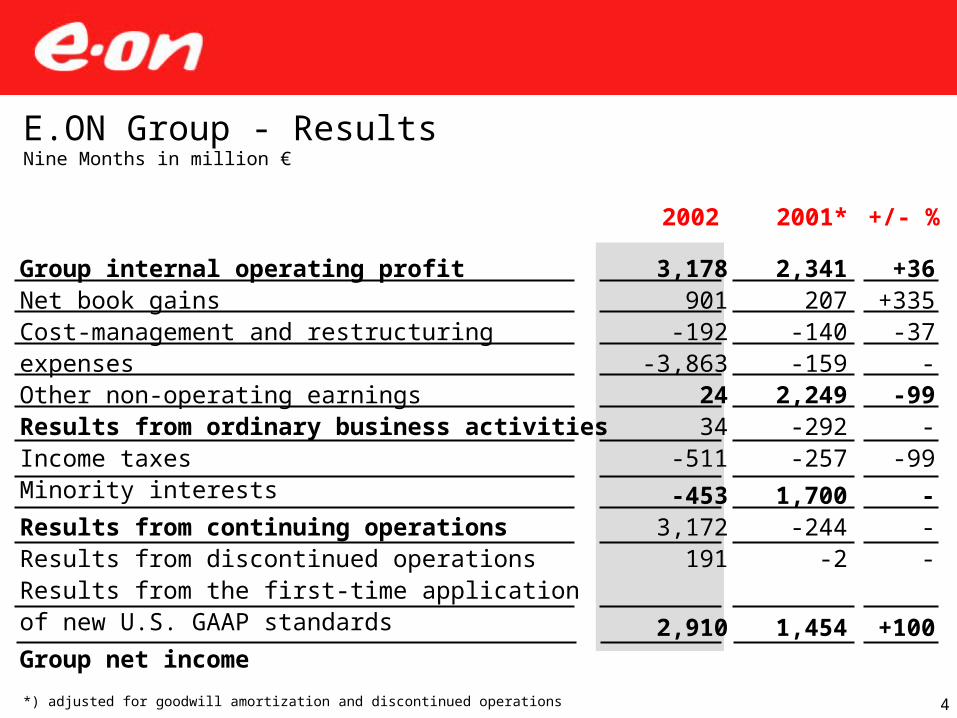
Group internal operating profitNet book gainsCost-management and restructuring expensesOther non-operating earningsResults from ordinary business activitiesIncome taxesMinority interests
Results from continuing operationsResults from discontinued operationsResults from the first-time application of new U.S. GAAP standards
Group net income
2,341207
-140-159
2,249-292-257
1,700-244
-2
1,454
+/- %2002
E.ON Group - ResultsNine Months in million €
2001*
3,178901
-192-3,863
2434
-511
-4533,172
191
2,910
+36+335
-37-
-99-
-99
---
+100
4*) adjusted for goodwill amortization and discontinued operations

Powergen – One-off value adjustment on goodwill
5
The one-off value adjustment was mainly due to the following reasons:
• Since the introduction of the New Electricity Trading Arrangements (NETA) wholesale prices in the UK declined by approx. 25 %
• Lower electricity prices and higher fuel costs in the unregulated business in the US impaired earnings at LG&E Energy
• The ongoing economic crisis and a substantial devaluation of the peso
negatively affected our natural gas distribution business in Argentina
Value adjustment has no impact on cash flow

Net income (€ in millions)
Weighted average number of outstanding shares (in thousands)
Earnings per share
- from continuing operations
E.ON Group – Earnings per shareNine Months in €
6*) adjusted for goodwill amortization and discontinued operations
2002
2,910
652,147
4.46
-0.69
2001*
1,454
677,743
2.14
2.51

2002
305.8
114.0
84.6
186.7
14,07
7
658
3,567
2,424
2,286
2001 +/- %
E.ON Energie - Key FiguresNine Months in million €
Electricity sales volume (in bn kWh)
Electricity generation volume (in bn KWh)
Natural gas sales volume (in bn kWh)
Water sales volume (million m3)
Sales
thereof: electricity taxes
EBITDA
EBIT
Internal operating profit
212.9
104.2
60.9
177.1
11,988
388
2,791
1,508
1,506
+44
+9
+39
+5
+17
+70
+28
+61
+52
7

2002
19.218.98.4
1,521354212143
45116-18
Powergen - Key FiguresNine Months in million €
Electricity sales volume (in bn kWh)Electricity generation volume (in bn KWh)Natural gas sales volume (in bn kWh)SalesEBITDAEBITInternal operating profit
thereof: UKthereof: USAthereof: Corporate Center/Others
8

Other Activities - Key FiguresNine Months in million €
SalesEBITDAEBITInternal operating profit
9
Real Estate
1,185480344217
881260178117
2002 2001 +/- %+35+85+93+85
Chemicals
8,9031,347
733517
13,7201,561
881571
2002 2001 +/- %-35-14-17-9

30.9.2002
3,481
7,035
10,516
-20,107
-3,322
-23,429
(12,913)
31.12.2001
E.ON Group - Net financial positionIn million €
Bank deposits
Securities/funds (current assets)
Total liquid funds
Bonds/Bank liabilities
Financial liabilities to third parties
Total financial liabilities
Net cash (net debt)
4,080
8,064
12,144
-11,883
-874
-12,757
(613)
10

E.ON Group - Net financial developmentIn billion €
11
Net financialposition as ofDec. 31, 2001
Net financialposition as ofSept. 30, 2002
Cash providedby (used for) continuing operations
Investmentsin fixed and financialassets
Divestments/deconsolidations
Dividends Consolidationof acquisitions
Currencyeffects
-0.6
4.2
12.9
-19.8-1.4
-7.8 -0.4 -12.9

E.ON Group - Outlook 2002Group internal operating profit to markedly exceed the previous year‘s high number
- E.ON Energie: Forecasting substantially higher internal operating profit for full-year 2002. However, internal operating profit growth rate for the full year will not be as high as in the first nine months
- Powergen: After financing costs, slightly negative impact on E.ON‘s Group internal operating profit
- Chemicals: Anticipate earnings in core businesses will be at the same level than the prior-year figure. Overall, internal operating profit will decline due to divestment program
- Viterra: Expecting higher internal operating profit
- Other/Consolidation: Further decline in internal operating profit due to interest expenses associated with the acquisition of Ruhrgas and Powergen
12
Group net income: If conditions in the capital market continue at current levels then, from today‘s perspective, further writedowns under U.S. GAAP for securities held would result in a lower group net income compared to last year‘s figure

Welcome to E.ON AG‘s Conference CallNine Months ResultsJanuary 1 – September 30, 2002 – Back-up charts
November 14, 2002
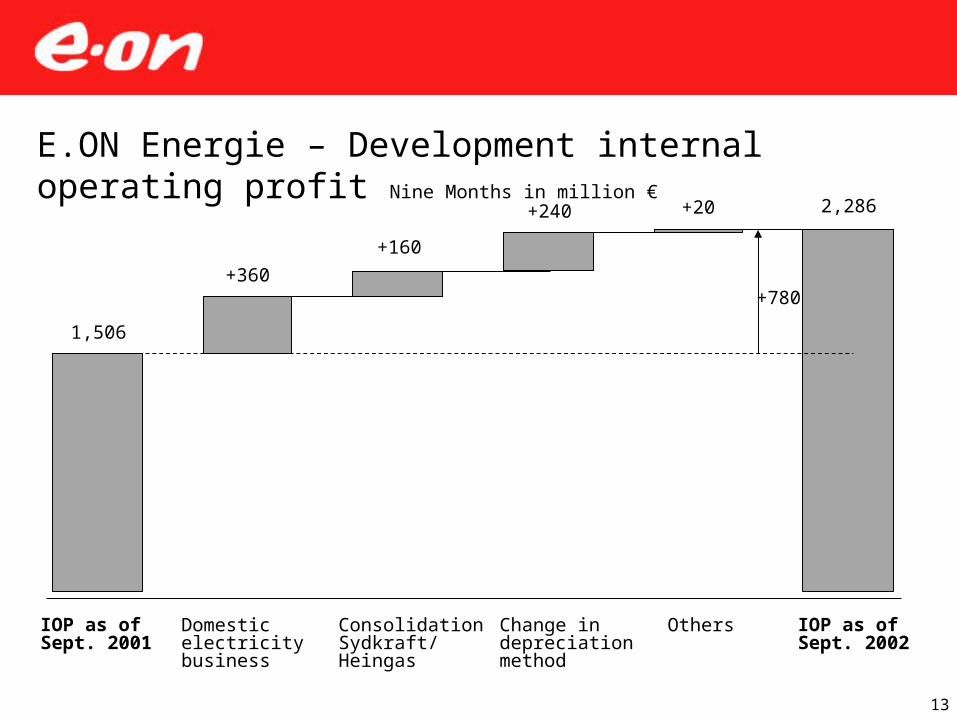
E.ON Energie – Development internal operating profit Nine Months in million €
13
IOP as ofSept. 2001
Domesticelectricity business
ConsolidationSydkraft/Heingas
Change indepreciationmethod
Others IOP as ofSept. 2002
1,506
+360
+160
+240 +20 2,286
+780

NineMonths
2002
3,178
-
3,154
-
24
2,910
4.46
-0.69
Adjustedfigures for
nine months2001
2,341
-92
-
2,249
1,454
2.14
2.51
Reported innine months
2001
2,858
-169
337
3,026
1,026
1.52
2.74
Goodwillamortization
379
38
-
417
428
0.62
0.52
Discontinuedoperations
E.ON Group – Adjusted Nine Months Results 2001 Nine Months in million €
Internal operating profit
Other non-operating income
E&P taxes
Results from ordinary business activities
Net income
Earnings per share from net income (in €)
Earnings per share from continuing
operations (in €)
-896
39
-337
-1,194
-
-
-0.75
14
Adjustments

E.ON Group – Other non-operating earningsNine Months in million €
15
Partial sale of Schmalbach-LubecaBook gains E.ON EnergieOtherNet book gainsDegussaViterraOtherRestructuring expensesPowergen - Goodwill impairmentWritedown of HypoVereinsbank sharesOtherOther non-operating earnings
2002
424604
-127901-136
-44-12
-192-2,391-1,230
-242-3,863
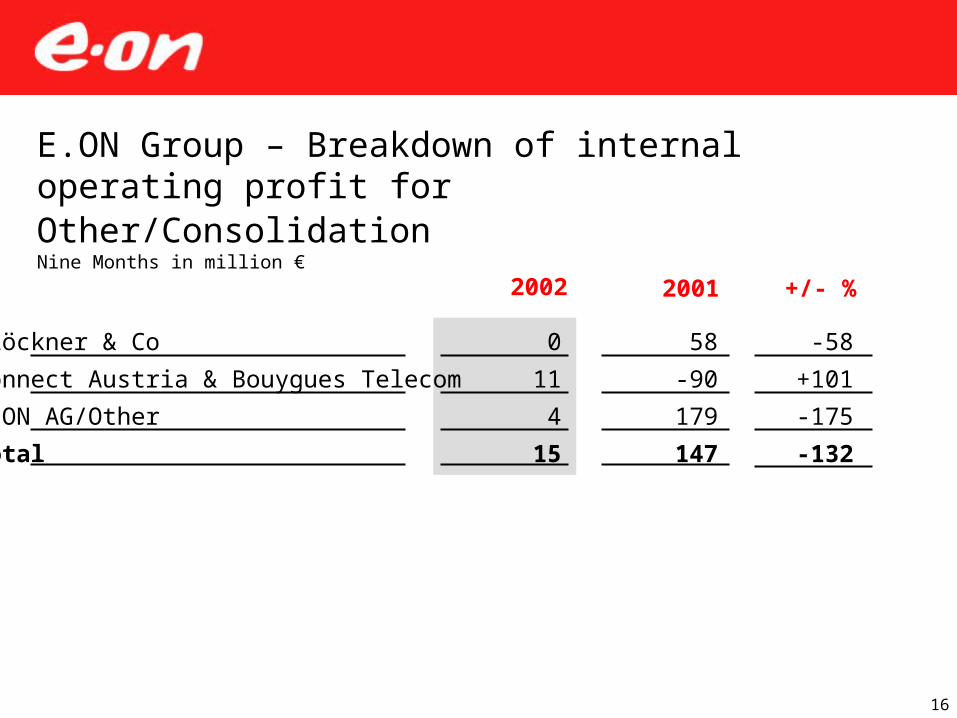
E.ON Group – Breakdown of internal operating profit for Other/Consolidation Nine Months in million €
16
2002
0
11
4
15
2001
Klöckner & Co
Connect Austria & Bouygues Telecom
E.ON AG/Other
Total
58
-90
179
147
+/- %
-58
+101
-175
-132

2002
1,614
954
649
-45
-
3,172
2001
E.ON Group – Breakdown of discontinued operations*Nine Months in million €
VEBA Oel
VAW
Stinnes
Degussa activities
MEMC
Total
277
186
96
24
-827
-244
17*) after taxes and minority interests

2002
28,030
56,195
83,076
138,476
305,77
8
2001 +/- %
E.ON Energie – Electricity sales volumeNine Months in GWh
Standard-rate customers
Industrial and commercial special-rate customers
Regional utilities
Trading
Total
25,131
46,960
85,959
54,811
212,861
+11.5
+19.7
-3.4
+152.6
+43.7
18
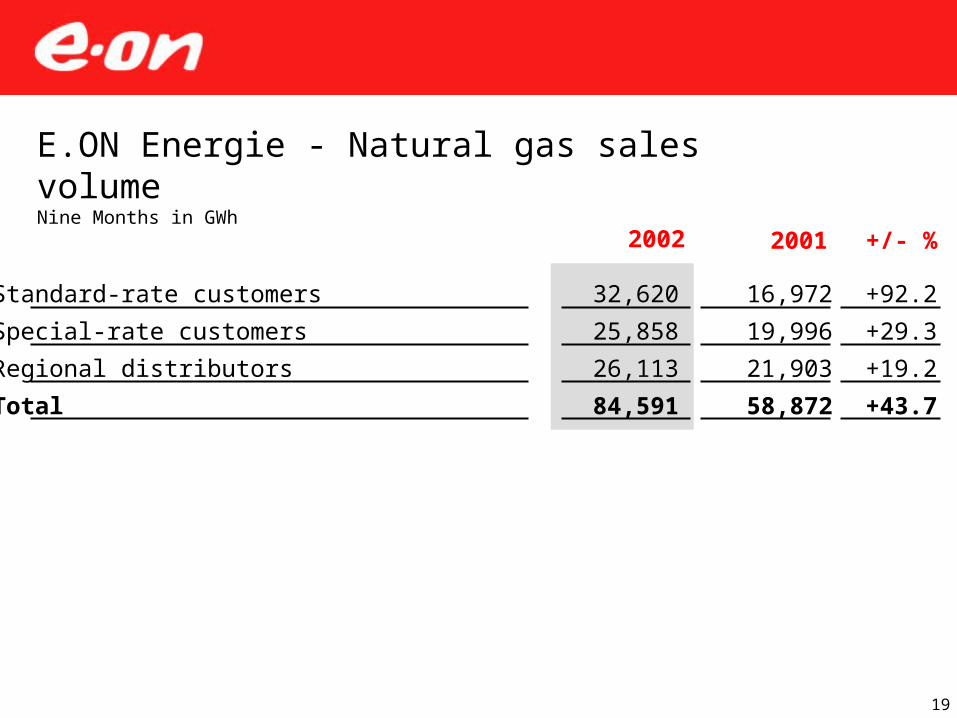
2002
32,620
25,858
26,113
84,591
2001 +/- %
E.ON Energie - Natural gas sales volumeNine Months in GWh
Standard-rate customers
Special-rate customers
Regional distributors
Total
16,972
19,996
21,903
58,872
+92.2
+29.3
+19.2
+43.7
19