Embed Size (px)
Citation preview
2014 first quarter results13 May 2014
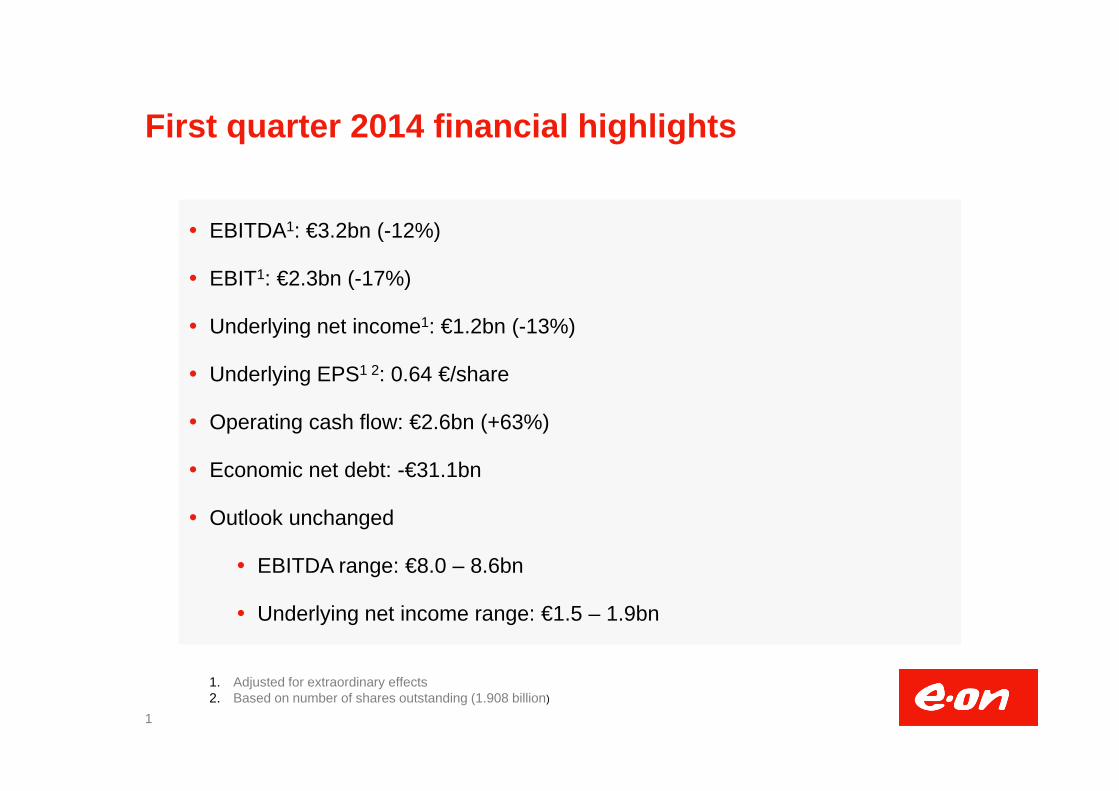
First quarter 2014 financial highlights
1
1. Adjusted for extraordinary effects2. Based on number of shares outstanding (1.908 billion)
EBITDA1: €3.2bn (-12%)
EBIT1: €2.3bn (-17%)
Underlying net income1: €1.2bn (-13%)
Underlying EPS1 2: 0.64 €/share
Operating cash flow: €2.6bn (+63%)
Economic net debt: -€31.1bn
Outlook unchanged
EBITDA range: €8.0 – 8.6bn
Underlying net income range: €1.5 – 1.9bn
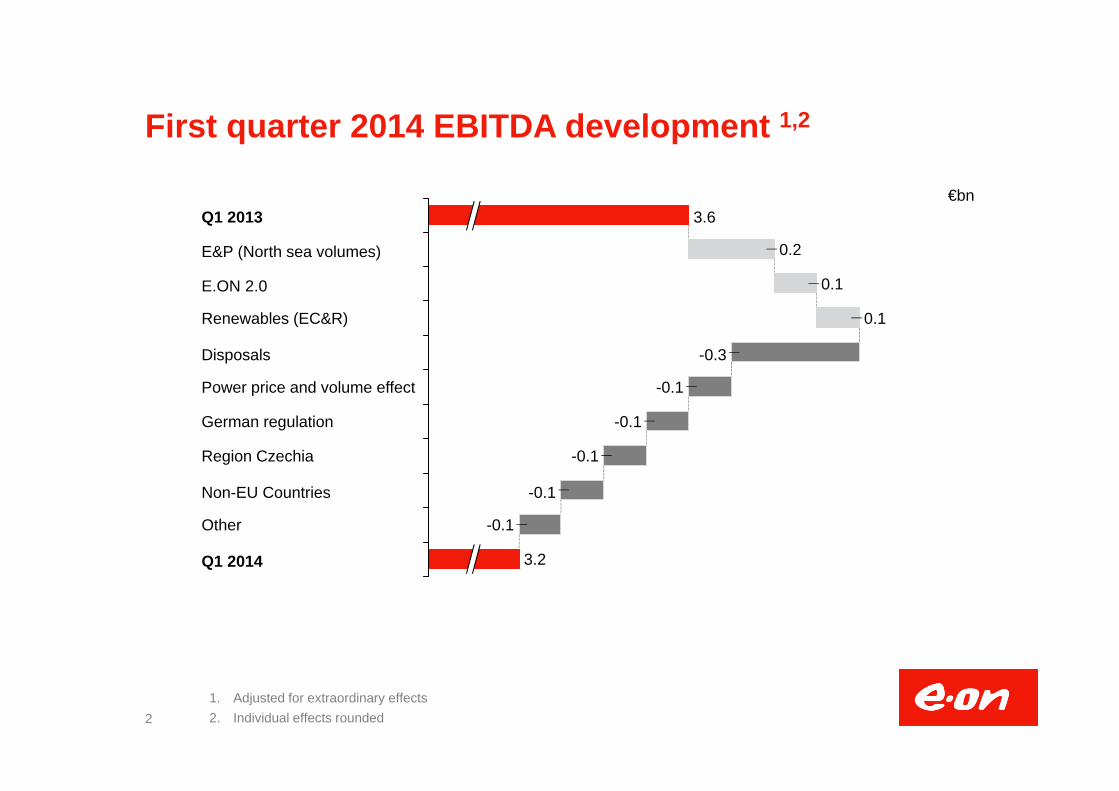
First quarter 2014 EBITDA development 1,2
21. Adjusted for extraordinary effects2. Individual effects rounded
Q1 2014 3.2
Other -0.1
Region Czechia -0.1
-0.1
-0.1
Power price and volume effect
Non-EU Countries
German regulation
-0.1
Disposals -0.3
Renewables (EC&R) 0.1
E.ON 2.0 0.1
E&P (North sea volumes) 0.2
Q1 2013 3.6€bn
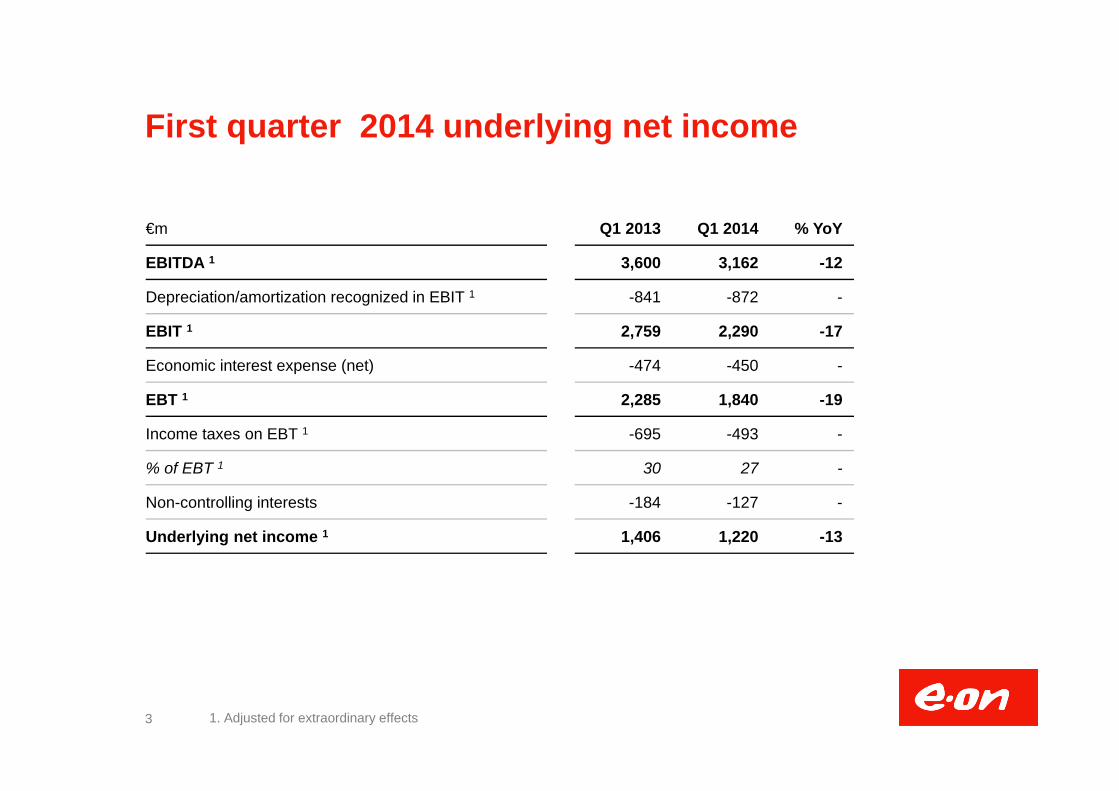
First quarter 2014 underlying net income
3 1. Adjusted for extraordinary effects
€m Q1 2013 Q1 2014 % YoY
EBITDA 1 3,600 3,162 -12
Depreciation/amortization recognized in EBIT 1 -841 -872 -
EBIT 1 2,759 2,290 -17
Economic interest expense (net) -474 -450 -
EBT 1 2,285 1,840 -19
Income taxes on EBT 1 -695 -493 -
% of EBT 1 30 27 -
Non-controlling interests -184 -127 -
Underlying net income 1 1,406 1,220 -13
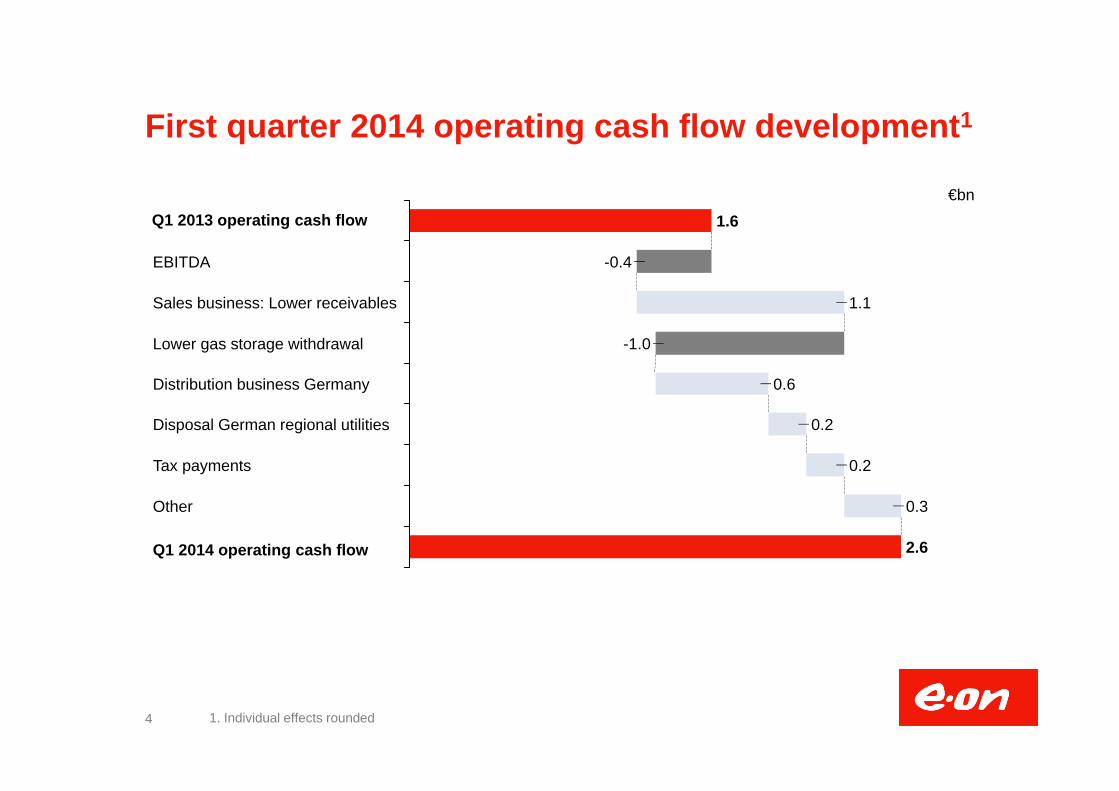
First quarter 2014 operating cash flow development1
4 1. Individual effects rounded
Q1 2013 operating cash flow
Q1 2014 operating cash flow 2.6
0.2
Other 0.3
Tax payments
0.2
Lower gas storage withdrawal
0.6Distribution business Germany
-1.0
Sales business: Lower receivables 1.1
EBITDA -0.4
1.6
Disposal German regional utilities
€bn
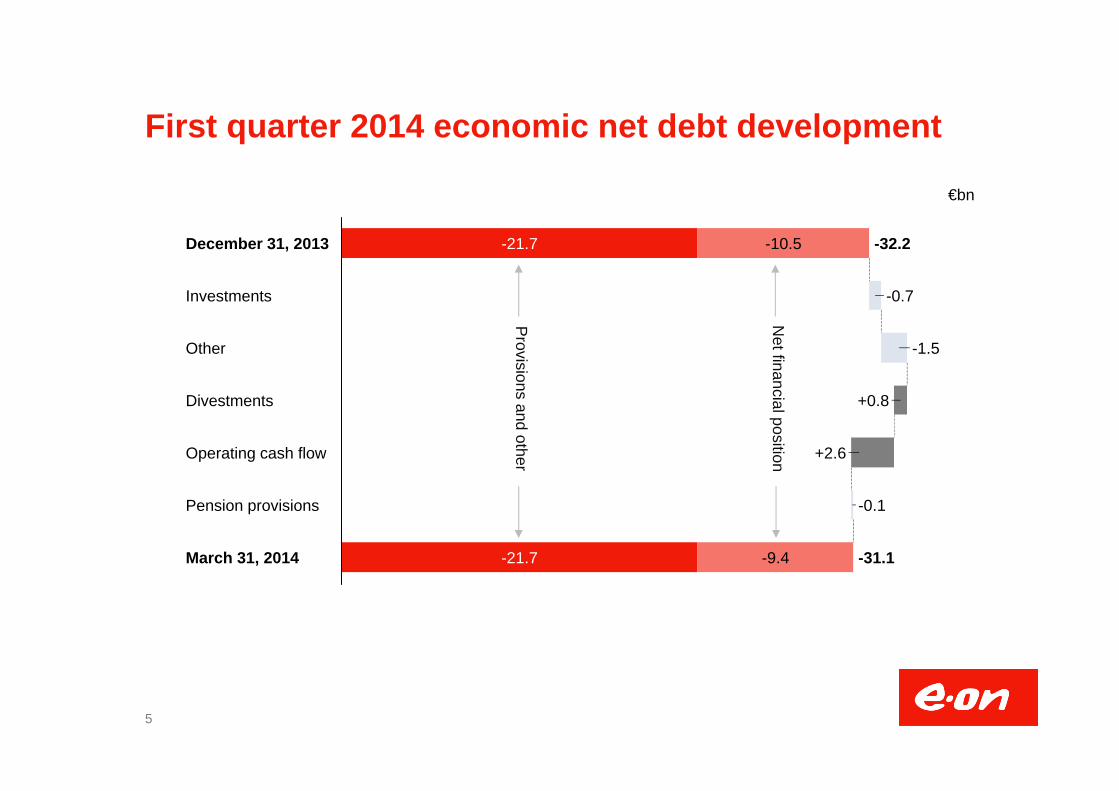
First quarter 2014 economic net debt development
5
March 31, 2014 -31.1-21.7 -9.4
Pension provisions -0.1
Operating cash flow +2.6
Divestments +0.8
Other -1.5
Investments -0.7
December 31, 2013 -32.2-21.7 -10.5
Net financialposition
Provisions
andother
€bn
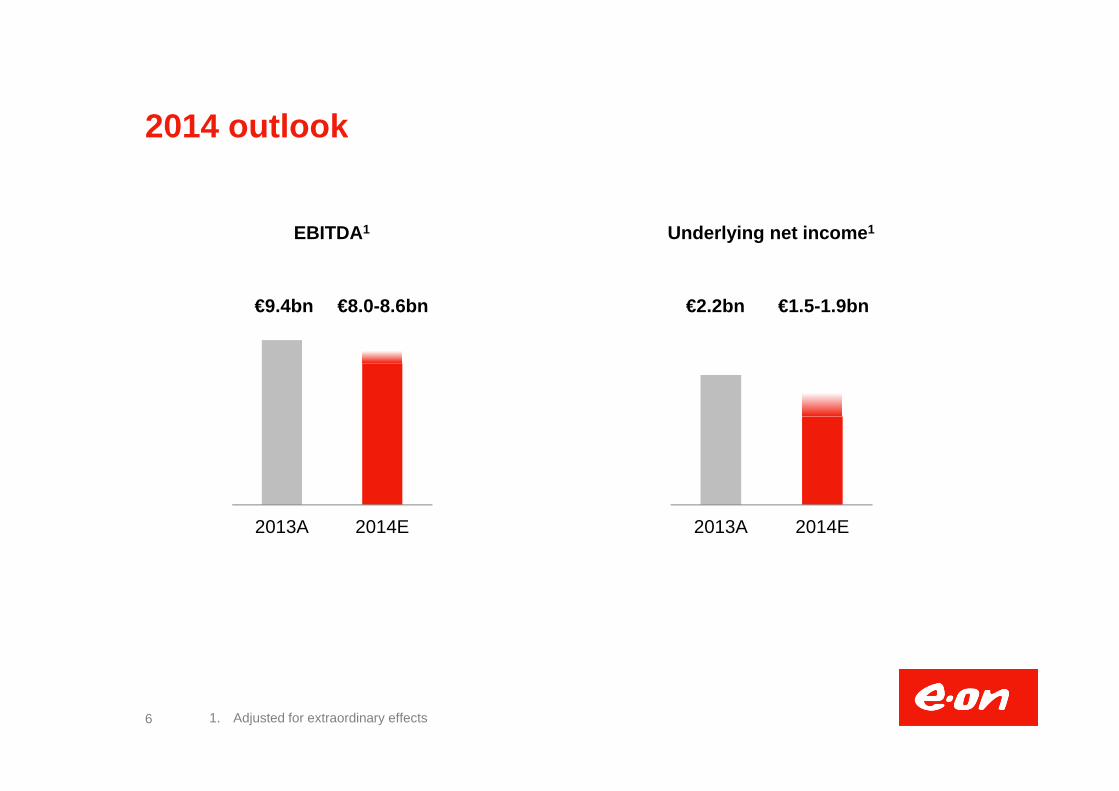
2014 outlook
2013A 2014E
6
EBITDA1
1. Adjusted for extraordinary effects
€9.4bn €8.0-8.6bn
2013A 2014E
€2.2bn €1.5-1.9bn
Underlying net income1

Backup
7
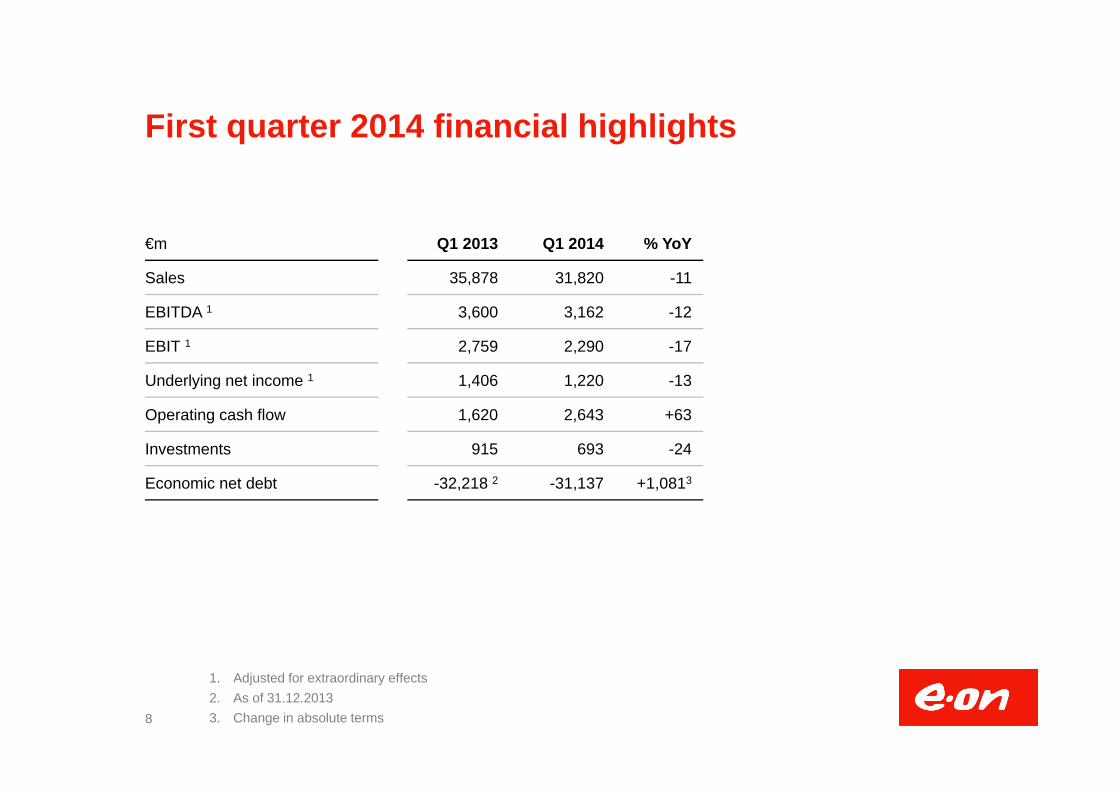
First quarter 2014 financial highlights
8
1. Adjusted for extraordinary effects2. As of 31.12.20133. Change in absolute terms
€m Q1 2013 Q1 2014 % YoY
Sales 35,878 31,820 -11
EBITDA 1 3,600 3,162 -12
EBIT 1 2,759 2,290 -17
Underlying net income 1 1,406 1,220 -13
Operating cash flow 1,620 2,643 +63
Investments 915 693 -24
Economic net debt -32,218 2 -31,137 +1,0813
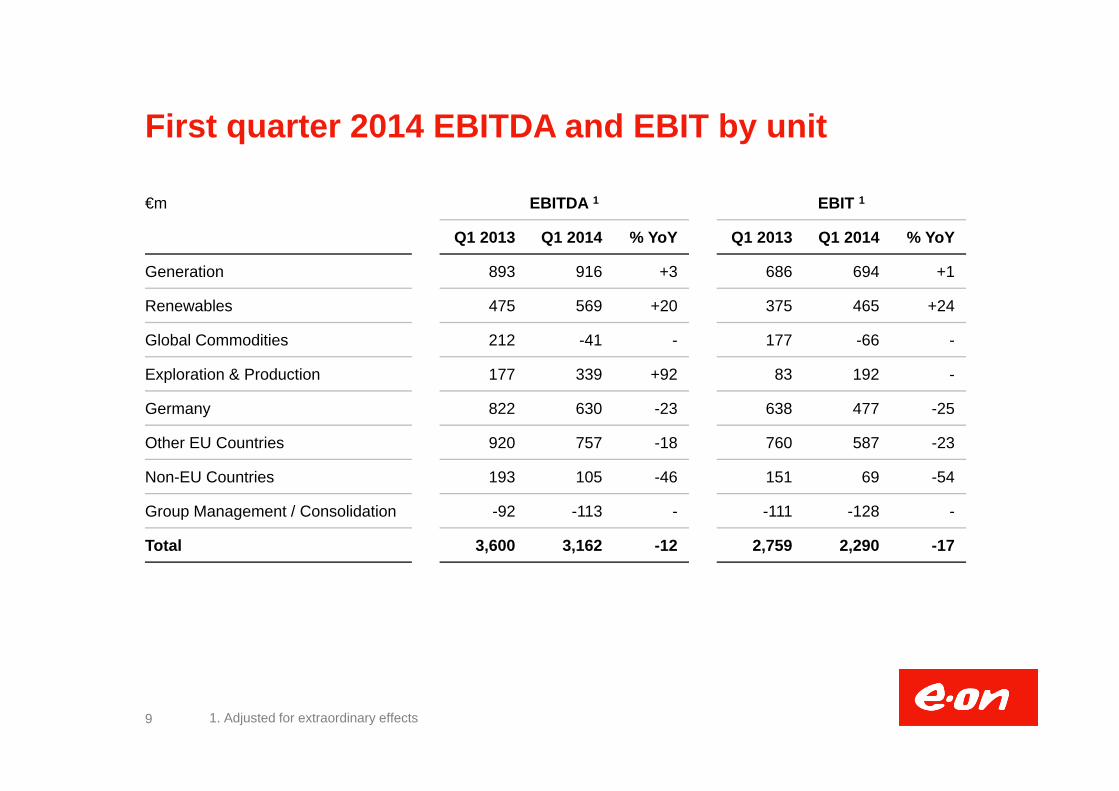
First quarter 2014 EBITDA and EBIT by unit
9 1. Adjusted for extraordinary effects
€m EBITDA 1 EBIT 1
Q1 2013 Q1 2014 % YoY Q1 2013 Q1 2014 % YoY
Generation 893 916 +3 686 694 +1
Renewables 475 569 +20 375 465 +24
Global Commodities 212 -41 - 177 -66 -
Exploration & Production 177 339 +92 83 192 -
Germany 822 630 -23 638 477 -25
Other EU Countries 920 757 -18 760 587 -23
Non-EU Countries 193 105 -46 151 69 -54
Group Management / Consolidation -92 -113 - -111 -128 -
Total 3,600 3,162 -12 2,759 2,290 -17
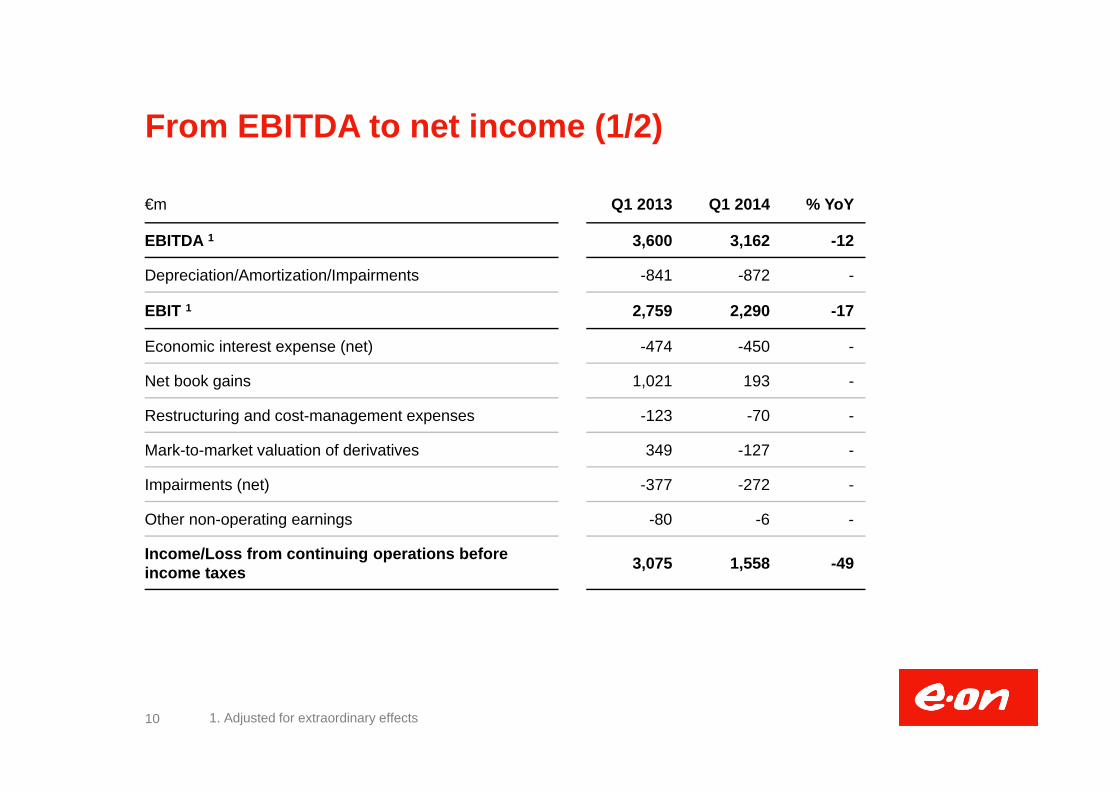
From EBITDA to net income (1/2)
10 1. Adjusted for extraordinary effects
€m Q1 2013 Q1 2014 % YoY
EBITDA 1 3,600 3,162 -12
Depreciation/Amortization/Impairments -841 -872 -
EBIT 1 2,759 2,290 -17
Economic interest expense (net) -474 -450 -
Net book gains 1,021 193 -
Restructuring and cost-management expenses -123 -70 -
Mark-to-market valuation of derivatives 349 -127 -
Impairments (net) -377 -272 -
Other non-operating earnings -80 -6 -
Income/Loss from continuing operations before income taxes 3,075 1,558 -49
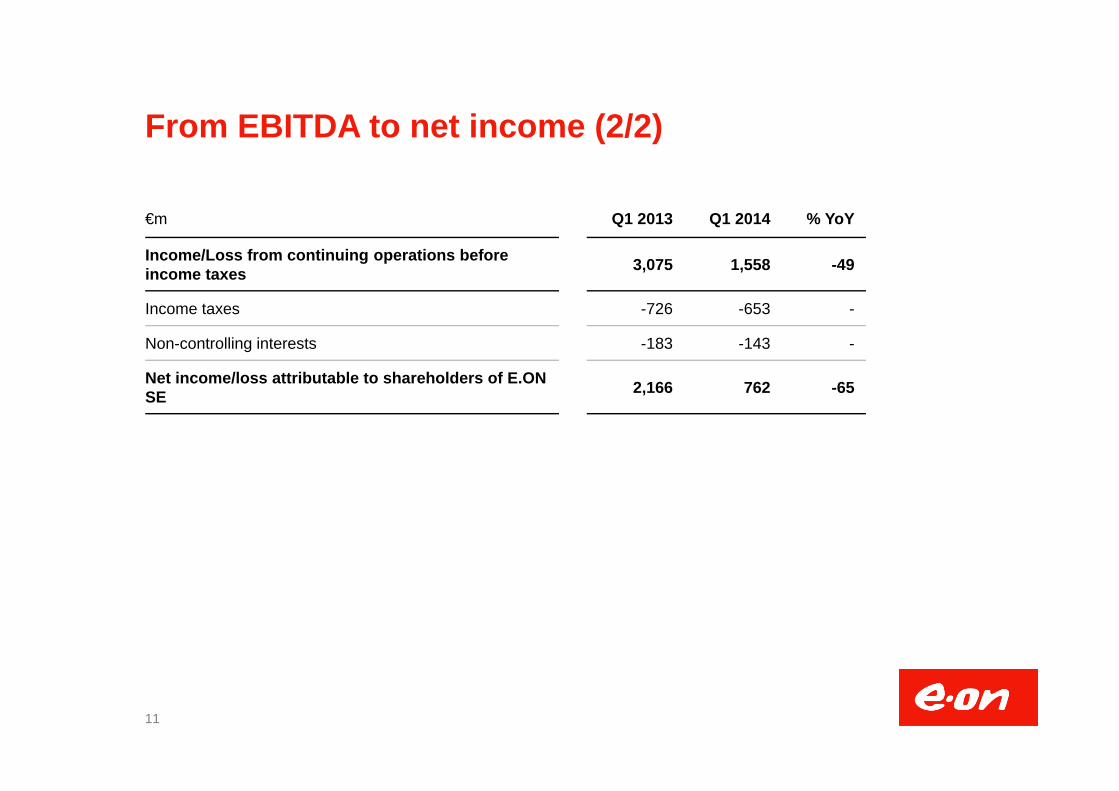
From EBITDA to net income (2/2)
11
€m Q1 2013 Q1 2014 % YoY
Income/Loss from continuing operations before income taxes 3,075 1,558 -49
Income taxes -726 -653 -
Non-controlling interests -183 -143 -
Net income/loss attributable to shareholders of E.ON SE 2,166 762 -65
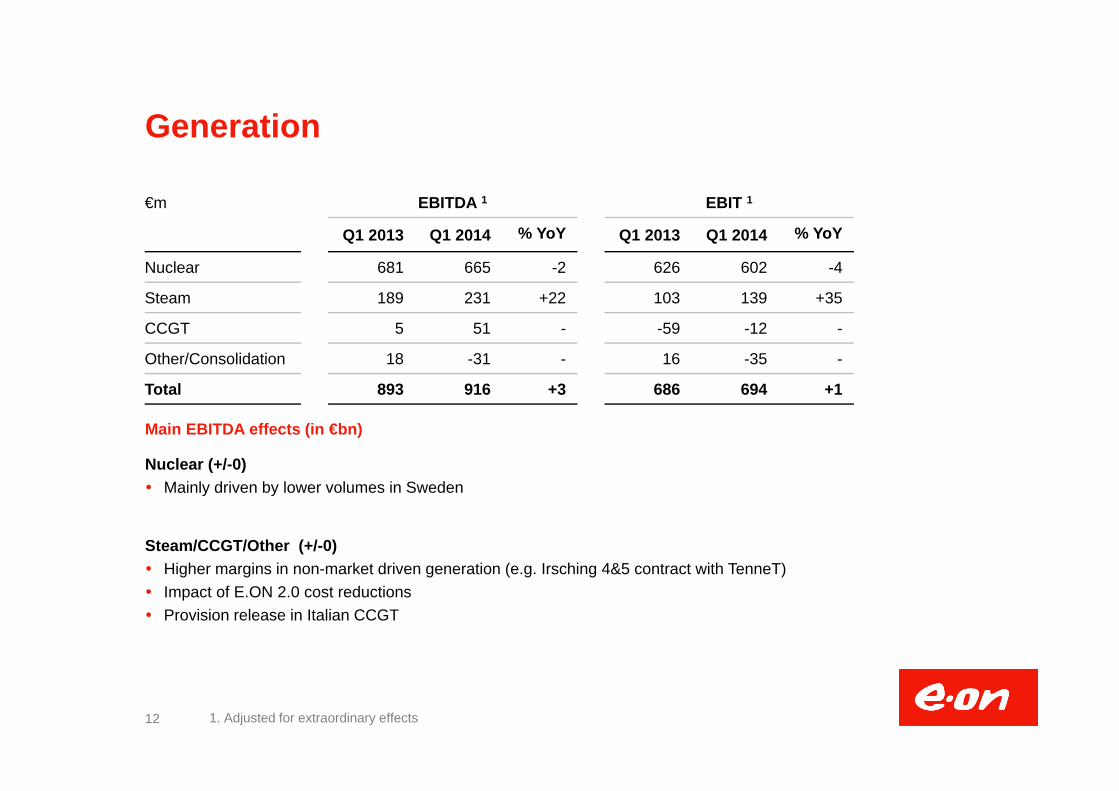
Generation
Main EBITDA effects (in €bn)
Nuclear (+/-0) Mainly driven by lower volumes in Sweden
Steam/CCGT/Other (+/-0) Higher margins in non-market driven generation (e.g. Irsching 4&5 contract with TenneT) Impact of E.ON 2.0 cost reductions Provision release in Italian CCGT
12 1. Adjusted for extraordinary effects
€m EBITDA 1 EBIT 1
Q1 2013 Q1 2014 % YoY Q1 2013 Q1 2014 % YoY
Nuclear 681 665 -2 626 602 -4
Steam 189 231 +22 103 139 +35
CCGT 5 51 - -59 -12 -
Other/Consolidation 18 -31 - 16 -35 -
Total 893 916 +3 686 694 +1
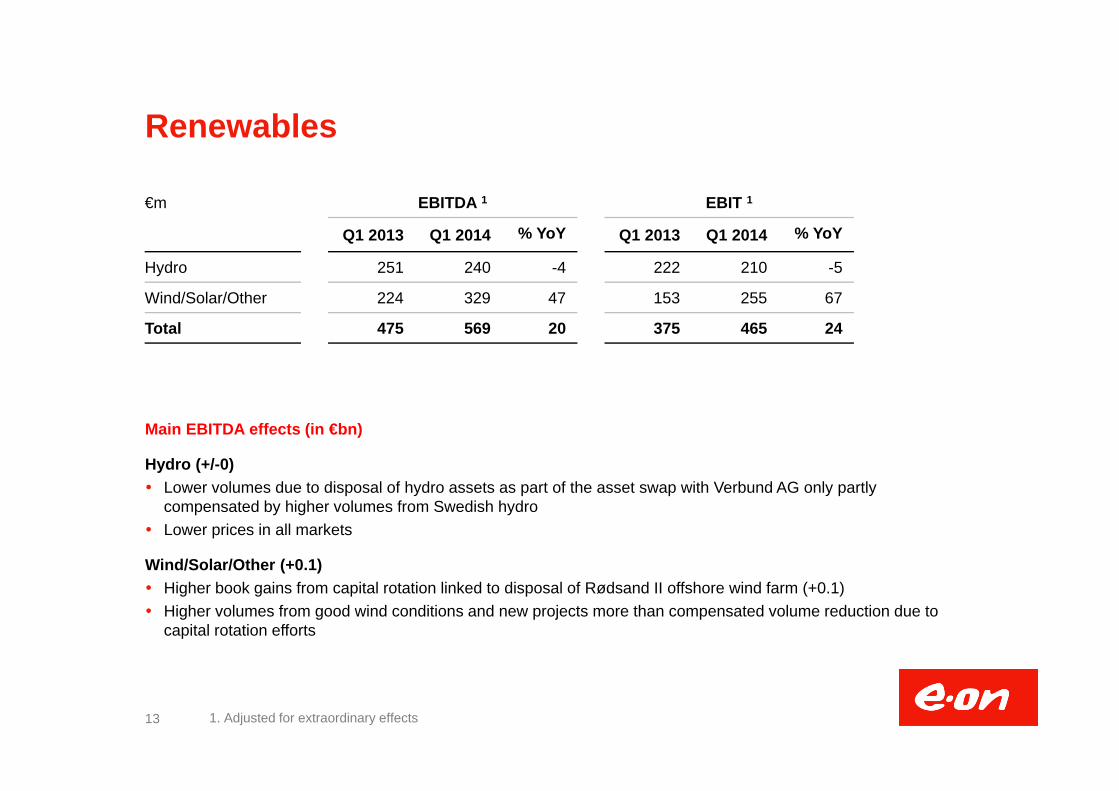
Renewables
Main EBITDA effects (in €bn)
Hydro (+/-0) Lower volumes due to disposal of hydro assets as part of the asset swap with Verbund AG only partly
compensated by higher volumes from Swedish hydro Lower prices in all markets
Wind/Solar/Other (+0.1) Higher book gains from capital rotation linked to disposal of Rødsand II offshore wind farm (+0.1) Higher volumes from good wind conditions and new projects more than compensated volume reduction due to
capital rotation efforts
13 1. Adjusted for extraordinary effects
€m EBITDA 1 EBIT 1
Q1 2013 Q1 2014 % YoY Q1 2013 Q1 2014 % YoY
Hydro 251 240 -4 222 210 -5
Wind/Solar/Other 224 329 47 153 255 67
Total 475 569 20 375 465 24
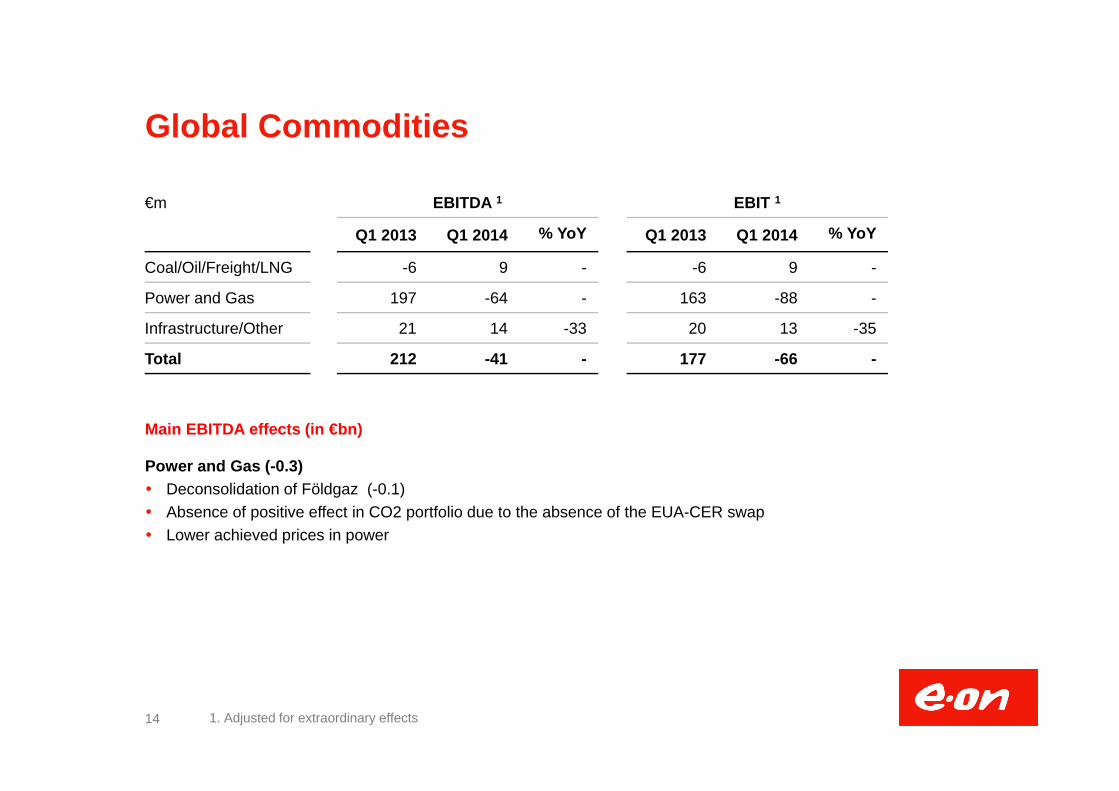
Global Commodities
Main EBITDA effects (in €bn)
Power and Gas (-0.3) Deconsolidation of Földgaz (-0.1) Absence of positive effect in CO2 portfolio due to the absence of the EUA-CER swap Lower achieved prices in power
14 1. Adjusted for extraordinary effects
€m EBITDA 1 EBIT 1
Q1 2013 Q1 2014 % YoY Q1 2013 Q1 2014 % YoY
Coal/Oil/Freight/LNG -6 9 - -6 9 -
Power and Gas 197 -64 - 163 -88 -
Infrastructure/Other 21 14 -33 20 13 -35
Total 212 -41 - 177 -66 -

Exploration & Production
Main EBITDA effects (in €bn)
North Sea fields (+0.2) Higher volumes mainly driven by Skarv moving to plateau production (+0.2)
Yushno Russkoje (+/-0) Higher prices in Ruble (to large extent currency driven) offset by currency translation effects
15 1. Adjusted for extraordinary effects
€m EBITDA 1 EBIT 1
Q1 2013 Q1 2014 % YoY Q1 2013 Q1 2014 % YoY
Total 177 339 +92 83 192 +131
Germany
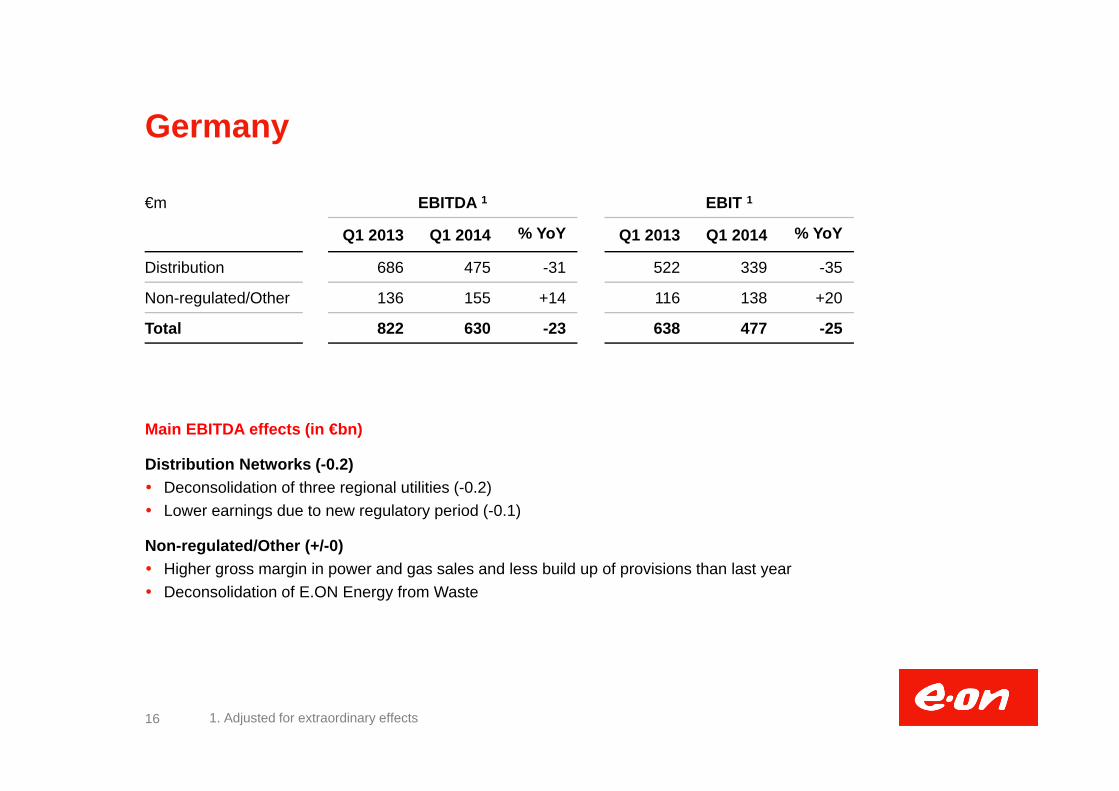
Main EBITDA effects (in €bn)
Distribution Networks (-0.2) Deconsolidation of three regional utilities (-0.2) Lower earnings due to new regulatory period (-0.1)
Non-regulated/Other (+/-0) Higher gross margin in power and gas sales and less build up of provisions than last year Deconsolidation of E.ON Energy from Waste
16 1. Adjusted for extraordinary effects
€m EBITDA 1 EBIT 1
Q1 2013 Q1 2014 % YoY Q1 2013 Q1 2014 % YoY
Distribution 686 475 -31 522 339 -35
Non-regulated/Other 136 155 +14 116 138 +20
Total 822 630 -23 638 477 -25
Other EU Countries
Main EBITDA effects (in €bn)
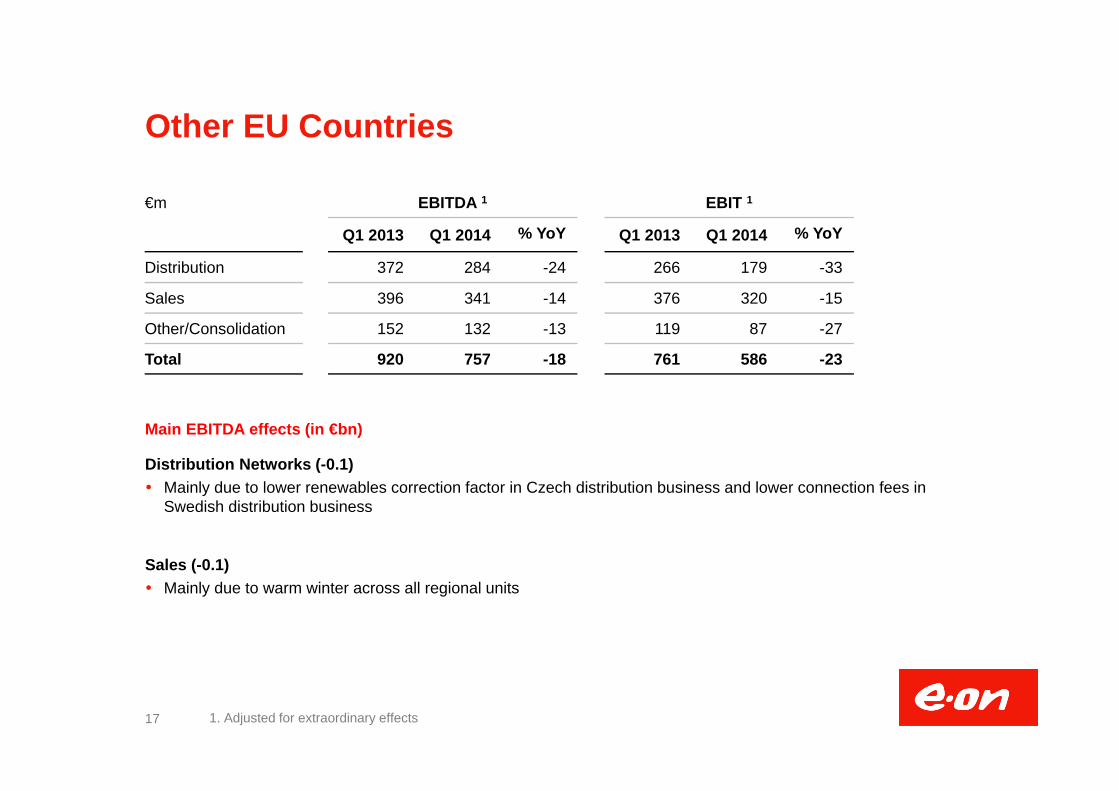
Distribution Networks (-0.1) Mainly due to lower renewables correction factor in Czech distribution business and lower connection fees in
Swedish distribution business
Sales (-0.1) Mainly due to warm winter across all regional units
17 1. Adjusted for extraordinary effects
€m EBITDA 1 EBIT 1
Q1 2013 Q1 2014 % YoY Q1 2013 Q1 2014 % YoY
Distribution 372 284 -24 266 179 -33
Sales 396 341 -14 376 320 -15
Other/Consolidation 152 132 -13 119 87 -27
Total 920 757 -18 761 586 -23
Non-EU Countries
Main EBITDA effects (in €bn)
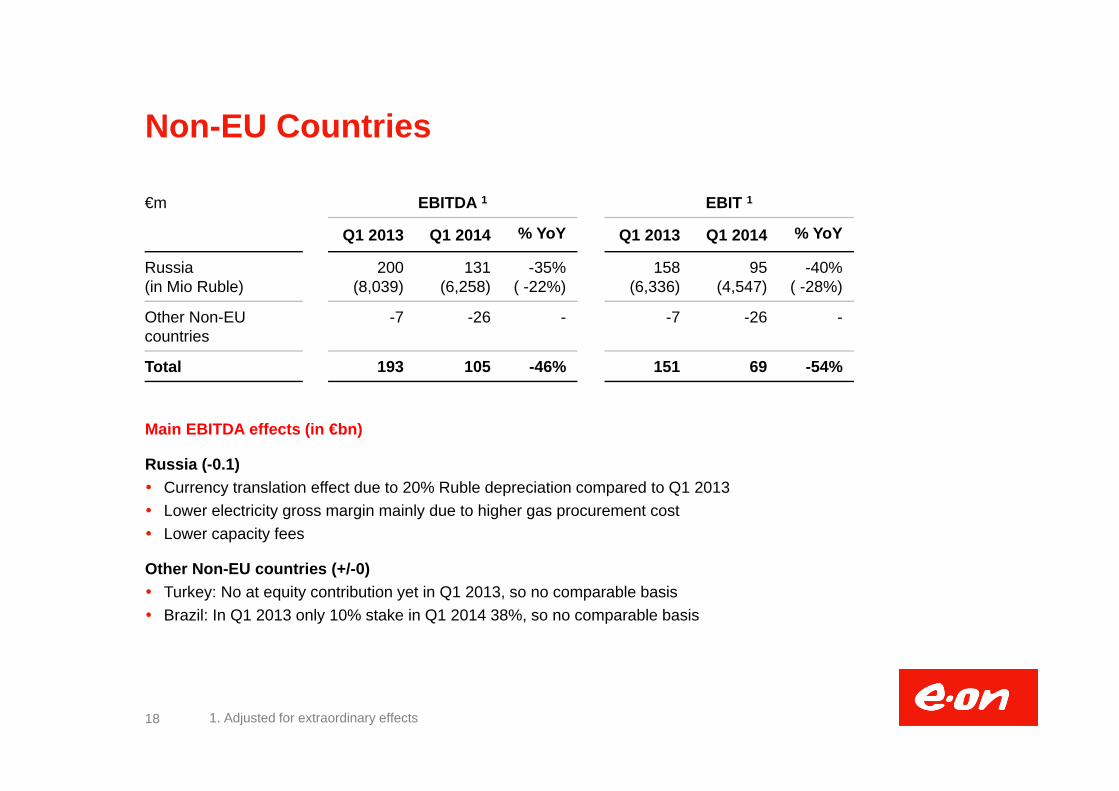
Russia (-0.1) Currency translation effect due to 20% Ruble depreciation compared to Q1 2013 Lower electricity gross margin mainly due to higher gas procurement cost Lower capacity fees
Other Non-EU countries (+/-0) Turkey: No at equity contribution yet in Q1 2013, so no comparable basis Brazil: In Q1 2013 only 10% stake in Q1 2014 38%, so no comparable basis
18 1. Adjusted for extraordinary effects
€m EBITDA 1 EBIT 1
Q1 2013 Q1 2014 % YoY Q1 2013 Q1 2014 % YoY
Russia(in Mio Ruble)
200(8,039)
131(6,258)
-35%( -22%)
158(6,336)
95(4,547)
-40%( -28%)
Other Non-EU countries
-7 -26 - -7 -26 -
Total 193 105 -46% 151 69 -54%
Cash effective investments by unit
19
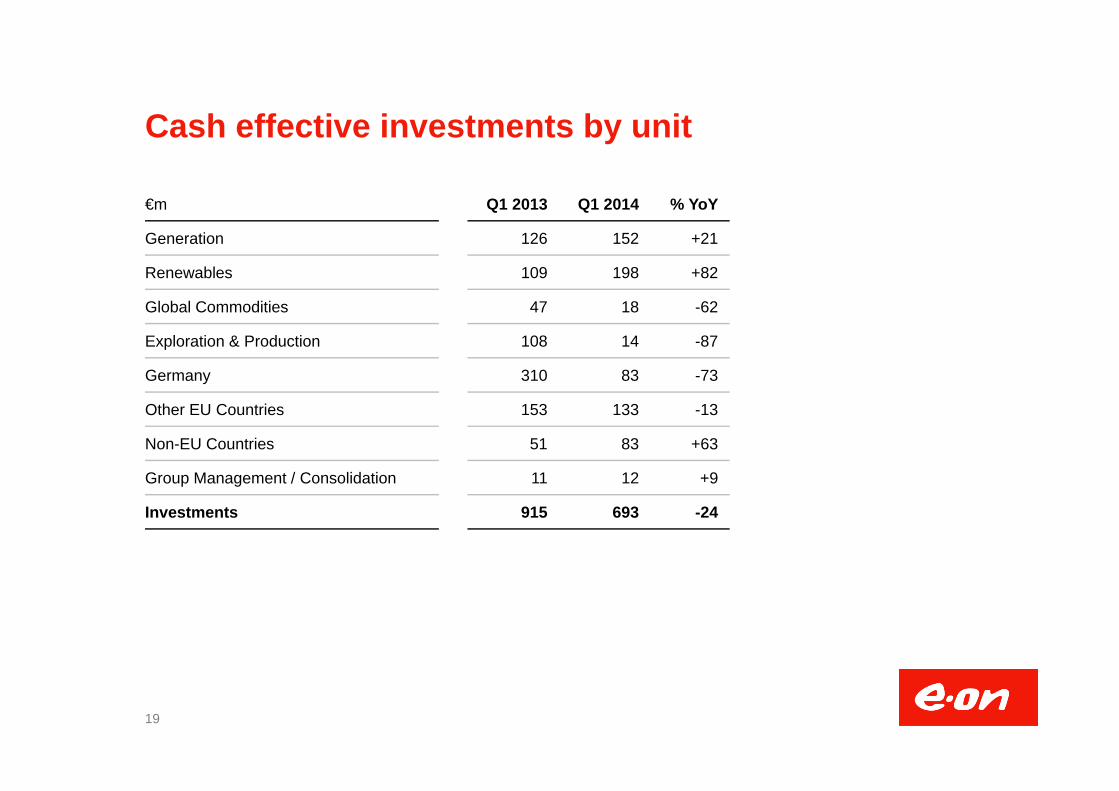
€m Q1 2013 Q1 2014 % YoY
Generation 126 152 +21
Renewables 109 198 +82
Global Commodities 47 18 -62
Exploration & Production 108 14 -87
Germany 310 83 -73
Other EU Countries 153 133 -13
Non-EU Countries 51 83 +63
Group Management / Consolidation 11 12 +9
Investments 915 693 -24
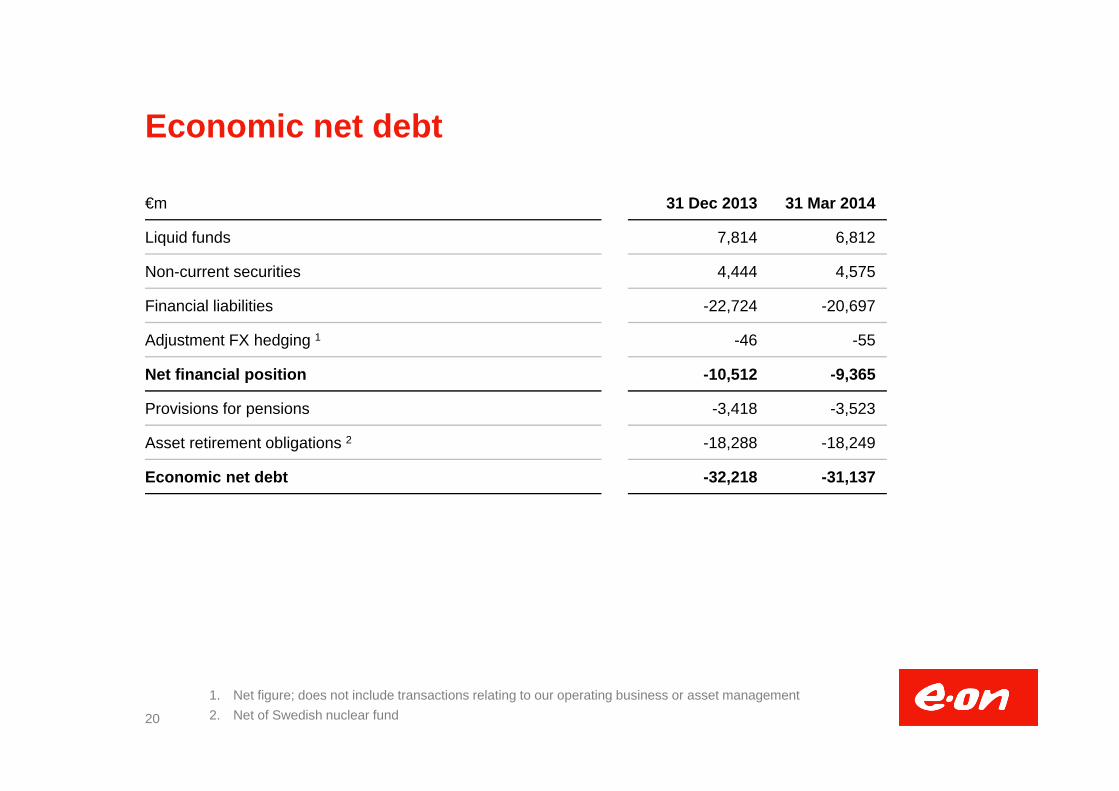
Economic net debt
20
1. Net figure; does not include transactions relating to our operating business or asset management2. Net of Swedish nuclear fund
€m 31 Dec 2013 31 Mar 2014
Liquid funds 7,814 6,812
Non-current securities 4,444 4,575
Financial liabilities -22,724 -20,697
Adjustment FX hedging 1 -46 -55
Net financial position -10,512 -9,365
Provisions for pensions -3,418 -3,523
Asset retirement obligations 2 -18,288 -18,249
Economic net debt -32,218 -31,137
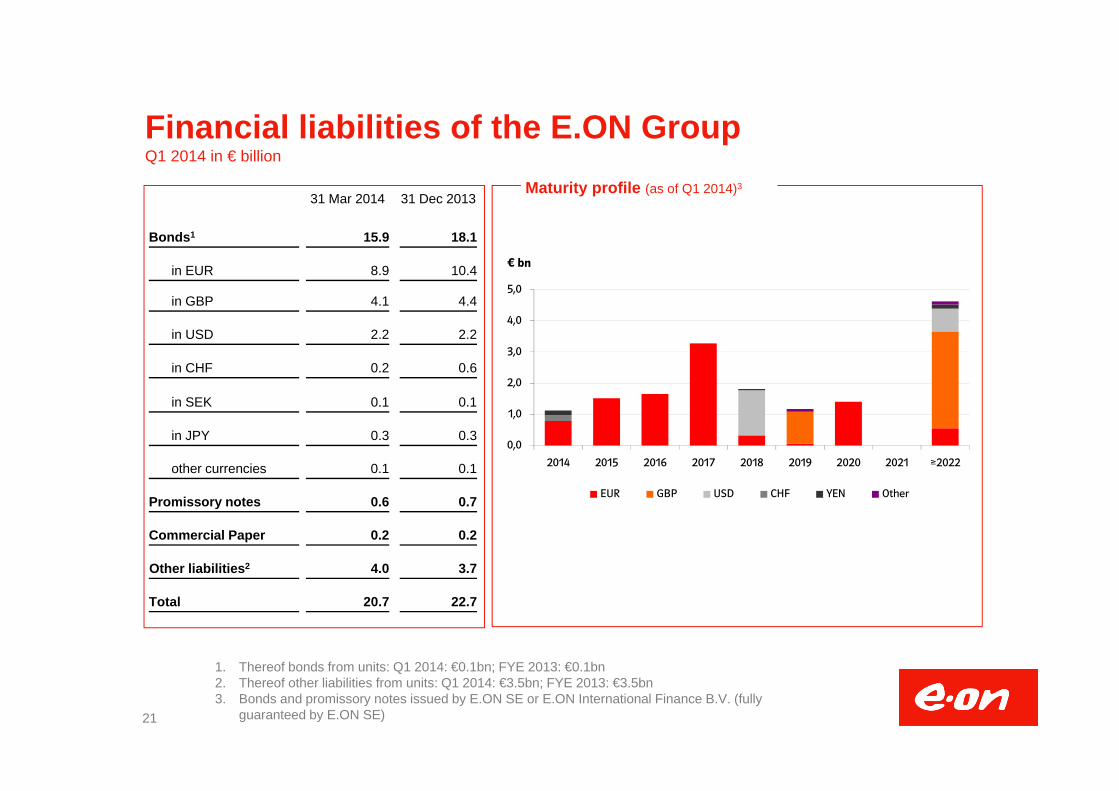
Financial liabilities of the E.ON GroupQ1 2014 in € billion
Maturity profile (as of Q1 2014)331 Mar 2014 31 Dec 2013
Bonds1 15.9 18.1
in EUR 8.9 10.4
in GBP 4.1 4.4
in USD 2.2 2.2
in CHF 0.2 0.6
in SEK 0.1 0.1
in JPY 0.3 0.3
other currencies 0.1 0.1
Promissory notes 0.6 0.7
Commercial Paper 0.2 0.2
Other liabilities2 4.0 3.7
Total 20.7 22.7
1. Thereof bonds from units: Q1 2014: €0.1bn; FYE 2013: €0.1bn2. Thereof other liabilities from units: Q1 2014: €3.5bn; FYE 2013: €3.5bn3. Bonds and promissory notes issued by E.ON SE or E.ON International Finance B.V. (fully
guaranteed by E.ON SE)21
0,0
1,0
2,0
3,0
4,0
5,0
2014 2015 2016 2017 2018 2019 2020 2021 ≥2022
EUR GBP USD CHF YEN Other
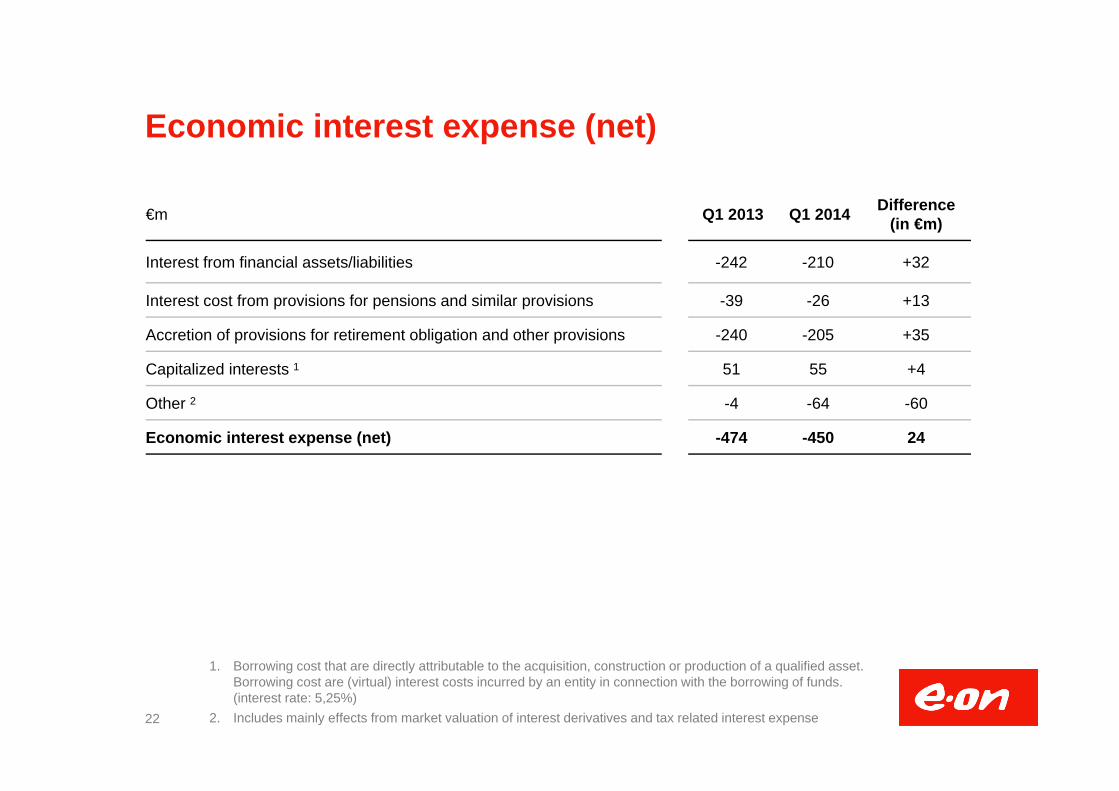
Economic interest expense (net)
22
€m Q1 2013 Q1 2014 Difference(in €m)
Interest from financial assets/liabilities -242 -210 +32
Interest cost from provisions for pensions and similar provisions -39 -26 +13
Accretion of provisions for retirement obligation and other provisions -240 -205 +35
Capitalized interests 1 51 55 +4
Other 2 -4 -64 -60
Economic interest expense (net) -474 -450 24
1. Borrowing cost that are directly attributable to the acquisition, construction or production of a qualified asset. Borrowing cost are (virtual) interest costs incurred by an entity in connection with the borrowing of funds. (interest rate: 5,25%)
2. Includes mainly effects from market valuation of interest derivatives and tax related interest expense
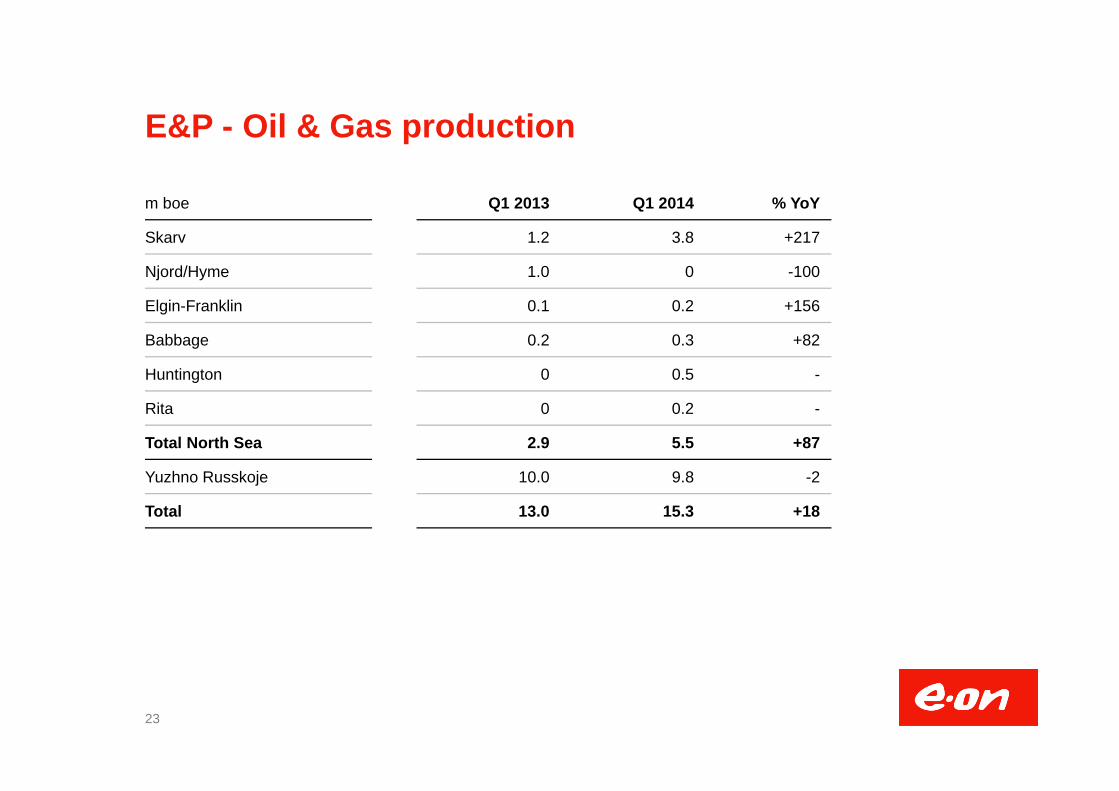
E&P - Oil & Gas production
23
m boe Q1 2013 Q1 2014 % YoY
Skarv 1.2 3.8 +217
Njord/Hyme 1.0 0 -100
Elgin-Franklin 0.1 0.2 +156
Babbage 0.2 0.3 +82
Huntington 0 0.5 -
Rita 0 0.2 -
Total North Sea 2.9 5.5 +87
Yuzhno Russkoje 10.0 9.8 -2
Total 13.0 15.3 +18
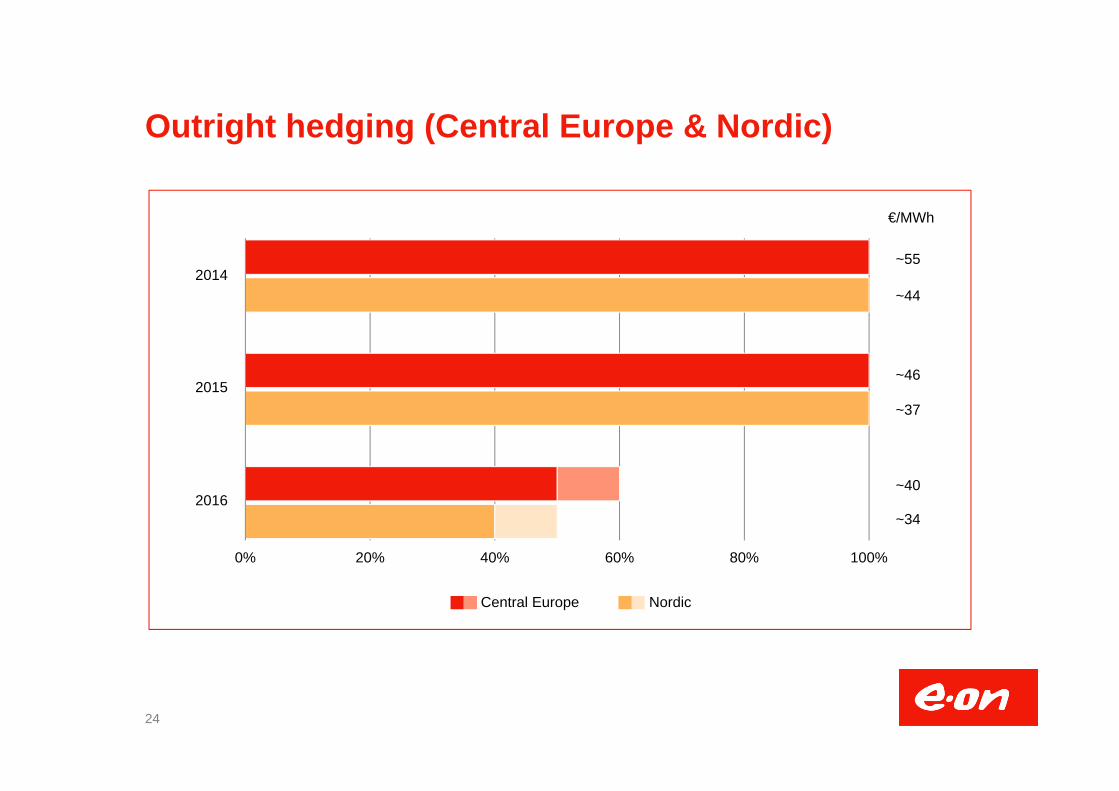
Outright hedging (Central Europe & Nordic)
24
2014
2015
2016
NordicCentral Europe
0% 20% 40% 60% 80% 100%
~55
~44
~46
~37
~40
~34
€/MWh

25
Dr. Marc SpiekerHead of IR T+49 2 11-45 79-3 45
Peter BlankenhornRegions / Sales T +49 2 11-45 79-4 81SRI, Retail [email protected]
François PoulletGeneration T +49 2 11-45 79-3 32E&P [email protected]
Marc KoebernickRenewables T +49 2 11-45 79-2 39Turkey & Brazil [email protected]
Dr. Stephan SchönefußRegions / Distribution T +49 2 11-45 79-48 08Politics & Regulation [email protected]
Carmen SchneiderRoadshow planning & management, T +49 2 11-45 79-3 45Shareholder ID & Targeting [email protected]
E.ON Investor Relations Contact
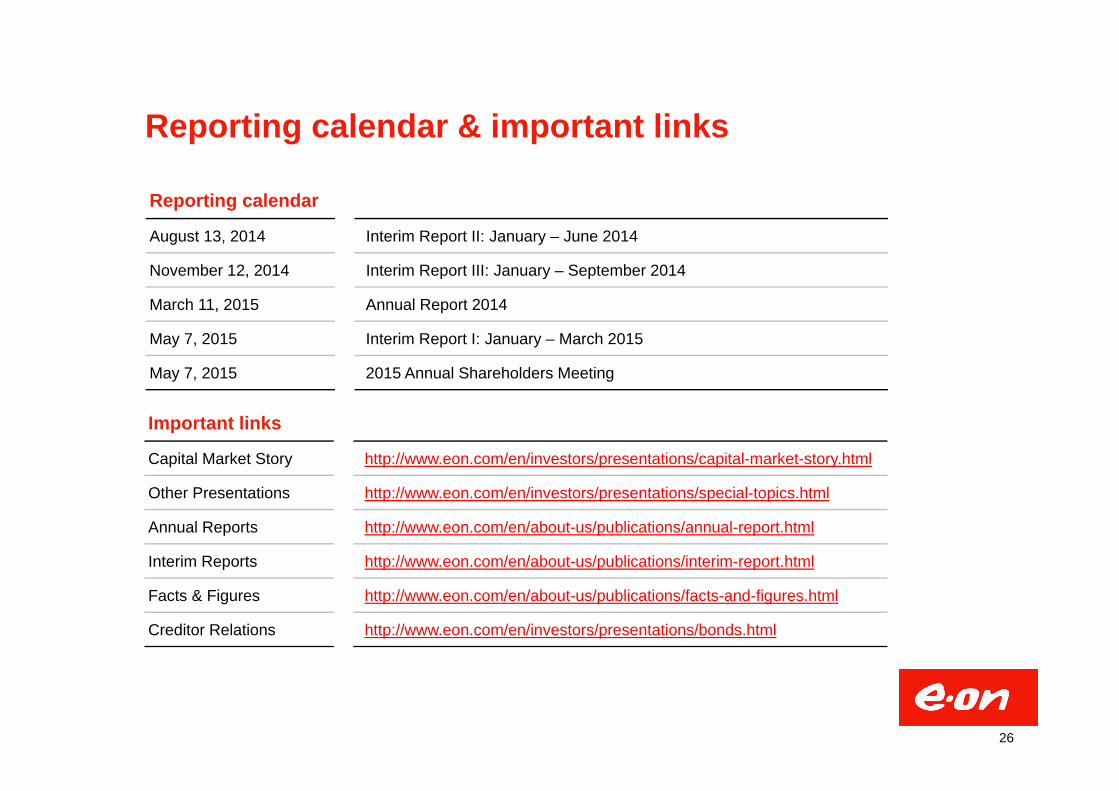
Reporting calendar & important links
Reporting calendar
August 13, 2014 Interim Report II: January – June 2014
November 12, 2014 Interim Report III: January – September 2014
March 11, 2015 Annual Report 2014
May 7, 2015 Interim Report I: January – March 2015
May 7, 2015 2015 Annual Shareholders Meeting
Important links
Capital Market Story http://www.eon.com/en/investors/presentations/capital-market-story.html
Other Presentations http://www.eon.com/en/investors/presentations/special-topics.html
Annual Reports http://www.eon.com/en/about-us/publications/annual-report.html
Interim Reports http://www.eon.com/en/about-us/publications/interim-report.html
Facts & Figures http://www.eon.com/en/about-us/publications/facts-and-figures.html
Creditor Relations http://www.eon.com/en/investors/presentations/bonds.html
26

This presentation may contain forward-looking statements based on current assumptions and forecasts madeby E.ON Group Management and other information currently available to E.ON. Various known and unknownrisks, uncertainties and other factors could lead to material differences between the actual future results,financial situation, development or performance of the company and the estimates given here. E.ON SE doesnot intend, and does not assume any liability whatsoever, to update these forward-looking statements or toconform them to future events or developments.
Disclaimer