Embed Size (px)
Citation preview
PDE-Method (06/2012) Page 1
PARTNERSHIP FOR THE DELAWARE ESTUARY Science Group
Weight-specific Processing Rates and Fates of Suspended Microparticulate
Matter Consumed by Bivalve Molluscs Date Prepared: 11/2006
Revised: 5/2007 (v2 by Kreeger) Revised: 6/2012 (v3 by Kreeger)
Prepared By: __ Danielle Kreeger_____________ Suggested Citation: Kreeger, D. 2012. Weight-specific Processing Rates and Fates of Suspended Microparticulate Matter Consumed by Bivalve Molluscs. Partnership for the Delaware Estuary. PDE Method No. 32. 15pp.

PDE-Method (06/2012) Page 2
Weight-specific Processing Rates and Fates of Suspended Microparticulate Matter Consumed by Bivalve Molluscs Partnership for the Delaware Estuary (PDE) Method Danielle Kreeger Description This method describes the general conduct of physiological studies with bivalve mollusks that are designed to quantify weight-specific rates of feeding (filtration, clearance), defecation, absorption, excretion, and (optionally) respiration. Depending on the goals for various projects, sample analyses and resulting data can adapted for use in constructing energy budgets, carbon budgets, nitrogen budgets, calculating scope for growth, or estimating various ecosystem services. The methods have been successfully applied to a wide range of marine and freshwater bivalves, which require minimal adaptations for different conditions. These have include juvenile and adult oysters and ribbed mussels in the Delaware Estuary, blue mussels in Oregon and England, and freshwater mussels from the Pacific, Mississippi and Atlantic slopes. One interspecific difference to be considered is whether the target species produces pseudofeces, which must also be collected and analyzed when present (typically under high food quantity, turbid conditions). Variations of these “pulse-chase” methods have been published in past radiotracer studies (e.g. Kreeger et al. 1988; Kreeger 1993; Kreeger and Newell 1996, 2001). Methods for the measurement of respiration rates and ammonia excretion rates have also been published (Kreeger and Langdon 1993; Kreeger et al 1995). However, the non-tracer methods for assessing basic rate functions have not yet been published and so are described here. Summary of Approach The general approach is to feed bivalves on experimental diets for a fixed period of time during which their feeding rates are measured and feces (and pseudofeces if present) are collected for later analysis. At the end of this feeding period, the water is sampled for dissolved ammonia (excretion) and filtered (feces and pseufeces). Samples of food and feces are analyzed for organic content (and sometimes other metrics such as nutrients and proximate biochemistry). The animals are sacrificed (shucked) and analyzed for various body size and condition index endpoints (and sometimes other metrics such as nutrients and proximate biochemistry). A complete energy (or C or N) budget can be constructed by contrasting the total consumed material (filtered) with the measured fate of filtered material in pseudofeces (if present, represents filtered but not ingested matter), feces (ingested but assumed not absorbed), and excreted (ingested and absorbed). The difference between ingested matter and defecated+excreted matter represents the sum of respired matter plus any matter sequestered (incorporated) into tissue.
PDE-Method (06/2012) Page 3
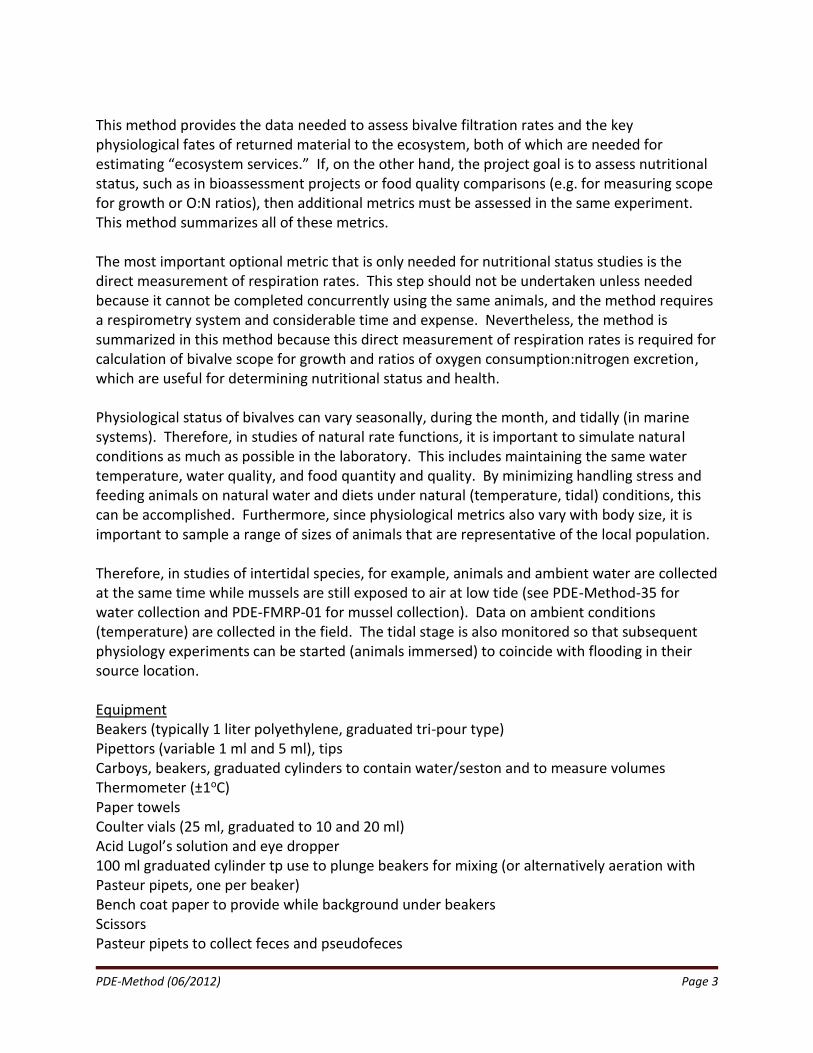
This method provides the data needed to assess bivalve filtration rates and the key physiological fates of returned material to the ecosystem, both of which are needed for estimating “ecosystem services.” If, on the other hand, the project goal is to assess nutritional status, such as in bioassessment projects or food quality comparisons (e.g. for measuring scope for growth or O:N ratios), then additional metrics must be assessed in the same experiment. This method summarizes all of these metrics. The most important optional metric that is only needed for nutritional status studies is the direct measurement of respiration rates. This step should not be undertaken unless needed because it cannot be completed concurrently using the same animals, and the method requires a respirometry system and considerable time and expense. Nevertheless, the method is summarized in this method because this direct measurement of respiration rates is required for calculation of bivalve scope for growth and ratios of oxygen consumption:nitrogen excretion, which are useful for determining nutritional status and health. Physiological status of bivalves can vary seasonally, during the month, and tidally (in marine systems). Therefore, in studies of natural rate functions, it is important to simulate natural conditions as much as possible in the laboratory. This includes maintaining the same water temperature, water quality, and food quantity and quality. By minimizing handling stress and feeding animals on natural water and diets under natural (temperature, tidal) conditions, this can be accomplished. Furthermore, since physiological metrics also vary with body size, it is important to sample a range of sizes of animals that are representative of the local population. Therefore, in studies of intertidal species, for example, animals and ambient water are collected at the same time while mussels are still exposed to air at low tide (see PDE-Method-35 for water collection and PDE-FMRP-01 for mussel collection). Data on ambient conditions (temperature) are collected in the field. The tidal stage is also monitored so that subsequent physiology experiments can be started (animals immersed) to coincide with flooding in their source location. Equipment Beakers (typically 1 liter polyethylene, graduated tri-pour type) Pipettors (variable 1 ml and 5 ml), tips Carboys, beakers, graduated cylinders to contain water/seston and to measure volumes Thermometer (±1oC) Paper towels Coulter vials (25 ml, graduated to 10 and 20 ml) Acid Lugol’s solution and eye dropper 100 ml graduated cylinder tp use to plunge beakers for mixing (or alternatively aeration with Pasteur pipets, one per beaker) Bench coat paper to provide while background under beakers Scissors Pasteur pipets to collect feces and pseudofeces
PDE-Method (06/2012) Page 4
Vacuum filtration system to filter feces and get filtrate for ammonia samples 0.45 µm membrane filters, 47 mm diameter Glass fiber filters, 47 mm diameter, 0.7 µm retention (e.g. Whatman GF/F), pre-treated as per PDE-Method-23 Scrub brush to clean bivalves Dissecting tools to shuck bivalves Pre-weighed Coulter vials or Nalgene type bottles for bivalve tissues Freeze-dryer and chambers (see PDE-Method-16) (optional for respiration rates 6-chennel Strathkelvin respirometry system, chambers, electrodes, and zero oxygen controls Procedure Summary Physiological rate functions of bivalves are quantified on animals collected from each target species, place and time (e.g. seasons, sites) based on the general method of Kreeger and Langdon (1993, and adapted for adults). For each treatment group, physiological rate functions are assessed on up at least 8 individuals that vary in size representative of natural size ranges in the study populations. For each individual, the physiological rate functions assessed will consist of clearance (feeding) rates, ingestion rates, defecation rates, excretion rates, and (optionally) respiration rates. The Conover Ratio (Conover 1966) will be calculated to estimate food absorption efficiency. If respiration is assessed, O:N ratios (rate of oxygen consumption divided by the rate of ammonia excretion) can also be calculated. Since physiological rate functions do not scale linearly with body size (Christian et al. 2001), these measures are obtained for a range of animal sizes and the rates are then expressed according to allometric relationships. Specific methods are described below. The duration of an experiment depends on study goals, but typically last 2-3 hours. If using freshwater mussels or subtidal marine species, the experiment should begin as soon as possible following animal collection (and no later than 8 hours after collection), and animals should be held in ambient water and at ambient temperatures until the start of the experiment. If using intertidal marine species, the animals should be collected at low tide, held in air until the experiment begins, and the timing of the start of the experiment must coincide with the timing of natural flooding (immersion) at the site where the animals were collected (i.e., experiment begins within 3 hours of collection). These methods help to ensure that any endogenous rhythms of feeding and digestion are maintained and there are no disruptions in natural food supply that could perturb normal physiological rate functions. Except in laboratory studies that do not attempt to simulate natural field conditions, all studies should be undertaken at ambient temperature (±2oC) from where and when the bivalves were collected. Diets should be natural, sieved to 100 µm to remove larger debris.

PDE-Method (06/2012) Page 5
Procedure
32.1 Feeding Rates 32.1.1 Clearance Rates
Clearance (feeding) rates are measured in static aquaria by monitoring rates of particle disappearance in for individual bivalves held in 1 liter beakers (Fig. 32.1). Beakers are filled with a known volume of ambient water that has been mixed and then sieved to 100 m. The appropriate volume should enable active bivalves to filter sufficient particles to clearly measure particle depletion, but not so much that more than 75% of initial particles are removed during the experiment. This is because if food quantity becomes nutritionally limiting (e.g., energy spent on feeding is not balanced by energy obtained) animals can reduce their feeding rates.
Additional beakers containing the same water but no bivalves (or simulated bivalves by gluing shells together) represent non-feeding controls for other biological activity and settling of particles. Beakers can be individually aerated to promote mixing, or they can be mixed prior to sampling by plunging a graduated cylinder with wide base.
The ratio of animal biomass to water volume can be adjusted to ensure animals have sufficient time to clear enough particles. Typically, adult bivalves of approximately 40-80 mm are dosed within 800 ml of water for a 2 hour feeding period. Exceptionally smaller or larger animals can be placed in beakers have less or more water, so long as the volumes are measured exactly and there are no-bivalve controls for every volume treatment. There must be three or more controls for every type of source water and container volume. Particle disappearance in each beaker is assessed by collecting water samples just prior to the experiment start (before bivalves are added), and then at various times after the bivalves are added. Typically, these water samples are taken every 30 minutes for up to 3 hours (typically 2 hours). Water samples are 10 ml of water taken from the just beneath the water surface in the middle of each beaker, approximately 1 min following mixing. This 1 min interval is sufficient to allow any resuspended feces or pseudofeces to precipitate, whereas, smaller natural food particles remain in suspension. Each water
Figure 32.1. A series of beakers containing freshwater
mussels (plus controls).

PDE-Method (06/2012) Page 6
sample is added to a 20 ml Coulter vial, and is fixed with 4 drops of Lugol's solution (pre-added to many vials in advance for efficiency). These water samples will be analyzed within 24 hrs for particle concentration using a Coulter Multi-Sizer.
Therefore, for each animal (and control), particle concentrations will be assessed at 0, 30, 60, 90 and 120 min (or more). Regression curves will then be fitted to the decline in particle concentration to estimate an initial and final chamber concentration that considers all possible variability. If particle concentration in any beaker drops below 25% of initial, then the later samples (any below 25%) will be deleted from the regression. Similarly, at the start of the experiment, observations should be recorded regarding the time that each animal opened and began to feed (judged by fecal production), and any samples collected during non-feeding times will be eliminated from the regression. Clearance rates for static chambers will be calculated using the equation of Coughlan (1969): Clearance Rate (L/h) = [log Ci - log Cf] x [V / T] where Ci = particle concentration at the start of the incubation period, Cf = particle concentration at the end of the incubation period, V = chamber volume, and T = incubation time.
Note: An alternative flow-through method exists to measure clearance rates, however that method is more laborious and dependent on fine scale, controllable food delivery rates with peristaltic pumps. Side-by-side comparisons of both static and flow-through methods have shown no additional benefit of the more laborious flow-through method; therefore, it is not routinely used here. A different equation is applied if aquaria are of a continuous-flow design (as per Kreeger 1993.)
32.1.2 Filtration Rate Calculations
Clearance rates (liters of water cleared per hour) are converted to filtration rates (dry weight of seston removed per hour) by multiplying measured clearance rates by the measured seston concentration (dry weight of seston per liter of seawater, see other methods; PDE-Method-35 and PDE-Method-07). Filtration rates for bivalves are then corrected for values measured in controls to adjust for any changes due to microbial activity or particle settlement. Filtration rate (FR, mg h-1) is dry weight of particles cleared from suspension per unit time. It is the most common means of measuring filtration activity in bivalves and may be used to calculate a daily ingested ration, i.e., mg of dry seston consumed (Bayne et al. 1976). Clearance and filtration rates can vary with temperature (season) and also seston concentration and quality. For example, water processing and seston filtration rates typically are reduced at low temperatures and also when food availability is low (low seston concentration). Increases in temperature and concentration lead to
PDE-Method (06/2012) Page 7
increased filtration up to a maximum. Still further increases in seston concentration such as during turbid conditions results in decreases in filtration with further increases in concentration (Foster-Smith 1975, Winter 1978, Widdows et al. 1979, Bayne et al. 1989, Velasco and Navarro 2005). Under increasingly turbid conditions, bivalves can reject filtered material prior to ingestion as pseudofeces; therefore, actual ingestion rates can decline at high seston loads (Winters 1978). Although the relative proportions of filtered and ingested material are important for the animal, the ecological effects on suspended matter concentrations are linked to filtration since material rejected as pseudofeces is mucous-bound and is biodeposited to the bottom similar to feces. Clearance rates (liters of water cleared per hour) are converted to filtration rates (dry weight of seston removed per hour) by multiplying measured clearance rates by the measured seston concentration (dry weight of seston per liter of seawater), measured as part of seston analysis (separate PDE-Method-32). In some studies which examine nutrient balance, carbon balance, chlorophyll consumption, other otherwise, the mass balance and consumption rates can also be based on other nutritional currencies; e.g. nitrogen/phosphorus, carbon, or chlorophyll-a concentrations, respectively, so long as those constituents are analyzed in all components of the utilization budget (food content, filtered content, etc). Filtration rates for bivalves are then corrected for values measured in controls to adjust for any changes due to microbial activity or particle settlement. 32.1.3 Allometric Scaling of Feeding Rates Filtration rates increase with increasing bivalve size (Winter 1978), which can also vary widely among species, and so filtration rates (as well as the other physiological rates below) should be weight-adjusted. To determine weight-adjusted rates, the relationship of filtration rate and bivalve dry tissue weight is determined by least squares linear regression analyses on log-log data, following the same approach as Kreeger et al. (2001). A separate regression equation is determined for each species of bivalve from each water body and each experiment (i.e., each treatment group). Where similar (e.g., among different waters for the same species), another regression equation is generated on the pooled data to minimize error. The average bivalve dry tissue weight for all individuals used in a regression equation (referred to as the “standard” animal size) is then inserted into the equation, resulting in weight-adjusted filtration rates for each bivalve after back-transformation from the log-log relationship. These allometric-scaled filtration rates (L h-1 g dry tissue weight [DTW]-1) also enable direct comparison of rate functions among species for the “average-sized” bivalve of each species.
32.2 Mussel Defecation and Absorption Efficiency Fecal collections are made at the end of each clearance rate measurement and kept separate per animal. Feces are added to the same 20 ml Coulter vial per animal to provide one fecal
PDE-Method (06/2012) Page 8
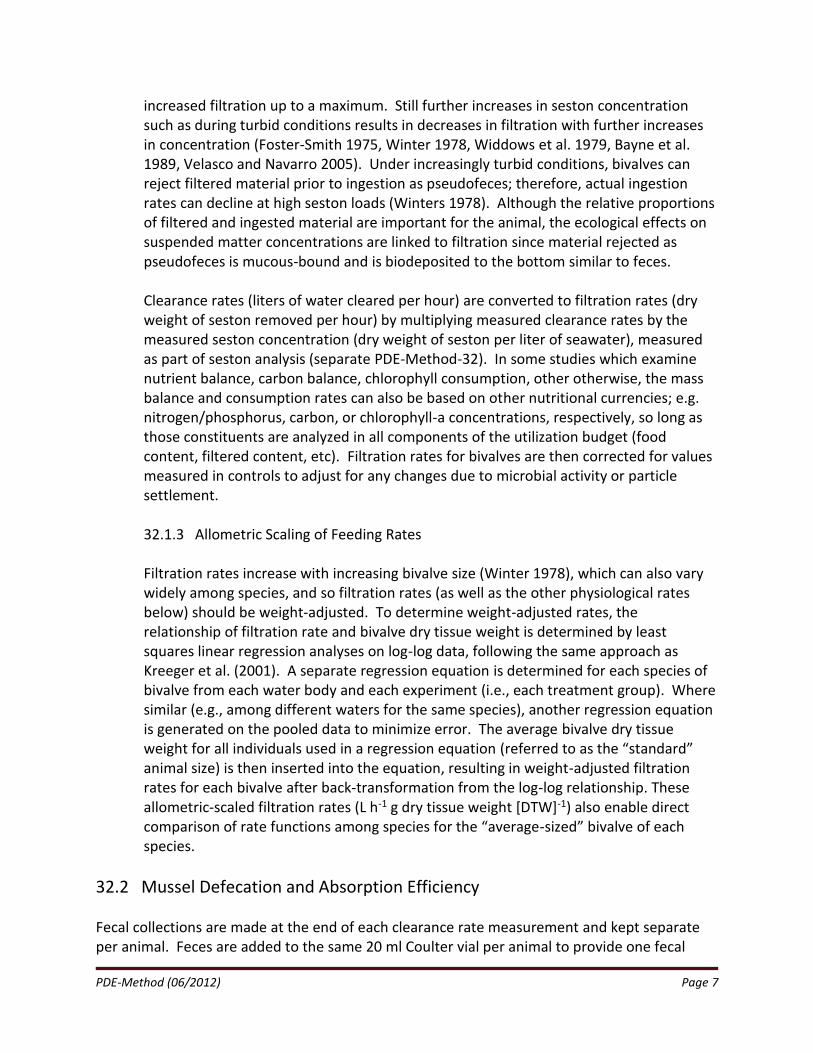
sample per animal per experiment. It is not necessary to collect 100% of feces since the total material defecated can be calculated using the absorption efficiency and filtration rate data; however, one should attempt to collect >90% of feces to ensure the calculations are representative of the entire experimental period. If any pseudofeces are produced, an attempt should be made to collect them separately from feces. Pseudofeces are filtered matter that gets rejected prior to ingestion. The tendency to produce pseudofeces varies among bivalves and is greater under high food concentrations (e.g. turbid events). The importance of assessing rejected pseudofeces depends on the nature of the scientific question being explored. If one is only interested in nutritional balance of bivalves (organismal level), then this rejected matter is relatively inconsequential because the energetic costs of rejecting matter are a very small portion of the typical energy budget. However, if the scientific interests are related to benthic-pelagic coupling processes (ecosystem level), then it is important to quantify whatever material gets precipitated to the bottom, including both pseudofeces and feces. In these feeding experiments, mucous-bound pseudofeces are usually easy to collect separate from true feces because they appear more flocculent whereas fecal particles are distinct strands (Figure 32.2). Although the tendency to produce pseuofeces and the degree to which they become mucous-bound and settle varies with species, if the pseudofeces are too easily resuspended to collect then they are likely just as easily resuspended in nature and are less important for benthic-pelagic coupling. For this method, we simply collect pseudofeces and add them to a second Coulter vial per animal (feces get added to the first) only if they are important to the scientific question, if they are produced, and if they can be captured with a Pasteur pipet. In that case, it is important to collect as much pseudofeces as possible since there are no indirect means to calculate rejected matter.
Figure 32.2. A beaker containing a ribbed mussel, Geukensia
demissa, and showing pseudofeces produced from the
posterior margin and feces produced from the dorso-posterior
margin.
PDE-Method (06/2012) Page 9
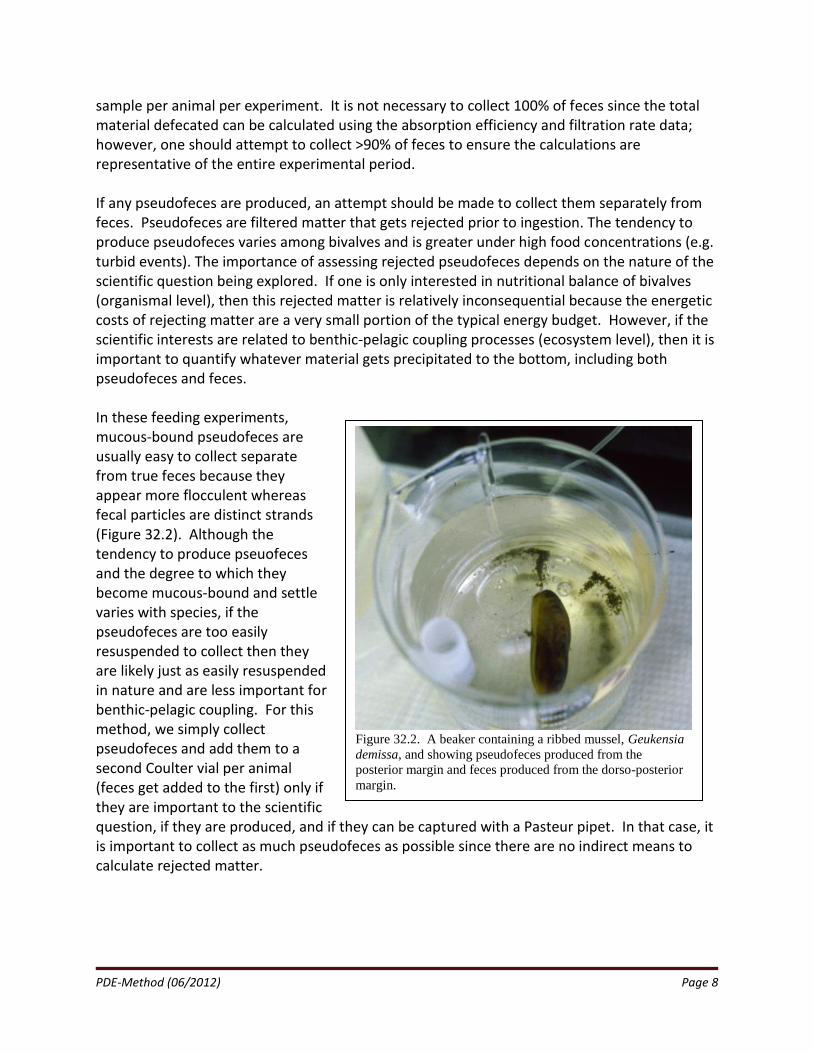
32.2.1 Fecal Collection and Analysis Feces (and pseudofeces if produced) are removed from each beaker with a Pasteur pipet, and they are added to Coulter vials (pseudofeces kept separate if produced). At the conclusion of the experiment, all feces per bivalve are transferred onto a pre-ashed and pre-weighed glass fiber filter (e.g. Whatman GF/F, retention 0.7 µm) using vacuum filtration. Any pseudofeces are similarly captured onto a separate filter. Each sample is rinsed with 5 ml distilled water to ensure all particles are rinsed onto the filter. Filters are then frozen in unique filter holders (e.g. Petrislides) until later analysis. The same seston (food) that was delivered to bivalves in the feeding experiment is also sampled (4 replicates per food type) by vacuum filtration as per PDE-Method-23.
Filters containing either food or feces (or pseudofeces if appropriate) are then analyzed with the weight-on-ignition method (PDE-Method-07) to determine their total dry weights, ash-free dry weights, and organic contents. In brief, filters are dried in an oven (60˚C for 24 h), weighed, ashed in a furnace (450˚C for 24 h), and weighed again, to determine dry weights and ash-free dry weights of filtered material. 32.2.2 Absorption Efficiency Absorption efficiency (AE) represents the percentage of organic material in dietary matter (seston) that is actually ingested and absorbed by mussels (Conover 1966). Like filtration rate, absorption efficiency can vary with food quality and quantity, although it tends not to vary as much with temperature (seasonally). Typically, absorption efficiency varies inversely with food quantity and directly with food quality (Thompson and Bayne 1974, Widdows 1978, Griffiths 1980). Different bivalve species may balance their nutritional needs through different strategies of regulation of filtration rate, particle selection (pseudofecal rejection processes), ingestion rate, and absorption efficiency, for example. Absorption efficiencies are determined for each bivalve in each experiment by comparison of the organic content of the seston delivered to each animal with the organic content of the feces that it produces. Absorption efficiency, the percentage of absorption of material by mussels, is calculated per Conover (1966): AE = [(F – E)/(1 – E)(F)] x 100 % where AE is absorption efficiency, F is the ash-free dry weight : dry weight ratio (the inorganic fraction) of the ingested food (seston), and E is the ash-free dry weight : dry weight ratio of feces egested.

PDE-Method (06/2012) Page 10
32.2.3 Calculation of Ingestion and Absorption Rates Ingestion rates consist of the amount of filtered material that gets ingested (eaten). In cases where no pseudofeces are produced, ingestion rates equal filtration rates. In cases where pseudofeces are produced, ingestion rates are calculated as the difference between filtration rates and pseudofecal production rates. Hence, if ingestion is of interest, it is important to capture 100% of pseudofeces per unit time, analyze dry weights, and subtract this from the filtered dry mass:
IR = FR - PsR
Where IR is ingestion rate, FR is filtration rate and PsR is the pseduofecal production rate. Once material is ingested, it can be either absorbed or pass through the gut and be defecated. Absorbed material can be either respired (i.e. used for metabolism and energy), excreted (typically only ammonia is excreted in bivalves), or used for growth and reproduction (a.k.a. incorporation, net scope for growth). Terminology note: The sum of respiration and tissue incorporation constitutes “assimilation”, which is often confused with “absorption.” Since ammonia excretion is a zero term in the carbon budget, for most carbon budget purposes the terms absorption and assimilation are equivalent; however, absorption is typically greater than assimilation in the nitrogen budget because of the ammonia loss term. The following equations clarify these terms: Absorption = R + G + E Assimilation = R + G where R = respiration, G = growth (a.k.a. incorporation), and E = excretion.
Physiology Notes: There are a few reports that suggest that some bivalves do have the capacity to excrete carbon during times of extreme protein sparing (nitrogen conservation), in which case analysis of excretion by measuring ammonia production might underestimate total excretion (Kreeger et al. 1996). Similarly, there is one report that has shown that some absorbed material can be excreted and become part of feces (post-metabolic excreta). However, these situations are only important for fine resolution studies of energy and nutritional balance at the organismal scale. For ecologicial mass balance studies, defecated material (and pseudofecal material that gets biodeposited) is simply regarded as a waste biodeposit that is returned to the benthos as a byproduct of suspension-feeding. Similarly, if non-ammmonia dissolved excreta is produced, it is likely to be ephemeral and not consequential to ecosystem-level nutrient flux. Absorption rates (AR) are calculated by multiplying the absorption efficiency (AE, see above) by the ingestion rate (IR, see above). Again, if no pseudofeces are produced, then this simplifies to be:
PDE-Method (06/2012) Page 11
AR = AE x FR
32.3 Ammonia Excretion Rates Measurement of ammonia excretion is useful for reconstructing the total nutritional budget as well as understanding the ecological rate of nitrogen (i.e., how much dissolved nitrogen is returned to the environment). Ammonia excretion can be assessed concurrently with the static feeding experiment described in Steps 32.1 and 32.2. Simply, the ammonia concentrations are examined in the filtrate of water from each beaker at the end of the experiment, corrected for controls without bivalves to account for other biological activity. Ammonia excretion rates are measured following a modification to the protocol described by Kreeger & Langdon (1993). In brief, following removal of bivalves from each beaker (and controls) used to measure their clearance rates (see above), water is passed through a 0.45 µm filter. Then, up to 20 ml of filtrate is collected for analysis of ammonia concentration. Controls consist of filtrates from beakers which have no live animals. Internal standards are also included, consisting of no-animal controls which have predetermined amounts of ammonia standards added for calibration of the method (NH4Cl; 25 - 250 mM). Samples for ammonia analysis will be collected at the end of each incubation period, frozen and later analyzed using standard methods (Solorzano 1969). Excretion rates are calculated per gram of mussel dry tissue weight (µg-at NH4+-N h-1 g-1) using allometric standardization (see above) after rates per beaker and time are control-corrected.
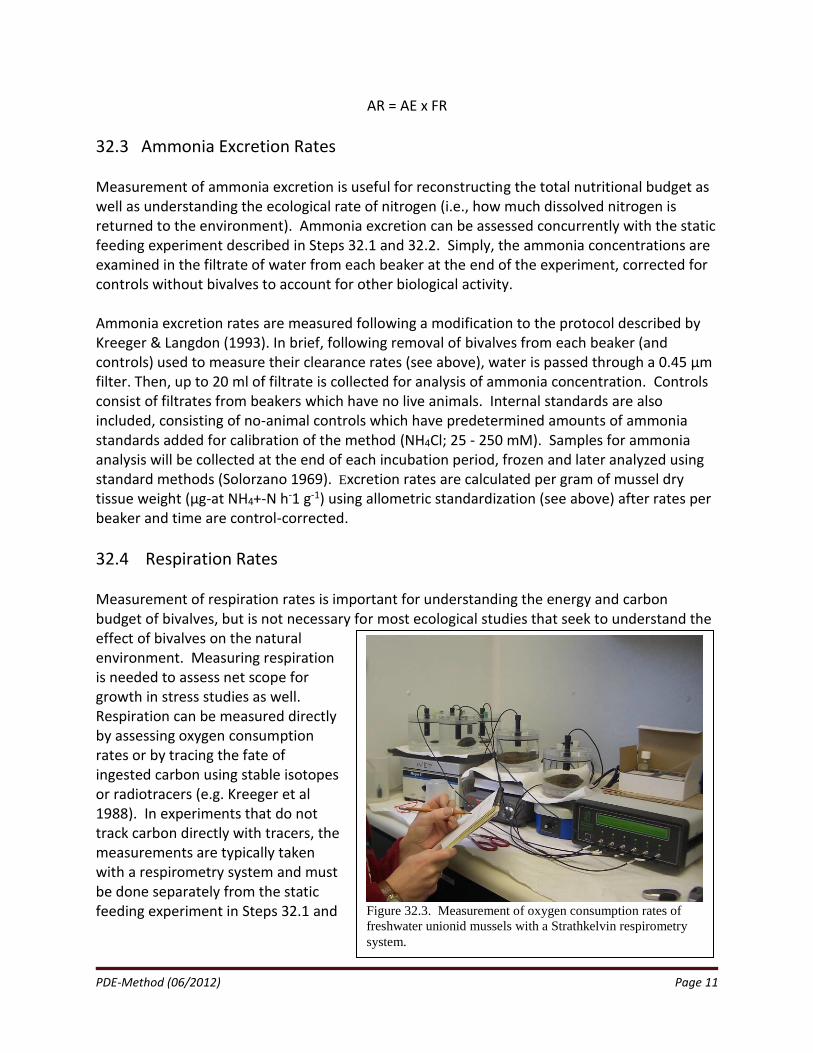
32.4 Respiration Rates Measurement of respiration rates is important for understanding the energy and carbon budget of bivalves, but is not necessary for most ecological studies that seek to understand the effect of bivalves on the natural environment. Measuring respiration is needed to assess net scope for growth in stress studies as well. Respiration can be measured directly by assessing oxygen consumption rates or by tracing the fate of ingested carbon using stable isotopes or radiotracers (e.g. Kreeger et al 1988). In experiments that do not track carbon directly with tracers, the measurements are typically taken with a respirometry system and must be done separately from the static feeding experiment in Steps 32.1 and
Figure 32.3. Measurement of oxygen consumption rates of
freshwater unionid mussels with a Strathkelvin respirometry
system.

PDE-Method (06/2012) Page 12
32.2. The latter method is briefly summarized here, and separate methods exist if radiotracers or stable isotopes are used. Respiration rates are measured as oxygen consumption rates, and inter-converted using standard oxycaloric conversion factors for metazoans. A 6 channel dissolved oxygen measurement system (Strathkelvin Instruments Ltd., Model S1928, Fig. 32.3) is used to monitor oxygen losses in sealed 400 ml respirometry chambers (Strathkelvin RC400) containing a magnetic stir bar for mixing. Each chamber is filled with 0.2 µm filtered ambient water that (to ensure no microbial organisms are present that would substantially contribute to or remove oxygen during the respirometry measurements.) Oxygen electrodes (Strathkelvin, 1302 microcathode) are calibrated to zero with a solution of sodium sulphite (anhydrous) and to 100% with aerated water. Up to 4 individuals from each treatment group is analyzed individually. In addition, up to 4 controls (no bivalves) are run for each treatment (i.e. water type). This approach has been successfully used to measure respiration rates for a variety of species and sizes of freshwater unionids and marine bivalves. Chamber contents are mixed using magnetic stirring bars for incubation periods lasting up to 2 hours. The animal biomass:water volume ratio must be adjusted to ensure oxygen depletion can be accurately detected during this period of time, but not sufficiently long to permit dissolved oxygen concentrations to become depleted by more than 40%. The short incubation period also precludes significant microbial breakdown of any fecal or pseudofecal products that could be carried over and defecated.
32.5 Bivalve Sampling At the conclusion of each feeding experiment, bivalves must be sacrificed to allow for determination of their dry tissue weights. Typically, additional metrics are also recorded such as condition index (see PDE-Method-16), and a freeze-dried portion of homogenized tissue is archived for other potential future assays (e.g. proximate biochemical composition, stable isotope composition, elemental stoichiometry, etc). The dry tissue weight of each animal is essential for constructing allometric relationships of physiological rate functions to body weight. Weight standardization also allows for the best comparability of rate functions among species, environmental conditions, and studies. Tissues from individual bivalves are freeze-dried in pre-weighed vials to determine total dry tissue weights. These are later be pulverized with a mortar and pestle. A subsample of ground tissue is used for the weight-on-ignition method to determine dry tissue weight and ash-free dry tissue weight, which are needed for calculation of condition (see PDE-Method-16). A separate subsample of each freeze-dried tissue sample is then used for each subsequent analysis metric (e.g. CNP, biochemistry, etc).

PDE-Method (06/2012) Page 13
32.6 Scope for Growth Scope-for-growth (SFG) is a measure of an animal’s physiological growth potential, which is useful for describing the physiological status (health) and understanding organismal and population maintenance. Scope-for-growth (SFG) is primarily important for understanding an animal’s organismal condition in response to different treatments or sites. SFG is not necessary for many ecological studies of the effects of bivalve populations in ecosystems. SFG can be calculated after carefully measuring all of the physiological processing rates in Steps 32-1-32.6. SFG was developed as a health assessment metric for aquatic organisms, but it also represents a potentially useful way to examine how rates and fates of material processing can vary spatially and temporally. SFG summarizes the information on various physiological rate functions and permits an animal’s growth rate to be calculated without the need to resample and measure the body size of individuals over protracted time periods (Bayne et al. 1976). SFG closely correlates with long-term growth performance (Beiras et al. 1994). SFG is calculated from the results of component measures of feeding rate, oxygen consumption rate, ammonia excretion rate, and food absorption efficiency. Each of these measures yields important information about how the quantity and quality of natural seston is transformed and returned to the system. The actual equation for SFG produces a value for the net energy ingested that is available for growth and reproduction, based on the standard energy balance equation for a heterotrophic organism (Widdows and Donkin 1992): C = G + R + E + F where C = energy consumed, G = energy used for animal productivity, R = energy lost in respiratory processes, E = energy excreted in dissolved by products, and F = energy lost in defecation. C is calculated by converting energetic filtration rates by multiplying measured seston clearances by the measured seston carbon concentration and established C:energy conversion factors. Respiration I is measured directly as oxygen consumption rate, which was converted to units of energy using standard oxycaloric quotients. The excretion term (E) is calculated similarly, by relating measured ammonia excretion rates to established energy loss conversion formulae. Defecated energy is calculated as the difference between the product of clearance rate and absorption efficiency (absorption rate), and multiplied by published conversion standards relating organic matter to caloric content. By difference, we will estimate P, the energy available for growth and reproduction; i.e., the scope-for-growth. In addition, we also calculated the same value (G) in a second way for comparison, as per Widdows and Donkin (1992): G =–A - (R + E) whereby A = the energy associated with the absorption rate (see above) and the other parameters are as noted above.
PDE-Method (06/2012) Page 14
32.7 Ratio of Oxygen Consumption to Ammonia Excretion (O:N Ratio) The oxygen:nitrogen ratio (O:N ratio) is indicative of nutritional status (Bayne and Widdows 1978, Widdows 1978, Kreeger 1993, Baker and Hornbach 1997), providing evidence for which dietary substrate is being catabolized for a metabolic fuel. O:N ratios of less than 20 indicate that an animal is energy-limited and its productivity is largely being governed by its ability to ingest, digest and assimilate energy from natural diets. Catabolic substrates can consist of protein, lipid or carbohydrate, but the relatively high loss of ammonia suggests that nitrogen and protein are ample in the diet. O:N ratios exceeding 25 indicate that an animal is preferentially catabolizing non-nitrogenous substrates and conserving nitrogen (a.k.a. “protein-sparing”) (Bayne et al. 1985). At such times, an animal’s physiological behavior may not follow standard energy optimization patterns, and protein-rich seston components may be especially important from the mussel’s standpoint (Kreeger et al. 1994). Under such conditions, bivalve populations may be biogeochemical sinks for a greater proportion of particulate nitrogen than usual, and less nitrogen-rich biodeposits may be produced for bottom organisms. References Bayne B.L., R.J. Thompson, and J. Widdows. 1976. Physiology I. In: B.L. Bayne (ed.), Marine mussels: their ecology and physiology. Cambridge University Press, NY. pp. 121-206. Beiras, R., Perez Camacho, A., and Albentosa, M. 1994. Comparison of the scope for growth with the performance of Ostrea edulis seed reared at different food concentrations in an open-flow system. Marine Biology 119: 227-233. Christian, A.D., D. J. Berg, and B. Crump. 2001. Seasonal ecosystem processing and nutrient recycling of freshwater mussels in headwater streams. Abstract from program, 2nd Symposium of the Freshwater Mollusc Conservation Society, March 12-14, 2001, Pittsburgh, PA. pp. 27-28. Conover, R.J. 1966. Assimilation of organic matter by zooplankton. Limnology and Oceanography 11:338-345. Coughlan, J. 1969. The estimation of filtration rate from the clearance of suspensions. Marine Biology 2:356-358. Crosby, M.P. and L.D. Gale. 1990. A review and evaluation of bivalve condition index methodologies with a suggested standard method. J. Shellfish Res. 9:233-238. Kreeger, D. A. 1993. Seasonal patterns in the utilization of dietary protein by the mussel, Mytilus trossulus. Marine Ecology - Progress Series 95: 215-232 Kreeger, D.A. 2004. Beyond biodiversity: the conservation and propagation of native mussel biomass for ecosystem services. In: Proceedings of the 2nd Annual Freshwater Mussels of the Pacific Northwest Symposium. Pacific Northwest Native Freshwater Mussel Workgroup,

PDE-Method (06/2012) Page 15
Vancouver WA. Pp. 11-12. http://columbiariver.fws.gov/mwg/mussel2004ws/2004_Proceedings.pdf Kreeger, D.A., C.E. Goulden, S.S. Kilham, S.G. Lynn, S. Datta and S. J. Interlandi. 1997. Seasonal changes in the biochemistry of lake seston. Freshwater Biology 38: 539-554. Kreeger, D. A., A. J. S. Hawkins, B. L. Bayne and D. L. Lowe. 1995. Seasonal variation in the relative utilization of dietary carbohydrate, protein-carbon and protein-nitrogen by Mytilus edulis (L.) Marine Ecology - Progress Series 126: 177-184. Kreeger, D. A., A. J. S. Hawkins and B. L. Bayne. 1996. Use of dual-labeled microcapsules to discern the anabolic and catabolic fate of dietary protein in suspension-feeders. Limnology and Oceanography 41: 208-215. Kreeger, D.A. and Langdon, 1993. C.J. Effect of dietary protein content on growth of juvenile mussels, Mytilus trossulus (Gould 1850). Biological Bulletin 185:123-139. Kreeger, D. A., C. J. Langdon, and R. I. E. Newell. 1988. Utilization of refractory cellulosic carbon derived from Spartina alterniflora by the ribbed mussel Geukensia demissa. Marine Ecology - Progress Series 42: 171-179. Kreeger, D.A. and R.I.E. Newell. 1996. Ingestion and assimilation of carbon from cellulolytic bacteria and heterotrophic flagellates by the mussels Geukensia demissa and Mytilus edulis (Bivalvia, Mollusca). Aquatic Microbial Ecology 11:205-214. Kreeger, D. A. and R. I. E. Newell. 2001. Seasonal utilization of different seston carbon sources by the ribbed mussel, Geukensia demissa (Dillwyn) in a mid-Atlantic salt marsh. Journal of Experimental Marine Biology and Ecology. 260: 71-91. Solorzano, L. 1969. Determination of ammonia in natural waters by the phenol hypochlorite method. Limnol. Oceanogr. 14:799-801. Widdows, J. and P. Donkin, P. 1992. Mussels and environmental contaminants: bioaccumulation and physiological aspects. Chapter 8. In: E. Gosling (ed.) The Mussel Mytilus: Ecology, Physiology, Genetics and Culture. Elsevier, New York. pp. 383-424.