Embed Size (px)
Citation preview

1
Bloomberg: The underlying pace of U.S. inflation unexpectedly accelerated in December amid increased housing costs, reinforcing the outlook for the
Federal Reserve to raise interest rates several times in 2018. Excluding food and energy, the so-called core consumer price index increased 1.8% from a
year earlier after a 1.7% advance, including a 0.3% monthly gain that topped analyst projections and was the most in almost a year. Including all items,
the broader CPI showed a smaller gain in December in line with estimates, as energy prices declined, according to Labor Department report. The 0.3%
monthly increase in the core CPI topped the 0.2% median estimate of economists surveyed by Bloomberg. Investors’ already -firm expectations rose for
a Fed interest-rate increase in March, as the data could help calm an increasingly heated debate among central bank officials over why inflation has
stayed relatively placid despite solid economic growth and the lowest unemployment rate since 2000. Fed policy makers have pencilled in three rate
hikes in 2018 following three last year. A separate Commerce Department report showed U.S. retail sales rose in December and November’s gain was
revised upward, indicating a robust holiday-shopping season.
Zawya: December data signalled a slowdown in growth in Dubai’s non-oil private sector, according to the Emirates NBD Dubai Economy Tracker Index .
The seasonally adjusted Emirates NBD Dubai Economy Tracker Index eased to 54.7 in December compared to 55.3 in November, slowest rate of im-
provement for 14 months. By sector, wholesale and retail (index at 54.9) was the best performing category, closely followed by construction (index at
53.5). The travel and tourism sector (51.2) experienced the slowest improvement in business conditions. Job creation in the non-oil private sector con-
tinued for the tenth month running during November. The rate of hiring eased, however, and was the weakest reported since June. According to anec-
dotal evidence, firms increased payroll numbers in order to meet rising output requirements. Business activity expectations remained strongly positive
overall during December’s survey. The degree of confidence improved since November and registered above the series’ long-run average. An expected
economic upturn alongside incoming new projects underpinned confidence among non-oil private sector firms in Dubai.
Al Masah Capital: 2018 continues to boost hope and optimism among investors worldwide, with almost all of the main indices ending the second we ek
of the year on a positive note. Regional markets joined the parade, with all six indices ending the week in the green territory, with only Oman having a
marginally lower weekly performance of -0.3%. Egypt comes as the best performer among its peers over the week, going up by +3.1%, followed by
Kuwait +1.6%, Dubai and Abu Dhabi each up by +0.9%, while Saudi Arabia advanced by +0.8%, followed by Bahrain +0.3%. Oil pric es rose for a sixth day
on Friday after Russia's oil minister said that global crude supplies were "not balanced yet," alleviating market concerns about a wind-down of the OPEC
-led deal to reduce production. Brent was trading just below the USD70 per barrel. For the coming period, investors’ optimism will continue driving
trading activities in the region higher backed by the increase in oil prices and governments’ improved macro outlook based on this increase.
Data and News Source: Thomson Reuters
Weekly Investment Report
Sunday, January 14, 2018
Economic & Market News
Indexes Last WTD (%) MTD (%) YTD (%)
DJI 25,803.19 2.01% 4.39% 4.39%
S&P 500 2,786.24 1.57% 4.21% 4.21%
NASDAQ 6,758.54 1.58% 5.66% 5.66%
STOXX Europe 600 398.49 0.29% 2.39% 2.39%
FTSE 100 7,778.64 0.70% 1.18% 1.18%
DAX 13,245.03 -0.56% 2.53% 2.53%
CAC 40 5,517.06 0.85% 3.85% 3.85%
Nikkei 225 23,653.82 -0.26% 3.90% 3.90%
SENSEX 34,592.39 1.28% 1.57% 1.57%
Shanghai Composite 3,428.94 1.10% 3.68% 3.68%
Hang Seng 31,412.54 1.94% 4.99% 4.99%
Commodities & FX Last WTD (%) MTD (%) YTD (%)
Oil (Brent) 69.87 3.08% 4.49% 4.49%
Natural Gas 3.20 12.87% 8.36% 8.36%
Gold 1338.34 1.35% 2.76% 2.76%
Silver 17.25 0.65% 1.81% 1.81%
EURUSD 1.22 1.31% 1.58% 1.58%
GBPUSD 1.37 1.17% 1.59% 1.59%
USDJPY 111.03 -1.80% -1.46% -1.46%
USDCHF 0.97 -0.72% -0.65% -0.65%
AUDUSD 0.79 0.64% 1.42% 1.42%
USDCAD 1.25 0.39% -0.97% -0.97%
LIBOR US Dollar WoW (%) Euro WoW (%)
1 Month 1.631 0.59% -0.391 -0.22%
2 Month 1.720 0.95% -0.381 -0.78%
3 Month 1.880 1.20% -0.325 0.31%
6 Month 1.453 0.00% -0.300 0.14%
12 Month 1.736 -0.02% -0.187 0.16%
Indexes Last WTD (%) MTD (%) YTD (%)
Dubai (DFMGI) 3,494.63 0.90% 3.70% 3.70%
Abu Dhabi (ADSMI) 4,591.11 0.94% 4.38% 4.38%
Saudi (SASEIDX) 7,338.04 0.84% 1.55% 1.55%
Kuwait (KWSE) 6,560.63 1.65% 2.38% 2.38%
Egypt (EGX30) 15,242.48 3.11% 1.49% 1.49%
Qatar (DSM) 9,135.86 5.85% 7.19% 7.19%
Bahrain (BHSEIDX) 1,316.88 0.35% -1.11% -1.11%
Oman (MSM30) 5,087.47 -0.34% -0.23% -0.23%
TR GCC (Reuters) 200.90 2.61% 5.15% 5.15%
DJ MENA 526.67 0.00% 0.00% 0.00%
2 Data and News Source: Thomson Reuters
Zawya: Egypt's inflation dropped sharply in December, the latest apparent indication of economic improvement after the 2016 currency float hit Egyptians hard. Economists say, however, it may just be showing that spending power has yet to recover. Prices climbed to record highs and the Egyptian pound lost half its value after the central bank floated it in November 2016 in a bid to secure a USD 12 billion IMF loan to boost economic growth after years of turmoil. With the pound at about 17.7 to the U.S. dollar from a pegged 8.8 before the float, Egyptians have had to amend their spending habits to deal with their incomes and savings being slashed in half. Urban consumer inflation eased to 21.9% percent in December from 26 percent the previous month, its lowest reading since the flotation. Core inflation, stripping out volatile items such as food, fell to 19.86% from 25.53%. Since the float, Egyptian exports have found new markets, narrowing the country's trade deficit, and foreign re-serves and foreign direct investment have surged to record highs. Monthly headline inflation contracted for the first time in two years in December due to a decline in the prices of poultry, meat and some vegetables and beans, according to the data. Reuters: China’s exports and imports growth slowed in December after surging in the previous month, adding to signs of ebbing economic momentum as the government extends a crackdown on financial risks and factory pollution. A synchronized uptick in the global economy over the past year has been a boon to China and much of trade-dependent Asia, with Chinese exports in 2017 growing at their quickest pace in four years. The sharp December imports slowdown, however, is raising concerns that the world’s second-biggest economy faces domestic-demand pressure as authorities turn off cheap credit and restrict speculative financing. In December, exports rose 10.9% from a year earlier, beating analysts’ forecast of a 9.1% increase, but cooling from a robust 12.3% gain in November, the General Administration of Customs. Imports grew at an even slower pace of 4.5% year-on-year last month, the weakest since they rose 3.1% in December 2016, and way below forecasts of 13.0% growth. Despite the De-cember slowdown, the overall picture for 2017 underscored strong global appetite for Chinese products ranging from electronics, household appliances and a vast array of consumer goods. Exports from the Asian giant for the full year rose 7.9%, the fastest rate since 2013, while imports also gained a sizzling 15.9%, the best since 2011, thanks to insatiable Chinese demand for commodities. Zawya: Bahrain recorded an annual real GDP growth rate of 3.6% and nominal GDP annual growth rate of 6.9% during the third quarter (Q3) of 2017 compared to the same period the previous year, according to Information & eGovernment Authority (iGA). According to the report, Bahrain's economy has witnessed a growth due to infrastruc-ture’s investments increase and the financial stability of the Kingdom. These positive indicators reflect government’s efforts to enhance the national economy which faces challenges at the local, regional and international levels. The report demonstrated that the real quarterly growth rate is 1.6% and the nominal growth rate is 2.2% when compared to the second quarter’s 2017 results. It has also shown that the results of growth rates in the oil sector have increased by nearly 13.4% at current prices due to the high price of a barrel of oil compared to the previous year. Due to the increase of production, the manufacturing industry has grown by 3.2% at constant prices and 3.5% at the current prices. Construction sector grew by 0.8% at constant prices and 12% at current prices. Real estate and business activities grew by 4.6% at constant prices and by the same percentage at current prices. While the transport and communications sector achieved an increase of 5.8% in constant prices and 8.3% in current prices. The report pointed out that other government services increased by 3.1% at constant prices and by 2% at current prices.
Economic & Market News (continued)
Weekly Investment Report
Sunday, January 14, 2018
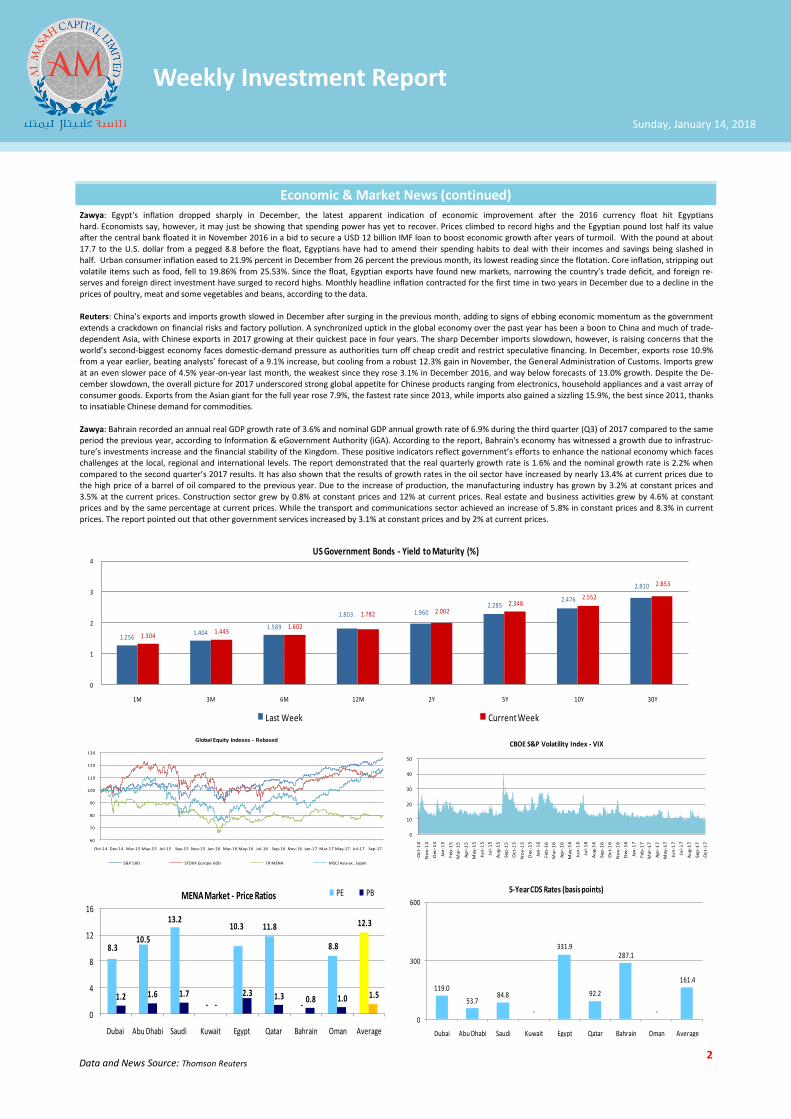
1.2561.404
1.589
1.803 1.9602.285
2.476
2.810
1.3041.445
1.602
1.782 2.0022.348
2.552
2.853
0
1
2
3
4
1M 3M 6M 12M 2Y 5Y 10Y 30Y
US Government Bonds - Yield to Maturity (%)
Last Week Current Week
8.310.5
13.2
-
10.3 11.8
-
8.8
12.3
1.2 1.6 1.7-
2.3 1.3 0.8 1.0 1.5
0
4
8
12
16
Dubai Abu Dhabi Saudi Kuwait Egypt Qatar Bahrain Oman Average
PE PBMENA Market - Price Ratios
119.0
53.784.8
-
331.9
92.2
287.1
-
161.4
0
300
600
Dubai Abu Dhabi Saudi Kuwait Egypt Qatar Bahrain Oman Average
5-Year CDS Rates (basis points)
0
10
20
30
40
50
Oct-
14
No
v-1
4
Dec
-14
Jan
-15
Feb
-15
Mar
-15
Ap
r-1
5
May
-15
Jun
-15
Jul-
15
Au
g-1
5
Sep
-15
Oct
-15
No
v-1
5
Dec
-15
Jan
-16
Feb
-16
Mar
-16
Ap
r-1
6
May
-16
Jun
-16
Jul-
16
Au
g-1
6
Sep
-16
Oct
-16
No
v-1
6
Dec
-16
Jan
-17
Feb
-17
Mar
-17
Ap
r-1
7
May
-17
Jun
-17
Jul-
17
Au
g-1
7
Sep
-17
Oct
-17
CBOE S&P Volatility Index - VIX
60
70
80
90
100
110
120
130
Oct-14 Dec-14 Mar-15 May-15 Jul-15 Sep-15 Nov-15 Jan-16 Mar-16 May-16 Jul-16 Sep-16 Nov-16 Jan-17 Mar-17 May-17 Jul-17 Sep-17
Global Equity Indexes - Rebased
S&P 500 STOXX Europe 600 TR MENA MSCI Asia ex. Japan

3
Government Bonds
Government Bond Name Currency Maturity Coupon Current Yield (%) YTM - Ask (%) Rating * Bid Ask
UAE - Emirate of Abu Dhabi ABU DHABI GOVT INT'L USD 08/04/2019 6.75 2.38 2.38 AA 105.25 105.30
United States of America US TREASURY N/B USD 31/05/2020 1.50 2.06 2.06 AAA 98.72 98.74
United Kingdom of Great Britain UK TSY 4 3/4% 2020 GBP 07/03/2020 4.75 0.59 0.59 AAA 108.84 108.87
Kingdom of Bahrain KINGDOM OF BAHRAIN USD 31/03/2020 5.50 4.59 4.59 102.66 102.95
UAE - Emirate of Dubai DUBAI GOVT INT'L BONDS USD 05/10/2020 7.75 2.87 2.84 112.66 112.94
United States of America US TREASURY N/B USD 15/05/2025 2.13 2.50 2.50 AAA 97.52 97.54
State of Qatar STATE OF QATAR USD 15/06/2030 9.75 4.09 4.09 Aa3 154.61 155.61
Arab Republic of Egypt ARAB REPUBLIC OF EGYPT USD 30/04/2040 6.88 6.81 6.83 B3 100.73 101.50
United States of America US TREASURY N/B USD 15/05/2045 3.00 2.84 2.84 AAA 102.97 103.02
Kingdom of Bahrain KINGDOM OF BAHRAIN USD 19/09/2044 6.00 7.31 7.29 B+ 84.74 85.49
Data and News Source: Thomson Reuters * Thomson Reuters composite rating; NR = No Rating
Corporate Bonds
Government/Parent Company Bond Name Currency Maturity Coupon Current Yield (%) YTM - Ask (%) Rating * Bid Ask
Abu Dhabi Water & Electricity TAQA ABU DHABI NATL ENER USD 01/08/2018 7.25 2.31 2.31 BBB+ 102.63 102.65
Abu Dhabi Water & Electricity TAQA ABU DHABI NATL ENER USD 16/09/2019 6.25 2.70 2.70 BBB+ 105.74 105.82
Qatar Petroleum RAS LAFFAN LNG 3 USD 30/09/2019 6.75 2.66 2.67 A 106.76 106.84
National Bank of Oman NATIONAL BANK OF OMAN USD 07/10/2019 3.13 3.44 3.45 Baa3 99.47 99.55
Qatari Diar Real Estate Invest QATARI DIAR FINANCE QSC USD 21/07/2020 5.00 3.07 3.07 Aa3 104.62 105.37
Stichting Waha Aerospace WAHA AEROSPACE BV USD 28/07/2020 3.93 2.72 2.72 AA 101.50 102.25
Qatar Petroleum RAS LAFFAN LNG II USD 30/09/2020 5.30 3.01 3.01 A 103.25 103.32
Investment Corp of Dubai EMIRATES NBD PJSC EUR 23/03/2022 1.75 0.95 0.96 A+ 103.28 103.98
Saudi Electricity Co SAUDI ELECTRICITY GLOBAL USD 03/04/2022 4.21 3.12 3.13 A 104.27 105.02
Emaar Malls Group PJSC EMG SUKUK LTD USD 18/06/2024 4.56 3.92 3.92 Baa2 103.63 104.06
Emirate of Sharjah United Arab SHARJAH SUKUK LTD USD 17/09/2024 3.76 3.28 3.28 A3 102.87 103.18
Qatar Petroleum RAS LAFFAN LNG 3 USD 30/09/2027 5.84 3.83 3.83 A 112.12 112.45
Qatar Gas Transport Co Ltd NAKILAT INC USD 31/12/2033 6.07 4.09 4.09 A 116.39 116.85
Port & Free Zone World FZE DP WORLD LTD USD 02/07/2037 6.85 4.89 4.89 BBB+ 124.38 125.38
Burgan Bank SAK BURGAN TIER 1 FINANCING USD Perpetual 7.25 6.08 7.54 101.86 102.54
Emirates NBD PJSC EMIRATES NBD 2014 TIER 1 USD Perpetual 6.38 5.09 6.42 103.15 103.85
Weekly Investment Report
Sunday, January 14, 2018

4 Data and News Source: Thomson Reuters
EIBOR 1 Week 1 Month 2 Months 3 Months 6 Months 12 Months
1.3410 1.6250 N/A 1.8190 2.0015 2.5912
Deposit Rates T/N 1 Week 1 Month 2 Months 3 Months 6 Months 9 Months 12 Months
1.51 0.75 1.53 1.59 1.68 1.86 2.02 2.17
Swap Rates 1 Year 2 Years 3 Years 4 Years 5 Years 7 Years 10 Years
2.11 2.43 2.67 2.87 3.04 3.34 3.66
UA
E
Money Markets
SAIBOR 1 Month 2 Months 3 Months 6 Months 9 Months 12 Months
1.69 2.03 1.89 2.09 2.39 2.28
Deposit Rates T/N 1 Week 1 Month 2 Months 3 Months 6 Months 9 Months 12 Months
1.05 1.31 1.53 1.59 1.62 1.80 2.03 2.00
Swap Rates 1 Year 2 Years 3 Years 4 Years 5 Years 7 Years 10 Years
2.22 2.58 2.81 2.98 3.15 3.39 3.68
Sau
di
KIBOR O/N 1 Month 3 Months 6 Months 1 Year 2 Years 3 Years
0.75 1.69 1.88 2.06 2.38 2.39 2.25
Deposit Rates O/N T/N 1 Week 1 Month 2 Months 3 Months 6 Months 9 Months 12 Months
0.37 0.37 1.26 1.56 1.62 1.71 1.89 2.05 2.20
Swap Rates 1 Year 2 Years 3 Years 4 Years 5 Years 7 Years 10 Years
1.94 2.26 2.36 0.00 2.46 2.5000 2.5900
Ku
wai
t
EGIBR O/N < 1 Week 1 Week < 1 Month 1 Month > 1 Month
10.90 9.20 9.31 11.10 11.10 8.85
Bank Rates Re Discount Lending Benchmark
9.25 9.75 8.75
T-Bill Yields 1 Week 1 Month 3 Months 6 Months 9 Months 1 Year 2 Years 3 Years
10.80 11.30 11.50 11.65 11.75 11.80 12.40 12.70
Egyp
t
QIBOR O/N 1 Week 1 Month 2 Months 3 Months 6 Months 9 Months 12 Months
0.82 0.88 0.97 1.06 1.14 1.29 1.37 1.47
Deposit Rates 1 Week 1 Month 2 Months 3 Months 6 Months 9 Months 12 Months
1.51 1.15 1.00 1.52 1.57 1.05 1.83
QCB Interest Rates O/N Deposit O/N Lending Repo Rate
0.75 4.50 4.50
Qat
ar
BHIBOR O/N 1 Week 1 Month 2 Months 3 Months 6 Months 9 Months 12 Months
1.60 1.90 2.50 2.60 2.78 2.95 3.10 3.33
Interest Rates O/N Deposit 1W Deposit O/N Repo O/N Secured
1.40 1.75 3.50 3.50
Swap Rates 1 Year 2 Years 3 Years 4 Years 5 Years 7 Years 10 Years
2.84 3.19 3.30 3.34 3.39 3.45 3.53
Bah
rain
Weekly Investment Report
Sunday, January 14, 2018
5 Data and News Source: Thomson Reuters
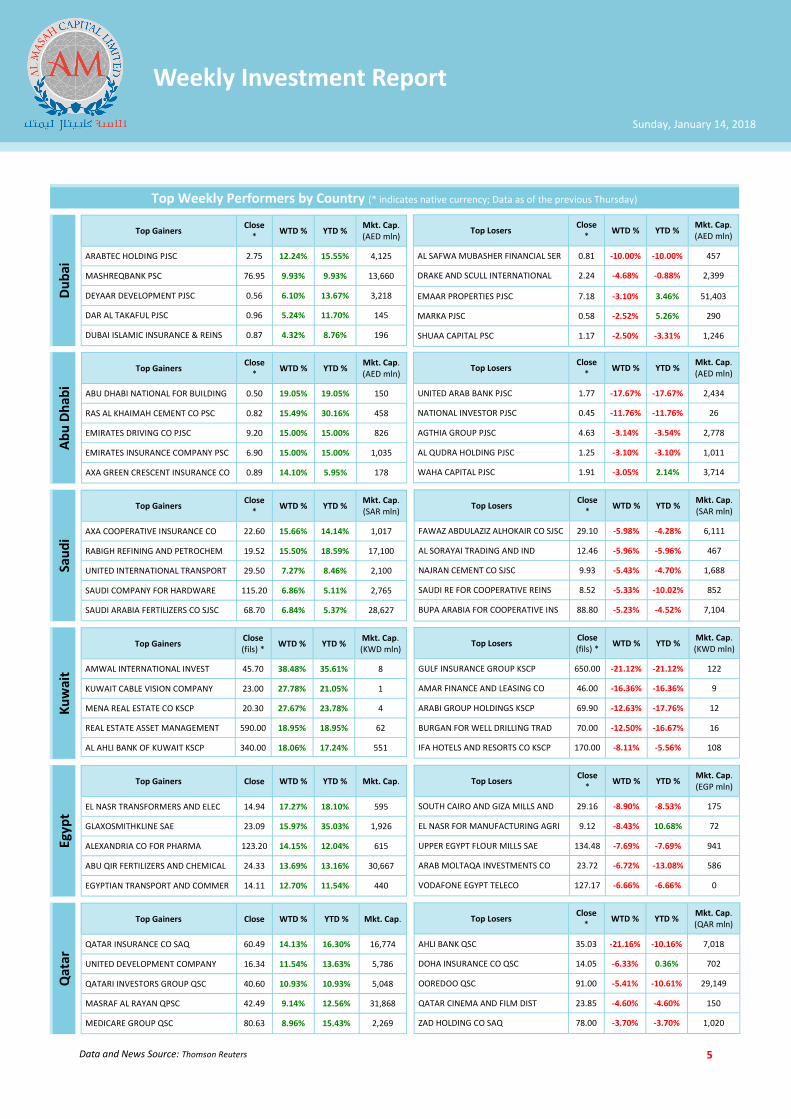
Top Gainers Close
* WTD % YTD %
Mkt. Cap.(AED mln)
ARABTEC HOLDING PJSC 2.75 12.24% 15.55% 4,125
MASHREQBANK PSC 76.95 9.93% 9.93% 13,660
DEYAAR DEVELOPMENT PJSC 0.56 6.10% 13.67% 3,218
DAR AL TAKAFUL PJSC 0.96 5.24% 11.70% 145
DUBAI ISLAMIC INSURANCE & REINS 0.87 4.32% 8.76% 196
Du
bai
Top Weekly Performers by Country (* indicates native currency; Data as of the previous Thursday)
Ab
u D
hab
i Sa
ud
i K
uw
ait
Egyp
t Q
atar
Top Losers Close
* WTD % YTD %
Mkt. Cap.(AED mln)
AL SAFWA MUBASHER FINANCIAL SER 0.81 -10.00% -10.00% 457
DRAKE AND SCULL INTERNATIONAL 2.24 -4.68% -0.88% 2,399
EMAAR PROPERTIES PJSC 7.18 -3.10% 3.46% 51,403
MARKA PJSC 0.58 -2.52% 5.26% 290
SHUAA CAPITAL PSC 1.17 -2.50% -3.31% 1,246
Top Gainers Close
* WTD % YTD %
Mkt. Cap.(AED mln)
ABU DHABI NATIONAL FOR BUILDING 0.50 19.05% 19.05% 150
RAS AL KHAIMAH CEMENT CO PSC 0.82 15.49% 30.16% 458
EMIRATES DRIVING CO PJSC 9.20 15.00% 15.00% 826
EMIRATES INSURANCE COMPANY PSC 6.90 15.00% 15.00% 1,035
AXA GREEN CRESCENT INSURANCE CO 0.89 14.10% 5.95% 178
Top Losers Close
* WTD % YTD %
Mkt. Cap.(AED mln)
UNITED ARAB BANK PJSC 1.77 -17.67% -17.67% 2,434
NATIONAL INVESTOR PJSC 0.45 -11.76% -11.76% 26
AGTHIA GROUP PJSC 4.63 -3.14% -3.54% 2,778
AL QUDRA HOLDING PJSC 1.25 -3.10% -3.10% 1,011
WAHA CAPITAL PJSC 1.91 -3.05% 2.14% 3,714
Top Gainers Close
* WTD % YTD %
Mkt. Cap.(SAR mln)
AXA COOPERATIVE INSURANCE CO 22.60 15.66% 14.14% 1,017
RABIGH REFINING AND PETROCHEM 19.52 15.50% 18.59% 17,100
UNITED INTERNATIONAL TRANSPORT 29.50 7.27% 8.46% 2,100
SAUDI COMPANY FOR HARDWARE 115.20 6.86% 5.11% 2,765
SAUDI ARABIA FERTILIZERS CO SJSC 68.70 6.84% 5.37% 28,627
Top Losers Close
* WTD % YTD %
Mkt. Cap.(SAR mln)
FAWAZ ABDULAZIZ ALHOKAIR CO SJSC 29.10 -5.98% -4.28% 6,111
AL SORAYAI TRADING AND IND 12.46 -5.96% -5.96% 467
NAJRAN CEMENT CO SJSC 9.93 -5.43% -4.70% 1,688
SAUDI RE FOR COOPERATIVE REINS 8.52 -5.33% -10.02% 852
BUPA ARABIA FOR COOPERATIVE INS 88.80 -5.23% -4.52% 7,104
Top Gainers Close (fils) *
WTD % YTD % Mkt. Cap.(KWD mln)
AMWAL INTERNATIONAL INVEST 45.70 38.48% 35.61% 8
KUWAIT CABLE VISION COMPANY 23.00 27.78% 21.05% 1
MENA REAL ESTATE CO KSCP 20.30 27.67% 23.78% 4
REAL ESTATE ASSET MANAGEMENT 590.00 18.95% 18.95% 62
AL AHLI BANK OF KUWAIT KSCP 340.00 18.06% 17.24% 551
Top Losers Close (fils) *
WTD % YTD % Mkt. Cap.(KWD mln)
GULF INSURANCE GROUP KSCP 650.00 -21.12% -21.12% 122
AMAR FINANCE AND LEASING CO 46.00 -16.36% -16.36% 9
ARABI GROUP HOLDINGS KSCP 69.90 -12.63% -17.76% 12
BURGAN FOR WELL DRILLING TRAD 70.00 -12.50% -16.67% 16
IFA HOTELS AND RESORTS CO KSCP 170.00 -8.11% -5.56% 108
Top Gainers Close WTD % YTD % Mkt. Cap.
EL NASR TRANSFORMERS AND ELEC 14.94 17.27% 18.10% 595
GLAXOSMITHKLINE SAE 23.09 15.97% 35.03% 1,926
ALEXANDRIA CO FOR PHARMA 123.20 14.15% 12.04% 615
ABU QIR FERTILIZERS AND CHEMICAL 24.33 13.69% 13.16% 30,667
EGYPTIAN TRANSPORT AND COMMER 14.11 12.70% 11.54% 440
Top Losers Close
* WTD % YTD %
Mkt. Cap.(EGP mln)
SOUTH CAIRO AND GIZA MILLS AND 29.16 -8.90% -8.53% 175
EL NASR FOR MANUFACTURING AGRI 9.12 -8.43% 10.68% 72
UPPER EGYPT FLOUR MILLS SAE 134.48 -7.69% -7.69% 941
ARAB MOLTAQA INVESTMENTS CO 23.72 -6.72% -13.08% 586
VODAFONE EGYPT TELECO 127.17 -6.66% -6.66% 0
Top Gainers Close WTD % YTD % Mkt. Cap.
QATAR INSURANCE CO SAQ 60.49 14.13% 16.30% 16,774
UNITED DEVELOPMENT COMPANY 16.34 11.54% 13.63% 5,786
QATARI INVESTORS GROUP QSC 40.60 10.93% 10.93% 5,048
MASRAF AL RAYAN QPSC 42.49 9.14% 12.56% 31,868
MEDICARE GROUP QSC 80.63 8.96% 15.43% 2,269
Top Losers Close
* WTD % YTD %
Mkt. Cap.(QAR mln)
AHLI BANK QSC 35.03 -21.16% -10.16% 7,018
DOHA INSURANCE CO QSC 14.05 -6.33% 0.36% 702
OOREDOO QSC 91.00 -5.41% -10.61% 29,149
QATAR CINEMA AND FILM DIST 23.85 -4.60% -4.60% 150
ZAD HOLDING CO SAQ 78.00 -3.70% -3.70% 1,020
Weekly Investment Report
Sunday, January 14, 2018
6
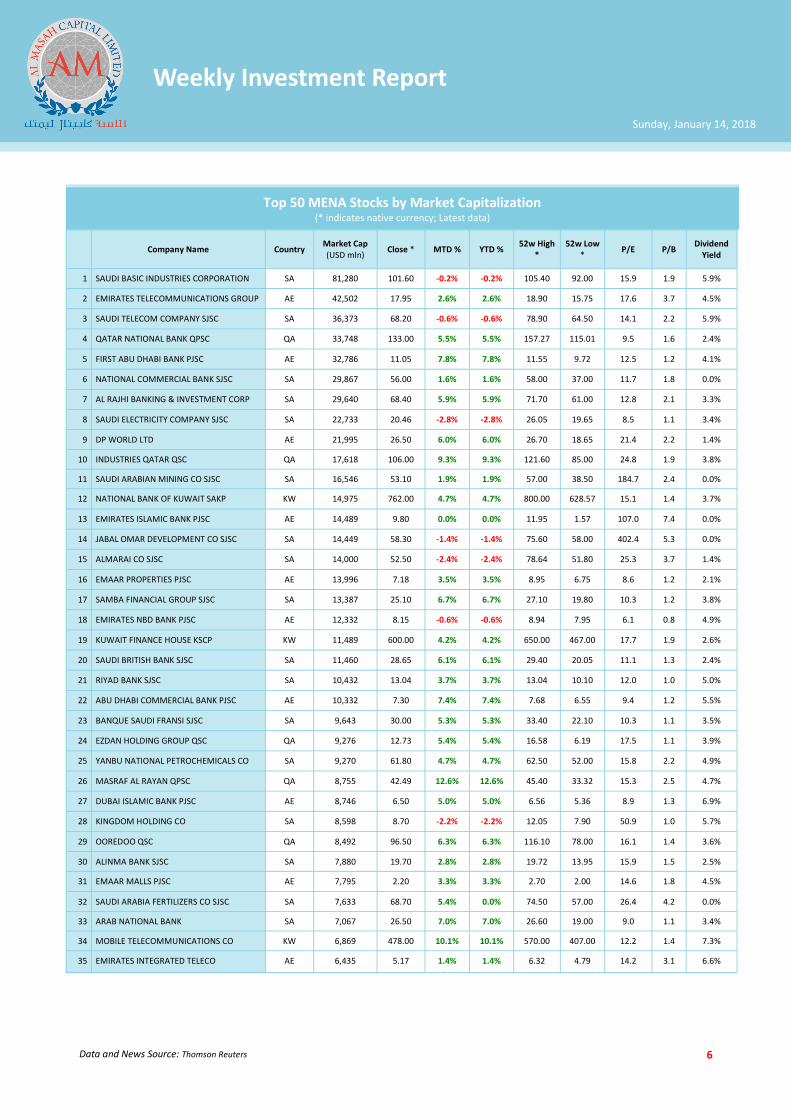
Company Name Country Market Cap (USD mln)
Close * MTD % YTD % 52w High
* 52w Low
* P/E P/B
Dividend Yield
1 SAUDI BASIC INDUSTRIES CORPORATION SA 81,280 101.60 -0.2% -0.2% 105.40 92.00 15.9 1.9 5.9%
2 EMIRATES TELECOMMUNICATIONS GROUP AE 42,502 17.95 2.6% 2.6% 18.90 15.75 17.6 3.7 4.5%
3 SAUDI TELECOM COMPANY SJSC SA 36,373 68.20 -0.6% -0.6% 78.90 64.50 14.1 2.2 5.9%
4 QATAR NATIONAL BANK QPSC QA 33,748 133.00 5.5% 5.5% 157.27 115.01 9.5 1.6 2.4%
5 FIRST ABU DHABI BANK PJSC AE 32,786 11.05 7.8% 7.8% 11.55 9.72 12.5 1.2 4.1%
6 NATIONAL COMMERCIAL BANK SJSC SA 29,867 56.00 1.6% 1.6% 58.00 37.00 11.7 1.8 0.0%
7 AL RAJHI BANKING & INVESTMENT CORP SA 29,640 68.40 5.9% 5.9% 71.70 61.00 12.8 2.1 3.3%
8 SAUDI ELECTRICITY COMPANY SJSC SA 22,733 20.46 -2.8% -2.8% 26.05 19.65 8.5 1.1 3.4%
9 DP WORLD LTD AE 21,995 26.50 6.0% 6.0% 26.70 18.65 21.4 2.2 1.4%
10 INDUSTRIES QATAR QSC QA 17,618 106.00 9.3% 9.3% 121.60 85.00 24.8 1.9 3.8%
11 SAUDI ARABIAN MINING CO SJSC SA 16,546 53.10 1.9% 1.9% 57.00 38.50 184.7 2.4 0.0%
12 NATIONAL BANK OF KUWAIT SAKP KW 14,975 762.00 4.7% 4.7% 800.00 628.57 15.1 1.4 3.7%
13 EMIRATES ISLAMIC BANK PJSC AE 14,489 9.80 0.0% 0.0% 11.95 1.57 107.0 7.4 0.0%
14 JABAL OMAR DEVELOPMENT CO SJSC SA 14,449 58.30 -1.4% -1.4% 75.60 58.00 402.4 5.3 0.0%
15 ALMARAI CO SJSC SA 14,000 52.50 -2.4% -2.4% 78.64 51.80 25.3 3.7 1.4%
16 EMAAR PROPERTIES PJSC AE 13,996 7.18 3.5% 3.5% 8.95 6.75 8.6 1.2 2.1%
17 SAMBA FINANCIAL GROUP SJSC SA 13,387 25.10 6.7% 6.7% 27.10 19.80 10.3 1.2 3.8%
18 EMIRATES NBD BANK PJSC AE 12,332 8.15 -0.6% -0.6% 8.94 7.95 6.1 0.8 4.9%
19 KUWAIT FINANCE HOUSE KSCP KW 11,489 600.00 4.2% 4.2% 650.00 467.00 17.7 1.9 2.6%
20 SAUDI BRITISH BANK SJSC SA 11,460 28.65 6.1% 6.1% 29.40 20.05 11.1 1.3 2.4%
21 RIYAD BANK SJSC SA 10,432 13.04 3.7% 3.7% 13.04 10.10 12.0 1.0 5.0%
22 ABU DHABI COMMERCIAL BANK PJSC AE 10,332 7.30 7.4% 7.4% 7.68 6.55 9.4 1.2 5.5%
23 BANQUE SAUDI FRANSI SJSC SA 9,643 30.00 5.3% 5.3% 33.40 22.10 10.3 1.1 3.5%
24 EZDAN HOLDING GROUP QSC QA 9,276 12.73 5.4% 5.4% 16.58 6.19 17.5 1.1 3.9%
25 YANBU NATIONAL PETROCHEMICALS CO SA 9,270 61.80 4.7% 4.7% 62.50 52.00 15.8 2.2 4.9%
26 MASRAF AL RAYAN QPSC QA 8,755 42.49 12.6% 12.6% 45.40 33.32 15.3 2.5 4.7%
27 DUBAI ISLAMIC BANK PJSC AE 8,746 6.50 5.0% 5.0% 6.56 5.36 8.9 1.3 6.9%
28 KINGDOM HOLDING CO SA 8,598 8.70 -2.2% -2.2% 12.05 7.90 50.9 1.0 5.7%
29 OOREDOO QSC QA 8,492 96.50 6.3% 6.3% 116.10 78.00 16.1 1.4 3.6%
30 ALINMA BANK SJSC SA 7,880 19.70 2.8% 2.8% 19.72 13.95 15.9 1.5 2.5%
31 EMAAR MALLS PJSC AE 7,795 2.20 3.3% 3.3% 2.70 2.00 14.6 1.8 4.5%
32 SAUDI ARABIA FERTILIZERS CO SJSC SA 7,633 68.70 5.4% 0.0% 74.50 57.00 26.4 4.2 0.0%
33 ARAB NATIONAL BANK SA 7,067 26.50 7.0% 7.0% 26.60 19.00 9.0 1.1 3.4%
34 MOBILE TELECOMMUNICATIONS CO KW 6,869 478.00 10.1% 10.1% 570.00 407.00 12.2 1.4 7.3%
35 EMIRATES INTEGRATED TELECO AE 6,435 5.17 1.4% 1.4% 6.32 4.79 14.2 3.1 6.6%
Data and News Source: Thomson Reuters
Top 50 MENA Stocks by Market Capitalization (* indicates native currency; Latest data)
Weekly Investment Report
Sunday, January 14, 2018

7
Company Name Country Market Cap (USD mln)
Close * MTD % YTD % 52w High
* 52w Low
* P/E P/B
Dividend Yield
36 QATAR ISLAMIC BANK QPSC QA 6,427 99.00 2.1% 2.1% 110.50 86.90 10.3 1.2 4.8%
37 EMAAR DEVELOPMENT PJSC AE 6,240 5.73 12.6% 12.6% 5.93 5.00 8.7 2.7 0.0%
38 DAMAC PROPERTIES DUBAI CO PSC AE 5,617 3.41 3.3% 3.3% 4.57 2.48 0.0 1.5 0.0%
39 SAVOLA GROUP COMPANY SJSC SA 5,575 39.15 -0.8% -0.8% 51.00 32.30 195.8 2.3 0.0%
40 QATAR ELECTRICITY AND WATER CO QSC QA 5,560 184.00 3.4% 3.4% 247.90 161.99 12.5 2.3 4.1%
41 COMMERCIAL INTERNATIONAL BANK EG 5,253 79.94 3.3% 3.3% 88.80 71.12 13.7 3.5 0.6%
42 AHLI UNITED BANK BSC BA 5,176 0.69 -2.1% -2.1% 0.79 0.59 9.1 1.2 6.0%
43 ALDAR PROPERTIES PJSC AE 4,817 2.25 2.3% 2.3% 2.74 2.10 6.9 0.8 0.0%
44 MESAIEED PETROCHEMICAL HOLDING CO QA 4,728 13.70 8.8% 8.8% 15.98 10.51 15.9 1.2 4.4%
45 QATAR INSURANCE CO SAQ QA 4,608 60.49 16.3% 16.3% 77.39 36.90 25.7 1.8 2.2%
46 RABIGH REFINING AND PETROCHEMICAL SA 4,560 19.52 18.6% 18.6% 19.84 10.60 0.0 1.9 0.0%
47 SAUDI KAYAN PETROCHEMICAL CO SJSC SA 4,472 11.18 4.5% 4.5% 11.28 7.40 17.1 1.2 0.0%
48 AGILITY PUBLIC WAREHOUSING CO KSCP KW 3,847 869.00 8.4% 8.4% 984.00 509.09 16.9 1.2 1.6%
49 BARWA REAL ESTATE COMPANY QPSC QA 3,741 34.99 9.3% 9.3% 41.80 27.36 10.2 0.7 7.1%
50 JARIR MARKETING CO SJSC SA 3,720 155.00 5.9% 5.9% 158.80 116.00 16.8 8.8 4.7%
Total MCap; Weighted Avg Div Yield 687,232 3.5%
Data and News Source: Thomson Reuters
Top 50 MENA Stocks by Market Capitalization — Continued (* indicates native currency; Latest data)
Weekly Investment Report
Sunday, January 14, 2018
Disclaimer: This report is prepared by Al Masah Capital Management Limited (“AMCML”). AMCML is a company incorporated in the DIFC (Dubai International Financial Centre) and regulated by the DFSA (Dubai Financial Services Authority). The information contained in this report does not constitute any offer to sell securities or the solicitation of any offer to buy, or recommendation for investment in, any securities in any jurisdiction. The information in this report is not intended as financial advice and is only intended to be used by experienced investment persons with appropriate investment knowledge and ones that AMCML is satisfied meet the regulatory criteria to be classified as a ‘Professional Client’ as defined under the Rules & Regulations of the appropriate financial authority. More-over, none of the report is intended as a prospectus within the meaning of the applicable laws of any jurisdiction and none of the report is directed to any person in any country in which the distribution of such report is unlawful. This report provides general information only. The informa-tion and opinions in the report constitute a judgment as at the date indicated and are subject to change without notice. The information may therefore not be accurate or current. The information and opinions con-tained in this report have been compiled or arrived at from sources believed to be reliable in good faith, but no representation or warranty, express, or implied, is made by AMCML, as to their accuracy, completeness or correctness and AMCML does also not warrant that the information is up to date. Any reference to third party research material or any other report contained in this report represents the respective research organi-zation's estimates and views and does not represent the views of AMCML and its officers and employees do not accept any liability or responsibility whatsoever with respect to its accuracy or correctness and AMCML has included such reports or made reference to such reports in good faith. This report may also provide the addresses of, or contain hyperlinks to websites. Except to the extent to which the report refers, AMCML takes no responsibility whatsoever for the contents therein. Such addresses or hyperlinks are provided solely for your convenience and information and the content of the linked site does not in any way form part of this report. Accessing such website or following such link through this report shall be at your own risk. Moreover, you should be aware of the fact that investments in undertakings, securities or other financial instruments involve general and specific risks. Past results do not guarantee future performance. AMCML does not accept any liability for any loss arising from the use of material presented in this report. AMCML may seek to do business, or may already have had some business dealings, with companies covered in this report. As a result, investors should be aware that AMCML may be considered as having a conflict of interest that could affect the objectivity of research produced. Investors should consider any AMCML research as only a single factor in making any investment decision. This document has not been reviewed by, approved by or filed with the DFSA. This report or any portion hereof may not be reprinted, sold or redistributed without our prior written consent of the Company.
Copyright © 2015 Al Masah Capital Management Limited