Embed Size (px)
Citation preview

A historic review and outlook of Dubai’s Real Estate sector from 2008 to 2016
Dubai Real Estate ReportQ4 2016
2 Dubai Real Estate Report - Q4 2016
Content
Dubai
Historic Review and Outlook
2016 Highlights
2017 Outlook
03
Dubai
Rental Rates
Sales Prices
Property Map
06
About Asteco
10

DU
BAI
3© Asteco Property Management, 2017
DubaiHistoric Review and Outlook
Growth 2002-2008
Recession 2009-2011
Recovery and Growth 2012-2013
Stabilisation 2014-2015
Slowdown 2016
• Since the Dubai Government permitted the ownership of property on a freehold / leasehold basis to non-GCC nationals in 2002, the overseas interest in the local market was exceptional and resulted in the launch of numerous development projects.
• Nakheel, Dubai Properties and Emaar established themselves as the dominant Master Developers in the market launching a range of villa and apartment projects across Dubai.
• However, the delivery of properties in Dubai was slower than anticipated, which resulted in an undersupply causing both rental rates and sales prices to spiral out of control.
• Sales prices were inflated further due to rampant market speculation and limited Real Estate laws being in place to curb such activity.
• The financial crisis at the end of 2008 resulted in significant job losses, defaults, distressed sales and consequently a decline in rental rates and sales prices.
• Rates corrected sharply between 2009 and 2010; this was compounded by increased supply and subdued demand.
• Asteco also witnessed a noticeable increase in Tenant movement from neighbouring Abu Dhabi and Sharjah due to decreased rental rates in Dubai.
• Sales activity remained subdued although transaction levels picked up slightly by the end of 2011, which was when the market bottomed out.
• The market began to show signs of recovery in 2012 when the Euro Crisis and Arab Spring conflict led to Dubai being an attractive alternative and safe haven to invest and live in.
• Established communities and quality buildings experienced increased demand and newer developments saw improved take-up in line with enhanced infrastructure and connectivity.
• The rise in competitive finance options offered by banks also contributed to overall activity growth and stimulated home ownership.
• Whilst increased job security and market confidence created demand for Tenants to upgrade, rapid rental growth restricted others to move within Dubai and thus resulted in an upsurge in relocations to the Northern Emirates in search of more affordable accommodation.
• In 2013, Dubai was awarded to host Expo 2020. This announcement saw an increase in new project launches near the Al Maktoum International Airport site and the Dubai South Master Plan experienced increased demand.
• In September 2013, Dubai Government doubled the land registration fee to 4%, and new loan-to-value rules were introduced to limit property speculation.
• The market peaked in Q2 2014 and corrected thereafter due to a combination of factors such as the doubling of the registration fee, the reduction in LTV’s, low oil prices and a strong US dollar. This was especially pronounced in the residential sales market.
• Rental rates remained broadly stable as the handover of new supply was slower than anticipated.
• Due to the substantial number of launches witnessed in 2013, 2014 and 2015, concerns of an oversupply encouraged Developers to focus predominantly on the mid and affordable housing sector.
• In order to stimulate Buyer interest, Developers began to offer incentives such as extended payment plans during the post completion period.
• Lower deposits also made off-plan sales a more attractive option compared with the minimum 25% down payment required for a mortgaged property.
• Historically, both the residential sales and leasing market have, by and large, moved in a similar direction based partly on economic performance, market confidence, Investor / Tenant profile and regulatory environment. In fact, rentals generally fared better than sales as residents preferred leasing over home ownership.
• Residential rental rates experienced downward pressure on the back of increased supply.
• A decline in sales prices was less pronounced due to a broader Buyer profile with a longer term view on investing and living in Dubai.
• 2016 saw an impressive amount of new project launches and deliveries giving Tenants and Investors significant choice in established communities as well as newer areas at all price levels.
• Tenants drove the market as more and more people looked for value-for-money, which resulted in affordable developments out-performing luxury accommodation.
• Although we believe there to be a general trend in the overall market, the various sectors and locations are becoming increasingly fragmented.
• The office market has seen little change over the last year due to limited demand.
DU
BAI
4 Dubai Real Estate Report - Q4 2016
DU
BAI
Dubai Real Estate Report - Q4 2016
Dubai2016 Highlights
Leasing Sales
Resi
dent
ial
high
light
s Apartments
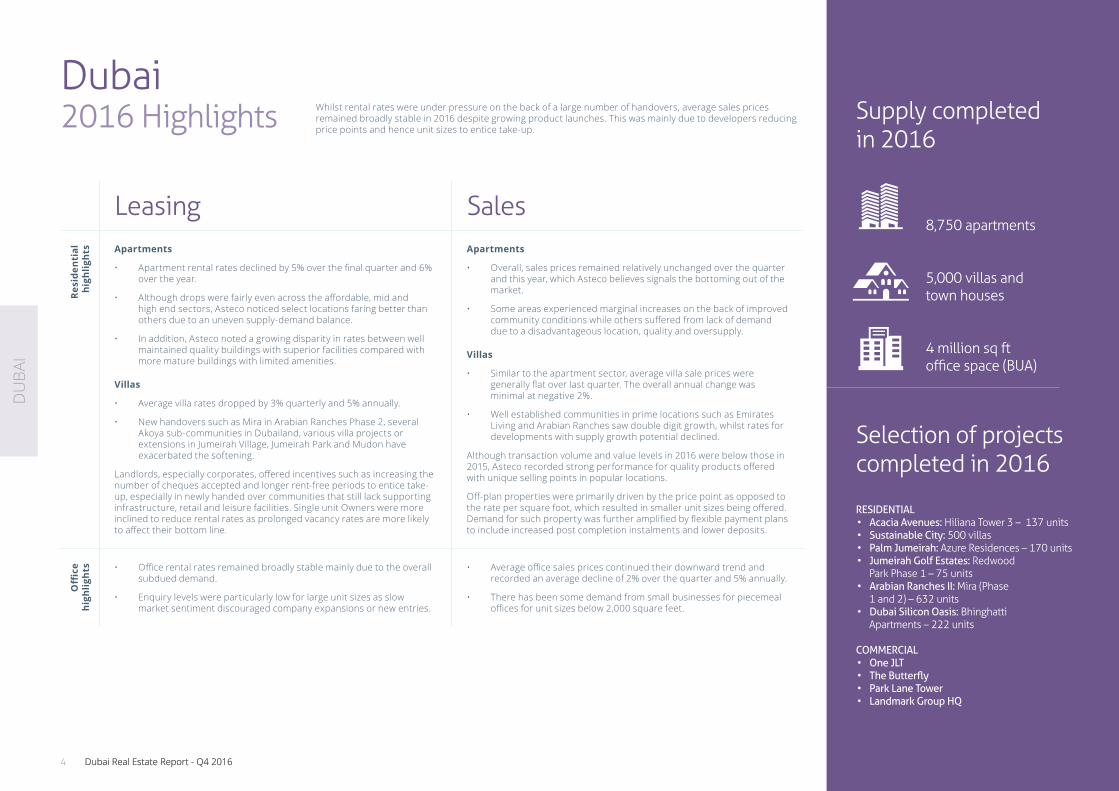
• Apartment rental rates declined by 5% over the final quarter and 6% over the year.
• Although drops were fairly even across the affordable, mid and high end sectors, Asteco noticed select locations faring better than others due to an uneven supply-demand balance.
• In addition, Asteco noted a growing disparity in rates between well maintained quality buildings with superior facilities compared with more mature buildings with limited amenities.
Villas
• Average villa rates dropped by 3% quarterly and 5% annually.
• New handovers such as Mira in Arabian Ranches Phase 2, several Akoya sub-communities in Dubailand, various villa projects or extensions in Jumeirah Village, Jumeirah Park and Mudon have exacerbated the softening.
Landlords, especially corporates, offered incentives such as increasing the number of cheques accepted and longer rent-free periods to entice take-up, especially in newly handed over communities that still lack supporting infrastructure, retail and leisure facilities. Single unit Owners were more inclined to reduce rental rates as prolonged vacancy rates are more likely to affect their bottom line.
Apartments
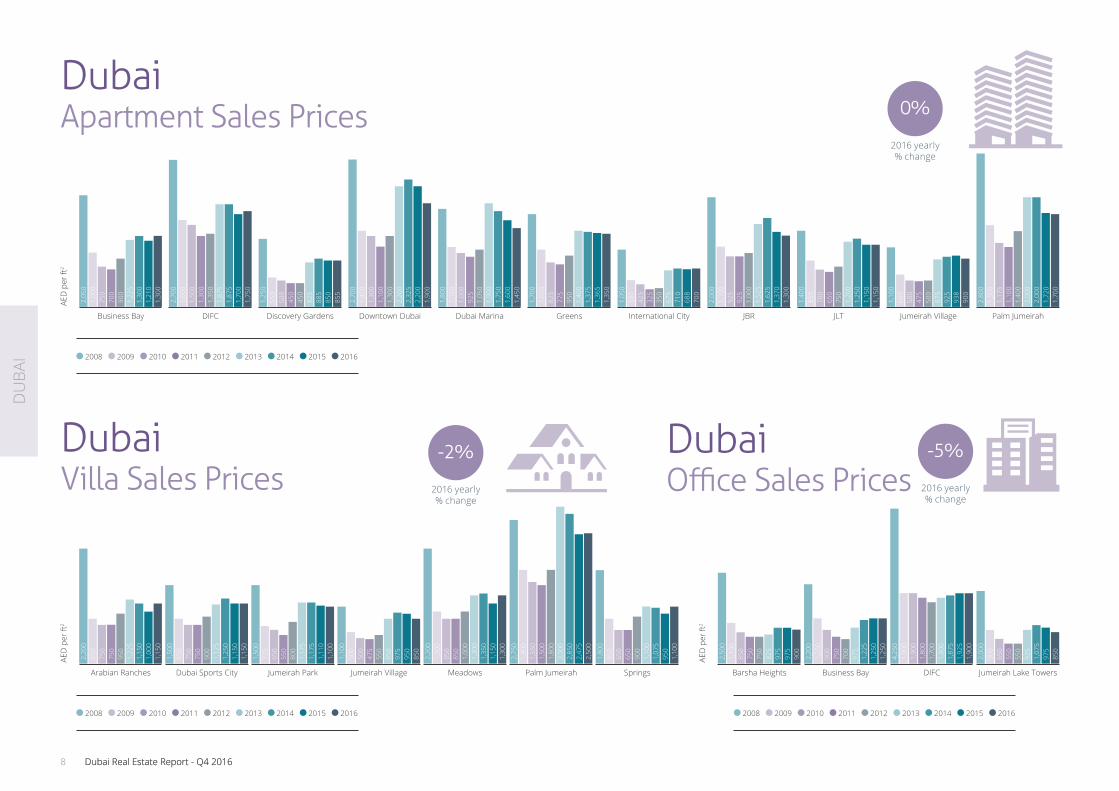
• Overall, sales prices remained relatively unchanged over the quarter and this year, which Asteco believes signals the bottoming out of the market.
• Some areas experienced marginal increases on the back of improved community conditions while others suffered from lack of demand due to a disadvantageous location, quality and oversupply.
Villas
• Similar to the apartment sector, average villa sale prices were generally flat over last quarter. The overall annual change was minimal at negative 2%.
• Well established communities in prime locations such as Emirates Living and Arabian Ranches saw double digit growth, whilst rates for developments with supply growth potential declined.
Although transaction volume and value levels in 2016 were below those in 2015, Asteco recorded strong performance for quality products offered with unique selling points in popular locations.
Off-plan properties were primarily driven by the price point as opposed to the rate per square foot, which resulted in smaller unit sizes being offered. Demand for such property was further amplified by flexible payment plans to include increased post completion instalments and lower deposits.
Offi
ce
high
light
s • Office rental rates remained broadly stable mainly due to the overall subdued demand.
• Enquiry levels were particularly low for large unit sizes as slow market sentiment discouraged company expansions or new entries.
• Average office sales prices continued their downward trend and recorded an average decline of 2% over the quarter and 5% annually.
• There has been some demand from small businesses for piecemeal offices for unit sizes below 2,000 square feet.
Supply completedin 2016
8,750 apartments
5,000 villas andtown houses
4 million sq ft office space (BUA)
Whilst rental rates were under pressure on the back of a large number of handovers, average sales prices remained broadly stable in 2016 despite growing product launches. This was mainly due to developers reducing price points and hence unit sizes to entice take-up.
Selection of projects completed in 2016
RESIDENTIAL• Acacia Avenues: Hiliana Tower 3 – 137 units• Sustainable City: 500 villas• Palm Jumeirah: Azure Residences – 170 units• Jumeirah Golf Estates: Redwood
Park Phase 1 – 75 units• Arabian Ranches II: Mira (Phase
1 and 2) – 632 units• Dubai Silicon Oasis: Bhinghatti
Apartments – 222 units COMMERCIAL• One JLT • The Butterfly• Park Lane Tower• Landmark Group HQ
DU
BAI
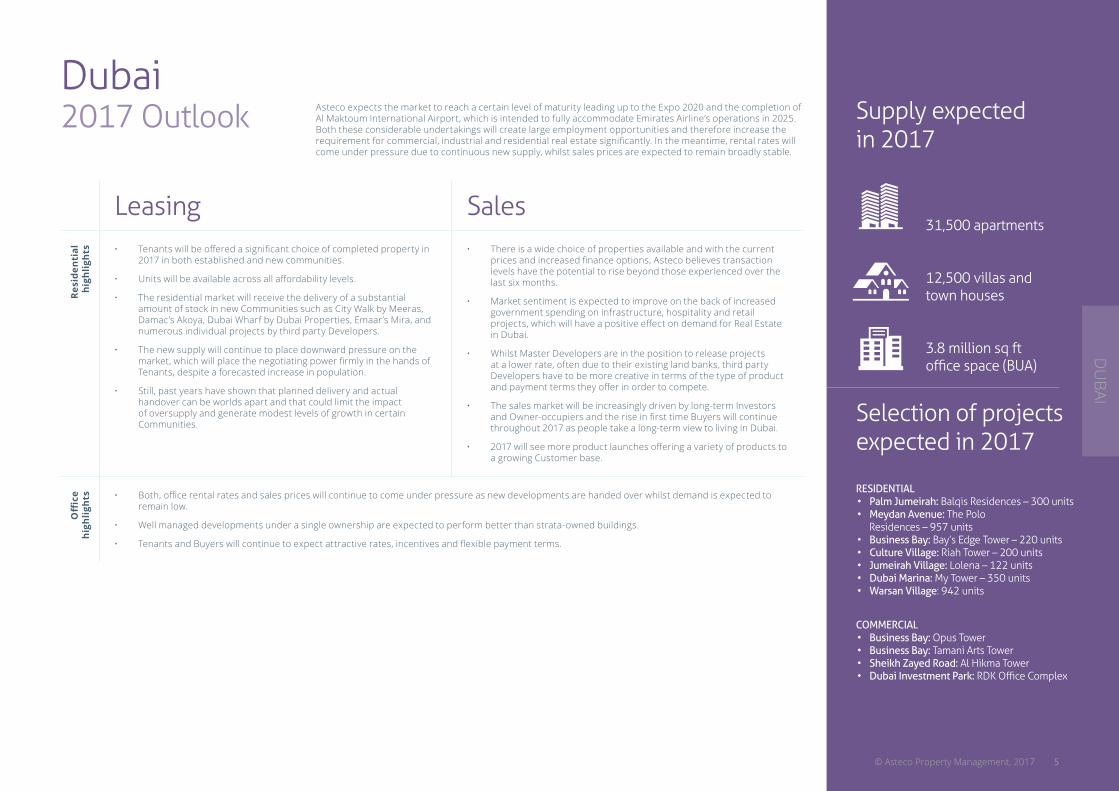
Dubai2017 Outlook Supply expected
in 2017
31,500 apartments
12,500 villas andtown houses
3.8 million sq ft office space (BUA)
Asteco expects the market to reach a certain level of maturity leading up to the Expo 2020 and the completion of Al Maktoum International Airport, which is intended to fully accommodate Emirates Airline’s operations in 2025. Both these considerable undertakings will create large employment opportunities and therefore increase the requirement for commercial, industrial and residential real estate significantly. In the meantime, rental rates will come under pressure due to continuous new supply, whilst sales prices are expected to remain broadly stable.
Selection of projects expected in 2017
RESIDENTIAL • Palm Jumeirah: Balqis Residences – 300 units• Meydan Avenue: The Polo
Residences – 957 units• Business Bay: Bay’s Edge Tower – 220 units• Culture Village: Riah Tower – 200 units• Jumeirah Village: Lolena – 122 units• Dubai Marina: My Tower – 350 units• Warsan Village: 942 units
COMMERCIAL• Business Bay: Opus Tower• Business Bay: Tamani Arts Tower• Sheikh Zayed Road: Al Hikma Tower• Dubai Investment Park: RDK Office Complex
Leasing Sales
Resi
dent
ial
high
light
s • Tenants will be offered a significant choice of completed property in 2017 in both established and new communities.
• Units will be available across all affordability levels.
• The residential market will receive the delivery of a substantial amount of stock in new Communities such as City Walk by Meeras, Damac’s Akoya, Dubai Wharf by Dubai Properties, Emaar’s Mira, and numerous individual projects by third party Developers.
• The new supply will continue to place downward pressure on the market, which will place the negotiating power firmly in the hands of Tenants, despite a forecasted increase in population.
• Still, past years have shown that planned delivery and actual handover can be worlds apart and that could limit the impact of oversupply and generate modest levels of growth in certain Communities.
• There is a wide choice of properties available and with the current prices and increased finance options, Asteco believes transaction levels have the potential to rise beyond those experienced over the last six months.
• Market sentiment is expected to improve on the back of increased government spending on infrastructure, hospitality and retail projects, which will have a positive effect on demand for Real Estate in Dubai.
• Whilst Master Developers are in the position to release projects at a lower rate, often due to their existing land banks, third party Developers have to be more creative in terms of the type of product and payment terms they offer in order to compete.
• The sales market will be increasingly driven by long-term Investors and Owner-occupiers and the rise in first time Buyers will continue throughout 2017 as people take a long-term view to living in Dubai.
• 2017 will see more product launches offering a variety of products to a growing Customer base.
Offi
ce
high
light
s • Both, office rental rates and sales prices will continue to come under pressure as new developments are handed over whilst demand is expected to remain low.
• Well managed developments under a single ownership are expected to perform better than strata-owned buildings.
• Tenants and Buyers will continue to expect attractive rates, incentives and flexible payment terms.
DU
BAI
5© Asteco Property Management, 2017
DU
BAI
6 Dubai Real Estate Report - Q4 2016
DU
BAI
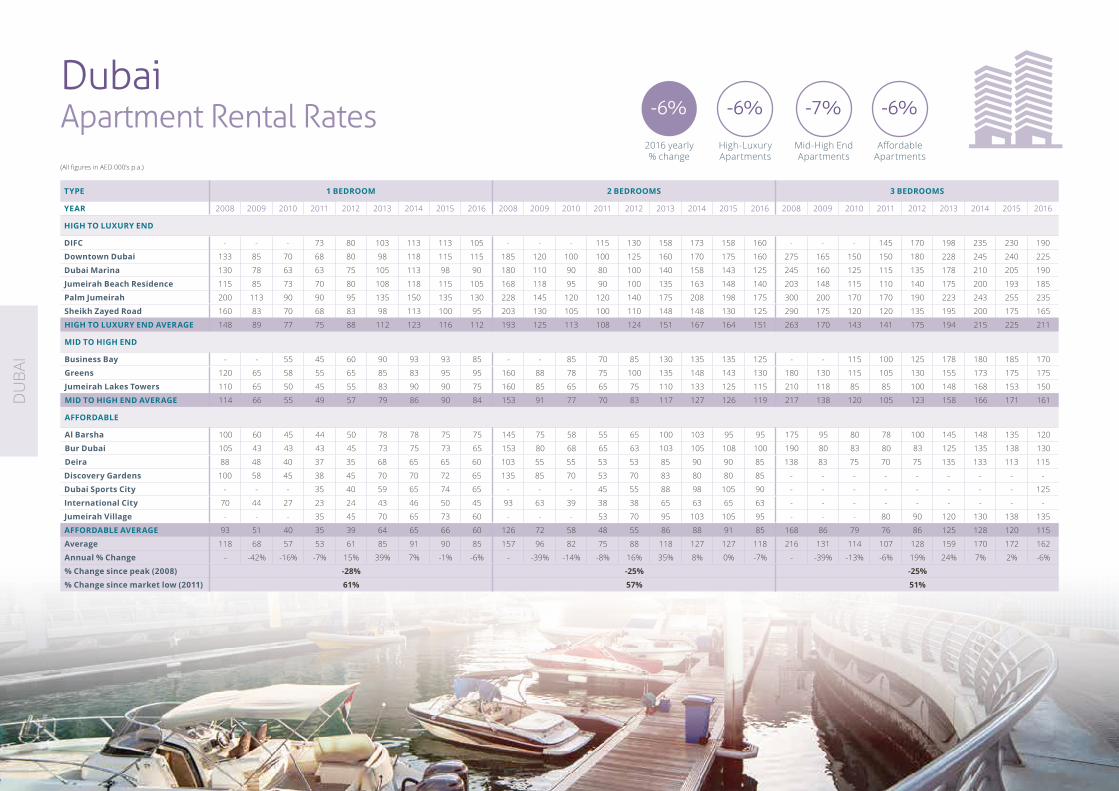
Dubai Apartment Rental Rates -6% -7%-6% -6%
2016 yearly % change
Mid-High End Apartments
High-Luxury Apartments
Affordable Apartments
TYPE 1 BEDROOM 2 BEDROOMS 3 BEDROOMS
YEAR 2008 2009 2010 2011 2012 2013 2014 2015 2016 2008 2009 2010 2011 2012 2013 2014 2015 2016 2008 2009 2010 2011 2012 2013 2014 2015 2016
HIGH TO LUXURY END
DIFC - - - 73 80 103 113 113 105 - - - 115 130 158 173 158 160 - - - 145 170 198 235 230 190
Downtown Dubai 133 85 70 68 80 98 118 115 115 185 120 100 100 125 160 170 175 160 275 165 150 150 180 228 245 240 225
Dubai Marina 130 78 63 63 75 105 113 98 90 180 110 90 80 100 140 158 143 125 245 160 125 115 135 178 210 205 190
Jumeirah Beach Residence 115 85 73 70 80 108 118 115 105 168 118 95 90 100 135 163 148 140 203 148 115 110 140 175 200 193 185
Palm Jumeirah 200 113 90 90 95 135 150 135 130 228 145 120 120 140 175 208 198 175 300 200 170 170 190 223 243 255 235
Sheikh Zayed Road 160 83 70 68 83 98 113 100 95 203 130 105 100 110 148 148 130 125 290 175 120 120 135 195 200 175 165
HIGH TO LUXURY END AVERAGE 148 89 77 75 88 112 123 116 112 193 125 113 108 124 151 167 164 151 263 170 143 141 175 194 215 225 211
MID TO HIGH END
Business Bay - - 55 45 60 90 93 93 85 - - 85 70 85 130 135 135 125 - - 115 100 125 178 180 185 170
Greens 120 65 58 55 65 85 83 95 95 160 88 78 75 100 135 148 143 130 180 130 115 105 130 155 173 175 175
Jumeirah Lakes Towers 110 65 50 45 55 83 90 90 75 160 85 65 65 75 110 133 125 115 210 118 85 85 100 148 168 153 150
MID TO HIGH END AVERAGE 114 66 55 49 57 79 86 90 84 153 91 77 70 83 117 127 126 119 217 138 120 105 123 158 166 171 161
AFFORDABLE
Al Barsha 100 60 45 44 50 78 78 75 75 145 75 58 55 65 100 103 95 95 175 95 80 78 100 145 148 135 120
Bur Dubai 105 43 43 43 45 73 75 73 65 153 80 68 65 63 103 105 108 100 190 80 83 80 83 125 135 138 130
Deira 88 48 40 37 35 68 65 65 60 103 55 55 53 53 85 90 90 85 138 83 75 70 75 135 133 113 115
Discovery Gardens 100 58 45 38 45 70 70 72 65 135 85 70 53 70 83 80 80 85 - - - - - - - - -
Dubai Sports City - - - 35 40 59 65 74 65 - - - 45 55 88 98 105 90 - - - - - - - - 125
International City 70 44 27 23 24 43 46 50 45 93 63 39 38 38 65 63 65 63 - - - - - - - - -
Jumeirah Village - - - 35 45 70 65 73 60 - - - 53 70 95 103 105 95 - - - 80 90 120 130 138 135
AFFORDABLE AVERAGE 93 51 40 35 39 64 65 66 60 126 72 58 48 55 86 88 91 85 168 86 79 76 86 125 128 120 115
Average 118 68 57 53 61 85 91 90 85 157 96 82 75 88 118 127 127 118 216 131 114 107 128 159 170 172 162
Annual % Change - -42% -16% -7% 15% 39% 7% -1% -6% - -39% -14% -8% 16% 35% 8% 0% -7% - -39% -13% -6% 19% 24% 7% 2% -6%
% Change since peak (2008) -28% -25% -25%
% Change since market low (2011) 61% 57% 51%
(All figures in AED 000’s p.a.)
DU
BAI
7© Asteco Property Management, 2017
DU
BAI
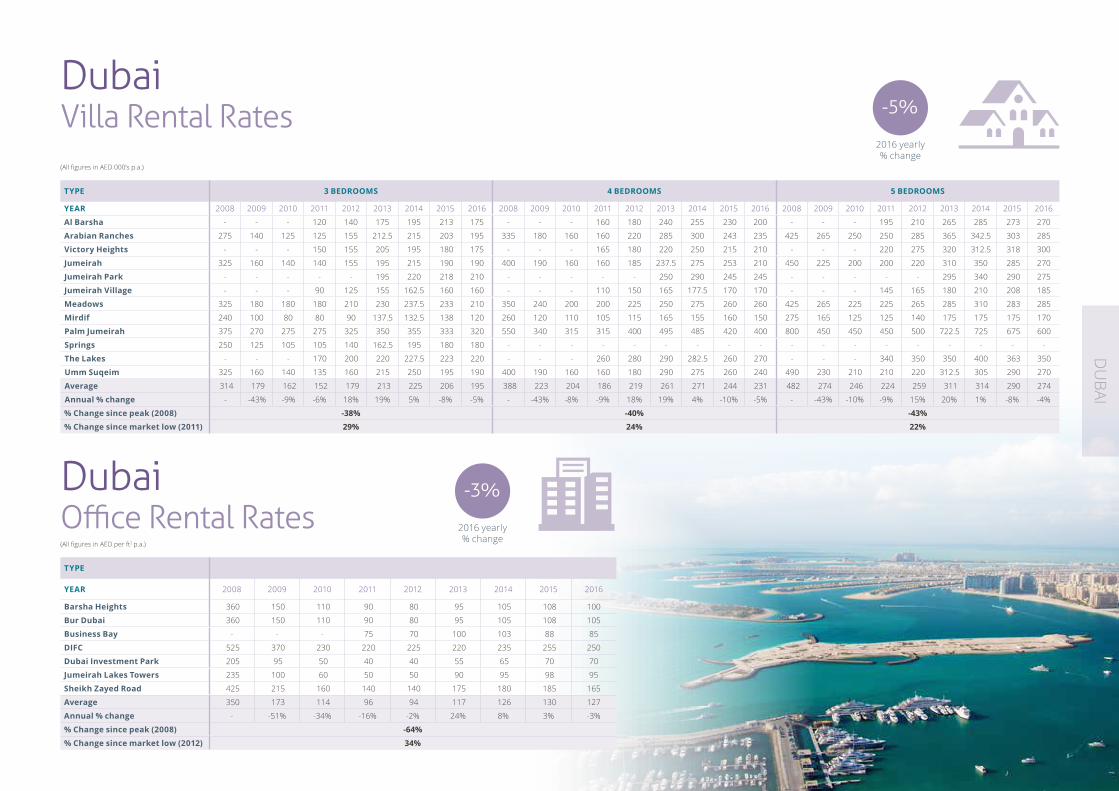
Dubai Villa Rental Rates
TYPE 3 BEDROOMS 4 BEDROOMS 5 BEDROOMS
YEAR 2008 2009 2010 2011 2012 2013 2014 2015 2016 2008 2009 2010 2011 2012 2013 2014 2015 2016 2008 2009 2010 2011 2012 2013 2014 2015 2016
Al Barsha - - - 120 140 175 195 213 175 - - - 160 180 240 255 230 200 - - - 195 210 265 285 273 270
Arabian Ranches 275 140 125 125 155 212.5 215 203 195 335 180 160 160 220 285 300 243 235 425 265 250 250 285 365 342.5 303 285
Victory Heights - - - 150 155 205 195 180 175 - - - 165 180 220 250 215 210 - - - 220 275 320 312.5 318 300
Jumeirah 325 160 140 140 155 195 215 190 190 400 190 160 160 185 237.5 275 253 210 450 225 200 200 220 310 350 285 270
Jumeirah Park - - - - - 195 220 218 210 - - - - - 250 290 245 245 - - - - - 295 340 290 275
Jumeirah Village - - - 90 125 155 162.5 160 160 - - - 110 150 165 177.5 170 170 - - - 145 165 180 210 208 185
Meadows 325 180 180 180 210 230 237.5 233 210 350 240 200 200 225 250 275 260 260 425 265 225 225 265 285 310 283 285
Mirdif 240 100 80 80 90 137.5 132.5 138 120 260 120 110 105 115 165 155 160 150 275 165 125 125 140 175 175 175 170
Palm Jumeirah 375 270 275 275 325 350 355 333 320 550 340 315 315 400 495 485 420 400 800 450 450 450 500 722.5 725 675 600
Springs 250 125 105 105 140 162.5 195 180 180 - - - - - - - - - - - - - - - - - -
The Lakes - - - 170 200 220 227.5 223 220 - - - 260 280 290 282.5 260 270 - - - 340 350 350 400 363 350
Umm Suqeim 325 160 140 135 160 215 250 195 190 400 190 160 160 180 290 275 260 240 490 230 210 210 220 312.5 305 290 270
Average 314 179 162 152 179 213 225 206 195 388 223 204 186 219 261 271 244 231 482 274 246 224 259 311 314 290 274
Annual % change - -43% -9% -6% 18% 19% 5% -8% -5% - -43% -8% -9% 18% 19% 4% -10% -5% - -43% -10% -9% 15% 20% 1% -8% -4%
% Change since peak (2008) -38% -40% -43%
% Change since market low (2011) 29% 24% 22%
Dubai Office Rental RatesTYPE
YEAR 2008 2009 2010 2011 2012 2013 2014 2015 2016
Barsha Heights 360 150 110 90 80 95 105 108 100
Bur Dubai 360 150 110 90 80 95 105 108 105
Business Bay - - - 75 70 100 103 88 85
DIFC 525 370 230 220 225 220 235 255 250
Dubai Investment Park 205 95 50 40 40 55 65 70 70
Jumeirah Lakes Towers 235 100 60 50 50 90 95 98 95
Sheikh Zayed Road 425 215 160 140 140 175 180 185 165
Average 350 173 114 96 94 117 126 130 127
Annual % change - -51% -34% -16% -2% 24% 8% 3% -3%
% Change since peak (2008) -64%
% Change since market low (2012) 34%
-3%
2016 yearly % change
(All figures in AED 000’s p.a.)
(All figures in AED per ft2 p.a.)
-5%
2016 yearly % change
DU
BAI
8 Dubai Real Estate Report - Q4 2016Dubai Real Estate Report - Q4 2016
DU
BAI
Business Bay
2,05
01,
000
750
700
900
1,22
5
1,21
01,
300
1,30
0
2,70
0
DIFC
1,60
01,
500
1,30
01,
350
1,87
5
1,70
01,
750
1,87
5
Discovery Gardens
1,25
055
050
045
045
082
5
850
855
885
Downtown Dubai
2,70
01,
400
1,30
01,
100
1,30
02,
200
2,20
01,
900
2,32
5
Dubai Marina
1,80
01,
100
1,00
092
51,
050
1,90
0
1,60
01,
450
1,75
0
Greens
1,70
01,
050
825
775
950
1,40
0
1,36
51,
350
1,37
5
International City
1,05
050
042
532
535
067
5
688
700
710
JBR
2,00
01,
100
925
925
1,00
01,
525
1,37
01,
300
1,62
5
JLT
1,40
085
070
065
075
01,
200
1,15
01,
150
1,25
0
Jumeirah Village
1,10
060
050
047
550
087
5
938
900
925
Palm Jumeirah
2,80
01,
500
1,17
51,
100
1,40
02,
000
1,72
01,
700
2,00
0
Dubai Apartment Sales Prices
Dubai Villa Sales Prices
Dubai Office Sales Prices
-2%
2016 yearly % change
0%
2016 yearly % change
-5%
2016 yearly % change
AED
per
ft2
AED
per
ft2
AED
per
ft2
Arabian Ranches
2,20
0 85
0 75
0 75
0 95
01,
225
1,00
01,
150
1,15
0
Barsha Heights
2,50
0 1,
100
850
750
750
825
975
900
975
1,50
0
Dubai Sports City
850
750
750
900
1,12
5
1,15
01,
150
1,25
0
2,20
0
Business Bay
1,25
090
075
070
097
5
1,25
01,
250
1,22
5
Jumeirah Park
1,50
072
565
055
080
01,
175
1,11
01,
100
1,17
5
Jumeirah Village
1,10
060
050
047
555
085
0
950
850
975
Meadows
2,20
01,
000
850
850
1,00
01,
300
1,15
01,
300
1,35
0
Palm Jumeirah
2,75
01,
800
1,55
01,
500
1,80
03,
000
2,47
52,
500
2,85
0
Springs
1,80
085
065
065
090
01,
100
950
1,10
0
1,07
5
2008 2009 2010 2011 2012 2013 2014 2015 2016
2008 2009 2010 2011 2012 2013 2014 2015 2016 2008 2009 2010 2011 2012 2013 2014 2015 2016
DIFC
4,25
01,
900
1,90
01,
800
1,70
01,
800
1,92
51,
900
1,87
5
Jumeirah Lake Towers
2,00
090
065
055
055
092
5
975
850
1,07
5
DU
BAI
9© Asteco Property Management, 2017
DU
BAI
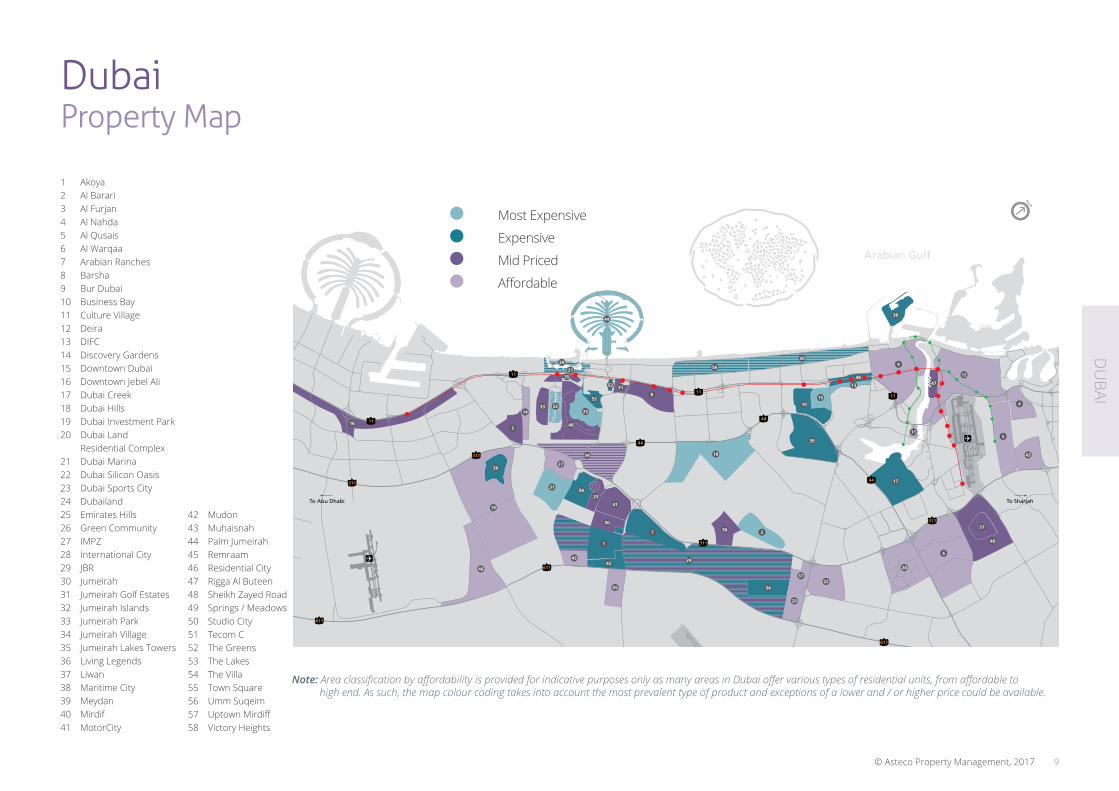
1 Akoya2 Al Barari3 Al Furjan4 Al Nahda5 Al Qusais6 Al Warqaa7 Arabian Ranches8 Barsha9 Bur Dubai10 Business Bay11 Culture Village12 Deira13 DIFC14 Discovery Gardens15 Downtown Dubai16 Downtown Jebel Ali17 Dubai Creek18 Dubai Hills19 Dubai Investment Park20 Dubai Land
Residential Complex21 Dubai Marina22 Dubai Silicon Oasis23 Dubai Sports City24 Dubailand25 Emirates Hills26 Green Community27 IMPZ28 International City29 JBR30 Jumeirah31 Jumeirah Golf Estates32 Jumeirah Islands33 Jumeirah Park34 Jumeirah Village35 Jumeirah Lakes Towers36 Living Legends37 Liwan38 Maritime City39 Meydan40 Mirdif41 MotorCity
42 Mudon43 Muhaisnah44 Palm Jumeirah45 Remraam46 Residential City47 Rigga Al Buteen48 Sheikh Zayed Road49 Springs / Meadows50 Studio City51 Tecom C52 The Greens53 The Lakes54 The Villa55 Town Square56 Umm Suqeim57 Uptown Mirdiff58 Victory Heights
Note: Area classification by affordability is provided for indicative purposes only as many areas in Dubai offer various types of residential units, from affordable to high end. As such, the map colour coding takes into account the most prevalent type of product and exceptions of a lower and / or higher price could be available.
Most Expensive
Expensive
Mid Priced
Affordable
611
611
311
11
11
11
11
44
44
44
311
311
311
611
611
29
21
35
3
1433
8
56
26
16
31
46
19
2358
41
50
7
45
1
42
55
36 2
18
24
34
27
2254
37
20
28
57
40
44
52
25
53
49
32
51
15
39
10
309
38
13
48 12
47
4
5
6
43
11
17
To SharjahTo Abu Dhabi
Arabian Gulf
Dubai Property Map
10 Dubai Real Estate Report - Q4 2016
VALUATION & ADVISORYOur professional advisory services are conducted by suitably qualified personnel all of whom have had extensive Real Estate experience within the Middle East and internationally.
Our valuations are carried out in accordance with the Royal Institution of Chartered Surveyors (RICS) and International Valuation Standards (IVS) and are undertaken by appropriately qualified Valuers with extensive local experience.
The professional services Asteco conducts throughout the region include:
• Consultancy & Advisory services• Market research• Valuation services
SALESAsteco has established a large regional property sales division with representatives based in the UAE, Qatar and Jordan. Our Sales teams have extensive experience in the negotiation and sale of a variety of assets.
LEASINGAsteco has been instrumental in the Leasing of many high-profile developments across the GCC.
ASSET MANAGEMENTAsteco provides comprehensive Asset Management services to all property Owners, whether a single unit (IPM) or a regional mixed-use portfolio. Our focus is on maximising value for our Clients.
OWNERS ASSOCIATIONAsteco has the experience, systems, procedures and manuals in place to provide streamlined comprehensive Association Management and Consultancy Services to residential, commercial and mixed-use Communities throughout the GCC Region.
SALES MANAGEMENTOur Sales Management services are comprehensive and encompass everything required for the successful completion and handover of units to individual unit Owners.
LICENSINGOur brand, network, system and procedures are now available in territories across the MENA region. Our Licensing services currently include Real Estate Brokerage Franchising and associated support services with many of the key elements designed specifically around the franchisee, making it a truly unique and bespoke Franchise opportunity.
The Middle East’s largest full service Real Estate services company, Asteco was formed in Dubai in 1985. Over the years, Asteco has gained enormous respect for consistently delivering high quality, professional, value-added services in a transparent manner. It is also widely recognised for its involvement with many of the projects that have defined the landscape and physical infrastructure of the Emirates.
Asteco has an essential combination of local knowledge and international expertise. A deeply established brand, renowned for its application of the latest technological advances, its commitment to transparency, winning strategies and human expertise. Undisputed Real Estate experts, Asteco represents a significant number of the region’s top property Owners, Developers and Investors.
11© Asteco Property Management, 2017
John StevensMSc, BSc (Hons), MRICSManaging Director / Director - Asset Services+971 600 54 [email protected]
Sean McCauleyMBA, BComDirector - Agency Services+971 600 54 [email protected]
Zahra Alvi,MScResearch Analyst+971 600 54 [email protected]
John AllenBSc, MRICSDirector - Valuation & Advisory+971 600 54 [email protected]
Jenny Weidling BA (Hons)Manager - Research and Advisory+971 600 54 [email protected]
James JoughinBSc (Hons), MRICSAssociate Director - Valuation +971 600 54 [email protected]

DU
BAI
© Asteco Property Management, 2017
DISCLAIMER: The information contained in this report has been obtained from and is based upon sources that Asteco Property Management believes to be reliable, however, no warranty or representation, expressed or implied, is made to the accuracy or completeness of the information contained herein, and same is submitted subject to errors, omissions, change of price, rental or other conditions, withdrawal without notice, and to any special listing conditions imposed by our principals. Asteco Property Management will not be held responsible for any third-party contributions. All opinions and estimates included in this report constitute Asteco Property Management’s judgment, as of the date of this report and are subject to change without notice. Figures contained in this report are derived from a basket of locations highlighted in this report and therefore represent a snapshot of the UAE market. Averages, however, represent a wider range of areas. Due care and attention has been used in the preparation of forecast information. However, actual results may vary from forecasts and any variation may be materially positive or negative. Forecasts, by their very nature, involve risk and uncertainty because they relate to future events and circumstances which are beyond Asteco Property Management’s control. For a full in-depth study of the market, please contact Asteco Property Management’s Research team. Asteco Property Management LLC. Commercial License No. 218551. Paid-up Capital AED 4,000,000.
Dubai Real Estate ReportQ4 2016