Embed Size (px)
Citation preview
Weed management in sugar cane: critical periods of weed competition and
mechanisms of interference from Paspalum paniculatum and P. urvillei
By
Sumantlall SEERUTTUN
Submitted in fulfilment of the requirements for the degree PhD (Agronomy) in the
Department of Plant Production and Soil Science
Faculty of Natural and Agricultural Sciences
UNIVERSITY OF PRETORIA
Pretoria
Promoter: Prof C. F. REINHARDT
Co-Promoter: Dr P.J.W. LUTMAN (Rothamsted Research, UK)
October 2008
©© UUnniivveerrssiittyy ooff PPrreettoorriiaa

i
TABLE OF CONTENTS
DECLARATION vii
ACKNOWLEDGEMENTS viii
LIST OF ABBREVIATIONS ix
ABSTRACT x
CHAPTER 1 INTRODUCTION
1.1 Sugar Cane: a brief description 1
1.2 The island of Mauritius 1
1.3 Introduction of sugar cane to Mauritius 3
1.4 Cultural practices of sugar cane 4
1.5 Weeds of sugar cane
1.5.1 Major weeds of sugar cane in Mauritius 5
1.5.2 Paspalum paniculatum 6
1.5.3 Paspalum urvillei 7
1.6 Weed control in sugar cane 9
1.7 Sugar cane in the Mauritian economy 12
1.8 Development of weed management strategies 13
1.9 Objectives of thesis 14
CHAPTER 2 CRITICAL PERIODS OF WEED COMPETITION IN SUGAR CANE IN
MAURITIUS
2.1 Introduction 16
2.2 Materials and methods 17
2.3 Results and discussion 23
2.4 Conclusion 30
CHAPTER 3 WEED COMPETITION IN SUGARCANE: THE RELATIVE
COMPETITIVENESS OF DIFFERENT WEED SPECIES
3.1 Introduction 31
3.2 Materials and methods
3.2.1 Trial I - Weed competition from Ageratum conyzoides under field conditions 36
ii
3.2.2 Trial II - Competition from Bidens pilosa, Digitaria horizontalis and Paspalum
urvillei on sugar cane grown in trays 38
3.2.3 Trial III - Weed competition from Paspalum paniculatum and P. urvillei on
sugar cane under field conditions 39
3.2.4 Trial IV - Competition between Bidens pilosa and sugar cane grown in trays
(glasshouse) 40
3.2.5 Trial V - Weed competition from P. paniculatum and P. urvillei on sugar
cane grown under glasshouse conditions 41
3.2.6 Trial VI - Weed competition from Paspalum commersonii and P. conjugatum
on sugar cane grown under glasshouse conditions 42
3.2.7 Trial VII – Weed competition from A. conyzoides and Setaria barbata on
sugar cane grown in trays outdoors 44
3.3 Results
3.3.1 Trial I - Weed competition from Ageratum conyzoides under field conditions 46
3.3.2 Trial II - Competition from Bidens pilosa, Digitaria horizontalis and Paspalum
urvillei on sugar cane grown in trays 47
3.3.3 Trial III - Weed competition from Paspalum paniculatum and P. urvillei on
sugar cane under field conditions 52
3.3.4 Trial IV - Competition from Bidens pilosa on sugar cane grown in trays
(glasshouse) 56
3.3.5 Trial V - Competition between sugar cane and P. paniculatum and P. urvillei
under glasshouse conditions 59
3.3.6 Trial VI - Competition between sugar cane and Paspalum commersonii and
P. conjugatum under glasshouse conditions 62
3.3.7 Trial VII – Weed competition from Ageratum conyzoides and Setaria barbata
on sugar cane grown in trays outdoors 65
3.4 Discussion and conclusions 69
CHAPTER 4 EFFECT OF TIME AND LEAF AREA DISTRIBUTION ON WEED
COMPETITION BETWEEN SUGAR CANE AND PASPALUM
PANICULATUM OR PASPALUM URVILLEI
4.1 Introduction 73
4.2 Materials and methods 76
iii
4.2.1 Trial I – Effect of time of observation and two transplanting dates on the
relative competitiveness (q value) of P. paniculatum and P. urvillei in
competition with sugar cane 76
4.2.2 Trial II – Relative competitiveness of P. paniculatum and P. urvillei on sugar
cane at two observation dates and effect of leaf area distribution on
competition 77
4.2.3 Trial III - Relative competitiveness of P. paniculatum and P. urvillei on
sugar cane at two transplanting dates and effect of leaf area distribution
on competition 79
4.3 Results
4.3.1 Trial I - Effect of time of observation and two transplanting dates on the
relative competitiveness of P. paniculatum and P. urvillei in competition
with sugar cane 82
4.3.1.1 - Effect of time of observation on the competitive effects of
P. paniculatum and P. urvillei transplanted 9 WAP (1st
transplanting date - TD1) 82
4.3.1.2 - Effect of time of observation on the competitive effects of
P. paniculatum and P. urvillei transplanted 17 WAP
(2nd transplanting date – TD2) 91
4.3.1.3 - Effect of date of transplanting on the competitive effect of
P. paniculatum and P. urvillei 97
4.3.2 Trial II - Relative competitiveness of P. paniculatum and P. urvillei on
sugar cane at two observation dates and effect of leaf area distribution
on competition 99
4.3.2.1 - Effect on time of observation on the competitive effects of
P. paniculatum and P. urvillei 99
4.3.2.2 - Effect on leaf area distribution on the competitive effects of
P. paniculatum and P. urvillei 103
4.3.3 Trial III - Relative competitiveness of P. paniculatum and P. urvillei
at two transplanting dates in sugar cane and effect of leaf area distribution
on competition 105
iv
4.3.3.1 - Effect of time of observation on the competitive effect of
P. paniculatum and P. urvillei transplanted 4 WAP (1st
transplanting date - TD1) 105
4.3.3.2 - Effect of time of observation on the competitive effect of
P. paniculatum and P. urvillei transplanted 10 WAP (2nd
transplanting date – TD2) 110
4.3.3.3 - Effect of transplanting date on the competitive effect of
P. paniculatum and P. urvillei 113
4.4 Discussion and conclusions 121
CHAPTER 5 COMPARISON OF ROOT AND SHOOT COMPETITION BETWEEN
SUGAR CANE AND PASPALUM PANICULATUM OR P. URVILLEI
5.1 Introduction 123
5.2 Materials and methods 125
5.3 Results
5.3.1 Trial I
5.3.1.1 - Effect of root and shoot competition on shoot elongation and mean
cane dewlap height 130
5.3.1.2 - Effect of root and shoot competition on aboveground biomass 131
5.3.1.3 Effect of root and shoot competition on root development of crop
and weeds 132
5.3.2 Trial II
5.3.2.1 - Effect of root and shoot competition on shoot elongation and cane
growth 133
5.3.2.2 - Effect of root and shoot competition on aboveground biomass 134
5.3.2.3 - Effect of root and shoot competition on root development 136
5.4 Discussion and conclusions 138 CHAPTER 6 ALLELOPATHIC EFFECT OF PASPALUM PANICULATUM AND P.
URVILLEI ON GROWTH OF SUGAR CANE
6.1 Introduction 141
6.2 Materials and methods 144
6.3 Results 150
v
6.3.1 Trial I
6.3.1.1 - Effect of leachates on shoot elongation and cane growth 150
6.3.1.2 - Effect of leachates on cane biomass 152
6.3.1.3 - Effect of leachates on root development 153
6.3.2 Trial II
6.3.2.1 - Effect of leachates on shoot elongation and cane growth 155
6.3.2.2 - Effect of leachates on shoot biomass 157
6.3.2.3 - Effect of leachates on root development 158
6.3.3 Trial III
6.3.3.1 - Effect of leachates on shoot elongation and cane growth 159
6.3.3.2 - Effect of leachates on shoot biomass 161
6.3.3.3 - Effect of leachates on root development 161
6.3.4 Trial IV
6.3.4.1 - Effect of leachates on shoot elongation and cane growth 163
6.3.4.2 - Effect of leachates on shoot biomass 165
6.3.4.3 - Effect of leachates on root development 166
6.3.5 Chemical analysis of leachates from P. paniculatum and P. urvillei
6.3.5.1 - Presence of BOA (2-benzoxazolinone) 167
6.3.5.2 -Chemical composition of leachates from P. paniculatum and
P. urvillei 167
6.4 Discussion and conclusions 168
CHAPTER 7 A NEW HERBICIDE TANK-MIX OF TRIFLOXYSULFURON +
AMETRYN AND AMICARBAZONE TO PROVIDE COST-EFFECTIVE
BROAD SPECTRUM PRE- AND POST-EMERGENCE TREATMENT FOR
MANAGING WEEDS IN SUGAR CANE
7.1 Introduction 171
7.2 Materials and methods 173
7.3 Results and discussion
7.3.1 Potential of amicarbazone and trifloxysulfuron + ametryn for pre-emergence
weed control 176
7.3.2 Potential of amicarbazone and trifloxysulfuron + ametryn for post-emergence
weed control 179
vi
7.3.3 Potential of amicarbazone and trifloxysulfuron + ametryn for early post-mergence
weed control in ratoon cane 181
7.4 Discussion and conclusions 183
CHAPTER 8 GENERAL DISCUSSIONS & CONCLUSIONS
8.1 Weed competition in sugar cane 184
8.2 Applications and recommendations for the Mauritian sugar industry arising from this
research study 187
8.3 Suggestions for future research 191
REFERENCES 193
SUMMARY 204
APPENDIX 206

vii
DECLARATION
I declare that the thesis, which I hereby submit for the degree of PhD (Agronomy) at the University of
Pretoria, is my own work and has not previously been submitted by me for a degree at this or any
other tertiary institution.
Signature 1 October 2008

viii
ACKNOWLEDGEMENTS
I would like to express my sincere gratitude to the following people for their support and assistance
throughout my study:
Prof Charlie Reinhardt for promoting my study; his continuous availability, both for academic and
administrative purposes, has never make me feel distant from the campus. Moreover, for the guidance
and sharing of his experience on allelopathy for making this study more complete.
Dr Peter Lutman for his supervision, guidance, highly pertinent suggestions and critical evaluation
throughout the whole duration of this thesis. Dr Lutman has also showed great patience in reading and
reviewing the manuscripts.
Dr Jean Claude Autrey, Director of the Mauritius Sugar Industry Research Institute (MSIRI) till June
2007, for his support in undertaking this study and making all necessary resources available.
Dr René Ng Kee Kwong, Director of MSIRI as from July 2007, for the continuing support and
facilities for completing this thesis.
My wife Shashi, my daughter Swarna and my son Salil for their love, support, patience and caring
over the years.
My colleagues of the Cultural Operations and Weed Agronomy Department, namely Messrs C. Barbe,
A. Gaungoo and F. Ismael for their assistance in implementing and monitoring of some trials. The
trials would have not been completed without the invaluable help of Messrs F. Nagen, R. Padichy and
S. Tajah, Field Assistants in the department.
Among other colleagues at the Institute, Mrs Chinta Ramnawaz for regular statistical assistance, and
Mrs Aneeza Soobadar for her help with respect to the chemical analysis.
All the Managers, Field Managers and Agronomists of sugar estates involved in the field trials for
their usual and kind support in making land, labour and other resources available.
And anybody I missed who deserves a mention.

ix
LIST OF ABBREVIATIONS
a.e. - acid equivalent
a.i. - active ingredient
AYL - acceptable yield loss
CPWC - critical period of weed competion
CV - coefficient of variation
GDD - growing degree days
IWM - Integrated Weed Management
Lw - relative leaf area
MSIRI - Mauritius Sugar Industry Research Institute
MUR - Mauritian rupee
q - relative damage coefficient or relative competitiveness value
TD - transplanting date
WAH - weeks after harvest
WAP - weeks after planting
WAS - weeks after spraying
WAT - weeks after transplanting
x
Weed management in sugar cane: critical periods of weed competition and
mechanisms of interference from Paspalum paniculatum and P. urvillei
by
Sumantlall Seeruttun
Promoter: Prof C F Reinhardt
Co-promoter: Dr P J W Lutman
Department: Plant Production and Soil Science
Degree: PhD Agronomy
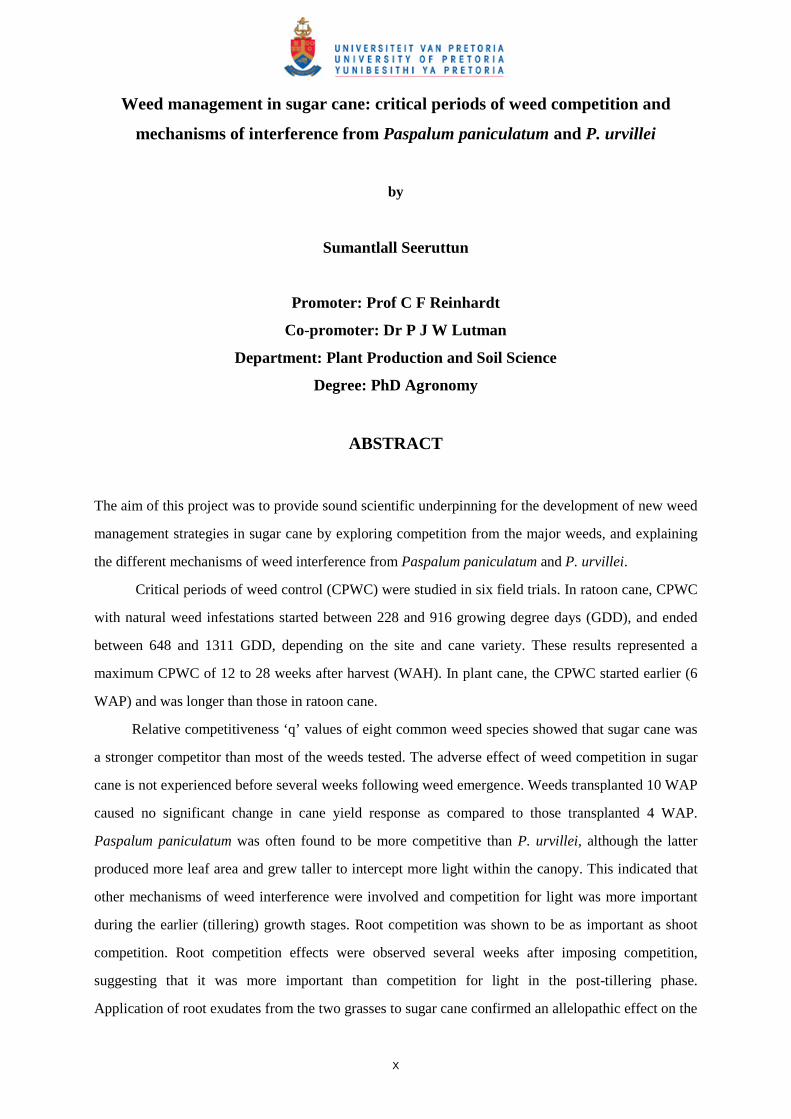
ABSTRACT
The aim of this project was to provide sound scientific underpinning for the development of new weed
management strategies in sugar cane by exploring competition from the major weeds, and explaining
the different mechanisms of weed interference from Paspalum paniculatum and P. urvillei.
Critical periods of weed control (CPWC) were studied in six field trials. In ratoon cane, CPWC
with natural weed infestations started between 228 and 916 growing degree days (GDD), and ended
between 648 and 1311 GDD, depending on the site and cane variety. These results represented a
maximum CPWC of 12 to 28 weeks after harvest (WAH). In plant cane, the CPWC started earlier (6
WAP) and was longer than those in ratoon cane.
Relative competitiveness ‘q’ values of eight common weed species showed that sugar cane was
a stronger competitor than most of the weeds tested. The adverse effect of weed competition in sugar
cane is not experienced before several weeks following weed emergence. Weeds transplanted 10 WAP
caused no significant change in cane yield response as compared to those transplanted 4 WAP.
Paspalum paniculatum was often found to be more competitive than P. urvillei, although the latter
produced more leaf area and grew taller to intercept more light within the canopy. This indicated that
other mechanisms of weed interference were involved and competition for light was more important
during the earlier (tillering) growth stages. Root competition was shown to be as important as shoot
competition. Root competition effects were observed several weeks after imposing competition,
suggesting that it was more important than competition for light in the post-tillering phase.
Application of root exudates from the two grasses to sugar cane confirmed an allelopathic effect on the

xi
root biomass of sugar cane. One chemical identified in the leachates from both Paspalum species for
the allelopathic effects was 2-propenoic acid, 3-(4-methoxyphenyl).
The main implications of the above findings for the Mauritian sugar industry would involve a
change in the timing of application of herbicides. A new tank-mix consisting of trifloxysulfuron +
ametryn and amicarbazone has been found to meet this objective. This strategy will enable a saving of
at least one herbicide treatment per season.
Key words: relative competitiveness, shoot competition, root competition, allelopathy, herbicide
1
CHAPTER 1
INTRODUCTION
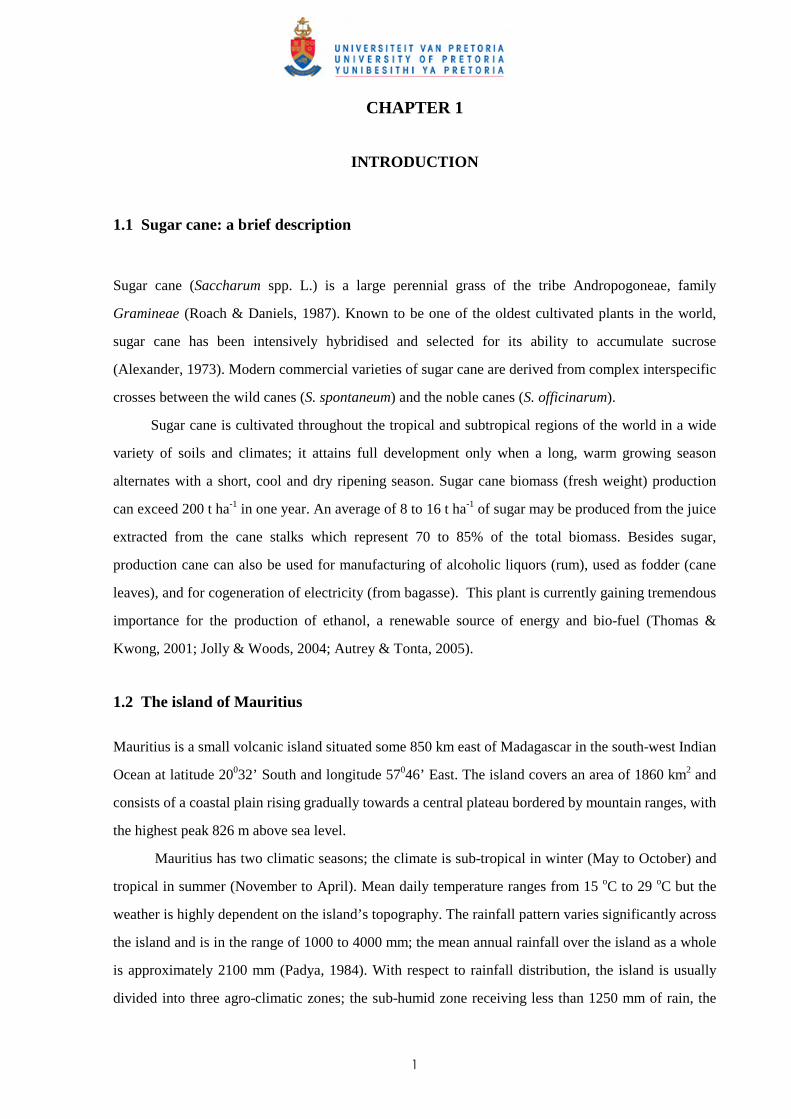
1.1 Sugar cane: a brief description
Sugar cane (Saccharum spp. L.) is a large perennial grass of the tribe Andropogoneae, family
Gramineae (Roach & Daniels, 1987). Known to be one of the oldest cultivated plants in the world,
sugar cane has been intensively hybridised and selected for its ability to accumulate sucrose
(Alexander, 1973). Modern commercial varieties of sugar cane are derived from complex interspecific
crosses between the wild canes (S. spontaneum) and the noble canes (S. officinarum).
Sugar cane is cultivated throughout the tropical and subtropical regions of the world in a wide
variety of soils and climates; it attains full development only when a long, warm growing season
alternates with a short, cool and dry ripening season. Sugar cane biomass (fresh weight) production
can exceed 200 t ha-1 in one year. An average of 8 to 16 t ha-1 of sugar may be produced from the juice
extracted from the cane stalks which represent 70 to 85% of the total biomass. Besides sugar,
production cane can also be used for manufacturing of alcoholic liquors (rum), used as fodder (cane
leaves), and for cogeneration of electricity (from bagasse). This plant is currently gaining tremendous
importance for the production of ethanol, a renewable source of energy and bio-fuel (Thomas &
Kwong, 2001; Jolly & Woods, 2004; Autrey & Tonta, 2005).
1.2 The island of Mauritius
Mauritius is a small volcanic island situated some 850 km east of Madagascar in the south-west Indian
Ocean at latitude 20032’ South and longitude 57046’ East. The island covers an area of 1860 km2 and
consists of a coastal plain rising gradually towards a central plateau bordered by mountain ranges, with
the highest peak 826 m above sea level.
Mauritius has two climatic seasons; the climate is sub-tropical in winter (May to October) and
tropical in summer (November to April). Mean daily temperature ranges from 15 oC to 29 oC but the
weather is highly dependent on the island’s topography. The rainfall pattern varies significantly across
the island and is in the range of 1000 to 4000 mm; the mean annual rainfall over the island as a whole
is approximately 2100 mm (Padya, 1984). With respect to rainfall distribution, the island is usually
divided into three agro-climatic zones; the sub-humid zone receiving less than 1250 mm of rain, the
2
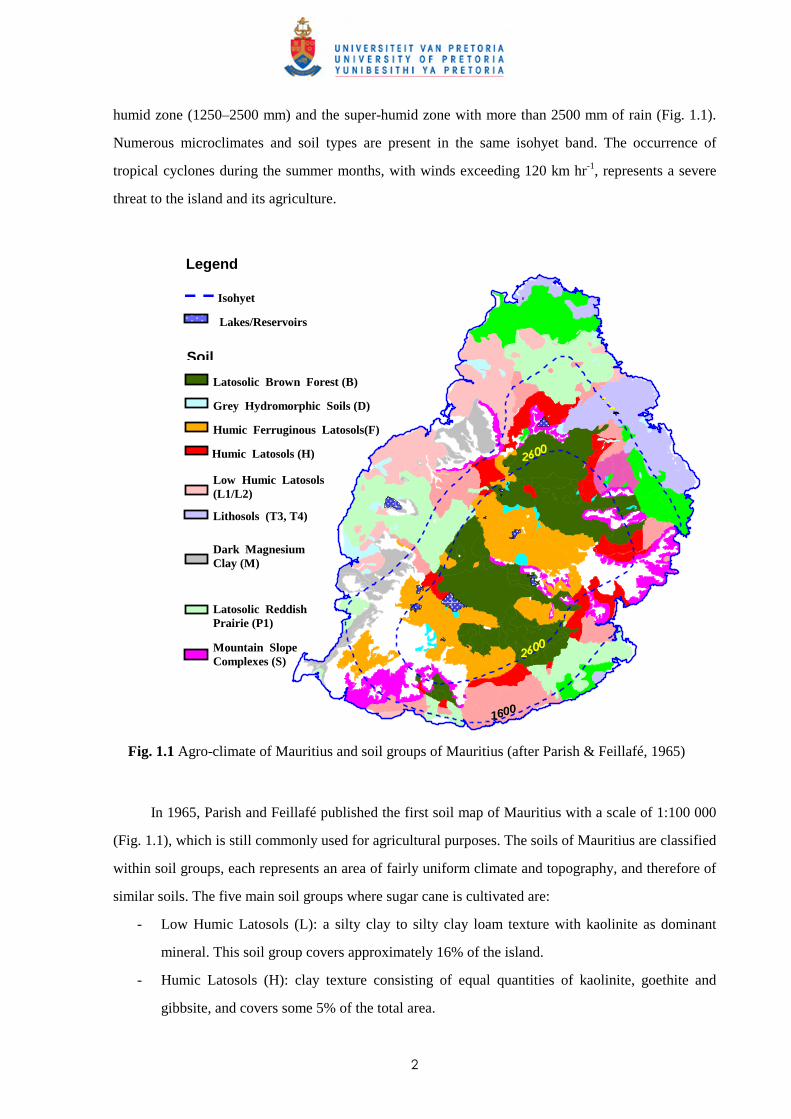
humid zone (1250–2500 mm) and the super-humid zone with more than 2500 mm of rain (Fig. 1.1).
Numerous microclimates and soil types are present in the same isohyet band. The occurrence of
tropical cyclones during the summer months, with winds exceeding 120 km hr-1, represents a severe
threat to the island and its agriculture.
Fig. 1.1 Agro-climate of Mauritius and soil groups of Mauritius (after Parish & Feillafé, 1965)
In 1965, Parish and Feillafé published the first soil map of Mauritius with a scale of 1:100 000
(Fig. 1.1), which is still commonly used for agricultural purposes. The soils of Mauritius are classified
within soil groups, each represents an area of fairly uniform climate and topography, and therefore of
similar soils. The five main soil groups where sugar cane is cultivated are:
- Low Humic Latosols (L): a silty clay to silty clay loam texture with kaolinite as dominant
mineral. This soil group covers approximately 16% of the island.
- Humic Latosols (H): clay texture consisting of equal quantities of kaolinite, goethite and
gibbsite, and covers some 5% of the total area.
2600
1 6 0 0
1600
2600
Legend
Isohyet (mm)
Latosolic Brown Forest (B) Grey Hydromorphic Soils (D) Humic Ferruginous Latosols(F)
Mountain Slope Complexes (S)
Dark Magnesium Clay (M)
Latosolic Reddish Prairie (P1)
Humic Latosols (H) Low Humic Latosols (L1/L2)
Lakes/Reservoirs
Soil
Lithosols (T3, T4)
3
- Humic Ferruginous Latosols (F): strongly weathered soil occurring in the high rainfall regions
and are rich in organic matter. The clay fraction is mainly gibbsite and goethite, with little
kaolinite. This group is present on approximately 11.4% of the island.
- Latosolic Reddish Prairie (P): soil group found in lower rainfall areas and the texture varies
from clay loams to silty clays. The clay fraction is dominantly kaolinite and this group covers
some 20% of the total area of the island.
- Latosolic Brown Forest (B): the texture of the B soils varies from clay loams to clay. The clay
fraction has lesser amounts of kaolinite and more gibbsite and goethite. This soil group is
present on 17% of the island. 1.3 Introduction of sugar cane to Mauritius
Sugar cane was first brought to Mauritius in 1639 by the Dutch who established two sugar processing
plants in 1641 (Koenig, 1988). By 1652, however, the manufacture of sugar was abandoned but the
cultivation of sugar cane was continued for the production of ‘arrack’ (an alcoholic beverage similar to
rum). The Dutch left the island in 1710 and during the French occupation (1721–1810), great impetus
was given to sugar cane production and the first sugar factories were created; some 3 000 tonnes of
sugar and 300 000 gallons of arrack were produced by the beginning of the 19th century. The British
captured the island in 1810 and realized that sugar production could be the greatest asset of Mauritius;
as a result the area under cane increased steadily and reached 11 000 ha in 1825. The island was
already producing some 107 000 tonnes of sugar in 1854. The sugar industry has since undergone
further expansion through increased acreage of sugar cane and significant technical progress due to
research and development.
The country recorded its maximum sugar production in 1973 when 718 464 tonnes were yielded
from a cultivated area of 87 384 ha (Koenig, 1988). Since then, owing to the conversion of cane land
to other uses and small-growers abandoning their production due to increasing costs, production has
been falling on average; from 706 839 tonnes in 1986 to 504 900 tonnes in 2006 (MSIRI, 2006). The
current area under cane is less than 67 000 ha (MSIRI, 2006). The decrease in area and production has
been faster within the last five years as more lands have been converted to other new emerging sectors
such as manufacturing (mainly textile), the information and telecommunication technologies (ICT)
and integrated resort schemes (IRS).
4
1.4 Cultural practices of sugar cane
Sugar cane is usually propagated by planting portions of the stems, called cuttings or setts; each of
which usually has three to five buds (STASM, 2003). The setts are planted in furrows approximately
0.15 m deep and spaced between 1.30 m and 1.62 m. The total number of setts varies between 25 000
to 30 000 per hectare, representing between 6 and 9 tonnes of planting material. Cane is ideally
planted when both optimum temperature (25-30 oC) and soil moisture are present (Van Dillewijn,
1952). Germination of the buds (primary shoots) starts a few days after planting and secondary shoots,
called tillers, are produced a few weeks later (tillering phase). Shoots start to elongate while in the
tillering phase; peak tillering is reached between 22 to 36 weeks and is followed by suppression of
excessive tillers. The final number of cane stalks (millable stalks) is a characteristic of the variety;
Mauritian varieties reach the harvesting stage with 80 000 to 100 000 millable stalks per hectare. The
elongation phase is overlapped and followed by the cane maturation phase. Cane maturation is
favoured in winter when cane growth is slowed and the lower night temperatures and dry conditions
enhance sucrose accumulation.
Harvest extends from June to December in Mauritius. The plant cane is usually harvested after
12 to 14 months (short season: crop season planting) or 16 to 20 months (long season: intercrop
planting) (STASM, 1990). The ratoon crop (cane regrown from stools left after the previous crop was
harvested) is normally harvested every 12 months over a period of 6–8 years. Under favourable
conditions, sugar cane can produce more than 200 t ha-1 of total biomass of which 70% to 80% would
consist of millable cane stalks. In Mauritius, the average cane and sugar yields were 79.0 t ha-1 and
8.84 t ha-1, respectively, in 2001 (MSIRI, 2002).
The cultural practices of sugar cane vary according to agroclimatic conditions and the level of
field mechanization. Weed control remains one of the most important cultural practices of sugar cane,
as its long period of growth before complete crop canopy formation may result in the crop being
exposed to several flushes of weeds. For plant cane, canopy closure occurs between 18 and 28 weeks
after planting, depending on growth conditions (agro-climatic conditions). For ratoon cane, as tillering
and elongation start earlier, canopy closure is reached between 12 and 24 weeks after harvest (Van
Dillewijn, 1952).
There has been considerable progress with mechanization of cultural practices, particularly
harvest, during the last 15 years; more than 17 000 ha were harvested mechanically in 2005 (MSIRI,
2006). The latter mechanized operation is considered as one of the reasons for direct and indirect
reduction in cane productivity in recent years because mechanized harvesting results in more plant
5
material being left in the fields than with hand harvesting. The machines also cause some physical
damage on the cane stools and harvesting under humid conditions increases the risk of soil
compaction. 1.5 Weeds of sugar cane
1.5.1 Major weeds of sugar cane in Mauritius
In Mauritius more than a hundred weed species have been identified in sugar cane fields;
some sixty of the most commonly found weeds have been described by Mc Intyre (1991).
Rochecouste (1967) showed that weed distribution depends mainly upon soil type and moisture. Some
weeds are more specific to certain regions whereas others may be found growing in all climatic zones.
Cyperus rotundus (Linn.) (purple nut sedge) and Cynodon dactylon (L.) Pers. (bermuda grass), which
are considered as two of the world’s worst weeds (Holm et al., 1977), grow under all agroclimatic
conditions of the island, whereas species such as Drymaria cordata (L.) Willd, Panicum maximum
Jacq., Colocasia esculenta (L.) Schott etc. are adapted to specific regions. However, some weeds have
developed a wider adaptation with time; e.g. Digitaria horizontalis Willd var. porrantha (steud.)
Henr., which was known to be particularly adapted to the high rainfall areas, is now also found
growing in lower rainfall areas. The competitive effect of weeds also varies with the season; e.g. C.
rotundus is more competitive during the summer months, and then particularly in the lowlands.
For weed control purposes, weeds are usually grouped into three broad classes, namely: broad-
leaved weeds, grasses and sedges (Cyperaceae) (Colvin, 1980). Grasses are more troublesome to
control in sugar cane due to the difficulty of achieving good selectivity from available herbicides. This
was confirmed in a survey carried out (unpublished data) in 2004 among the large sugar cane
producers, and covering an area of 48 000 ha, where eight grasses were listed among the ten weeds
identified by the growers as difficult to control. These eight grass weeds were Brachiara eruciformis
(J.E. Sm) Grisab, C. dactylon, D. horizontalis, P. maximum, Panicum subalbidum Kunth., Paspalum
paniculatum Linn., Paspalum urvillei Steud and Digitaria timorensis (Kunth.) Balans. The other two
weeds listed were C. rotundus and Ageratum conyzoides Linn. Panicum maximum is mostly found at
lower altitudes and is controlled mostly at planting and with localised application of glyphosate.
Similarly, B. eruciformis is mostly found in the warmer and drier parts of the island. Panicum
subalbidum has emerged as an important weed in the humid zone after not being controlled by the
6
standard herbicide treatments applied between 1985 and 1995 but a change in the treatments thereafter
has brought satisfactory control.
Paspalum paniculatum and P. urvillei have been focused on in this project/thesis to study and
describe weed competition in sugar cane, as they are listed among the five most common weeds in the
humid and superhumid areas, representing more than 60% of cane-growing area, and because the cane
growers include them in their list of more intractable weeds (see above). Other reasons for their
selection in this study include their diverse morphological characteristics, despite them being closely
related, plus the relative ease with which they can be established.
1.5.2 Paspalum paniculatum
Botanical classification
Paspalum paniculatum Walt. is from the Poaceae (Grass) family and synonyms include Paspalum
compressicaulis Raddi, Paspalum multispica Steud., Paspalum polystachium Salzm., Paspalum
strictum Pers. Its common or vernacular name in Mauritius is ‘Herbe duvet’.
Description
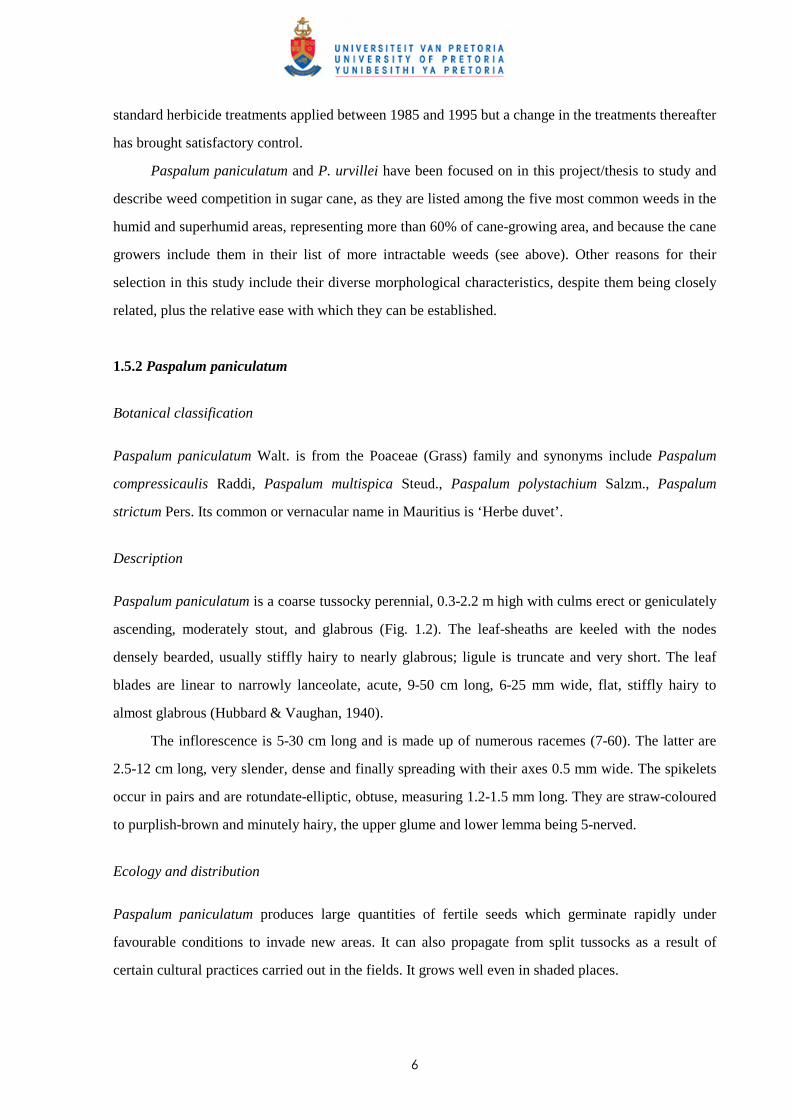
Paspalum paniculatum is a coarse tussocky perennial, 0.3-2.2 m high with culms erect or geniculately
ascending, moderately stout, and glabrous (Fig. 1.2). The leaf-sheaths are keeled with the nodes
densely bearded, usually stiffly hairy to nearly glabrous; ligule is truncate and very short. The leaf
blades are linear to narrowly lanceolate, acute, 9-50 cm long, 6-25 mm wide, flat, stiffly hairy to
almost glabrous (Hubbard & Vaughan, 1940).
The inflorescence is 5-30 cm long and is made up of numerous racemes (7-60). The latter are
2.5-12 cm long, very slender, dense and finally spreading with their axes 0.5 mm wide. The spikelets
occur in pairs and are rotundate-elliptic, obtuse, measuring 1.2-1.5 mm long. They are straw-coloured
to purplish-brown and minutely hairy, the upper glume and lower lemma being 5-nerved.
Ecology and distribution
Paspalum paniculatum produces large quantities of fertile seeds which germinate rapidly under
favourable conditions to invade new areas. It can also propagate from split tussocks as a result of
certain cultural practices carried out in the fields. It grows well even in shaded places.
7
Paspalum paniculatum is a dominant species of the humid and superhumid areas of Mauritius,
growing mostly along roadsides and in fallow fields from where it encroaches onto sugar cane fields.
Today, it is quite common in sugar cane fields.
Fig. 1.2 Paspalum paniculatum (Photo courtesy: Mc Intyre, 1991)
1.5.3 Paspalum urvillei
Botanical classification
Paspalum urvillei Steud. is from the Poaceae (Grass) family and synonyms include Paspalum griseum
Hack., Paspalum dilatatum var. parviflorum Doell and Paspalum velutinum Trin. Its common or
vernacular name in Mauritius is ‘Herbe cheval’.
Description
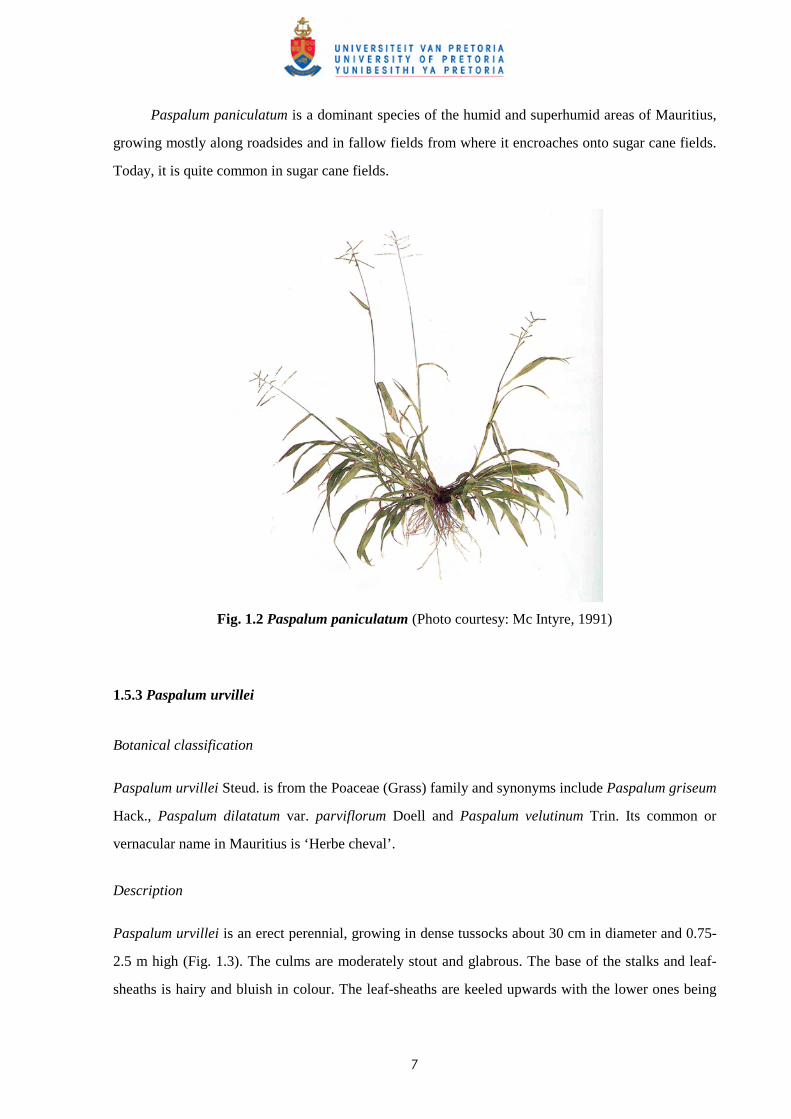
Paspalum urvillei is an erect perennial, growing in dense tussocks about 30 cm in diameter and 0.75-
2.5 m high (Fig. 1.3). The culms are moderately stout and glabrous. The base of the stalks and leaf-
sheaths is hairy and bluish in colour. The leaf-sheaths are keeled upwards with the lower ones being
8
coarsely hairy whereas those found on the upper parts are less hairy or are glabrous. The ligules are 3-
5 mm long; leaf blades are erect, linear, acute, 12-50 cm long and 3-15 mm wide. They are flat and
long-hairy at the base, otherwise glabrous (Skerman & Riveros, 1990).
The inflorescence is erect or slightly nodding, 10-40 cm long, and is composed of 6-25 dense,
mostly erect racemes. The lower racemes are 6-14 cm long, whereas the upper ones become gradually
shorter, each with their axis about 0.8 mm width. The spikelets are paired, broadly ovate-elliptic,
abruptly acute and are 2-3 mm long. They are green or purplish in colour; the upper glume and lower
lemma are 3-5 nerved and are fringed with long silky hairs (Skerman & Riveros, 1990).
Ecology and distribution
Paspalum urvillei is a perennial plant which spreads fairly quickly under favourable moist conditions
with its heavy seed production; it can also regenerate from split tussocks. It prefers full sunlight and
does not grow well in shade. Its vigorous, erect growth allows it to compete successfully with other
plants and crops.
Paspalum urvillei is a high rainfall grass occurring mostly in the humid and super-humid areas
of Mauritius, along roadsides and in fallow fields from where it extends its range to cultivated fields. It
is commonly found in sugar cane fields nowadays.
Fig 1.3 Paspalum urvillei (photo courtesy: Mc Intyre, 1991)
9
Thus, P. paniculatum has a somewhat more prostrate growth habit than P urvillei and grows at a
relatively lower height within the cane canopy. The size and growth habit of P. urvillei when well
developed causes manual application of herbicides and uprooting (hand-weeding) to be more difficult
than in the case of P. paniculatum. Because of its physical presence higher within the crop canopy,
growers consider P. urvillei as more competitive than P. paniculatum.
1.6 Weed control in sugar cane
Since the early 1950s, the introduction of selective herbicides has been one of the main factors
enabling intensification of agriculture in developed countries (Kropff & Lotz, 1992a; Kropff &
Walter, 2000). In Mauritius, prior to the introduction of the herbicides MCPA and 2,4-D in the late
1940s, weed control in sugar cane was achieved mainly by manual weeding. Some cultural practices
such as trash lining (“relevage”) and ridging (“buttage”) also helped to suppress weeds (De Sornay,
1926). The availability of residual herbicides from the 1950s and research showing the advantages of
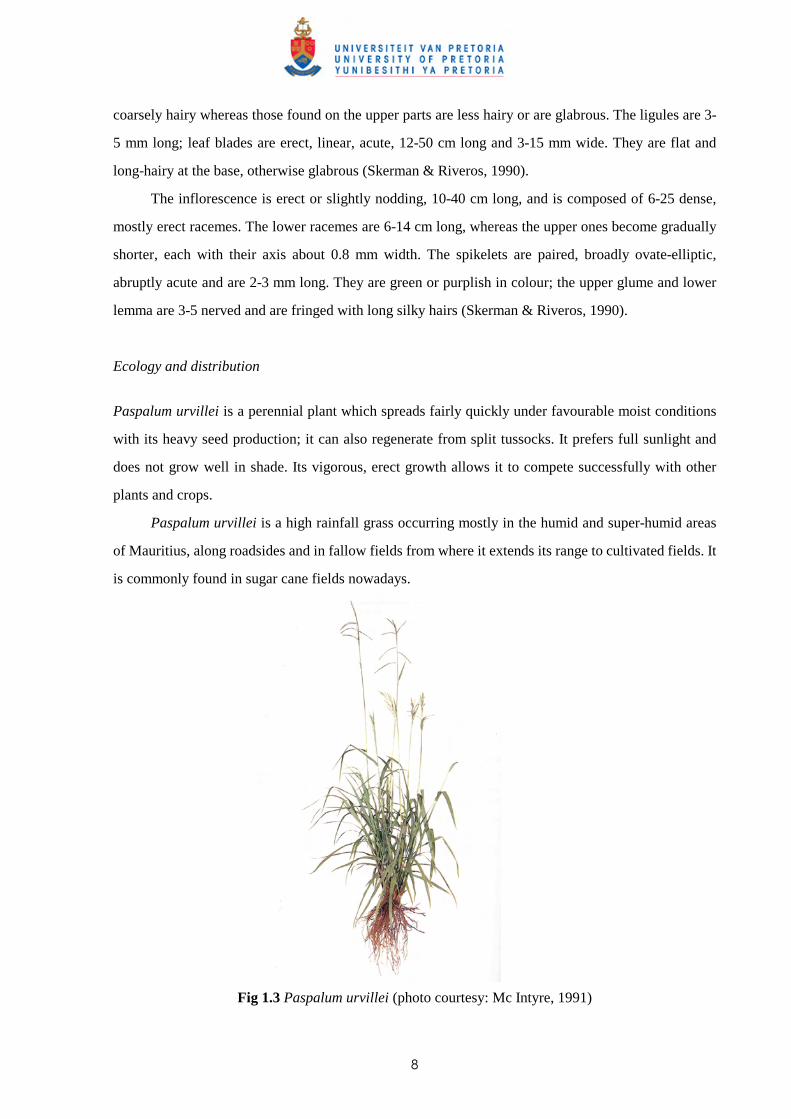
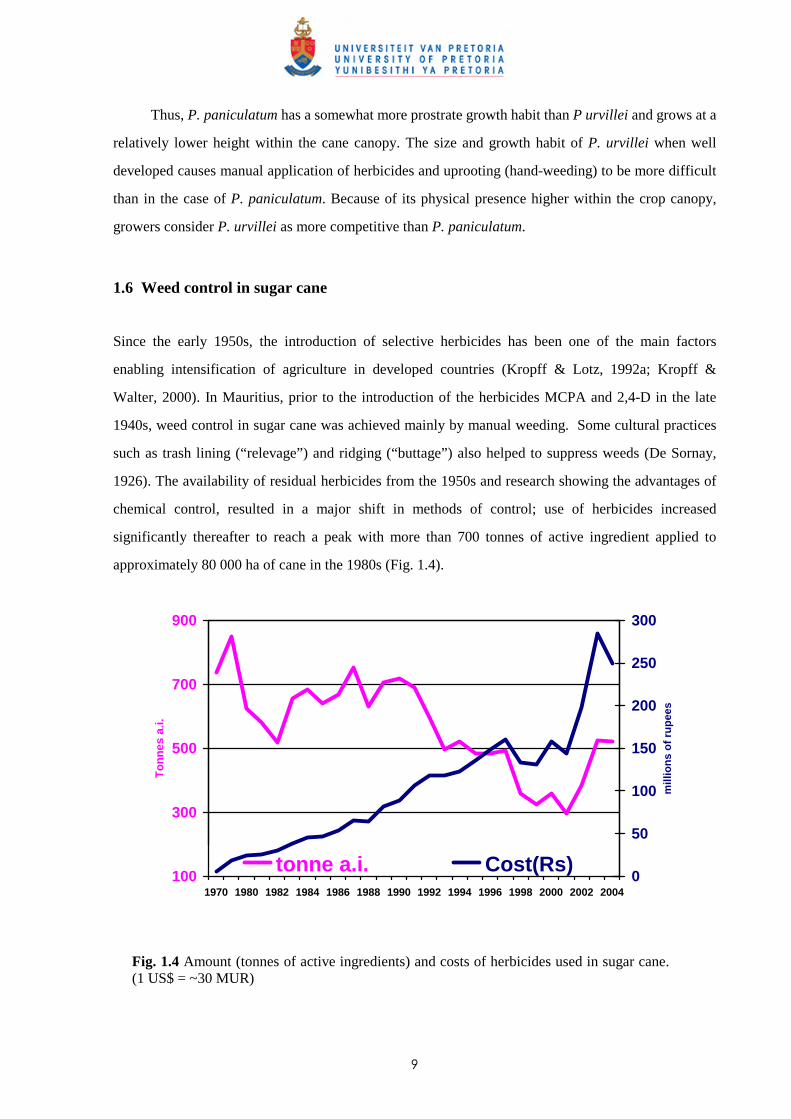
chemical control, resulted in a major shift in methods of control; use of herbicides increased
significantly thereafter to reach a peak with more than 700 tonnes of active ingredient applied to
approximately 80 000 ha of cane in the 1980s (Fig. 1.4).
100
300
500
700
900
1970 1980 1982 1984 1986 1988 1990 1992 1994 1996 1998 2000 2002 2004
To
nn
es a
.i.
0
50
100
150
200
250
300
mill
ion
s o
f ru
pee
s
tonne a.i. Cost(Rs)
Fig. 1.4 Amount (tonnes of active ingredients) and costs of herbicides used in sugar cane. (1 US$ = ~30 MUR)
10
More than 125 herbicides have been tested in sugar cane during the last 50 years, and more than
25 of them have been recommended for commercial use (Rochecouste, 1967; MSIRI annual reports
1953-2006). Research in Mauritius during that period was also herbicide driven (Van Der Zweep &
Hance, 2000). The amount of herbicides applied, particularly pre-emergence ones, has declined in the
last decade with the increased adoption of “green cane trash blanketing”, a practice recommended in
1992 for better soil moisture conservation and weed control (Seeruttun et al., 1992). An increase in the
total amount of herbicides imported was recorded in 2003 and 2004 as a consequence of an early
retirement scheme in the sugar industry in 2003 where the majority of the female labourers above the
age of 50 years old were allowed to depart with a special package. As this group of labourers was
involved in manual weeding, more herbicides were purchased by the sugar estates as a countering
measure. The amounts purchased and stocked were rapidly found to be in excess of what was required
to compensate for the reduction in labour force and the amount of herbicides imported/used regressed
thereafter. The practice of trash blanketing is, however, not recommended in the superhumid areas as
it adversely affects cane growth in those regions (Seeruttun et al., 1999).
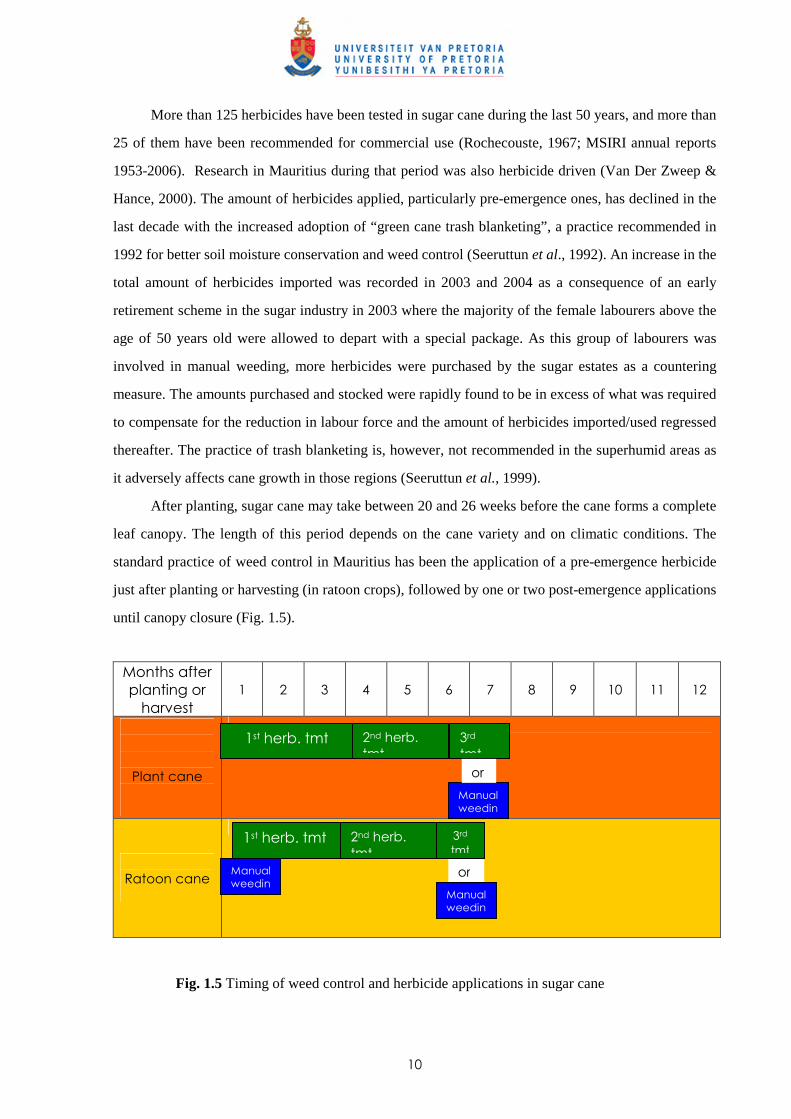
After planting, sugar cane may take between 20 and 26 weeks before the cane forms a complete
leaf canopy. The length of this period depends on the cane variety and on climatic conditions. The
standard practice of weed control in Mauritius has been the application of a pre-emergence herbicide
just after planting or harvesting (in ratoon crops), followed by one or two post-emergence applications
until canopy closure (Fig. 1.5).
Months after
planting or
harvest
1 2 3 4 5 6 7 8 9 10 11 12
Plant cane
Ratoon cane
Fig. 1.5 Timing of weed control and herbicide applications in sugar cane
or
1st herb. tmt 2nd herb.
tmt
3rd
tmt
Manual
weedin
Manual
weedin
1st herb. tmt 2nd herb.
tmt
3rd
tmt
Manual
weedin
or
11
The residual action of the first herbicide treatment usually lasts between 10-14 weeks, thus
necessitating a second application consisting of one or two pre-emergence herbicides tank-mixed with
a post-emergence one to control emerged weeds and, at the same time, to prevent others from
emerging. Under certain circumstances, when canopy closure is retarded for reasons such as climate,
cane variety and row spacing, a third herbicide application may be necessary usually as a full or spot
treatment (Fig. 1.5). This application is sometimes replaced by manual weeding depending on the
availability of labour (especially during the intercrop period). Manual weeding is also resorted to when
certain weed species are not controlled by the standard treatments.
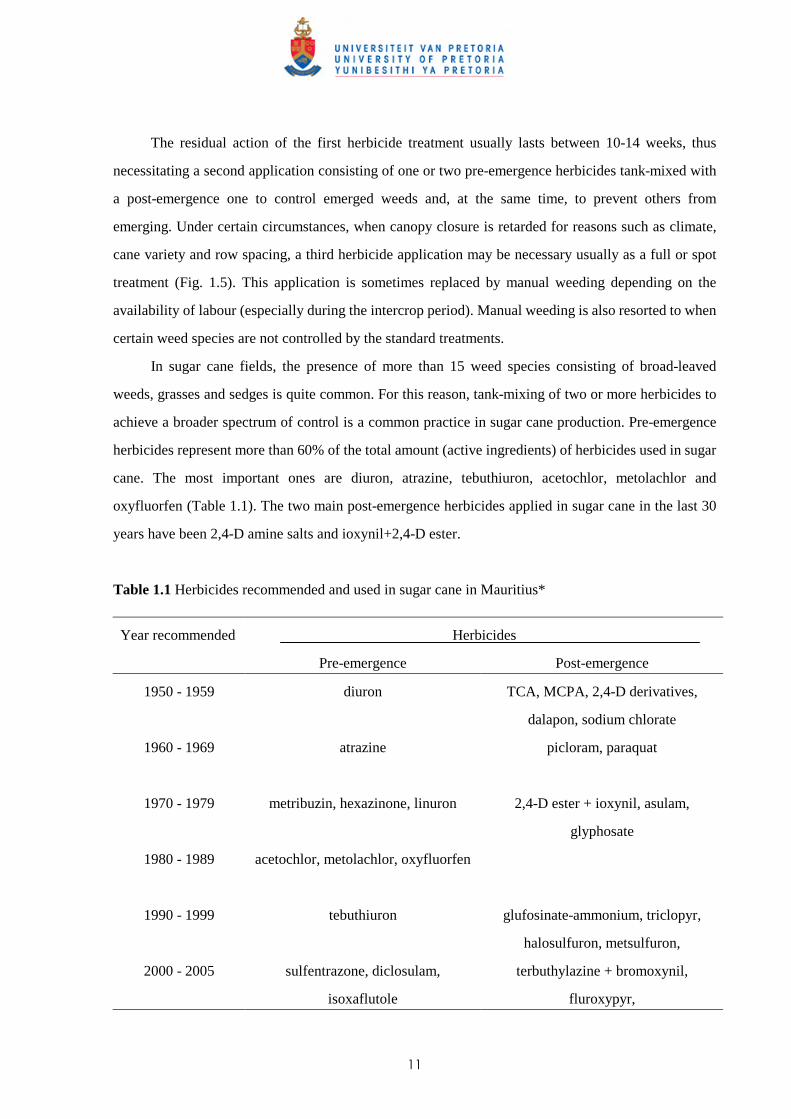
In sugar cane fields, the presence of more than 15 weed species consisting of broad-leaved
weeds, grasses and sedges is quite common. For this reason, tank-mixing of two or more herbicides to
achieve a broader spectrum of control is a common practice in sugar cane production. Pre-emergence
herbicides represent more than 60% of the total amount (active ingredients) of herbicides used in sugar
cane. The most important ones are diuron, atrazine, tebuthiuron, acetochlor, metolachlor and
oxyfluorfen (Table 1.1). The two main post-emergence herbicides applied in sugar cane in the last 30
years have been 2,4-D amine salts and ioxynil+2,4-D ester.
Table 1.1 Herbicides recommended and used in sugar cane in Mauritius*
Herbicides Year recommended
Pre-emergence Post-emergence
1950 - 1959 diuron TCA, MCPA, 2,4-D derivatives,
dalapon, sodium chlorate
1960 - 1969 atrazine
picloram, paraquat
1970 - 1979 metribuzin, hexazinone, linuron 2,4-D ester + ioxynil, asulam,
glyphosate
1980 - 1989 acetochlor, metolachlor, oxyfluorfen
1990 - 1999 tebuthiuron glufosinate-ammonium, triclopyr,
halosulfuron, metsulfuron,
2000 - 2005 sulfentrazone, diclosulam,
isoxaflutole
terbuthylazine + bromoxynil,
fluroxypyr,
12
* Sources: Rochecouste (1967), Recommendation Sheets, MSIRI.
In addition to those listed in Table 1.1, some specific herbicides are also used for the control of
certain problem weeds, which are resistant to the conventional treatments; examples include triclopyr,
picloram or fluroxypyr for control of shrubs and vine weeds, halosulfuron for control of sedges
(C. rotundus) and metsulfuron-methyl for control of Colocasia esculenta and Alternanthera
philoxeroides (Mart.) Griseb. Glyphosate is mainly used for general weed control pre-planting of
sugar cane.
1.7 Sugar cane in the Mauritian economy
Mauritius has no natural mineral resources and thus tropical agriculture has played a fundamental role
in its economy. Historically the country was totally dependent on the monoculture of sugar cane; sugar
represented 93.5% of exports in 1967 (Koenig, 1988). Since the 1970s, the role of sugar in the
economy has changed with the share of sugar in the gross domestic product (GDP) dropping from
25% in 1970 to less than 4% in 2005. This change has occurred due to the diversification of the
economy with new economic sectors like tourism and the manufacturing industry emerging in the
1970s and 1980s, followed by developments in the finance sector and information and communication
technologies in recent years.
In 2002 about 45% of the total area of the island was cultivated and about 90% of that area (87
000 ha, excluding forests) was under sugar cane. The area under sugar cane has undergone a reduction
within the last 20 years; 87 384 ha of sugar cane were grown in the record year of 1973, and less than
70 000 ha in 2006. Similarly, the number of persons employed in the sugar industry has also
experienced a significant reduction in recent decades. Despite these reductions, income from the
export of sugar has remained an important source of foreign earnings. The bulk of Mauritian sugar is
exported to the European Community, principally to the United Kingdom, under the Sugar Protocol
between the ACP/EU. Based on this agreement, Mauritius has benefited from an annual export of
some 500 000 t at a guaranteed price till 2005 (Mauritius Chamber of Agriculture, 2006; Ministry of
Agro-industry and Fisheries, 2006).
The erosion of preferential access to our traditional export markets for sugar, and the challenges
imposed by the trade liberalization process (World Trade Organization - WTO), have called for urgent
action by the local sugar industry. Because of the increasing costs of production of sugar in the late
1990’s, coupled with the threats and challenges ahead (i.e. the real risk of Mauritian sugar exports
13
losing their competitive edge in a liberalized trade environment), a strategic plan was implemented by
the Government in 2001. In its Sugar Sector Strategic Plan (SSSP) 2001-2005, the Government fixed a
production target of 620 000 t of sugar. Additionally, the cost of production of 14 US¢ per pound
would have to be reduced to 10-12 ¢ per pound by 2008 (Ministry of Agriculture, Food Technology
and Natural Resources, 2001). This plan was still not completely implemented when the EU
announced its reform in the Sugar Regime that would lead to a cumulative 36% reduction in the price
of sugar (523 Euros t-1) as from 2006 and completed in 2009. This drastic reduction has jeopardized
the industry as a whole and several actions are being taken to minimize the impact and save the
industry. All these actions are enforced in the Multi Annual Adaptation Strategy (MAAS) Plan
(Ministry of Agro-Industries and Fisheries, 2006).
Among the various actions listed in the MAAS, efforts will have to be made to reduce the cost
of production by mechanization of cultural practices, and by other means. Both the SSSP and MAAS
plans imply a review of the costs for weed control within the industry, as all herbicides used in
Mauritius are imported. This aspect is particularly important, as both plans tend to promote increased
use of herbicides to replace the more costly manual workers (labourers) opting for voluntary
retirement schemes.
1.8 Development of weed management strategies
The traditional weed management practice has been to eradicate practically all weeds from sugar cane
fields irrespective of the species present, their levels of infestation, and the stage of growth of the cane.
To achieve this level of control and to cope with the reduction in, or non-availability of, labour in the
sugar industry in the 1980’s, cane producers have resorted to more pre- and post-emergence
herbicides. Although a slight reduction in the total amount of active ingredients had been noted during
the last decade due to new molecules/formulations using less active ingredients, as well as the
adoption of trash blanketing in the sub-humid areas, the total costs of herbicides have increased
significantly (except for 2003 and 2004 as explained previously) (Fig. 1.4). This is mainly due to the
exchange rate of the Mauritian rupee vis à vis the US dollar and the pound Sterling; all herbicides used
locally being imported. The average cost of herbicides exceeds MUR 3 500 ha-1 (110 US$) and the
total costs for weed control in the sugar industry was estimated at more than MUR 450 000 000 in
2004. Costs for weed control vary between 4% and 8% of the total cost of production.

14
The reduction in sugar price has made it necessary to reduce production inputs including
herbicides. Furthermore, there is increasing pressure on farmers across the world to optimize their use
of pesticides in order to reduce environmental effects. In sugar cane in Mauritius, with the exception
of a fungicide treatment of cane setts at planting, herbicides are the only pesticides used, as control of
pests and diseases is achieved by biological control and development of resistant cane varieties. A
study undertaken between 1996 and 1999 has revealed that despite continuous use of herbicides such
as atrazine or diuron over the last 40 years, the amount of herbicide residues measured in the
underground water and rivers are negligible and were well below the threshold stipulated by the World
Health Organization (WHO) standards (MSIRI/ACIAR, 2001). However, these findings should not
preclude efforts to minimize the amount of herbicides used.
The optimization of herbicides to reduce environmental effects and to minimize costs has led to
development of strategies for Weed Management or Integrated Weed Management (IWM) and the use
of alternative methods for weed control. IWM involves a combination of cultural, mechanical,
biological, genetic, and chemical methods for effective and economical weed control (Swanton &
Weise, 1991). The new approach is aimed at management of weed populations and includes a better
understanding of crop-weed(s) interactions, identifying critical periods of weed competition with
respect to crop growth and weed emergence and infestation, improved agronomic practices, etc. Any
weed management system developed for a particular crop should not be geared towards yield losses
only in the current year but should consider longer term issues including consequences for the level of
weed infestation that is likely to arise in subsequent years. The latter includes the impact on the weed
seedbank of seeds produced from surviving weeds. 1.9 Objectives of thesis
The change from the traditional methods of ‘total’ or ‘all-time’ weed control to new integrated weed
management approaches has been a priority in the Research and Development Programme of the
MSIRI since 1998 (MSIRI, 1998). This approach has included timing weed control interventions to
have maximum impact during the competition period, choosing treatments targeted at the weed
species present and according to their infestation level, as well as integrating weed control with other
agronomic practices to reduce herbicide use. Several projects have been initiated at the MSIRI, based
on this approach, for the development of weed management strategies for the sugar industry by

15
exploiting different non-chemical means of weed control (including improved cultural practices) and a
rationalization of herbicide use.
The main aim of this PhD study is to provide sound scientific underpinning for the development
of new weed management practices for sugar cane in Mauritius. The research has explored in detail
competition between sugar cane and the major weeds present in cane fields and has endeavoured to
explain the different mechanisms of weed competition in sugar cane by comparing the interference
from two important weeds found in sugar cane fields in Mauritius, namely P. paniculatum and P.
urvillei, two closely related species with some distinct morphological differences. This study has the
following specific objectives:
1. To determine the critical periods of weed competition in sugar cane in order to enable
development of specific weed management strategies for the different agroclimatic zones and
production systems.
2. To quantify competition from different weed species in sugar cane, and to compare their
relative competitiveness with the aim of using the data to predict yield losses, and hence, to
choose appropriate control measures, possibly within a decision support system.
3. To understand the mechanism of competition for light between sugar cane and weeds
(represented by P. paniculatum and P. urvillei), and the change in competition (relative
competitiveness) with time, i.e. at different stages of cane and weed growth.
4. To separate the effects of shoot and root competition between the weeds P. paniculatum, P.
urvillei and sugar cane.
5. To elucidate weed interference based on allelopathy in sugar cane by determining if root
exudates from the two Paspalum species have allelopathic properties, and to determine
whether the two weed species differ in terms of the growth responses elicited from different
sugar cane varieties.
6. To develop new herbicide strategies for the effective control of the two grass species based on
research findings.
7. To formulate general recommendations based on the study for developing new weed
management strategies in sugarcane, and to identify avenues for future research in this field.
16
CHAPTER 2
CRITICAL PERIODS OF WEED CONTROL IN SUGAR CANE IN MAURITIUS
2.1 Introduction
One of the challenges of the Mauritian sugar industry remains the lowering of its high costs of
production, as discussed in Chapter 1. This has become more imperative with the implementation of
the price reduction of 36% as from 2009 by the EU, the main importer of Mauritian sugar.
Traditionally, weed control in sugar cane in Mauritius has aimed at total removal of weeds from the
time of planting, or from harvesting in ratoon cane, up to complete canopy closure. In the humid and
super-humid areas of Mauritius the latter may take between 20 and 30 weeks, necessitating three
herbicide applications per season costing more than 400 US $/ha.
The development of weed management strategies to reduce the amount of herbicides used for
weed control in sugar cane, for both economical and environmental reasons, is now even more of a
priority than it has been in the recent past. An integrated approach to weed management is needed.
Integrated Weed Management (IWM) involves a combination of cultural, mechanical, biological,
genetic, and chemical methods for effective and economical weed control (Swanton & Weise, 1991).
This approach focuses on the management of weed populations in accordance with economic
threshold levels, rather than their total elimination. To achieve this there is a need for better
understanding of crop-weed interactions, identification of critical periods of weed competition with
respect to crop growth, weed emergence and infestation level, as well as improved agronomic
practices. Critical period for weed control (CPWC) is defined as the specific minimum period of time
during which the crop must be free from the adverse effects of weeds to prevent crop yield loss
(Zimdahl, 1993). Knezevic et al. (2003) reported the CPWC as a key component of any IWM
program. The CPWC represents the time interval between two separately measured components: the
maximum weed-infested period – the length of time that the weeds emerging with the crop can remain
before they begin to interfere with crop growth, and the minimum weed-free period – the length of
time a crop must be free of weeds after planting to prevent yield losses. These components can be
experimentally determined by measuring crop yield loss as a function of successive times of weed
removal or weed emergence, respectively (Weaver et al., 1992). The CPWC has been found to vary
17
with location, year, cultivar, nitrogen application rate, row spacing, etc (Cousens, 1988; Knezevic et
al., 2003; Van Acker et al., 1993).
Critical periods of weed competition in sugar cane have been reported from experiments carried
out in plant cane only. Lamusse (1965) reported, from a field experiment carried out in Trinidad, that
weed competition from Paspalum fasciculatum Wild (bamboo grass) had little adverse effect on the
sugar content and yield of sugar cane when infestation started as late as 12 weeks after planting;
however those beginning earlier were detrimental to final yields. Promkun (1984, cited by Suwanarak,
1990), in an irrigated area of Thailand, showed that delaying the first removal of weeds by 3 and 4
months may decrease yield by 44% and 65% respectively while Suwanarak (1982) observed that non-
irrigated sugar cane required a weed-free period of 4-5 months after planting. From a field trial carried
out in Ivory Coast, Marion and Marnotte (1991) showed that a weed-free period between the first and
third months after planting was required in order to restrict maximum yield loss to 5%. As Mauritian
conditions are different, and because ratoon cane represents more than 85% of the cultivated area, the
objectives of this part of the project were to study the CPWC mainly in ratoon cane (plus one trial in
plant cane) in the super-humid and humid areas of Mauritius, where cane canopy closure takes longer
and weed competition is expected to be higher. It is expected that results obtained under such difficult
conditions may be extrapolated for the development of weed management strategies for other regions
of the island. 2.2 Materials and methods
Sites and trial characteristics
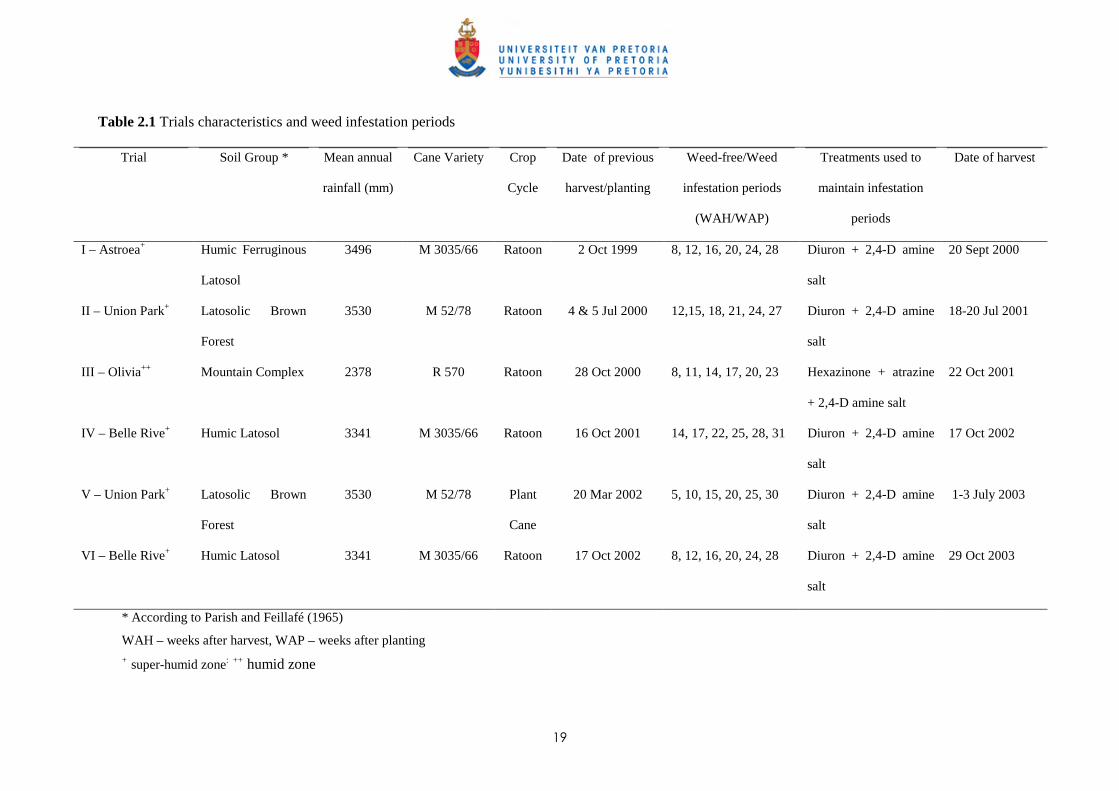
Six field trials, five in ratoon cane and one in plant cane, were established between 1999 and 2003 in
the humid and super-humid areas of Mauritius; the characteristics of the different sites are shown in
Table 2.1. All trial sites except Olivia (Trial III) receive more than 3000 mm of rain annually; the
mean annual rainfall at Olivia is around 2500 mm. Trial II was initiated after the previous crop was
harvested early in the season (July), whilst the four other trials in ratoon crops were established in
October following harvesting of the late maturing cane varieties grown (Table 2.1). After harvesting
the ratoon crop, conventional crop husbandry practices such as trash management and fertilizer
application for each site were maintained; the rate of N fertilizer applied was as per recommendation
(STASM, 1990); i.e. 1.4 kg of N applied per tonne of cane produced. A herbicide treatment consisting
18
of 2,4-D amine salt (2.0 kg a.e. ha-1) was applied to kill or suppress all emerged weeds in the weed-
free treatments, prior to the start of all the ratoon experiments.
For Trial V, cane variety M 52/78 (early maturing variety) was planted on 20 March 2002
following the standard cultural practices; fertilizer (NPK) were applied in the furrows at planting. The
standard pre-emergence herbicide treatment just after planting was not applied to allow weeds to
emerge.
Weed infestation treatments
A naturally occurring population of mixed weed species was present at all sites; they were either kept
for increasing periods of time or were removed for weed-free treatments for corresponding periods.
The treatments were imposed only when the first homogeneous flush of weeds started to emerge; this
resulted in different treatment start dates as weed emergence varied across the six trials. In ratoon
cane, weed infestation or weed-free periods started from 8 to 14 weeks after harvesting (WAH) of the
previous crop and were maintained for up to 23-31 weeks depending on the trial (Table 2.1), whereas
treatments in plant cane (Trial V) were imposed as from the first week after planting and continued up
to 30 weeks. The interval between different treatments (weed-free or weedy) was usually three or four
weeks for trials in ratoon cane while a five-week interval was established for the trial in plant cane
(Table 2.1).
For the weed-free treatment and at the end of each weed infestation period, the plots were
sprayed manually with a knapsack sprayer using double cone-jet nozzles delivering 450 L ha-1 of spray
volume at a working pressure of 300 kPa. The herbicide treatments were a tank-mix of diuron (2.5 kg
a.i. ha-1) + 2,4-D amine salt (2.0 kg a.e. ha-1). Diuron was replaced in the treatment by hexazinone +
atrazine (0.6 + 2.0 kg a.i. ha-1) at Olivia (Trial III) due to the susceptibility of the variety grown.
Where the weed infestation was planned to start later (10 to 20 weeks after harvest/planting), reduced
rates (25% of the full rate) of the diuron or hexazinone + atrazine were applied at the beginning of the
experiment to keep the plots weed-free initially. The few weeds not controlled by the herbicides were
removed manually.
19
Table 2.1 Trials characteristics and weed infestation periods
Trial Soil Group * Mean annual
rainfall (mm)
Cane Variety Crop
Cycle
Date of previous
harvest/planting
Weed-free/Weed
infestation periods
(WAH/WAP)
Treatments used to
maintain infestation
periods
Date of harvest
I – Astroea+
Humic Ferruginous
Latosol
3496 M 3035/66 Ratoon 2 Oct 1999 8, 12, 16, 20, 24, 28 Diuron + 2,4-D amine
salt
20 Sept 2000
II – Union Park+
Latosolic Brown
Forest
3530 M 52/78 Ratoon 4 & 5 Jul 2000 12,15, 18, 21, 24, 27 Diuron + 2,4-D amine
salt
18-20 Jul 2001
III – Olivia++
Mountain Complex 2378 R 570 Ratoon 28 Oct 2000 8, 11, 14, 17, 20, 23 Hexazinone + atrazine
+ 2,4-D amine salt
22 Oct 2001
IV – Belle Rive+
Humic Latosol 3341 M 3035/66 Ratoon 16 Oct 2001 14, 17, 22, 25, 28, 31 Diuron + 2,4-D amine
salt
17 Oct 2002
V – Union Park+
Latosolic Brown
Forest
3530 M 52/78 Plant
Cane
20 Mar 2002 5, 10, 15, 20, 25, 30 Diuron + 2,4-D amine
salt
1-3 July 2003
VI – Belle Rive+
Humic Latosol 3341 M 3035/66 Ratoon 17 Oct 2002 8, 12, 16, 20, 24, 28 Diuron + 2,4-D amine
salt
29 Oct 2003
* According to Parish and Feillafé (1965)
WAH – weeks after harvest, WAP – weeks after planting + super-humid zone: ++ humid zone
20
Two weed infestation levels were evaluated, namely a 100% situation and one where a 50%
infestation level was created. For the latter, each cane row (10 m long and spaced at 1.6 m) was
divided into quadrats of 1.6 m X 2.0 m (0.8 m from the centre of the cane on each side) and each
quadrat was further divided into four sub-quadrats of 1.0 m X 0.8 m. Two of these four sub-quadrats
were assigned randomly to receive the appropriately timed weed infestation treatments whilst the other
two were kept weed-free, thus halving the weed pressure (50% weed infestation). The weed-free sub-
quadrats were established and maintained either by the use of herbicides (pre-em & post-em) or by
manual weeding, as described above. Herbicide application within the sub-quadrats was restricted by
using wooden-board separators of the same width as the sub-quadrats (1.0 x 0.8 m) and spraying was
done inside them to avoid any drift of herbicides. A knapsack sprayer with an air-inclusion flat-fan
nozzle delivering 250 L ha-1 at a working pressure of 300 kPa was used.
Experimental design
At all sites, the plot size consisted of four cane rows, each 10 m long with a row spacing of 1.6 m. The
various treatments were laid adown in a randomized complete block design with three replications of a
factorial arrangement of increasing weed infestation or weed-free periods and two infestation levels.
Data collection
The main weeds present in all trial sites were recorded (Table 2.2). Data on weed biomass were
collected only in Trials I and III; the amount of weeds present two weeks after creating the two levels
of infestation at weeks 8-28 (Table 2.1) was compared in Trial I while the amount of weeds left at the
end of each infestation period was quantified at Olivia (Trial III). Dry weight of weeds were recorded
from two quadrats (1.0 m x 0.8 m) placed in the external (adjacent to the first and fourth cane rows)
cane interrows (destructive sampling) on the respective experimental plots; the amount (dry weight) of
weeds in each sub-quadrat from the 50% infestation level were expressed as the amount per full
quadrat. When the cane was mature the two middle cane rows within each plot were harvested
manually and weighed in all trials.
Daily maximum (Tmax, oC) and minimum (Tmin,
oC) temperature data for trials at Belle-Rive and
Union Park were obtained from the meteorological station at these sites. For the Olivia and Astroea
sites, temperature records were obtained from the National Meteorological Services.
21
Statistical analysis and fitting regression curves for critical periods
The data for weed biomass in Trials I and III were subjected to analysis of variance (ANOVA). Cane
yields from the different treatments were expressed as percentages of corresponding yields on weed-
free plots. Relative yield data were then used to fit regression models, as they have been suggested as a
more appropriate and useful means for determining the critical period (Cousens, 1988); regression
analysis can be used to determine CPWC based on a maximum allowable/acceptable yield loss (AYL).
The Gompertz model has been shown to describe the relationship between relative yield and
increasing duration of weed-free periods (Cousens, 1988).
- Gompertz function (asymmetrical s-shaped increasing curve)
Where Y is the % of season-long weed-free yield, x the length of weed-free period, and a,
b, c are constants.
Hall et al. (1992) showed that for critical periods the increasing weedy period curve was best
fitted with a logistic (inverse s-shaped decreasing) curve; the logistic curve is as follows:
Where Y is the % of season-long weed-free yield, x the length of weed interference
period, a the yield asymptote and b, c, m are constants.
As the six trials were conducted under different agroclimatic conditions and cane varieties in
different years, growing degree days (GDD) were used to express the duration (x axis in the above
regression models) of weed interference or length of weed-free period after harvesting or planting.
Knezevic et al. (2002) recommended the use of GDD accumulated from crop emergence or planting as
the unit of time to quantify the duration of weed presence and length of weed-free period because it (a)
is a more meaningful measure of time needed for plant growth and development, (b) is a means to
compare data from different locations, years and planting dates, and (c) provides a continuous and
precise scale for the x-axis (Knezevic et al., 2002). A base temperature (Tb) of 16.0 oC was used as the
minimum temperature for sugar cane growth (Inman-Bamber, 1994). GDD was calculated from the
following formula for each day:
GDD = Tmax + Tmin - Tb 2
Y = a + c/(1 + exp(-b*(x - m)))
Y = ae-eb-cx
22
The harvest date of the previous crop was used as the reference point for accumulation of GDD
for the trials in ratoon cane while the planting date was used for Trial V. The logistic equation used to
determine the beginning of the critical period was fitted using the statistical package GenStat
(GenStat, 2005) and the Gompertz equation to determine the end of the critical periods by
CurveExpert 1.3 (CurveExpert, 1995-2001). An arbitrary acceptable yield loss (AYL) of 5% (95% of
weed-free yield) was used to determine the onset and end of the critical periods from the fitted logistic
and fitted Gompertz equations, respectively.
23
2.3 Results and discussion
Weed species and infestation levels
The main weed species present in each trial are listed in Table 2.2. In Trials I, IV and VI some grass
weeds, namely P. paniculatum, P. urvillei and D. horizontalis were recorded as the cane variety grown
(M 3035/66) was harvested late in the season (October/November) when the temperatures were higher
and more conducive for germination of these grasses. Variety M 52/78 (Trials II & V) was harvested
in June/July, a period of the year when broad-leaved weeds such as A. conyzoides and Solanum nigrum
L. were predominant. Although Trial III (Olivia) was also initiated late in the season, only Phyllanthus
spp. and A. conyzoides were common, as the site was at a lower altitude and is less humid than the
other sites.
Table 2.2 Main weed species present at different trial sites
Trial I
(Astroea)
Trial II
(Union Park)
Trial III
(Olivia)
Trial IV
(Belle Rive)
Trial V
(Union Park)
Trial VI
(Belle Rive)
Solanum nigrum
Paspalum urvillei
Paspalum paniculatum
Digitaria horizontalis
Drymaria cordata
Ageratum conyzoides
Kyllinga sp.
S. nigrum
D. cordata
Kyllinga bulbosa
Phyllanthus sp.
A. conyzoides
A. conyzoides
D. horizontalis
P. urvillei
Lactuca indica
A. conyzoides
D. cordata
S. nigrum
A. conyzoides
Conyza canadensis
Bidens pilosa
K. elata
Oxalis corniculata
P. urvillei
Youngia japonica
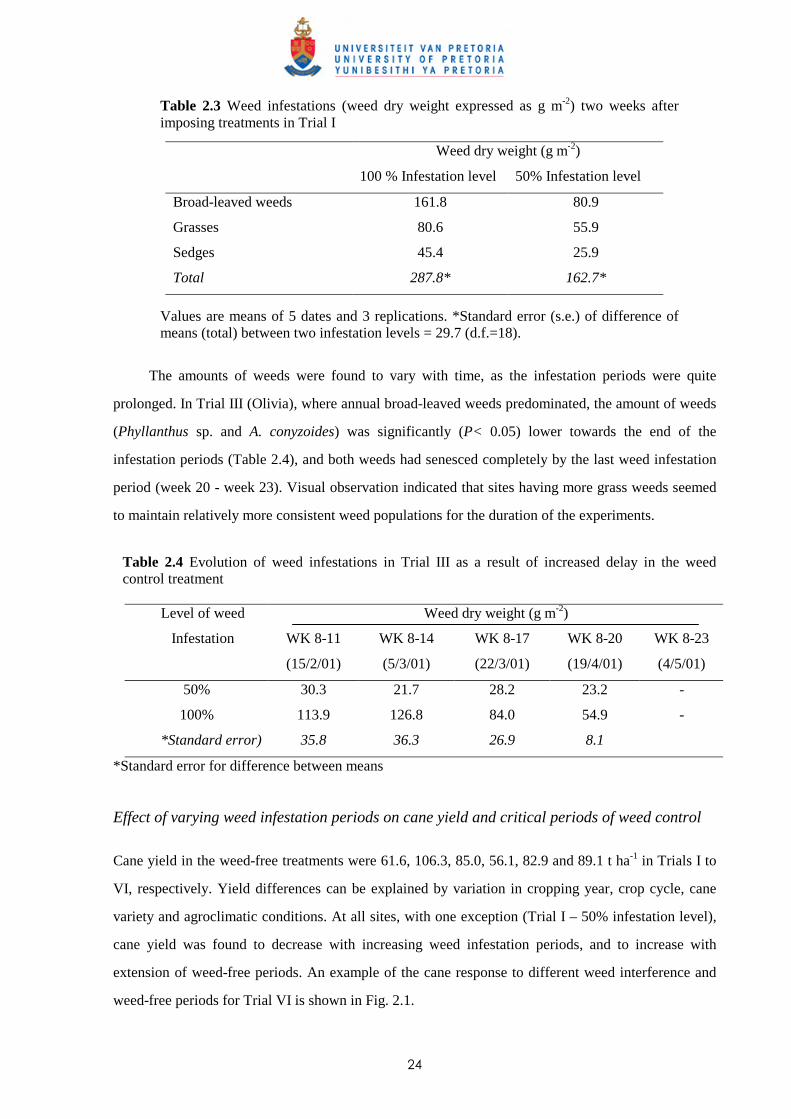
The methodology for creating a reduced weed infestation (approx. 50%) on the critical period of
weed competition was quite satisfactory, e.g. two weeks after imposing the weed infestation
treatments in Trial I at Astroea, the mean amount of weeds recorded in plots with 100% and 50%
infestation were 287.8 g m-2 and 162.7 g m-2, respectively (Table 2.3); the ratio was also maintained
irrespective of the type of weeds, i.e. for broad-leaved weeds, grasses or sedges.
24
Table 2.3 Weed infestations (weed dry weight expressed as g m-2) two weeks after imposing treatments in Trial I
Values are means of 5 dates and 3 replications. *Standard error (s.e.) of difference of means (total) between two infestation levels = 29.7 (d.f.=18).
The amounts of weeds were found to vary with time, as the infestation periods were quite
prolonged. In Trial III (Olivia), where annual broad-leaved weeds predominated, the amount of weeds
(Phyllanthus sp. and A. conyzoides) was significantly (P< 0.05) lower towards the end of the
infestation periods (Table 2.4), and both weeds had senesced completely by the last weed infestation
period (week 20 - week 23). Visual observation indicated that sites having more grass weeds seemed
to maintain relatively more consistent weed populations for the duration of the experiments.
Table 2.4 Evolution of weed infestations in Trial III as a result of increased delay in the weed control treatment
Weed dry weight (g m-2) Level of weed
Infestation
WK 8-11
(15/2/01)
WK 8-14
(5/3/01)
WK 8-17
(22/3/01)
WK 8-20
(19/4/01)
WK 8-23
(4/5/01)
50% 30.3 21.7 28.2 23.2 -
100% 113.9 126.8 84.0 54.9 -
*Standard error) 35.8 36.3 26.9 8.1
*Standard error for difference between means
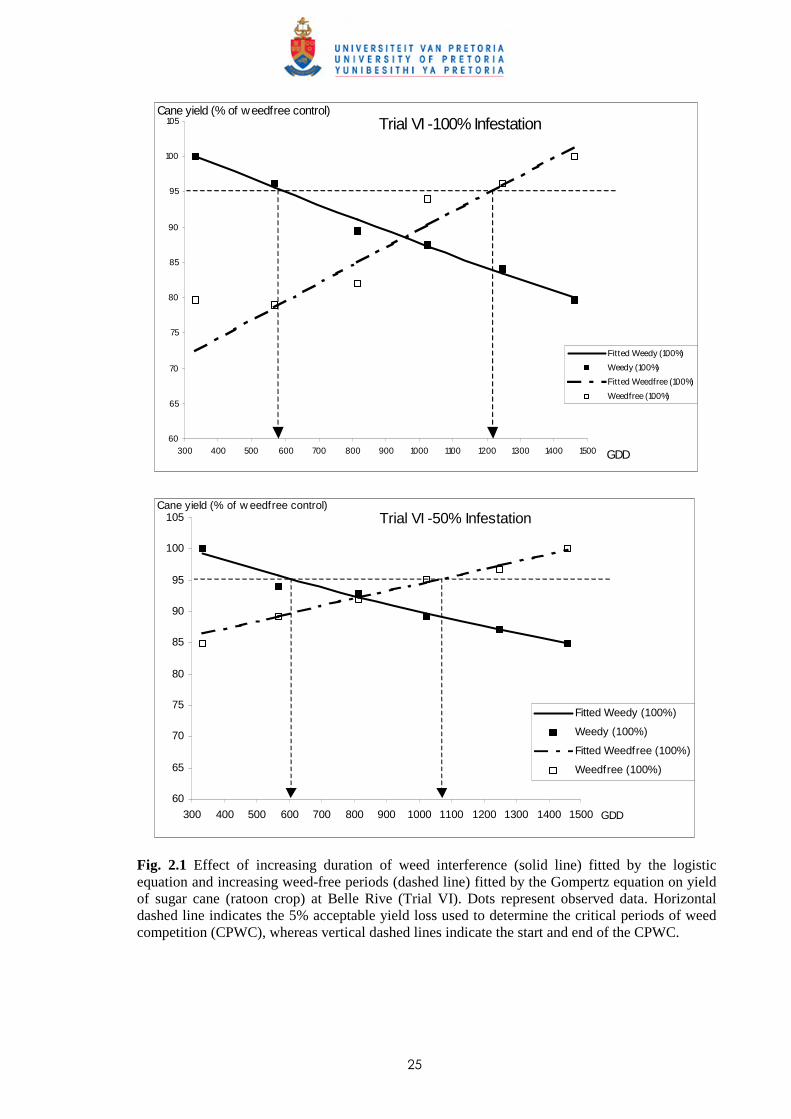
Effect of varying weed infestation periods on cane yield and critical periods of weed control
Cane yield in the weed-free treatments were 61.6, 106.3, 85.0, 56.1, 82.9 and 89.1 t ha-1 in Trials I to
VI, respectively. Yield differences can be explained by variation in cropping year, crop cycle, cane
variety and agroclimatic conditions. At all sites, with one exception (Trial I – 50% infestation level),
cane yield was found to decrease with increasing weed infestation periods, and to increase with
extension of weed-free periods. An example of the cane response to different weed interference and
weed-free periods for Trial VI is shown in Fig. 2.1.
Weed dry weight (g m-2)
100 % Infestation level 50% Infestation level
Broad-leaved weeds 161.8 80.9
Grasses 80.6 55.9
Sedges 45.4 25.9
Total 287.8* 162.7*
25
60
65
70
75
80
85
90
95
100
105
300 400 500 600 700 800 900 1000 1100 1200 1300 1400 1500
Fitted Weedy (100%)
Weedy (100%)
Fitted Weedfree (100%)
Weedfree (100%)
GDD
Cane yield (% of weedfree control)Trial VI -100% Infestation
60
65
70
75
80
85
90
95
100
105
300 400 500 600 700 800 900 1000 1100 1200 1300 1400 1500
Fitted Weedy (100%)
Weedy (100%)
Fitted Weedfree (100%)
Weedfree (100%)
GDD
Cane yield (% of w eedfree control)Trial VI -50% Infestation
Fig. 2.1 Effect of increasing duration of weed interference (solid line) fitted by the logistic equation and increasing weed-free periods (dashed line) fitted by the Gompertz equation on yield of sugar cane (ratoon crop) at Belle Rive (Trial VI). Dots represent observed data. Horizontal dashed line indicates the 5% acceptable yield loss used to determine the critical periods of weed competition (CPWC), whereas vertical dashed lines indicate the start and end of the CPWC.
26
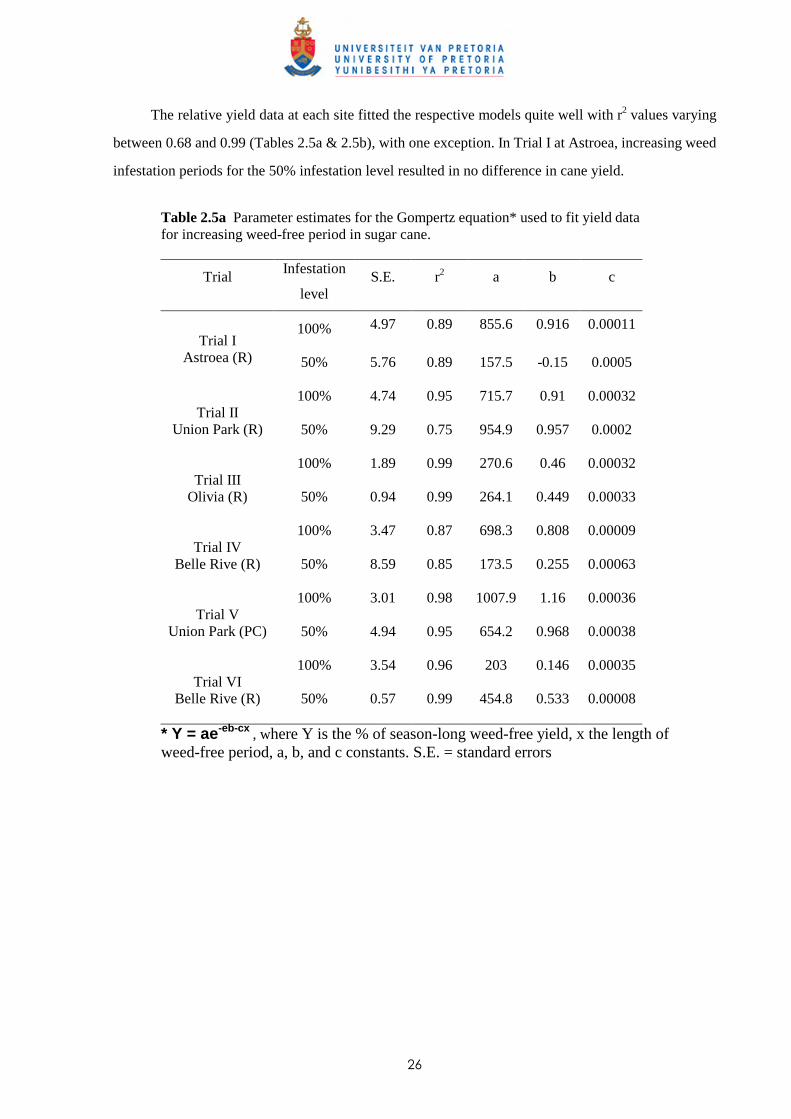
The relative yield data at each site fitted the respective models quite well with r2 values varying
between 0.68 and 0.99 (Tables 2.5a & 2.5b), with one exception. In Trial I at Astroea, increasing weed
infestation periods for the 50% infestation level resulted in no difference in cane yield.
Table 2.5a Parameter estimates for the Gompertz equation* used to fit yield data for increasing weed-free period in sugar cane.
Trial Infestation
level S.E. r2 a b c
100% 4.97 0.89 855.6 0.916 0.00011 Trial I
Astroea (R) 50% 5.76 0.89 157.5 -0.15 0.0005
100% 4.74 0.95 715.7 0.91 0.00032 Trial II
Union Park (R) 50% 9.29 0.75 954.9 0.957 0.0002
100% 1.89 0.99 270.6 0.46 0.00032 Trial III
Olivia (R) 50% 0.94 0.99 264.1 0.449 0.00033
100% 3.47 0.87 698.3 0.808 0.00009 Trial IV
Belle Rive (R) 50% 8.59 0.85 173.5 0.255 0.00063
100% 3.01 0.98 1007.9 1.16 0.00036 Trial V
Union Park (PC) 50% 4.94 0.95 654.2 0.968 0.00038
100% 3.54 0.96 203 0.146 0.00035 Trial VI
Belle Rive (R) 50% 0.57 0.99 454.8 0.533 0.00008
* Y = ae-eb-cx , where Y is the % of season-long weed-free yield, x the length of weed-free period, a, b, and c constants. S.E. = standard errors
27
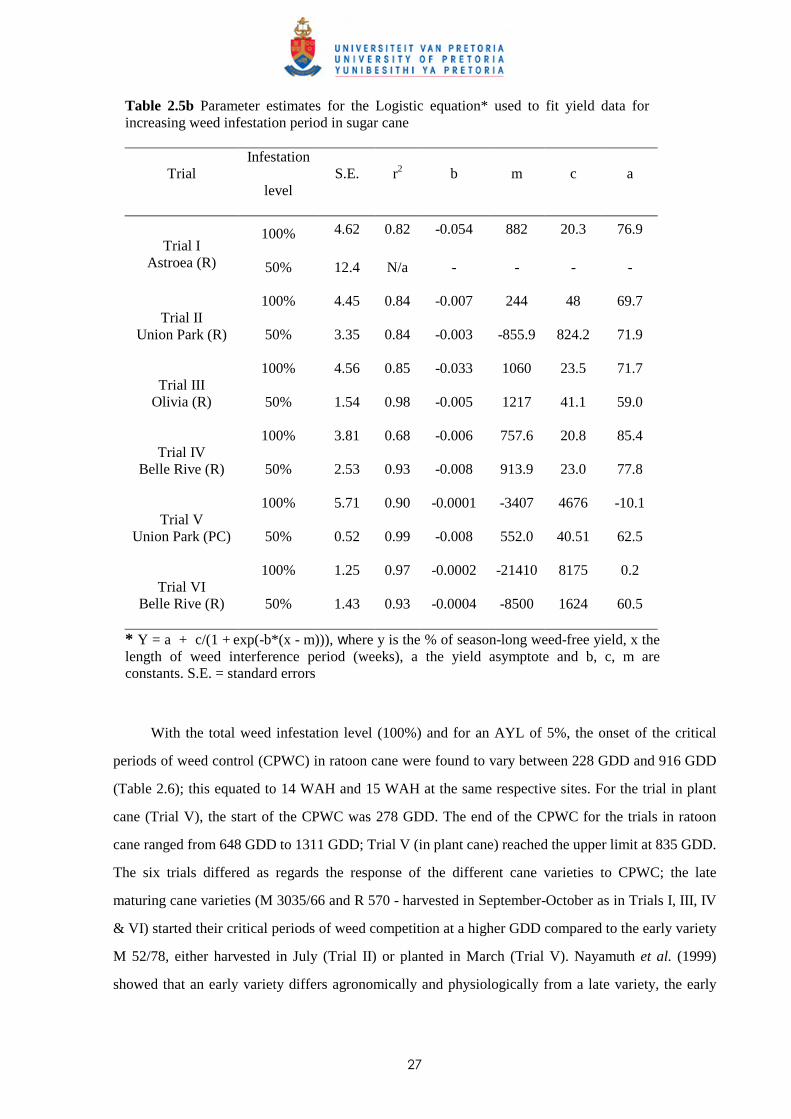
Table 2.5b Parameter estimates for the Logistic equation* used to fit yield data for increasing weed infestation period in sugar cane
Trial Infestation
level S.E. r2 b m c a
100% 4.62 0.82 -0.054 882 20.3 76.9 Trial I
Astroea (R) 50% 12.4 N/a - - - -
100% 4.45 0.84 -0.007 244 48 69.7 Trial II
Union Park (R) 50% 3.35 0.84 -0.003 -855.9 824.2 71.9
100% 4.56 0.85 -0.033 1060 23.5 71.7 Trial III
Olivia (R) 50% 1.54 0.98 -0.005 1217 41.1 59.0
100% 3.81 0.68 -0.006 757.6 20.8 85.4 Trial IV
Belle Rive (R) 50% 2.53 0.93 -0.008 913.9 23.0 77.8
100% 5.71 0.90 -0.0001 -3407 4676 -10.1 Trial V
Union Park (PC) 50% 0.52 0.99 -0.008 552.0 40.51 62.5
100% 1.25 0.97 -0.0002 -21410 8175 0.2 Trial VI
Belle Rive (R) 50% 1.43 0.93 -0.0004 -8500 1624 60.5
* Y = a + c/(1 + exp(-b*(x - m))), where y is the % of season-long weed-free yield, x the length of weed interference period (weeks), a the yield asymptote and b, c, m are constants. S.E. = standard errors
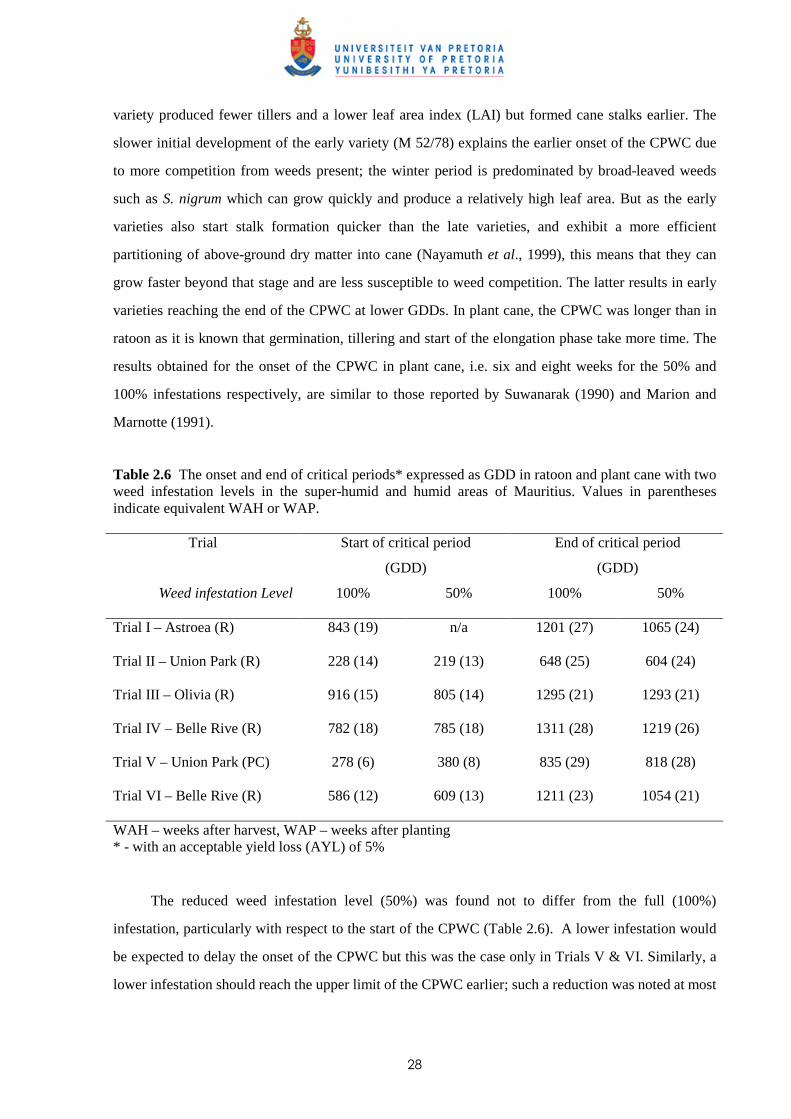
With the total weed infestation level (100%) and for an AYL of 5%, the onset of the critical
periods of weed control (CPWC) in ratoon cane were found to vary between 228 GDD and 916 GDD
(Table 2.6); this equated to 14 WAH and 15 WAH at the same respective sites. For the trial in plant
cane (Trial V), the start of the CPWC was 278 GDD. The end of the CPWC for the trials in ratoon
cane ranged from 648 GDD to 1311 GDD; Trial V (in plant cane) reached the upper limit at 835 GDD.
The six trials differed as regards the response of the different cane varieties to CPWC; the late
maturing cane varieties (M 3035/66 and R 570 - harvested in September-October as in Trials I, III, IV
& VI) started their critical periods of weed competition at a higher GDD compared to the early variety
M 52/78, either harvested in July (Trial II) or planted in March (Trial V). Nayamuth et al. (1999)
showed that an early variety differs agronomically and physiologically from a late variety, the early
28
variety produced fewer tillers and a lower leaf area index (LAI) but formed cane stalks earlier. The
slower initial development of the early variety (M 52/78) explains the earlier onset of the CPWC due
to more competition from weeds present; the winter period is predominated by broad-leaved weeds
such as S. nigrum which can grow quickly and produce a relatively high leaf area. But as the early
varieties also start stalk formation quicker than the late varieties, and exhibit a more efficient
partitioning of above-ground dry matter into cane (Nayamuth et al., 1999), this means that they can
grow faster beyond that stage and are less susceptible to weed competition. The latter results in early
varieties reaching the end of the CPWC at lower GDDs. In plant cane, the CPWC was longer than in
ratoon as it is known that germination, tillering and start of the elongation phase take more time. The
results obtained for the onset of the CPWC in plant cane, i.e. six and eight weeks for the 50% and
100% infestations respectively, are similar to those reported by Suwanarak (1990) and Marion and
Marnotte (1991).
Table 2.6 The onset and end of critical periods* expressed as GDD in ratoon and plant cane with two weed infestation levels in the super-humid and humid areas of Mauritius. Values in parentheses indicate equivalent WAH or WAP.
Trial Start of critical period
(GDD)
End of critical period
(GDD)
Weed infestation Level 100% 50% 100% 50%
Trial I – Astroea (R) 843 (19) n/a 1201 (27) 1065 (24)
Trial II – Union Park (R) 228 (14) 219 (13) 648 (25) 604 (24)
Trial III – Olivia (R) 916 (15) 805 (14) 1295 (21) 1293 (21)
Trial IV – Belle Rive (R) 782 (18) 785 (18) 1311 (28) 1219 (26)
Trial V – Union Park (PC) 278 (6) 380 (8) 835 (29) 818 (28)
Trial VI – Belle Rive (R) 586 (12) 609 (13) 1211 (23) 1054 (21)
WAH – weeks after harvest, WAP – weeks after planting * - with an acceptable yield loss (AYL) of 5%
The reduced weed infestation level (50%) was found not to differ from the full (100%)
infestation, particularly with respect to the start of the CPWC (Table 2.6). A lower infestation would
be expected to delay the onset of the CPWC but this was the case only in Trials V & VI. Similarly, a
lower infestation should reach the upper limit of the CPWC earlier; such a reduction was noted at most
29
of the sites. The lack of difference between the two infestations with respect to the onset of the CPWC
may be explained partly by the fact that weed interference in sugar cane must persist for several weeks
before any significant reduction in growth or yield is observed and cane stalks have reached a
minimum mean dewlap height of 35 to 40 cm (unpublished data by authors); the start of the CPWC
being nearer to the start of the weed infestation period was possibly not showing the relative adverse
effect of weed competition. Furthermore, the methodology used for simulating the reduced infestation
level may not have been completely efficient, particularly during the early phase of competition. The
four sub-quadrats used for creating the 50% infestation by keeping two of them weed-free were 1 m
long and were arranged in a 2 x 2 with the centre of the cane row running in their centre. Weeds
growing adjacent to the weed-free sub-quadrats may have had an effect on the latter due to the
relatively short distance (1 m) between the sub-quadrats; this would have been more pronounced if
some of the weed species were also exhibiting root competition. The start of the CPWC for the 100%
and 50% infestation levels at Olivia may also have been influenced by the senescence of the weeds;
the 100% infestation recorded a more severe reduction in amount of weeds (Table 2.4). As the weed
infestations following the longer ‘increasing weed-free’ treatments were imposed when the cane stalks
had reached more than 35-40 cm height, this may explain the differences observed with respect to the
end of the CPWC between the two infestation levels tested.
Weed management based on critical periods
The above results show that the classical weed control approach, i.e. applying herbicide treatments
immediately after planting, or after the previous harvest in ratoon cane, is not justified and the first
herbicide treatment may be delayed according to the cane variety grown and the temperatures (GDD)
expected during the growing phase. Rochecouste (1967) reported that weeds adversely affect young
cane and thus applying a herbicide treatment pre-emergence of cane and weeds was important. This
was mainly due to the early post-em treatments available in those days (e.g. diuron + 2,4-D amine salt
or ioxynil + 2,4-D ester) not being totally selective to young cane shoots and their spectrum of control
was limited. This approach of applying a treatment pre-emergence of cane has remained as a standard
practice and had been the focus of research in the late 1980’s with the screening of treatments
exhibiting longer residual activity. For example, the tank-mix oxyfluorfen + diuron was recommended
in 1989 as it provided residual activity of 14 to 16 weeks after planting (Mc Intyre & Barbe, 1995).
The outcome of this study has been used to develop new weed management strategies for sugar
cane in Mauritius; one of them has been to control the weeds during the CPWC and to avoid applying
30
herbicides throughout the growing period till complete canopy closure. The latter approach would
succeed only if herbicide treatments are able to knock down all weeds present prior to the onset of the
critical periods and can provide a fairly long residual activity until the end of critical periods are
reached. In 2005, a new herbicide containing trifloxysulfuron and ametryn (one product) tank-mixed
with amicarbazone at 1.5 + 1.075 kg a.i. ha-1, has been recommended for such purpose, as it was found
to be well tolerated by young cane shoots (from four to six weeks after planting or harvest) and
provided a wide spectrum of control when applied both pre- and post-emergence of weeds (Seeruttun
et al., 2007, see also Chapter 7). This new treatment permits the delay of the first application nearer to
the onset of the CPWC and with its residual activity varying between 14 and 16 weeks, one herbicide
application may be sufficient to reach the end of the CPWC. In worst cases, two applications may be
enough to reach the 26th to 28th week after harvest or planting. In any case, this approach will lower
herbicide treatments by at least one application per season. Many growers are already adopting this
strategy to manage their weed infestations in order to reduce costs of production. 2.4 Conclusion
In ratoon cane, the CPWC vary between 225 GDD and 1300 GDD under the worst cane growing
conditions. The CPWC is influenced mostly by agroclimatic conditions, time of harvesting (GDD) and
the cane variety grown. The level of weed infestation seems to have more influence on the end of the
critical period than the start. Results from the trial established in plant cane showed that a longer
period of control is required; the critical period starting earlier (6 WAP) and ending later (29 WAP).
Results confirm that the traditional weed control method of applying a pre- and post-emergence
herbicide treatment immediately after harvesting the crop in Mauritius is not justified. A more
effective weed management strategy would be to delay the first treatment until the beginning of the
critical period. This approach will enable effective weed control in ratoon cane with only one pre/post-
emergence treatment per season in many areas of Mauritius.
31
CHAPTER 3
WEED COMPETITION IN SUGAR CANE: THE RELATIVE COMPETITIVENESS
OF DIFFERENT WEED SPECIES
3.1 Introduction
Weed competition and management
Worldwide, 10% loss of agricultural production can be attributed to the competitive effect of weeds, in
spite of intensive control measures in most agricultural systems (Zimdahl, 1980). According to Van
Heemst (1985), without weed control, yield losses may range between 10% and 100%, depending on
the competitive ability of the crop. Therefore, weed control or management is one of the key elements
of most crop systems. The use of herbicides since the early 1950s has been one of the main factors
enabling intensification of agriculture in developed countries (Kropff & Lotz, 1992b; Kropff &
Walter, 2000).However, increasing herbicide resistance in weeds, the necessity to reduce costs of
inputs, widespread concern about environmental side effects of herbicides, and, more recently,
development of ‘organic’ farming, have resulted in the development of strategies for integrated weed
management based on the use of alternative methods of weed control and rationalization of herbicide
use. In Mauritius, the extremely high costs of weed control with herbicides and environmental
concerns have necessitated and motivated the development of new weed management strategies. This
approach involves changing from a system trying to eradicate all weeds from a sugar cane field, from
planting or harvesting until complete canopy closure, to one based on minimising the effects of weeds
only during the so-called critical period. This approach has been questioned by cane growers as trials
have demonstrated that critical periods of weed competition from weed infestations in sugar cane in
Mauritius only started 12 WAH and ended at 26 WAH under normal growth conditions in ratoon cane,
whilst control measures may need to be maintained up to 29 weeks after planting in order to keep yield
losses below 5% in plant cane (see Chapter 2). These weed-free periods are much shorter than the
prolonged weed-free approach of growers in the past.
Development of weed management strategies based on critical periods of competition requires
insight on crop-weed interactions within that period and into the dynamics of the weed populations, as
the onset and end of those periods will be influenced by the rate of cane and weed growth, weed
species, density of weed infestations, etc. Furthermore, as critical periods are theoretically based on
32
the length of a weed-free period during the critical period, the effect of a few weeds, left in the field
because of the treatment applied prior to start of the critical period not being 100% efficient, needs to
be known. Similarly, the impact of a few weeds emerging within the critical periods would require a
decision to control or not based on their impact on cane growth and the costs of the treatment. The
application of weed control thresholds in weed management decisions may also contribute to less
herbicide use. The success of weed management programmes, which are directed towards minimizing
herbicide use, largely depends upon the ability to predict the effects of weeds on crop yield (Kropff &
Spitters, 1991). Weeds emerge in numerous flushes and the number of species present at any time in a
sugar cane field may vary from 10 to more than 25; therefore, the relative competitiveness of each
individual weed is important for predicting their impact on cane growth and yield.
Weed competition models
Many empirical models or regression equations have been developed to describe the responses of crop
yield to one or more parameters with which weed infestation can be characterized; the models and
their derivations have been reported by Kropff and Spitters (1991) and Kropff and van Laar (1993).
The most important parameters in the models are weed density (Spitters, 1983; Cousens, 1985) and
relative time of emergence of the weeds with respect to the crop (Hakansson, 1983; Cousens et al.,
1987). Cousens (1985) introduced a hyperbolic yield loss - weed density equation which involves an
additional parameter (compared to that of Spitters, 1983) that permits a maximum yield loss of less
than 100% (m):
YL = a Nw / (1 + a Nw/m) (Eqn 1)
Where YL is the relative yield loss (%), Nw the weed density (plants m-2), ‘a’ is the parameter that
describes the effect of adding the first weed, and ‘m’ is the maximum relative yield loss.
Although this equation for the relationship fitted closely the experimental data and Cousens
(1985) demonstrated the superiority of this equation over others by statistical means, the value of the
parameter ‘a’may vary greatly over years and locations, primarily as a result of differences in the
period between crop and weed emergence and differences in growing conditions (Cousens et al., 1987;
Kropff, 1988). In practice, weeds of the same species differ in size because weeds often emerge in
flushes. This was addressed by an additional variable introduced in the hyperbolic yield loss - weed
density equation to account for the effect of differences in the period between crop and weed
33
emergence (Hakansson, 1983; Cousens, 1987). Mathematically, Cousens (1987) formulated a
regression model as follows:
YL = x Nw (Eqn 2)
Exp(y ● Tcw) + (x/z) Nw
In which YL is the relative yield loss, Nw is the weed density (plants m-2), Tcw is the period between
crop and weed emergence (days), x, y and z are non-linear regression coefficients. One problem of this
approach was identified as the great need for data, because the effect of weed density has to be studied
at a range of dates of weed emergence. Secondly, every flush of weeds has a different competitive
ability and weed densities of different flushes have to be distinguished. Therefore, an alternative
approach was needed to predict yield loss by weeds in weed management systems.
An alternative approach was suggested by Spitters and Aerts (1983) and Kropff (1988) after
they showed that the competitive strength of a species is strongly determined by its share in leaf area
at the moment when the canopy closes and interplant competition starts. Based on these findings, a
new simple descriptive regression model for early prediction of crop losses by weed competition was
developed by Kropff & Spitters (1991) as follows:
YL = q Lw (Eqn 3)
1 + (q-1) Lw
where YL is the yield loss, Lw is the relative leaf area of a weed species (weed leaf area / crop + weed
leaf area) , and q the ‘relative damage coefficient’. Parameter q is a measure of the competitiveness of
the weed species with respect to the crop and is thus species specific. The relative damage coefficient
q approaches unity and a linear relation (the diagonal 1:1 line; Fig 3.1) is obtained when the crop is
grown at such a density that monoculture yield reaches its maximum value and the crop and weeds
have identical physiological and morphological characteristics. When the weed is a stronger
competitor than the crop, the relative damage coefficient ‘q’ will be larger than one and a convex
curve is found above the diagonal. When the crop is a stronger competitor, q will be smaller than one
and a concave curve is found under the diagonal line. The theoretical relations for different values of
the relative damage coefficient q are shown in Fig 3.1. (copied from Kropff and Spitters, 1991).
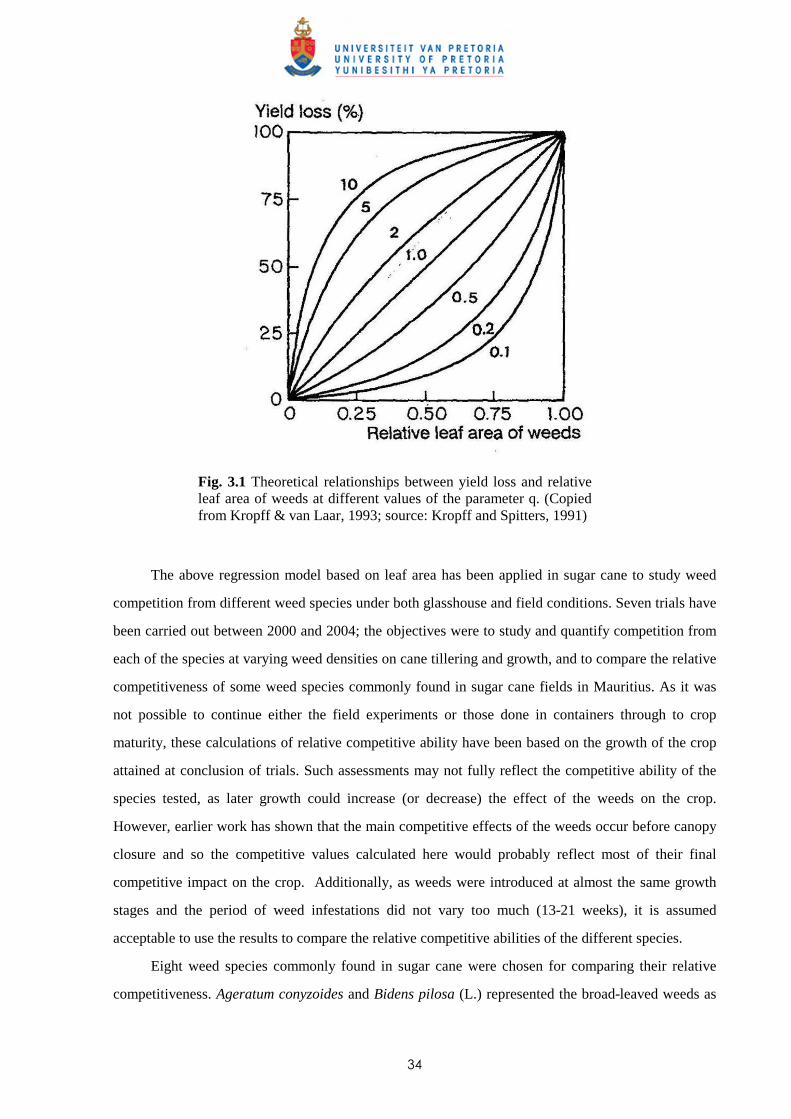
34
Fig. 3.1 Theoretical relationships between yield loss and relative leaf area of weeds at different values of the parameter q. (Copied from Kropff & van Laar, 1993; source: Kropff and Spitters, 1991)
The above regression model based on leaf area has been applied in sugar cane to study weed
competition from different weed species under both glasshouse and field conditions. Seven trials have
been carried out between 2000 and 2004; the objectives were to study and quantify competition from
each of the species at varying weed densities on cane tillering and growth, and to compare the relative
competitiveness of some weed species commonly found in sugar cane fields in Mauritius. As it was
not possible to continue either the field experiments or those done in containers through to crop
maturity, these calculations of relative competitive ability have been based on the growth of the crop
attained at conclusion of trials. Such assessments may not fully reflect the competitive ability of the
species tested, as later growth could increase (or decrease) the effect of the weeds on the crop.
However, earlier work has shown that the main competitive effects of the weeds occur before canopy
closure and so the competitive values calculated here would probably reflect most of their final
competitive impact on the crop. Additionally, as weeds were introduced at almost the same growth
stages and the period of weed infestations did not vary too much (13-21 weeks), it is assumed
acceptable to use the results to compare the relative competitive abilities of the different species.
Eight weed species commonly found in sugar cane were chosen for comparing their relative
competitiveness. Ageratum conyzoides and Bidens pilosa (L.) represented the broad-leaved weeds as
35
they are found under all agroclimatic zones of Mauritius and grow throughout the year. Digitaria
horizontalis, P. paniculatum, P. urvillei and Setaria barbata (Lam.) Kunth are among the most
important grass weeds found in sugar cane locally and are considered by growers as very important
and relatively difficult to control (see Chapter I; MSIRI, unpublished data). Paspalum commersonii
Lam. and Paspalum conjugatum Berg., though not very widely found, are important weeds in the
humid and super-humid zones and were included mostly for comparisons with the two other
Paspalums.
36
3.2 Materials and methods
This aspect of the study was aimed at exploring the impact of individual weed species on cane growth.
Two approaches were used: a) field trials with specific weeds, b) container experiments with
individual weed species. The former were difficult to manage in practice because of variability in
densities and the uncertain success in establishing/transplanting the weeds. The latter had the
drawback that as large containers were needed to provide appropriate conditions for the cane, only a
limited number of treatments and replicates could be included. The experiments in the trays also had
to be ended before the cane reached full maturity. 3.2.1 Trial I - Weed competition from Ageratum conyzoides under field conditions
Trial site and plant material
A trial was laid down at Belle-Rive (Humic Latosol soil group according to Parish & Feillafé, 1965) to
study weed competition from A. conyzoides on young cane shoots. Cane variety M 3035/66 was
planted at a row spacing of 1.5 m on 10 April 2000 and a reduced rate of diuron at 1.5 kg a.i. ha-1 was
applied with a knapsack sprayer delivering 375 l ha-1 of spray solution at a working pressure of
300 kPa over the whole field one week after planting. Cane germination was homogeneous and a
natural infestation of weeds comprising mainly A. conyzoides emerged from the month of July/August
throughout the field and was left to grow and compete with the cane. Other broad-leaved weeds
namely Emilia sonchifolia (L.) DC., Lobellia cliffortiana Linn., Bothriospermum tenellum (Horneur)
Fish. and Mey, and Youngia japonica (Linn.) D.C., which were emerging among the Ageratum, were
regularly hand-weeded.
Treatments and data collection
Unreplicated treatments with different levels of weed infestation, including weed-free plots, were
identified in the field on 9 September 2000. Nine small plots of 2.0 m long and 1.5 m wide were
marked and established at a distance of 0.75 m from the centre of the cane rows to each side of the
plot. The weed infestation treatments consisted of two weed-free plots and seven others with varying
densities of A. conyzoides.
The weeds were uprooted from each plot, roots removed and the above-ground plant material
weighed (fresh weight); a sub-sample was then brought (in sealed plastic bags) to the laboratory for
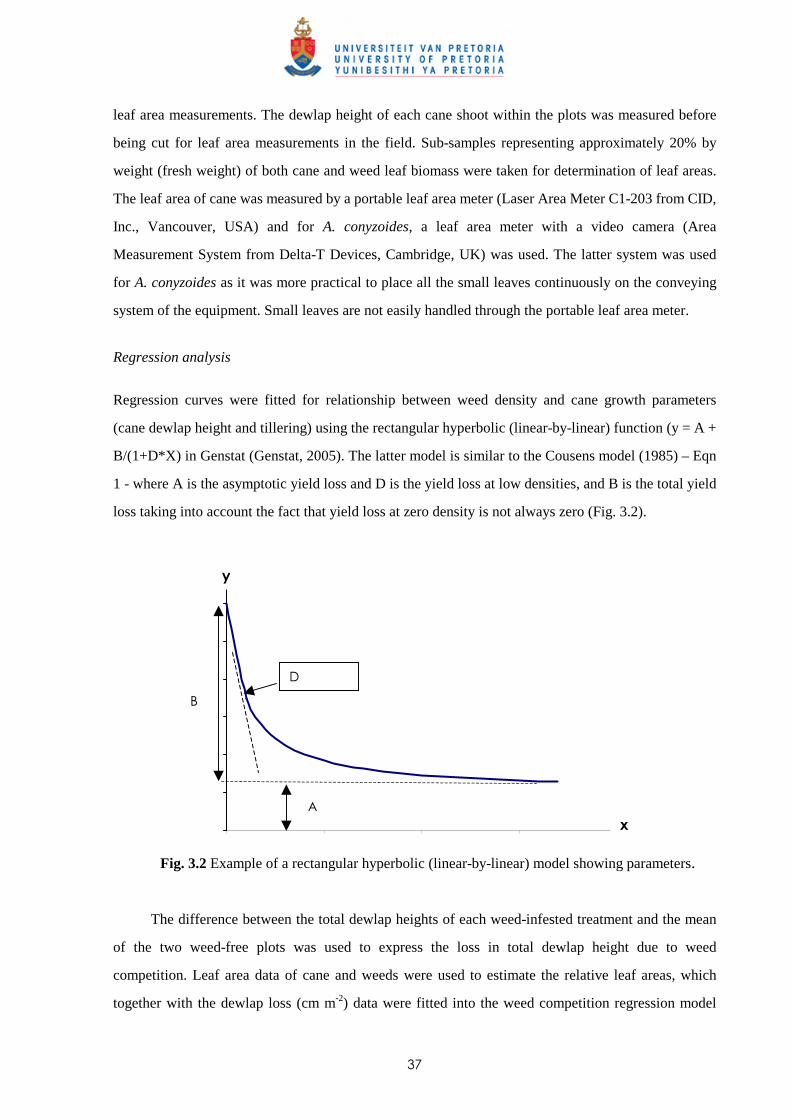
37
leaf area measurements. The dewlap height of each cane shoot within the plots was measured before
being cut for leaf area measurements in the field. Sub-samples representing approximately 20% by
weight (fresh weight) of both cane and weed leaf biomass were taken for determination of leaf areas.
The leaf area of cane was measured by a portable leaf area meter (Laser Area Meter C1-203 from CID,
Inc., Vancouver, USA) and for A. conyzoides, a leaf area meter with a video camera (Area
Measurement System from Delta-T Devices, Cambridge, UK) was used. The latter system was used
for A. conyzoides as it was more practical to place all the small leaves continuously on the conveying
system of the equipment. Small leaves are not easily handled through the portable leaf area meter.
Regression analysis
Regression curves were fitted for relationship between weed density and cane growth parameters
(cane dewlap height and tillering) using the rectangular hyperbolic (linear-by-linear) function (y = A +
B/(1+D*X) in Genstat (Genstat, 2005). The latter model is similar to the Cousens model (1985) – Eqn
1 - where A is the asymptotic yield loss and D is the yield loss at low densities, and B is the total yield
loss taking into account the fact that yield loss at zero density is not always zero (Fig. 3.2).
Fig. 3.2 Example of a rectangular hyperbolic (linear-by-linear) model showing parameters.
The difference between the total dewlap heights of each weed-infested treatment and the mean
of the two weed-free plots was used to express the loss in total dewlap height due to weed
competition. Leaf area data of cane and weeds were used to estimate the relative leaf areas, which
together with the dewlap loss (cm m-2) data were fitted into the weed competition regression model
x
y
A
B
D
38
(Eqn 3) developed by Kropff and Spitters (1991) using Genstat (Genstat, 2005) to estimate a relative
damage coefficient (‘q’ value) for A. conyzoides.
3.2.2 Trial II - Competition from Bidens pilosa, Digitaria horizontalis and Paspalum urvillei on
sugar cane grown in trays
Plant material
A glasshouse trial was established to study competition of B. pilosa, D. horizontalis and P. urvillei on
young sugar cane shoots. Conditions inside the glasshouse were similar to those outside as all
openings (wire mesh to prevent insects, etc.) were left opened to maintain almost the same
temperatures. Sugar cane was planted on 14 April 2001 in trays 1 m x 0.4 m x 0.3 m and filled with
soil (Humic Latosols according to Parish and Feillafé, 1965) collected in fields at Réduit Experiment
station. All trays were irrigated by applying manually the same amount of water to keep the soil humid
and avoid any water stress on the crop. No extra fertilizer was added as soil analysis had shown a
sufficient amount of NPK was present.
Ten two-budded cane setts of variety R 570 were planted in each tray, in double rows in the
centre of the tray. Eight weed densities (7 + 1 weed-free control) were established for each weed.
Seeds of B. pilosa were sown directly in the trays on 10 May 2001 at increasing densities and some
thinning was carried out after germination. For D. horizontalis and P. urvillei, young plants were
uprooted from abandoned fields and leaves were pruned to reduce transpiration at transplanting. The
two grasses were transplanted on 15 May 2001 at densities of 13, 23, 30, 35, 45, 55 and 68
plants m-2.
Cane measurement and data collection
Cane measurements (no of shoots/tray and dewlap height of individual shoots) were carried out on 8
June 2001 (3 weeks after transplanting – WAT), 22 June 2001 (5 WAT), 6 July 2001 (7 WAT), 23
July 2001 (10 WAT) and 22 August 2001 (14 WAT). All trays (cane shoots and weeds) were
harvested on 7 September 2001 for leaf area and dry weight measurements. The leaf areas of cane and
P. urvillei weeds were measured with the CID portable leaf area meter whereas for B. pilosa, the
Delta-T leaf area meter with a video camera was used (see Trial I for details). Sub-samples of the plant
material were subsequently dried at 105 oC for 48 hours before being weighed. The estimation of the
relative leaf area of D. horizontalis was not possible as the small leaves had started to senesce and
39
their small size prevented use of the portable leaf area meter; the relative dry weights were instead
calculated (weed dry weight / (weed dry weight + crop dry weight).
Statistical design and regression analysis
Due to the limited space in the greenhouse, the treatments were not replicated; all treatments with
same weed species were blocked together. Leaf area data and the total dewlap height loss (loss relative
to total dewlap height (cm m-2) of weed-free treatment) were fitted to the regression analysis or weed
competition model (Eqn 3) developed by Kropff and Spitters (1991) using Genstat (Genstat, 2005) for
estimating q values for the respective weed species.
3.2.3 Trial III - Weed competition from Paspalum paniculatum and Paspalum urvillei on sugar
cane under field conditions
Plant material
A field experiment was initiated in October 2001 at Réduit, L soil group (Parish & Feillafé, 1965), to
study competition on sugar cane from P. paniculatum and P. urvillei. Sugar cane, variety R 570, was
planted on 7 September 2001 using three-eyed cuttings obtained from a plant cane field on the station
at a row spacing of 1.5 m. Young plants of the two weeds were collected from abandoned fields in the
Belle-Rive regions and were transplanted after pruning of the upper part of the leaves to reduce
transpiration. Weed control in the plots was achieved by applying a selective treatment consisting of
atrazine at 2.0 kg a.i. ha-1 after transplanting of weeds and by regular manual weeding of emerged
weeds (mostly grasses). Other agronomic practices were the same as in commercial sugar cane crops.
Treatments and experimental layout
Paspalum urvillei and P. paniculatum were both transplanted at densities of 6.7, 10, 15, 20 and 33.3
plants m-2 on 13 October 2001 (5 weeks after planting cane). A weed-free plot was also included. Each
plot consisted of three cane rows of 1.4 m long with a row spacing of 1.6 m. The statistical design was
a split-plot; main plots consisted of the two weeds, sub-plots were six weed densities. Each treatment
was replicated three times.
40
Data collection and regression analysis
A first cane measurement was made on 19 December 2001 (9 WAT). Cane stalk number and height,
together with leaf area measurements of cane and weeds with the portable leaf area meter were made
during the first week of February 2002 (16 WAP). Sub-samples were dried at 105oC for 48 hours
before being weighed again.
The relative leaf area was calculated from the cane and weed leaf area data, and the effect of
competition on cane as total dewlap height loss (loss relative to total dewlap height (cm m-2) of the
weedfree treatment). Regression curves were fitted for relationships between weed density and cane
growth parameters (cane dewlap height and tillering) using the rectangular hyperbolic (linear-by-
linear) function (y = A + B/(1+D*X) in Genstat (Genstat, 2005) (see Trial I).
The relative leaf area and dewlap loss data were subjected to non-linear regression analysis after
weed competition model (Eqn 3) developed by Kropff and Spitters (1991) using Genstat (Genstat,
2005) to estimate q values for the two weed species.
3.2.4 Trial IV - Competition from Bidens pilosa on sugar cane grown in trays (glasshouse)
Plant material
A trial to study competition of B. pilosa on young sugar cane shoots was established in the glasshouse
in April 2002. The conditions inside the glasshouse, irrigation regime and fertilization were similar to
those described for Trial II. Ten one-eyed cuttings of cane variety R 570 were planted in double rows
in the centre of a fibreglass tray on 18 April 2002. The size of each tray was 1.0 m x 0.4 m x 0.3 m and
it was filled with soil (Humic Latosols according to Parish and Feillafé, 1965) collected in fields at
Réduit Experiment station. Seeds of B. pilosa were sown on the same date sugar cane was planted, and
were allowed to germinate in trays before being transplanted on 25 May 2002 (5 weeks after planting
cane).
Treatments and experimental design
A completely randomized block design with three replicates was used; each block had eight trays
consisting of six weed densities, namely 10, 20, 40, 60, 80 and 100 plants m-2 and two weed-free trays.
The weeds were distributed evenly in the trays. Both cane and weed were irrigated regularly to field
capacity and any other weed species emerging was hand-weeded.
41
Cane measurement and data collection
Cane measurements (number of shoots per tray and dewlap height of individual shoots) were taken on
4 June 2002 (2 WAT), 24 June 2002 (4 WAT), 16 July 2002 (8 WAT), 19 August 2002 (12 WAT) and
9 September 2002 (16 WAT). Cane shoots and weeds in all trays were harvested on 9 September 2002
for leaf area and dry weight measurements. The leaf areas of cane were measured by the CID portable
leaf area meter, whereas for B. pilosa, a Delta-T leaf area meter with a video camera was used (see
Trial I for details).
Statistical design and regression analysis
Data collected at each cane measurement date were used to conduct analysis of variance (ANOVA);
the mean dewlap heights and number of shoots were compared to the weed-free treatments. All
statistical analyses were carried out using Genstat (Genstat, 2005).
Regression curves were fitted for relationships between weed density, or the relative leaf area of
the weed, and cane growth parameters (dry weight and cane dewlap height) using the rectangular
hyperbolic (linear-by-linear) function (y = A + B/(1+D*X) in Genstat (Genstat, 2005) (see Trial I).
Leaf area data and the total dewlap height loss (loss relative to total dewlap height (cm m-2) of weed-
free treatment) were fitted into the weed competition model (Eqn 3) developed by Kropff and Spitters
(1991) using Genstat (Genstat, 2005) for estimating q values for the respective weed species.
3.2.5 Trial V - Weed competition from Paspalum paniculatum and Paspalum urvillei on sugar
cane grown under glasshouse conditions
Plant material
A trial was established in the glasshouse where competition from two Paspalum species on sugar cane
was compared. The conditions in the glasshouse, irrigation regime and fertilizer application were
similar to those described for Trial II. Young plants of P. urvillei and P. paniculatum were collected
from abandoned fields in the Belle-Rive region and were transplanted in trays planted with two-eyed
cuttings of cane variety R 570.
42
Treatments and experimental layout
Sugar cane was planted on 19 October 2002; six two-eyed cutting were planted in trays 1.0 m X 0.4 m
X 0.3 m. The weeds were both transplanted on 4 December 2002 at densities of 5, 10, 20, 30, 40 and
50 plants m-2; the upper leaves of the weeds were cut off to reduce transpiration. Weed-free trays were
also included. The statistical design was a split-plot with two replicates; the main plots consisted of the
two weeds and the sub-plots of the eight weed infestation treatments (six weed densities + 2 weed-free
trays per block).
Data collection and regression analysis
Measurements of cane shoots in each tray were made on 30 December 2002 (4 WAT), 23 January
2003 (8 WAT) and on the final day of the experiment, 6 March 2003 (14 WAT). On the final day,
samples were also taken for dry weights and leaf areas of cane and weeds; leaf area was measured
with the portable leaf area meter. The sub-samples were weighed and dried for 48 hours at 105oC
before being weighed again.
Relative leaf area was calculated from the cane and weed leaf area data, and the effect of
competition on cane as total dewlap height loss (loss relative to total dewlap height (cm m-2) of weed-
free treatment). Regression curves were fitted for relationships between weed density, or relative leaf
area, and cane growth parameters (cane dewlap height or loss in dewlap heights) using the rectangular
hyperbolic (linear-by-linear) function (y = A + B/(1+D*X) in Genstat (Genstat, 2005) (see Trial I).
Relative leaf area and dewlap loss data were subjected to non-linear regression analysis
according to weed competition model developed by Kropff and Spitters (1991) and using Genstat
(Genstat, 2005) to estimate q values for the two weed species. 3.2.6 Trial VI - Weed competition from Paspalum commersonii and Paspalum conjugatum on
sugar cane grown under glasshouse conditions
Plant material
A glasshouse trial (under same conditions as described for Trial II) was established at Réduit
experiment station to compare weed competition from two other Paspalum species, namely P.
commersonii and P. conjugatum on sugar cane. Paspalum commersonii is a perennial grass reaching a
height between 30 and 75 cm and characterized with a leaf blade 15 to 30 cm x 1.2-1.5 cm (Mc
43
Intyre, 1991). Paspalum conjugatum is more of a creeping perennial, with long stolons, rooting at the
nodes, and with shorter leaves 5-10 cm x 0.6 to 1.3 cm. Young plants of the two species were
collected from abandoned fields in the Belle-Rive region and were transplanted in trays pre-planted
with two-eyed cuttings of cane variety R 570. The cane setts were obtained from a field on the station
planted 11 months earlier; the cane setts were treated (cold dip) against ‘pineapple’ disease (caused by
Ceratocystis paradoxa) with a solution of benomyl at 0.3 g per litre.
Treatments and experimental layout
Sugar cane was planted on 19 December 2003; six two-eyed cutting were planted in trays, each 1.0 m
X 0.4 m X 0.3 m, placed in the centre of the glasshouse on concrete blocks to have approximately 30
cm space from the floor. The filling material used in the trays consisted of soil (L soil group according
to Parish and Feillafé, 1965) collected from fields on the station. The weeds were both transplanted on
30 January 2004 at densities of 10, 20, 40, 60 and 80 plants m-2; a weed-free treatment was also
included. The statistical design was a split-plot with two replicates; the main plots consisted of the two
weeds and the sub-plots represented six weed densities (five weed densities + 1 weedfree tray per
block). All trays were regularly irrigated to field capacity. Data collection and analysis
Measurements of cane shoots in each tray were made on 21 February 2004 (3 WAT), 25 March 2004
(8 WAT) and 4 May 2004 (13 WAT). The experiment was stopped on 13 May 2005 when all cane
shoots and weeds were harvested for dewlap height and number of shoots, dry weight and leaf area
measurements. Leaf area of cane and weed was measured with the portable leaf area meter.
The effect of competition on cane as total dewlap height loss and regression curves were fitted
for relationships between weed density, or relative leaf area of weed, and cane growth parameters
(cane dewlap height) as described for Trial III. Similarly, q values for the weed species were estimated
as described for the previous trials.
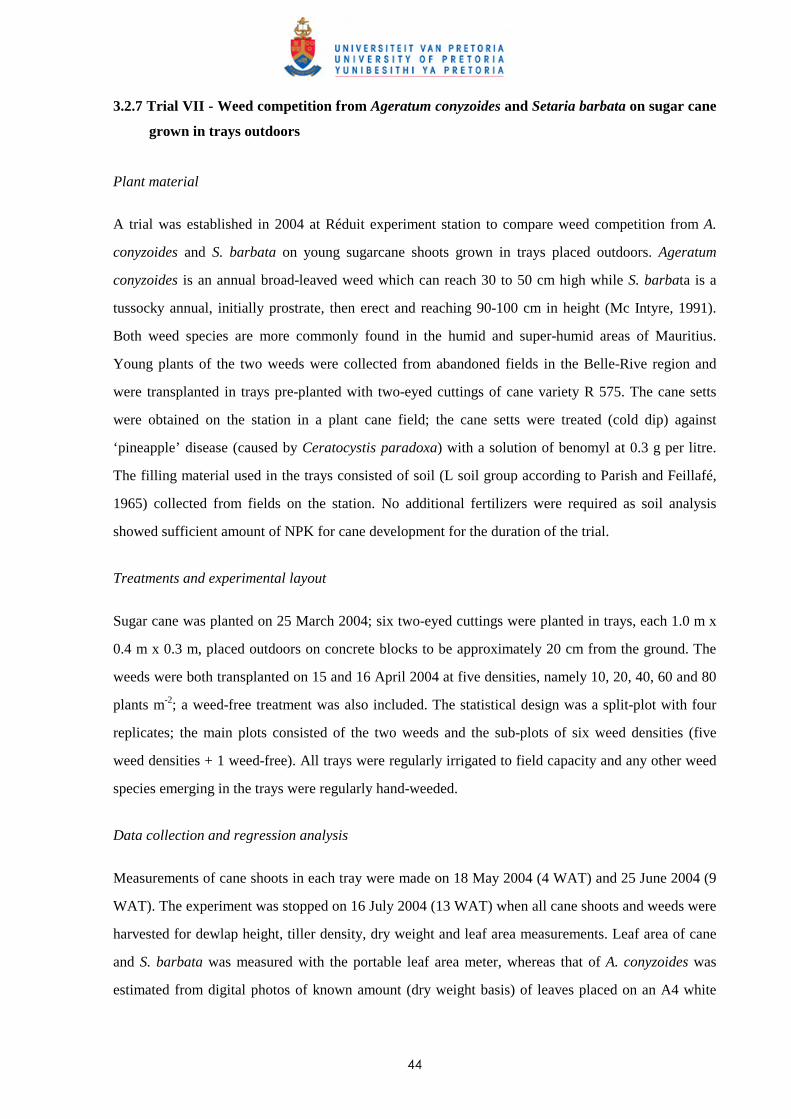
44
3.2.7 Trial VII - Weed competition from Ageratum conyzoides and Setaria barbata on sugar cane
grown in trays outdoors
Plant material
A trial was established in 2004 at Réduit experiment station to compare weed competition from A.
conyzoides and S. barbata on young sugarcane shoots grown in trays placed outdoors. Ageratum
conyzoides is an annual broad-leaved weed which can reach 30 to 50 cm high while S. barbata is a
tussocky annual, initially prostrate, then erect and reaching 90-100 cm in height (Mc Intyre, 1991).
Both weed species are more commonly found in the humid and super-humid areas of Mauritius.
Young plants of the two weeds were collected from abandoned fields in the Belle-Rive region and
were transplanted in trays pre-planted with two-eyed cuttings of cane variety R 575. The cane setts
were obtained on the station in a plant cane field; the cane setts were treated (cold dip) against
‘pineapple’ disease (caused by Ceratocystis paradoxa) with a solution of benomyl at 0.3 g per litre.
The filling material used in the trays consisted of soil (L soil group according to Parish and Feillafé,
1965) collected from fields on the station. No additional fertilizers were required as soil analysis
showed sufficient amount of NPK for cane development for the duration of the trial.
Treatments and experimental layout
Sugar cane was planted on 25 March 2004; six two-eyed cuttings were planted in trays, each 1.0 m x
0.4 m x 0.3 m, placed outdoors on concrete blocks to be approximately 20 cm from the ground. The
weeds were both transplanted on 15 and 16 April 2004 at five densities, namely 10, 20, 40, 60 and 80
plants m-2; a weed-free treatment was also included. The statistical design was a split-plot with four
replicates; the main plots consisted of the two weeds and the sub-plots of six weed densities (five
weed densities + 1 weed-free). All trays were regularly irrigated to field capacity and any other weed
species emerging in the trays were regularly hand-weeded.
Data collection and regression analysis
Measurements of cane shoots in each tray were made on 18 May 2004 (4 WAT) and 25 June 2004 (9
WAT). The experiment was stopped on 16 July 2004 (13 WAT) when all cane shoots and weeds were
harvested for dewlap height, tiller density, dry weight and leaf area measurements. Leaf area of cane
and S. barbata was measured with the portable leaf area meter, whereas that of A. conyzoides was
estimated from digital photos of known amount (dry weight basis) of leaves placed on an A4 white

45
paper and the area extrapolated from readings obtained using the AequitasTM Image Analysis software
(http://www.aequitas.co.uk). The digital photos were analysed using the Aequitas® software and the
leaf area was estimated by assessing the green pixels.
The effect of competition on cane as total dewlap height loss (loss relative to total dewlap
height (cm m-2) of weedfree treatment), regression curves showing relationships between weed density
or relative leaf area of the weeds and cane growth parameters (cane dewlap height, leaf area of cane
and weed and loss in dewlap heights), and estimation of q values for the two weed species were
carried out in the same manner as for Trial IV.
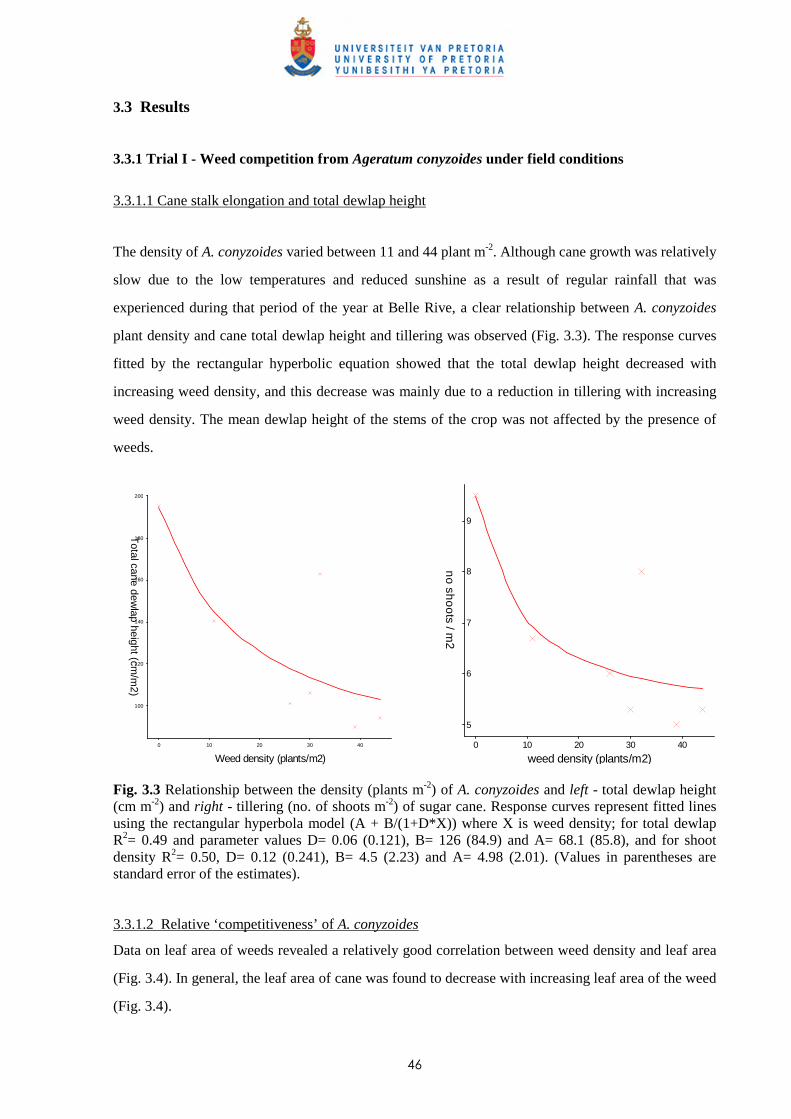
46
3.3 Results
3.3.1 Trial I - Weed competition from Ageratum conyzoides under field conditions
3.3.1.1 Cane stalk elongation and total dewlap height
The density of A. conyzoides varied between 11 and 44 plant m-2. Although cane growth was relatively
slow due to the low temperatures and reduced sunshine as a result of regular rainfall that was
experienced during that period of the year at Belle Rive, a clear relationship between A. conyzoides
plant density and cane total dewlap height and tillering was observed (Fig. 3.3). The response curves
fitted by the rectangular hyperbolic equation showed that the total dewlap height decreased with
increasing weed density, and this decrease was mainly due to a reduction in tillering with increasing
weed density. The mean dewlap height of the stems of the crop was not affected by the presence of
weeds.
Weed density (plants/m2)
120
140
160
180
30
200
10 400
100
20
Total cane dew
lap height (cm/m
2)
weed density (plants/m2)40
5
6
7
30
8
10
9
0 20
no
sho
ots / m
2
Fig. 3.3 Relationship between the density (plants m-2) of A. conyzoides and left - total dewlap height (cm m-2) and right - tillering (no. of shoots m-2) of sugar cane. Response curves represent fitted lines using the rectangular hyperbola model (A + B/(1+D*X)) where X is weed density; for total dewlap R2= 0.49 and parameter values D= 0.06 (0.121), B= 126 (84.9) and A= 68.1 (85.8), and for shoot density R2= 0.50, D= 0.12 (0.241), B= 4.5 (2.23) and A= 4.98 (2.01). (Values in parentheses are standard error of the estimates). 3.3.1.2 Relative ‘competitiveness’ of A. conyzoides
Data on leaf area of weeds revealed a relatively good correlation between weed density and leaf area
(Fig. 3.4). In general, the leaf area of cane was found to decrease with increasing leaf area of the weed
(Fig. 3.4).
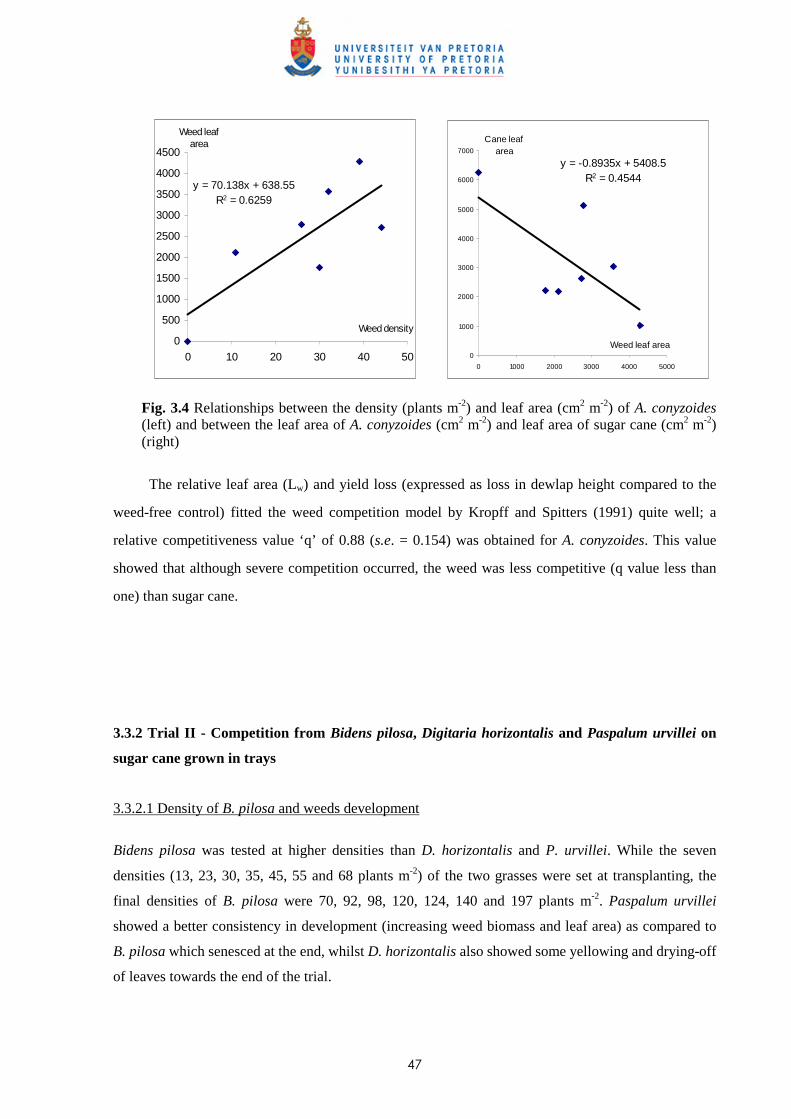
47
y = 70.138x + 638.55R2 = 0.6259
0
500
1000
1500
2000
2500
3000
3500
4000
4500
0 10 20 30 40 50
Weed density
Weed leaf area
y = -0.8935x + 5408.5R2 = 0.4544
0
1000
2000
3000
4000
5000
6000
7000
0 1000 2000 3000 4000 5000
Weed leaf area
Cane leaf area
Fig. 3.4 Relationships between the density (plants m-2) and leaf area (cm2 m-2) of A. conyzoides (left) and between the leaf area of A. conyzoides (cm2 m-2) and leaf area of sugar cane (cm2 m-2) (right)
The relative leaf area (Lw) and yield loss (expressed as loss in dewlap height compared to the
weed-free control) fitted the weed competition model by Kropff and Spitters (1991) quite well; a
relative competitiveness value ‘q’ of 0.88 (s.e. = 0.154) was obtained for A. conyzoides. This value
showed that although severe competition occurred, the weed was less competitive (q value less than
one) than sugar cane. 3.3.2 Trial II - Competition from Bidens pilosa, Digitaria horizontalis and Paspalum urvillei on
sugar cane grown in trays
3.3.2.1 Density of B. pilosa and weeds development
Bidens pilosa was tested at higher densities than D. horizontalis and P. urvillei. While the seven
densities (13, 23, 30, 35, 45, 55 and 68 plants m-2) of the two grasses were set at transplanting, the
final densities of B. pilosa were 70, 92, 98, 120, 124, 140 and 197 plants m-2. Paspalum urvillei
showed a better consistency in development (increasing weed biomass and leaf area) as compared to
B. pilosa which senesced at the end, whilst D. horizontalis also showed some yellowing and drying-off
of leaves towards the end of the trial.
48
3.3.2.2 Effect of weed competition on tillering and cane growth
Cane measurements showed that germination and tillering were relatively slow due to the low
temperatures during that period of the year; the number of shoots did not increase during the
assessment period in the weed-free treatments. Weed competition from B. pilosa seemed to have little
effect on cane tillering except at the four highest densities (Fig. 3.5). There was also a tendency
toward a reduction in the number of cane shoots with increasing density of D. horizontalis.
Paspalum urvillei at the densities tested showed no adverse effect of weed competition on tillering.
0
2
4
6
8
10
12
14
0 50 100 150 200Weed density (plants m
-2)
No. shoots m-2
D horizontalis
P urvillei
B pilosa
Fig. 3.5 Effect of different weed densities of B. pilosa, D. horizontalis and P. urvillei on cane tillering 14 WAT.
The mean dewlap height (cm plant-1) of sugar cane seemed to be less affected by B. pilosa
compared to P. urvillei and D. horizontalis (Fig. 3.6). Some lower weed densities, particularly for B.
pilosa could have caused an etiolating effect of the cane stalks. Paspalum urvillei possibly caused a
slight effect on cane elongation as compared to the other two species. The lower mean dewlap height
for P. urvillei was also linked to the relatively higher number of cane stalks. As the interaction
between the number of shoots and mean height of each stalk may vary with weed species and weed
densities; the use of the total dewlap heights to compare any effect of weed competition on cane
growth appeared to be more appropriate.
The only adverse effect of competition from B. pilosa on the total dewlap height of sugar cane
was observed at the four higher weed densities (120-197 plants m-2) tested, the lower densities showed
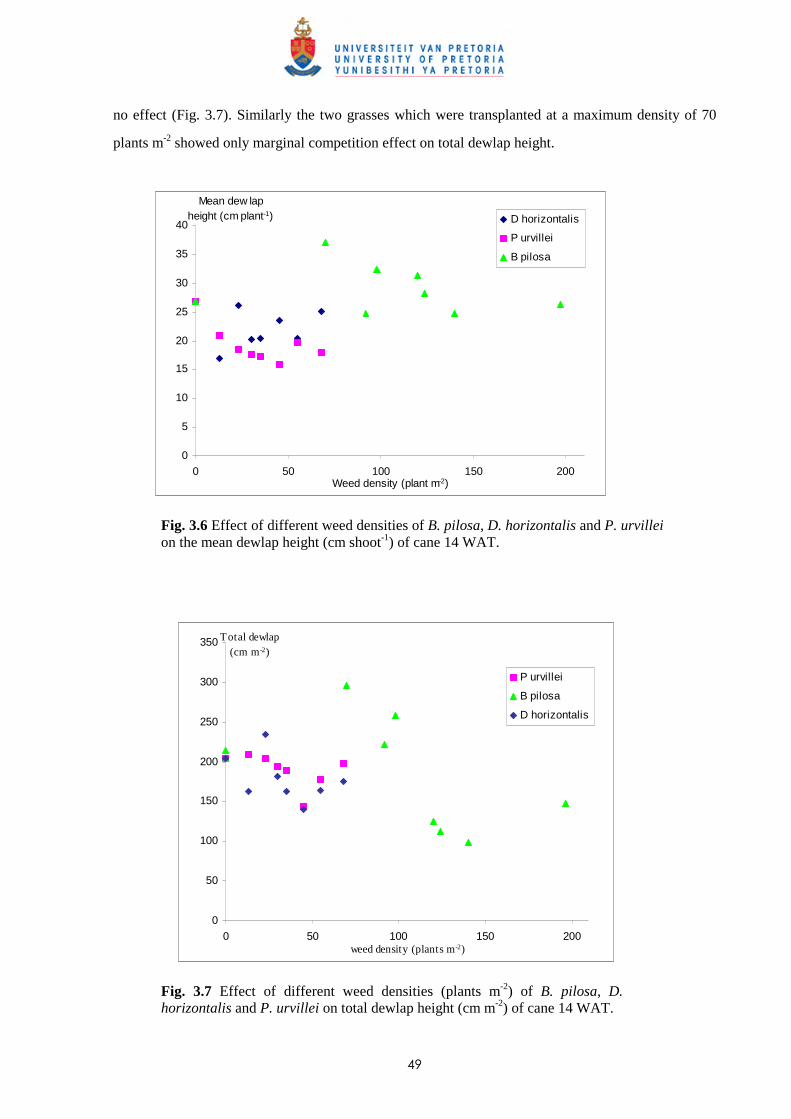
49
no effect (Fig. 3.7). Similarly the two grasses which were transplanted at a maximum density of 70
plants m-2 showed only marginal competition effect on total dewlap height.
0
5
10
15
20
25
30
35
40
0 50 100 150 200Weed density (plant m-2)
Mean dew lap height (cm plant-1) D horizontalis
P urvillei
B pilosa
Fig. 3.6 Effect of different weed densities of B. pilosa, D. horizontalis and P. urvillei on the mean dewlap height (cm shoot-1) of cane 14 WAT.
0
50
100
150
200
250
300
350
0 50 100 150 200weed density (plants m-2)
Total dewlap (cm m-2)
P urvillei
B pilosa
D horizontalis
Fig. 3.7 Effect of different weed densities (plants m-2) of B. pilosa, D. horizontalis and P. urvillei on total dewlap height (cm m-2) of cane 14 WAT.
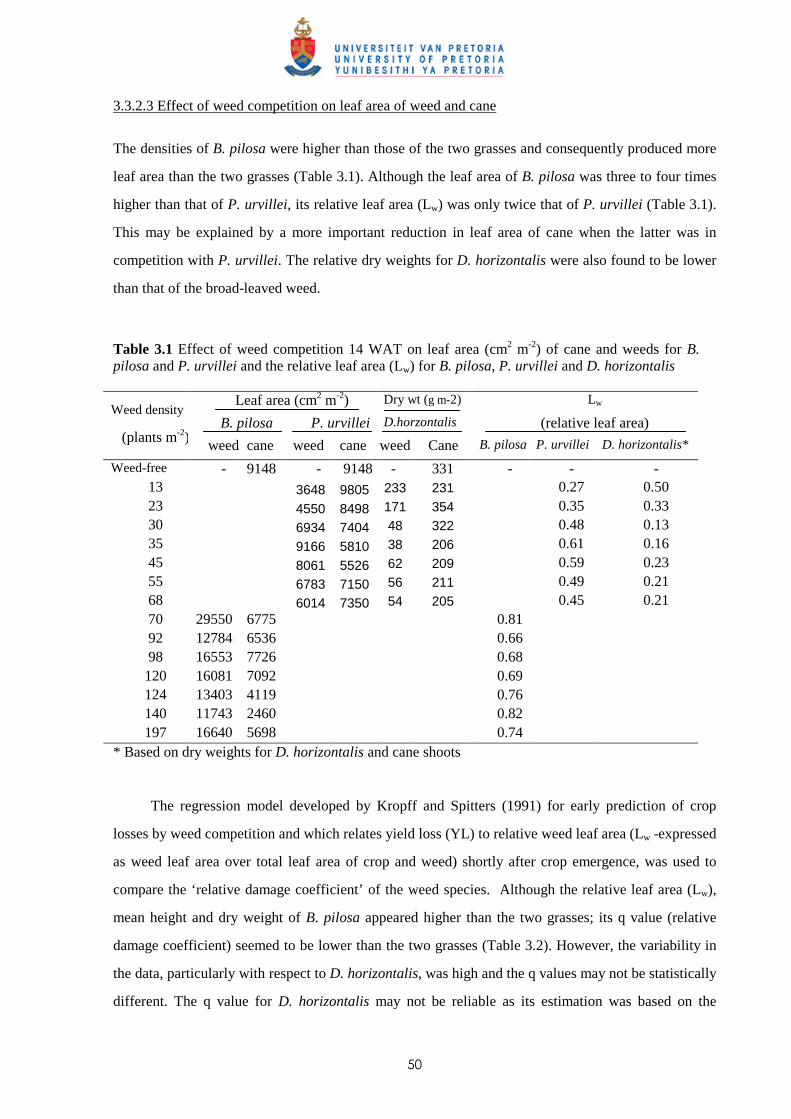
50
3.3.2.3 Effect of weed competition on leaf area of weed and cane
The densities of B. pilosa were higher than those of the two grasses and consequently produced more
leaf area than the two grasses (Table 3.1). Although the leaf area of B. pilosa was three to four times
higher than that of P. urvillei, its relative leaf area (Lw) was only twice that of P. urvillei (Table 3.1).
This may be explained by a more important reduction in leaf area of cane when the latter was in
competition with P. urvillei. The relative dry weights for D. horizontalis were also found to be lower
than that of the broad-leaved weed.
Table 3.1 Effect of weed competition 14 WAT on leaf area (cm2 m-2) of cane and weeds for B. pilosa and P. urvillei and the relative leaf area (Lw) for B. pilosa, P. urvillei and D. horizontalis
Leaf area (cm2 m-2) Dry wt (g m-2) Lw
B. pilosa P. urvillei D.horzontalis (relative leaf area) Weed density
(plants m-2) weed cane weed cane weed Cane B. pilosa P. urvillei D. horizontalis*
Weed-free - 9148 - 9148 - 331 - - - 13 3648 9805 233 231 0.27 0.50 23 4550 8498 171 354 0.35 0.33 30 6934 7404 48 322 0.48 0.13 35 9166 5810 38 206 0.61 0.16 45 8061 5526 62 209 0.59 0.23 55 6783 7150 56 211 0.49 0.21 68 6014 7350 54 205 0.45 0.21 70 29550 6775 0.81 92 12784 6536 0.66 98 16553 7726 0.68 120 16081 7092 0.69 124 13403 4119 0.76 140 11743 2460 0.82 197 16640 5698 0.74
* Based on dry weights for D. horizontalis and cane shoots
The regression model developed by Kropff and Spitters (1991) for early prediction of crop
losses by weed competition and which relates yield loss (YL) to relative weed leaf area (Lw -expressed
as weed leaf area over total leaf area of crop and weed) shortly after crop emergence, was used to
compare the ‘relative damage coefficient’ of the weed species. Although the relative leaf area (Lw),
mean height and dry weight of B. pilosa appeared higher than the two grasses; its q value (relative
damage coefficient) seemed to be lower than the two grasses (Table 3.2). However, the variability in
the data, particularly with respect to D. horizontalis, was high and the q values may not be statistically
different. The q value for D. horizontalis may not be reliable as its estimation was based on the
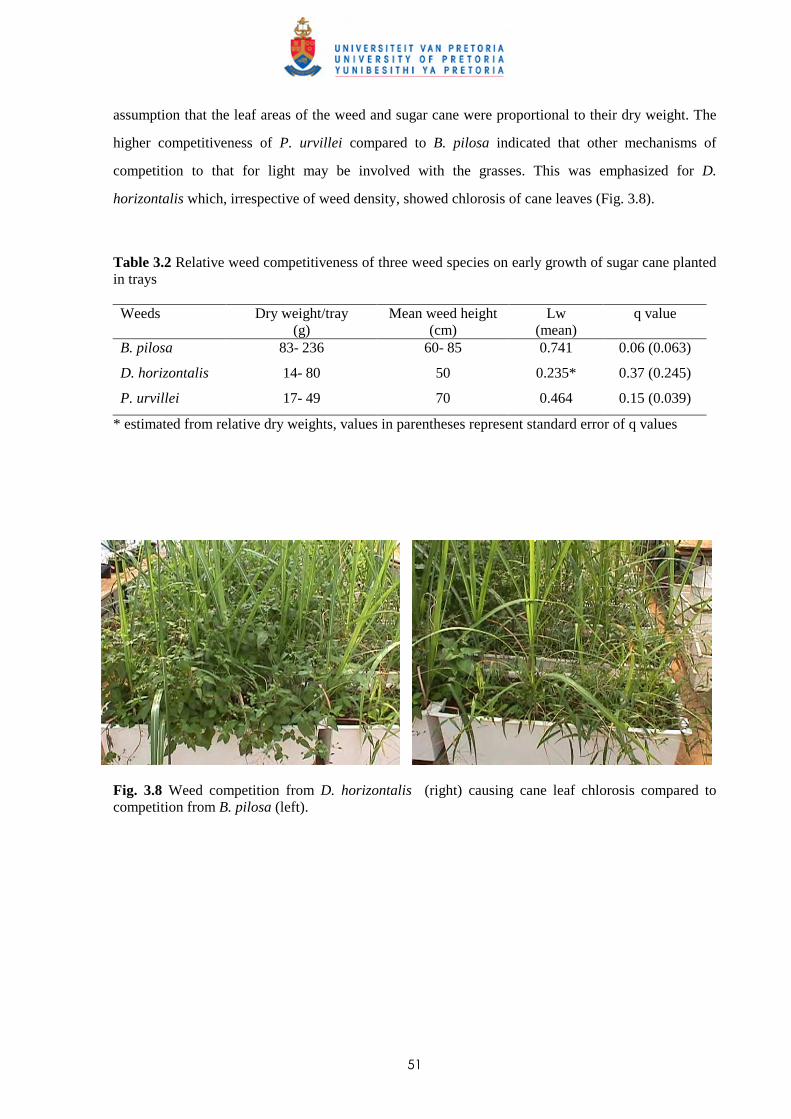
51
assumption that the leaf areas of the weed and sugar cane were proportional to their dry weight. The
higher competitiveness of P. urvillei compared to B. pilosa indicated that other mechanisms of
competition to that for light may be involved with the grasses. This was emphasized for D.
horizontalis which, irrespective of weed density, showed chlorosis of cane leaves (Fig. 3.8).
Table 3.2 Relative weed competitiveness of three weed species on early growth of sugar cane planted in trays Weeds Dry weight/tray
(g) Mean weed height
(cm) Lw
(mean) q value
B. pilosa 83- 236 60- 85 0.741 0.06 (0.063)
D. horizontalis 14- 80 50 0.235* 0.37 (0.245)
P. urvillei 17- 49 70 0.464 0.15 (0.039)
* estimated from relative dry weights, values in parentheses represent standard error of q values
Fig. 3.8 Weed competition from D. horizontalis (right) causing cane leaf chlorosis compared to competition from B. pilosa (left).
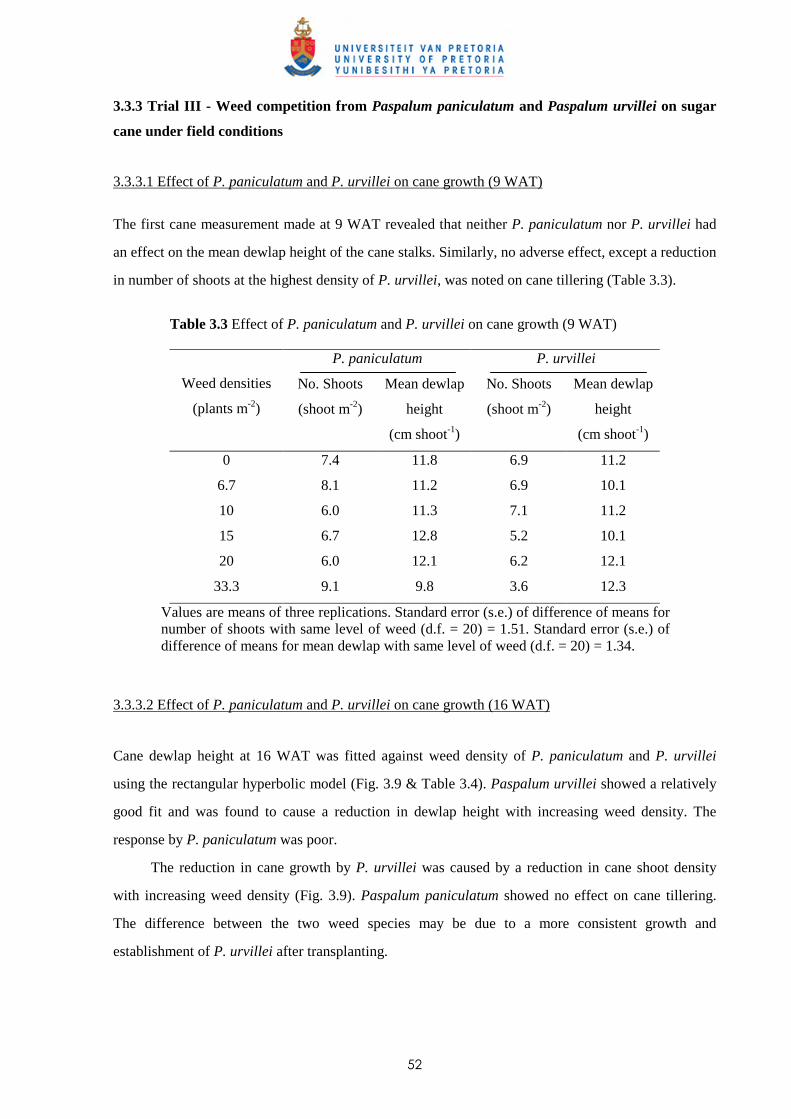
52
3.3.3 Trial III - Weed competition from Paspalum paniculatum and Paspalum urvillei on sugar
cane under field conditions
3.3.3.1 Effect of P. paniculatum and P. urvillei on cane growth (9 WAT)
The first cane measurement made at 9 WAT revealed that neither P. paniculatum nor P. urvillei had
an effect on the mean dewlap height of the cane stalks. Similarly, no adverse effect, except a reduction
in number of shoots at the highest density of P. urvillei, was noted on cane tillering (Table 3.3).
Table 3.3 Effect of P. paniculatum and P. urvillei on cane growth (9 WAT)
P. paniculatum P. urvillei
Weed densities
(plants m-2)
No. Shoots
(shoot m-2)
Mean dewlap
height
(cm shoot-1)
No. Shoots
(shoot m-2)
Mean dewlap
height
(cm shoot-1)
0 7.4 11.8 6.9 11.2
6.7 8.1 11.2 6.9 10.1
10 6.0 11.3 7.1 11.2
15 6.7 12.8 5.2 10.1
20 6.0 12.1 6.2 12.1
33.3 9.1 9.8 3.6 12.3
Values are means of three replications. Standard error (s.e.) of difference of means for number of shoots with same level of weed (d.f. = 20) = 1.51. Standard error (s.e.) of difference of means for mean dewlap with same level of weed (d.f. = 20) = 1.34.
3.3.3.2 Effect of P. paniculatum and P. urvillei on cane growth (16 WAT)
Cane dewlap height at 16 WAT was fitted against weed density of P. paniculatum and P. urvillei
using the rectangular hyperbolic model (Fig. 3.9 & Table 3.4). Paspalum urvillei showed a relatively
good fit and was found to cause a reduction in dewlap height with increasing weed density. The
response by P. paniculatum was poor.
The reduction in cane growth by P. urvillei was caused by a reduction in cane shoot density
with increasing weed density (Fig. 3.9). Paspalum paniculatum showed no effect on cane tillering.
The difference between the two weed species may be due to a more consistent growth and
establishment of P. urvillei after transplanting.
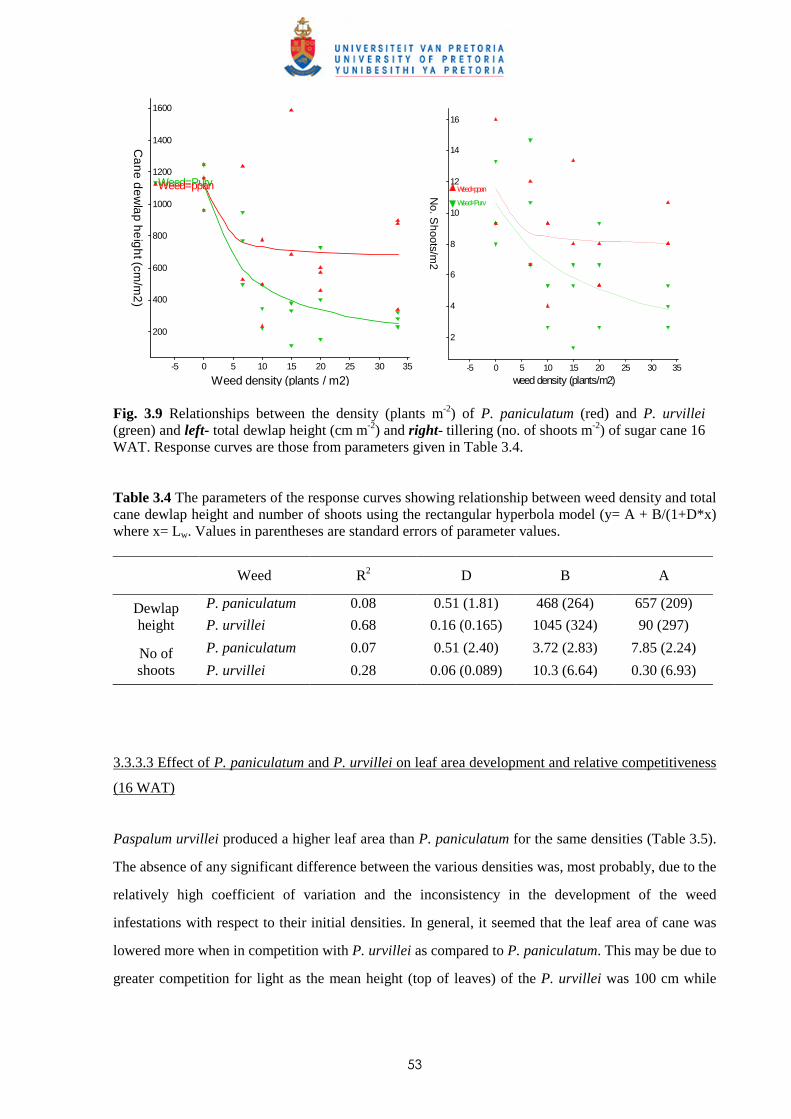
53
Weed=PurvWeed=ppan
Weed density (plants / m2)15
1200
35
1400
10 30
1600
255 20
600
0
400
1000
200
800
-5
Ca
ne
de
wla
p h
eig
ht (cm
/m2
)
Weed=Purv
Weed=ppan
weed density (plants/m2)15
12
35
14
10 30
16
255 20
6
0
4
10
2
8
-5N
o. Shoots/m
2
Fig. 3.9 Relationships between the density (plants m-2) of P. paniculatum (red) and P. urvillei (green) and left- total dewlap height (cm m-2) and right- tillering (no. of shoots m-2) of sugar cane 16 WAT. Response curves are those from parameters given in Table 3.4. Table 3.4 The parameters of the response curves showing relationship between weed density and total cane dewlap height and number of shoots using the rectangular hyperbola model (y= A + B/(1+D*x) where x= Lw. Values in parentheses are standard errors of parameter values.
Weed R2 D B A
P. paniculatum 0.08 0.51 (1.81) 468 (264) 657 (209) Dewlap height P. urvillei 0.68 0.16 (0.165) 1045 (324) 90 (297)
P. paniculatum 0.07 0.51 (2.40) 3.72 (2.83) 7.85 (2.24) No of shoots P. urvillei 0.28 0.06 (0.089) 10.3 (6.64) 0.30 (6.93)
3.3.3.3 Effect of P. paniculatum and P. urvillei on leaf area development and relative competitiveness
(16 WAT)
Paspalum urvillei produced a higher leaf area than P. paniculatum for the same densities (Table 3.5).
The absence of any significant difference between the various densities was, most probably, due to the
relatively high coefficient of variation and the inconsistency in the development of the weed
infestations with respect to their initial densities. In general, it seemed that the leaf area of cane was
lowered more when in competition with P. urvillei as compared to P. paniculatum. This may be due to
greater competition for light as the mean height (top of leaves) of the P. urvillei was 100 cm while
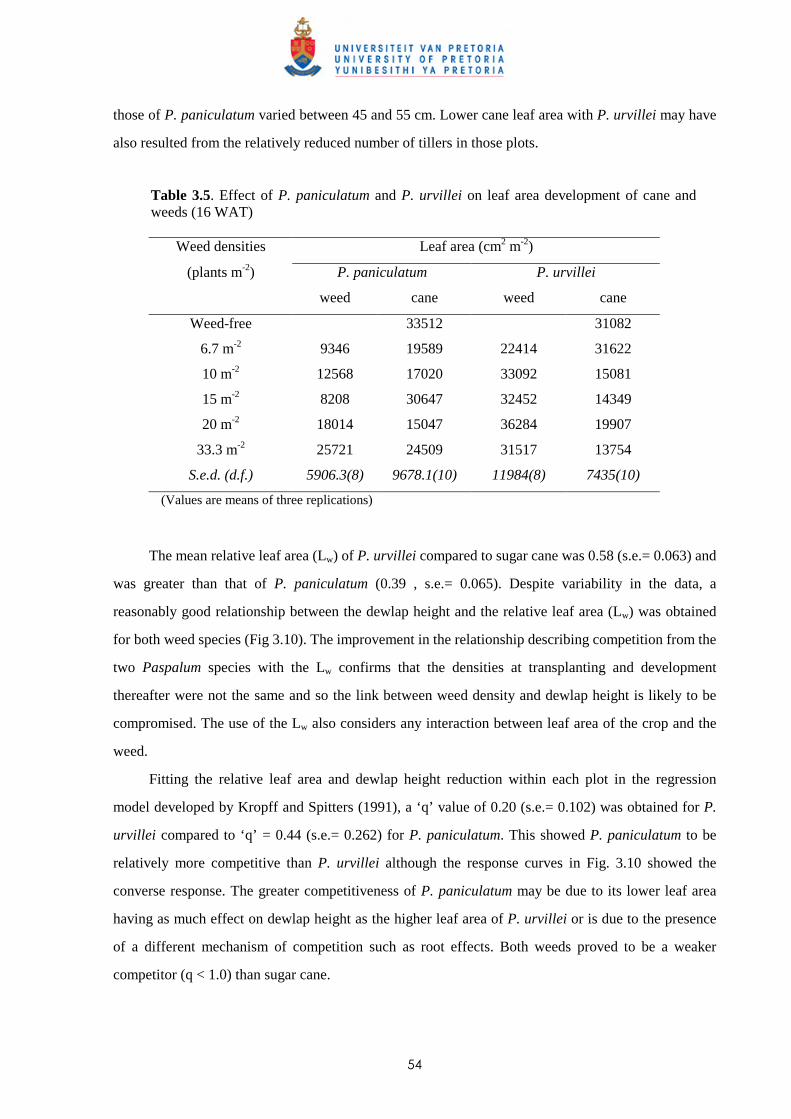
54
those of P. paniculatum varied between 45 and 55 cm. Lower cane leaf area with P. urvillei may have
also resulted from the relatively reduced number of tillers in those plots.
Table 3.5. Effect of P. paniculatum and P. urvillei on leaf area development of cane and weeds (16 WAT)
Weed densities Leaf area (cm2 m-2)
(plants m-2) P. paniculatum P. urvillei
weed cane weed cane
Weed-free 33512 31082
6.7 m-2 9346 19589 22414 31622
10 m-2
15 m-2
12568
8208
17020
30647
33092
32452
15081
14349
20 m-2 18014 15047 36284 19907
33.3 m-2 25721 24509 31517 13754
S.e.d. (d.f.) 5906.3(8) 9678.1(10) 11984(8) 7435(10)
(Values are means of three replications)
The mean relative leaf area (Lw) of P. urvillei compared to sugar cane was 0.58 (s.e.= 0.063) and
was greater than that of P. paniculatum (0.39 , s.e.= 0.065). Despite variability in the data, a
reasonably good relationship between the dewlap height and the relative leaf area (Lw) was obtained
for both weed species (Fig 3.10). The improvement in the relationship describing competition from the
two Paspalum species with the Lw confirms that the densities at transplanting and development
thereafter were not the same and so the link between weed density and dewlap height is likely to be
compromised. The use of the Lw also considers any interaction between leaf area of the crop and the
weed.
Fitting the relative leaf area and dewlap height reduction within each plot in the regression
model developed by Kropff and Spitters (1991), a ‘q’ value of 0.20 (s.e.= 0.102) was obtained for P.
urvillei compared to ‘q’ = 0.44 (s.e.= 0.262) for P. paniculatum. This showed P. paniculatum to be
relatively more competitive than P. urvillei although the response curves in Fig. 3.10 showed the
converse response. The greater competitiveness of P. paniculatum may be due to its lower leaf area
having as much effect on dewlap height as the higher leaf area of P. urvillei or is due to the presence
of a different mechanism of competition such as root effects. Both weeds proved to be a weaker
competitor (q < 1.0) than sugar cane.
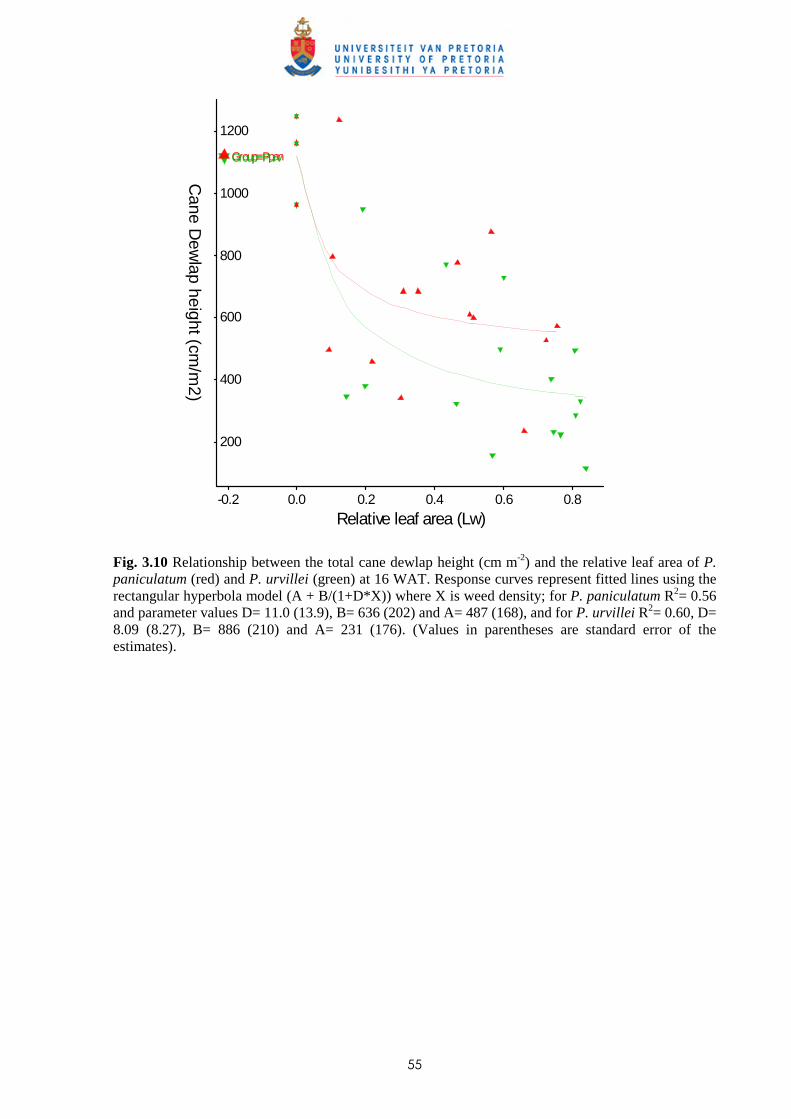
55
Group=PpanGroup=Purv
Relative leaf area (Lw)
600
800
1000
0.2
1200
200
0.0
400
0.80.60.4-0.2
Cane D
ewlap height (cm
/m2)
Fig. 3.10 Relationship between the total cane dewlap height (cm m-2) and the relative leaf area of P. paniculatum (red) and P. urvillei (green) at 16 WAT. Response curves represent fitted lines using the rectangular hyperbola model (A + B/(1+D*X)) where X is weed density; for P. paniculatum R2= 0.56 and parameter values D= 11.0 (13.9), B= 636 (202) and A= 487 (168), and for P. urvillei R2= 0.60, D= 8.09 (8.27), B= 886 (210) and A= 231 (176). (Values in parentheses are standard error of the estimates).
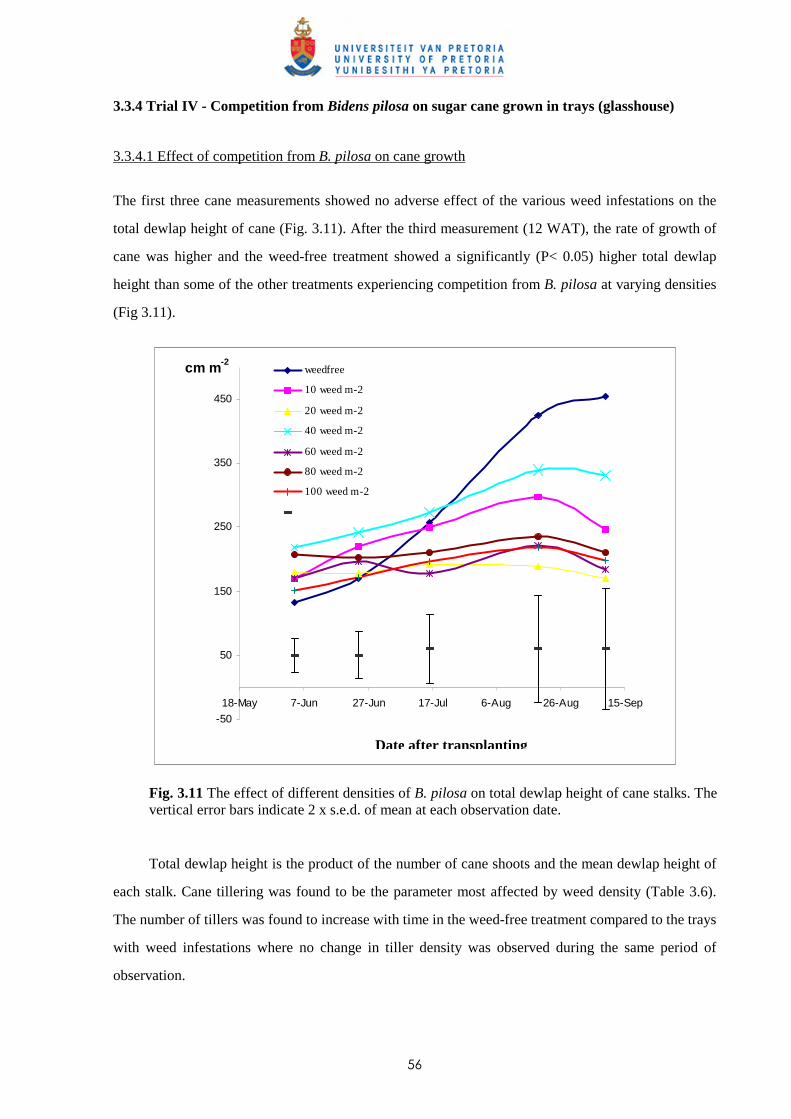
56
3.3.4 Trial IV - Competition from Bidens pilosa on sugar cane grown in trays (glasshouse)
3.3.4.1 Effect of competition from B. pilosa on cane growth
The first three cane measurements showed no adverse effect of the various weed infestations on the
total dewlap height of cane (Fig. 3.11). After the third measurement (12 WAT), the rate of growth of
cane was higher and the weed-free treatment showed a significantly (P< 0.05) higher total dewlap
height than some of the other treatments experiencing competition from B. pilosa at varying densities
(Fig 3.11).
-50
50
150
250
350
450
18-May 7-Jun 27-Jun 17-Jul 6-Aug 26-Aug 15-Sep
WAT
cm m-2 weedfree
10 weed m-2
20 weed m-2
40 weed m-2
60 weed m-2
80 weed m-2
100 weed m-2
Fig. 3.11 The effect of different densities of B. pilosa on total dewlap height of cane stalks. The vertical error bars indicate 2 x s.e.d. of mean at each observation date.
Total dewlap height is the product of the number of cane shoots and the mean dewlap height of
each stalk. Cane tillering was found to be the parameter most affected by weed density (Table 3.6).
The number of tillers was found to increase with time in the weed-free treatment compared to the trays
with weed infestations where no change in tiller density was observed during the same period of
observation.
Date after transplanting
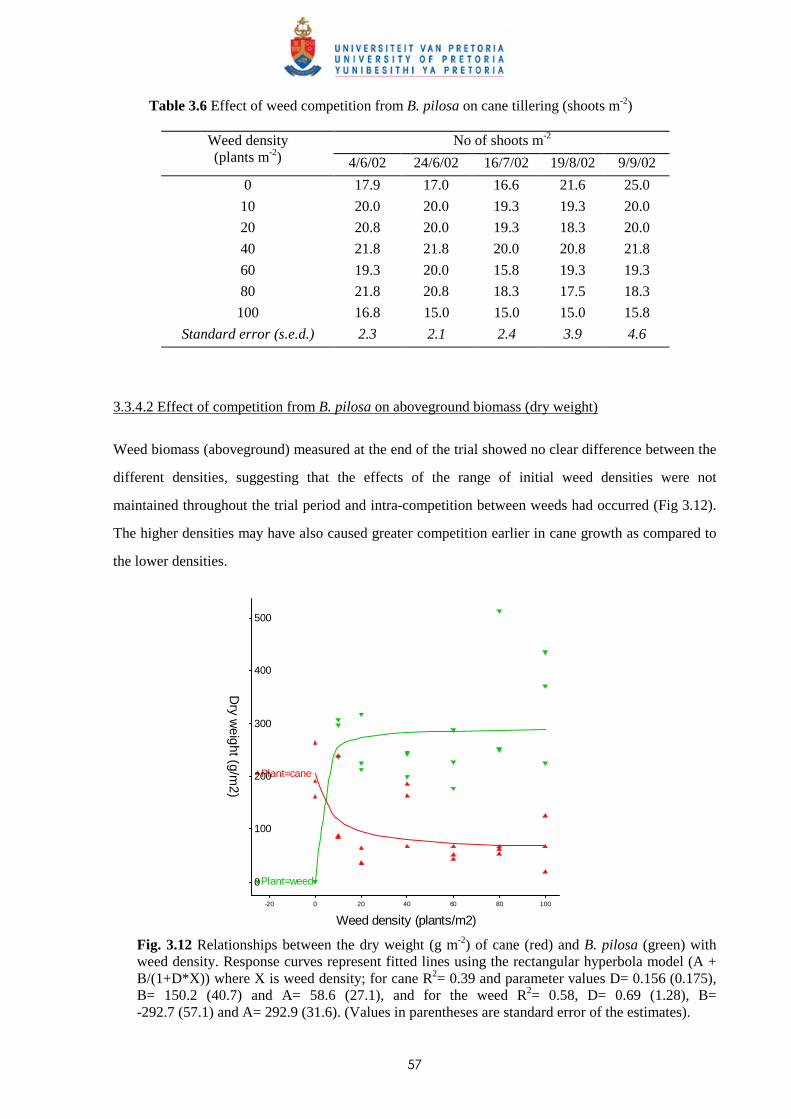
57
Table 3.6 Effect of weed competition from B. pilosa on cane tillering (shoots m-2)
No of shoots m-2 Weed density (plants m-2) 4/6/02 24/6/02 16/7/02 19/8/02 9/9/02
0 17.9 17.0 16.6 21.6 25.0
10 20.0 20.0 19.3 19.3 20.0
20 20.8 20.0 19.3 18.3 20.0
40 21.8 21.8 20.0 20.8 21.8
60 19.3 20.0 15.8 19.3 19.3
80 21.8 20.8 18.3 17.5 18.3
100 16.8 15.0 15.0 15.0 15.8
Standard error (s.e.d.) 2.3 2.1 2.4 3.9 4.6
3.3.4.2 Effect of competition from B. pilosa on aboveground biomass (dry weight)
Weed biomass (aboveground) measured at the end of the trial showed no clear difference between the
different densities, suggesting that the effects of the range of initial weed densities were not
maintained throughout the trial period and intra-competition between weeds had occurred (Fig 3.12).
The higher densities may have also caused greater competition earlier in cane growth as compared to
the lower densities.
Plant=weed
Plant=cane
Weed density (plants/m2)
300
100
200
400
20
500
0
0 100806040-20
Dry w
eight (g/m2)
Fig. 3.12 Relationships between the dry weight (g m-2) of cane (red) and B. pilosa (green) with weed density. Response curves represent fitted lines using the rectangular hyperbola model (A + B/(1+D*X)) where X is weed density; for cane R2= 0.39 and parameter values D= 0.156 (0.175), B= 150.2 (40.7) and A= 58.6 (27.1), and for the weed R2= 0.58, D= 0.69 (1.28), B= -292.7 (57.1) and A= 292.9 (31.6). (Values in parentheses are standard error of the estimates).
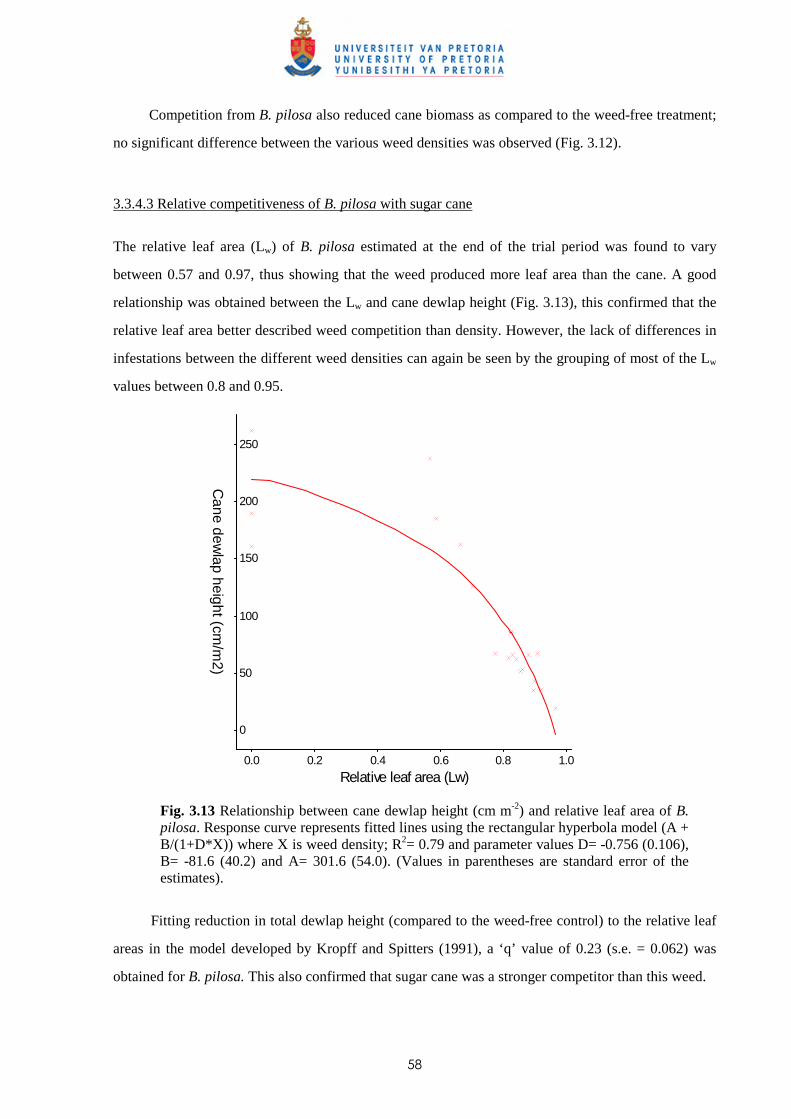
58
Competition from B. pilosa also reduced cane biomass as compared to the weed-free treatment;
no significant difference between the various weed densities was observed (Fig. 3.12).
3.3.4.3 Relative competitiveness of B. pilosa with sugar cane
The relative leaf area (Lw) of B. pilosa estimated at the end of the trial period was found to vary
between 0.57 and 0.97, thus showing that the weed produced more leaf area than the cane. A good
relationship was obtained between the Lw and cane dewlap height (Fig. 3.13), this confirmed that the
relative leaf area better described weed competition than density. However, the lack of differences in
infestations between the different weed densities can again be seen by the grouping of most of the Lw
values between 0.8 and 0.95.
Relative leaf area (Lw)0.0
0
0.4
50
0.8
100
150
200
250
0.6 1.00.2
Cane dew
lap height (cm/m
2)
Fig. 3.13 Relationship between cane dewlap height (cm m-2) and relative leaf area of B. pilosa. Response curve represents fitted lines using the rectangular hyperbola model (A + B/(1+D*X)) where X is weed density; R2= 0.79 and parameter values D= -0.756 (0.106), B= -81.6 (40.2) and A= 301.6 (54.0). (Values in parentheses are standard error of the estimates).
Fitting reduction in total dewlap height (compared to the weed-free control) to the relative leaf
areas in the model developed by Kropff and Spitters (1991), a ‘q’ value of 0.23 (s.e. = 0.062) was
obtained for B. pilosa. This also confirmed that sugar cane was a stronger competitor than this weed.
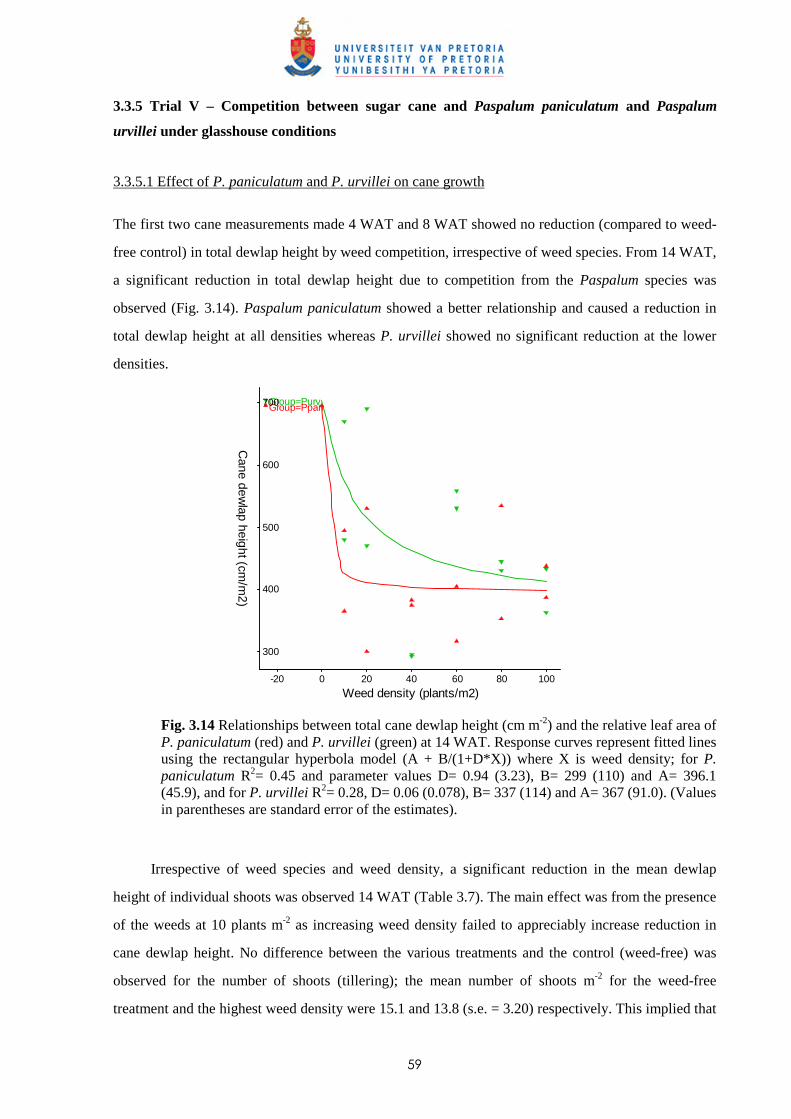
59
3.3.5 Trial V – Competition between sugar cane and Paspalum paniculatum and Paspalum
urvillei under glasshouse conditions
3.3.5.1 Effect of P. paniculatum and P. urvillei on cane growth
The first two cane measurements made 4 WAT and 8 WAT showed no reduction (compared to weed-
free control) in total dewlap height by weed competition, irrespective of weed species. From 14 WAT,
a significant reduction in total dewlap height due to competition from the Paspalum species was
observed (Fig. 3.14). Paspalum paniculatum showed a better relationship and caused a reduction in
total dewlap height at all densities whereas P. urvillei showed no significant reduction at the lower
densities.
Group=PurvGroup=Ppan
Weed density (plants/m2)
400
100
500
20
600
700
0
300
806040-20
Cane dew
lap height (cm/m
2)
Fig. 3.14 Relationships between total cane dewlap height (cm m-2) and the relative leaf area of P. paniculatum (red) and P. urvillei (green) at 14 WAT. Response curves represent fitted lines using the rectangular hyperbola model (A + B/(1+D*X)) where X is weed density; for P. paniculatum R2= 0.45 and parameter values D= 0.94 (3.23), B= 299 (110) and A= 396.1 (45.9), and for P. urvillei R2= 0.28, D= 0.06 (0.078), B= 337 (114) and A= 367 (91.0). (Values in parentheses are standard error of the estimates).
Irrespective of weed species and weed density, a significant reduction in the mean dewlap
height of individual shoots was observed 14 WAT (Table 3.7). The main effect was from the presence
of the weeds at 10 plants m-2 as increasing weed density failed to appreciably increase reduction in
cane dewlap height. No difference between the various treatments and the control (weed-free) was
observed for the number of shoots (tillering); the mean number of shoots m-2 for the weed-free
treatment and the highest weed density were 15.1 and 13.8 (s.e. = 3.20) respectively. This implied that
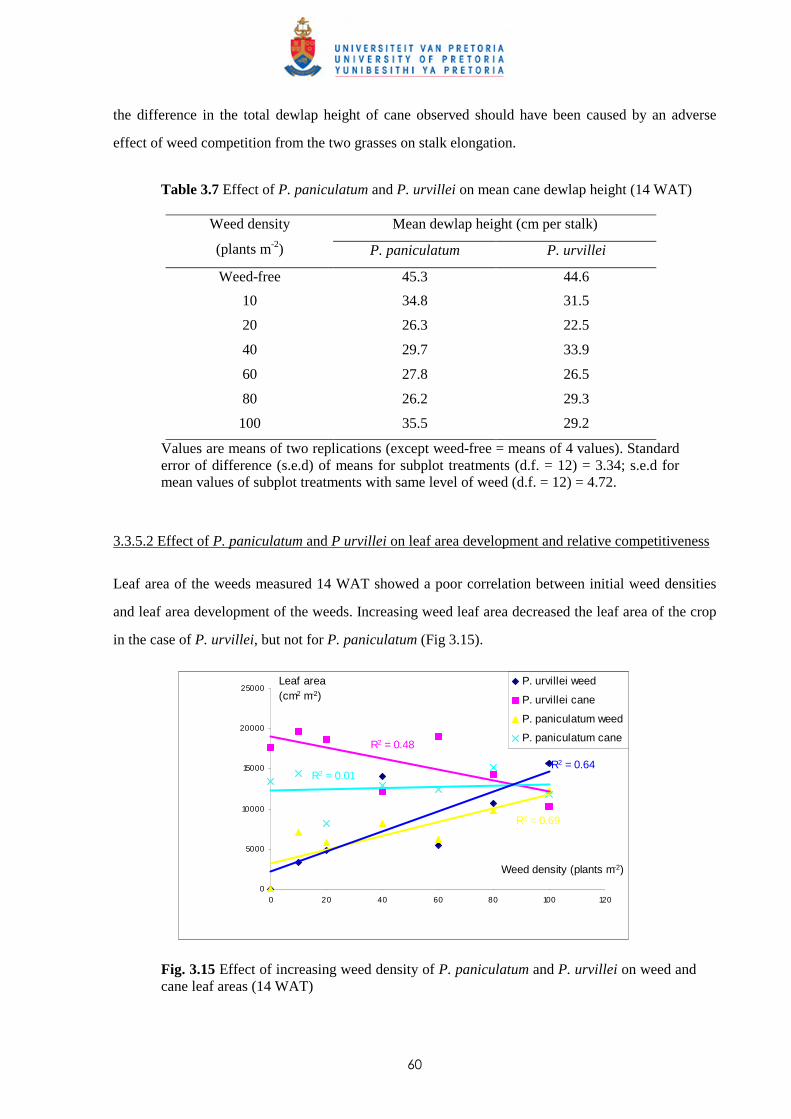
60
the difference in the total dewlap height of cane observed should have been caused by an adverse
effect of weed competition from the two grasses on stalk elongation.
Table 3.7 Effect of P. paniculatum and P. urvillei on mean cane dewlap height (14 WAT)
Mean dewlap height (cm per stalk) Weed density
(plants m-2) P. paniculatum P. urvillei
Weed-free 45.3 44.6
10 34.8 31.5
20 26.3 22.5
40 29.7 33.9
60 27.8 26.5
80 26.2 29.3
100 35.5 29.2
Values are means of two replications (except weed-free = means of 4 values). Standard error of difference (s.e.d) of means for subplot treatments (d.f. = 12) = 3.34; s.e.d for mean values of subplot treatments with same level of weed (d.f. = 12) = 4.72.
3.3.5.2 Effect of P. paniculatum and P urvillei on leaf area development and relative competitiveness
Leaf area of the weeds measured 14 WAT showed a poor correlation between initial weed densities
and leaf area development of the weeds. Increasing weed leaf area decreased the leaf area of the crop
in the case of P. urvillei, but not for P. paniculatum (Fig 3.15).
R2 = 0.48
R2 = 0.01
R2 = 0.69
R2 = 0.64
0
5000
10000
15000
20000
25000
0 20 40 60 80 100 120
Weed density (plants m-2)
Leaf area (cm2 m-2)
P. urvillei weed
P. urvillei cane
P. paniculatum weed
P. paniculatum cane
Fig. 3.15 Effect of increasing weed density of P. paniculatum and P. urvillei on weed and cane leaf areas (14 WAT)
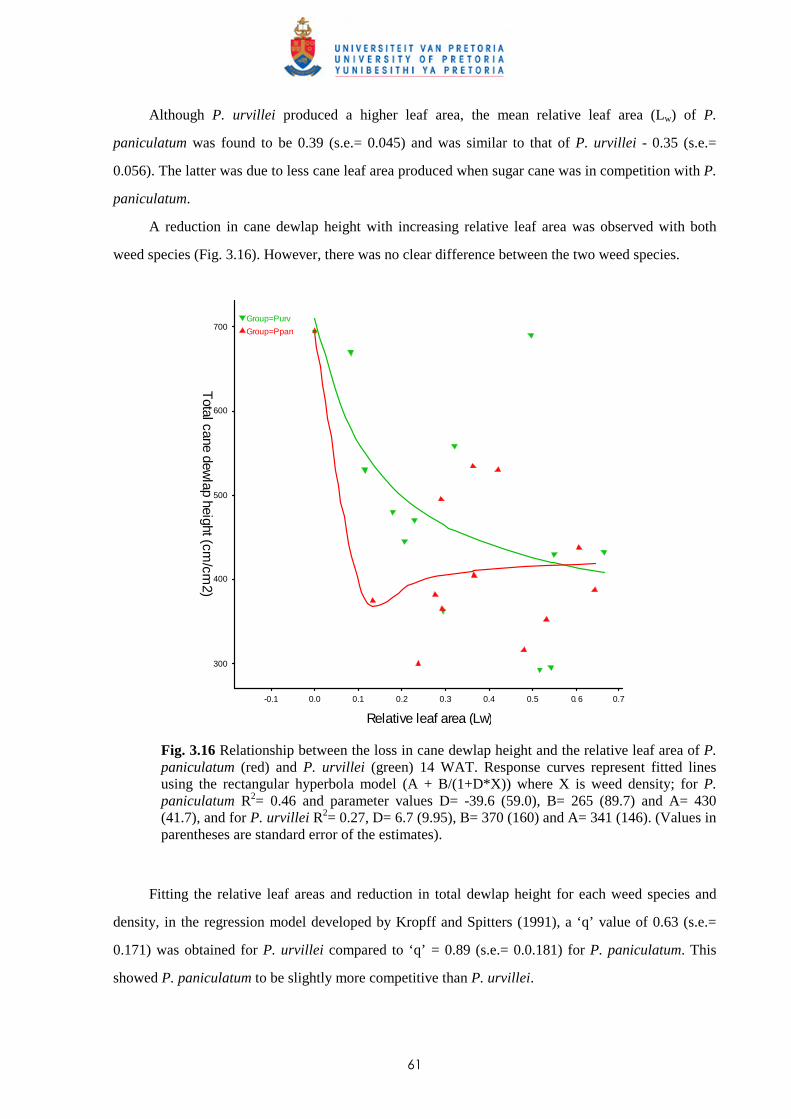
61
Although P. urvillei produced a higher leaf area, the mean relative leaf area (Lw) of P.
paniculatum was found to be 0.39 (s.e.= 0.045) and was similar to that of P. urvillei - 0.35 (s.e.=
0.056). The latter was due to less cane leaf area produced when sugar cane was in competition with P.
paniculatum.
A reduction in cane dewlap height with increasing relative leaf area was observed with both
weed species (Fig. 3.16). However, there was no clear difference between the two weed species.
Group=Purv
Group=Ppan
Relative leaf area (Lw)
300
0.7
400
500
0.5
600
0.1 0.4
700
0.30.0 0.2-0.1 0.6
Total cane dew
lap height (cm/cm
2)
Fig. 3.16 Relationship between the loss in cane dewlap height and the relative leaf area of P. paniculatum (red) and P. urvillei (green) 14 WAT. Response curves represent fitted lines using the rectangular hyperbola model (A + B/(1+D*X)) where X is weed density; for P. paniculatum R2= 0.46 and parameter values D= -39.6 (59.0), B= 265 (89.7) and A= 430 (41.7), and for P. urvillei R2= 0.27, D= 6.7 (9.95), B= 370 (160) and A= 341 (146). (Values in parentheses are standard error of the estimates).
Fitting the relative leaf areas and reduction in total dewlap height for each weed species and
density, in the regression model developed by Kropff and Spitters (1991), a ‘q’ value of 0.63 (s.e.=
0.171) was obtained for P. urvillei compared to ‘q’ = 0.89 (s.e.= 0.0.181) for P. paniculatum. This
showed P. paniculatum to be slightly more competitive than P. urvillei.
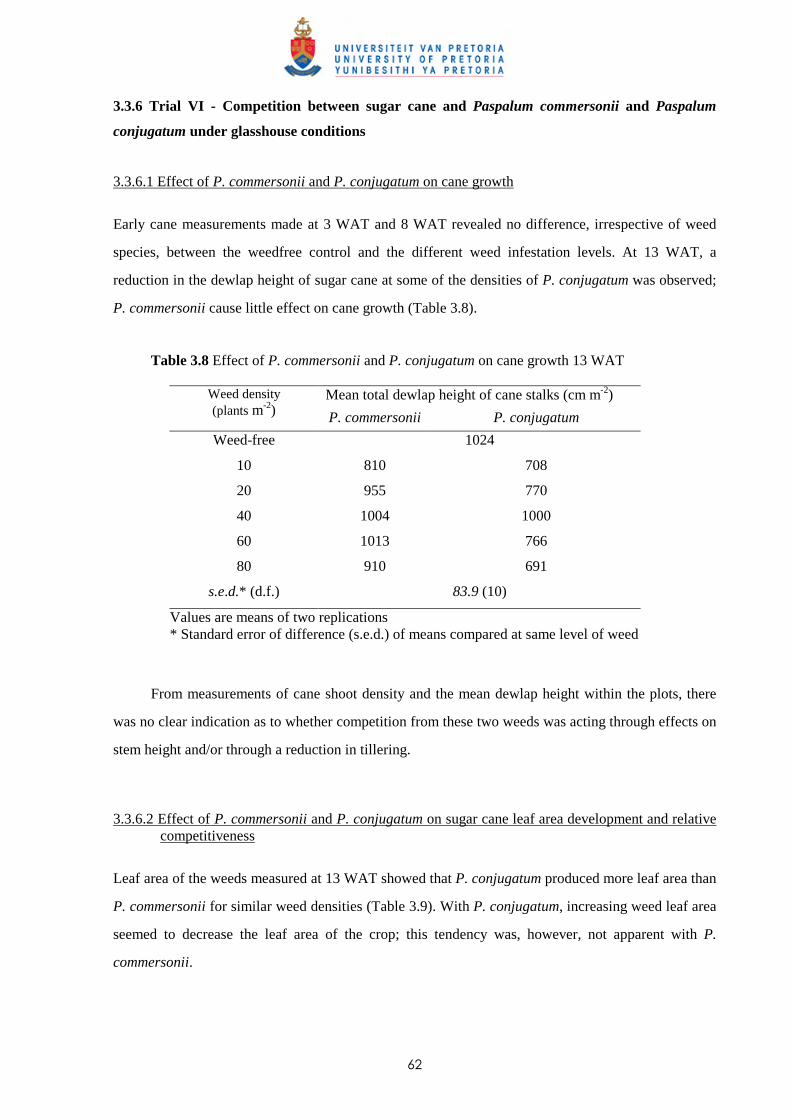
62
3.3.6 Trial VI - Competition between sugar cane and Paspalum commersonii and Paspalum
conjugatum under glasshouse conditions
3.3.6.1 Effect of P. commersonii and P. conjugatum on cane growth
Early cane measurements made at 3 WAT and 8 WAT revealed no difference, irrespective of weed
species, between the weedfree control and the different weed infestation levels. At 13 WAT, a
reduction in the dewlap height of sugar cane at some of the densities of P. conjugatum was observed;
P. commersonii cause little effect on cane growth (Table 3.8).
Table 3.8 Effect of P. commersonii and P. conjugatum on cane growth 13 WAT
Mean total dewlap height of cane stalks (cm m-2) Weed density (plants m-2) P. commersonii P. conjugatum
Weed-free 1024
10 810 708
20 955 770
40 1004 1000
60 1013 766
80 910 691
s.e.d.* (d.f.) 83.9 (10)
Values are means of two replications * Standard error of difference (s.e.d.) of means compared at same level of weed
From measurements of cane shoot density and the mean dewlap height within the plots, there
was no clear indication as to whether competition from these two weeds was acting through effects on
stem height and/or through a reduction in tillering.
3.3.6.2 Effect of P. commersonii and P. conjugatum on sugar cane leaf area development and relative
competitiveness
Leaf area of the weeds measured at 13 WAT showed that P. conjugatum produced more leaf area than
P. commersonii for similar weed densities (Table 3.9). With P. conjugatum, increasing weed leaf area
seemed to decrease the leaf area of the crop; this tendency was, however, not apparent with P.
commersonii.
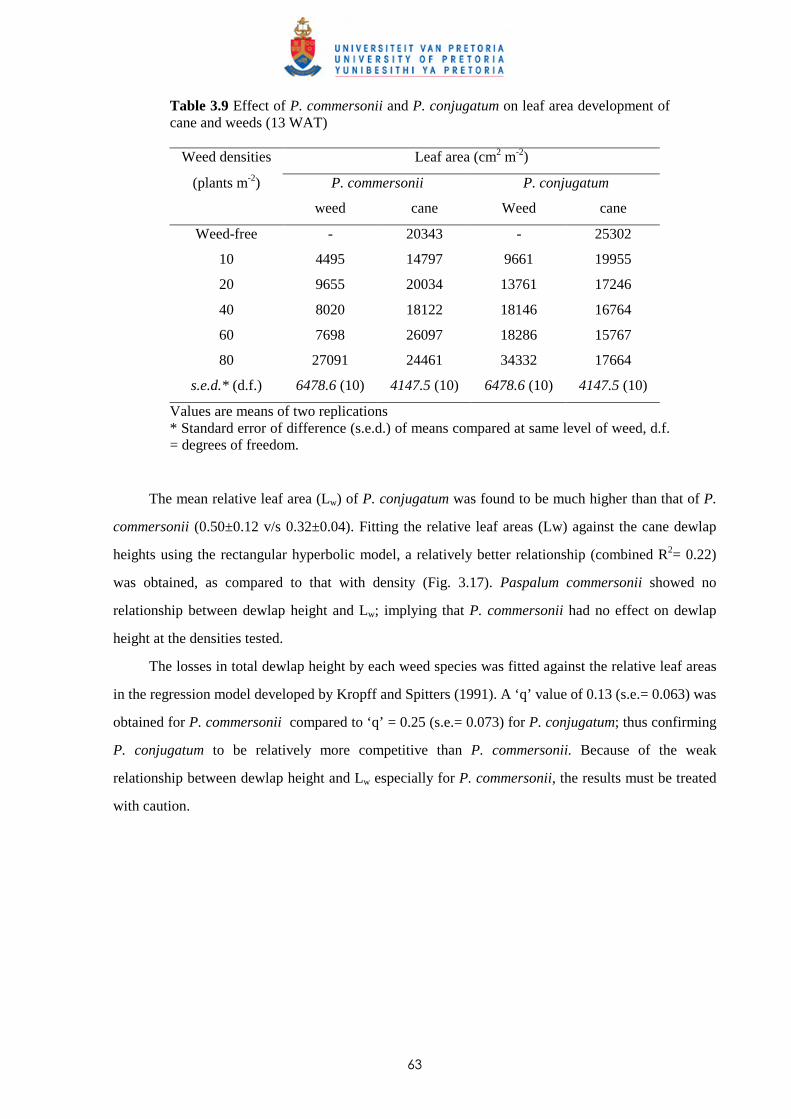
63
Table 3.9 Effect of P. commersonii and P. conjugatum on leaf area development of cane and weeds (13 WAT)
Weed densities Leaf area (cm2 m-2)
(plants m-2) P. commersonii P. conjugatum
weed cane Weed cane
Weed-free - 20343 - 25302
10 4495 14797 9661 19955
20 9655 20034 13761 17246
40 8020 18122 18146 16764
60 7698 26097 18286 15767
80 27091 24461 34332 17664
s.e.d.* (d.f.) 6478.6 (10) 4147.5 (10) 6478.6 (10) 4147.5 (10)
Values are means of two replications * Standard error of difference (s.e.d.) of means compared at same level of weed, d.f. = degrees of freedom.
The mean relative leaf area (Lw) of P. conjugatum was found to be much higher than that of P.
commersonii (0.50±0.12 v/s 0.32±0.04). Fitting the relative leaf areas (Lw) against the cane dewlap
heights using the rectangular hyperbolic model, a relatively better relationship (combined R2= 0.22)
was obtained, as compared to that with density (Fig. 3.17). Paspalum commersonii showed no
relationship between dewlap height and Lw; implying that P. commersonii had no effect on dewlap
height at the densities tested.
The losses in total dewlap height by each weed species was fitted against the relative leaf areas
in the regression model developed by Kropff and Spitters (1991). A ‘q’ value of 0.13 (s.e.= 0.063) was
obtained for P. commersonii compared to ‘q’ = 0.25 (s.e.= 0.073) for P. conjugatum; thus confirming
P. conjugatum to be relatively more competitive than P. commersonii. Because of the weak
relationship between dewlap height and Lw especially for P. commersonii, the results must be treated
with caution.
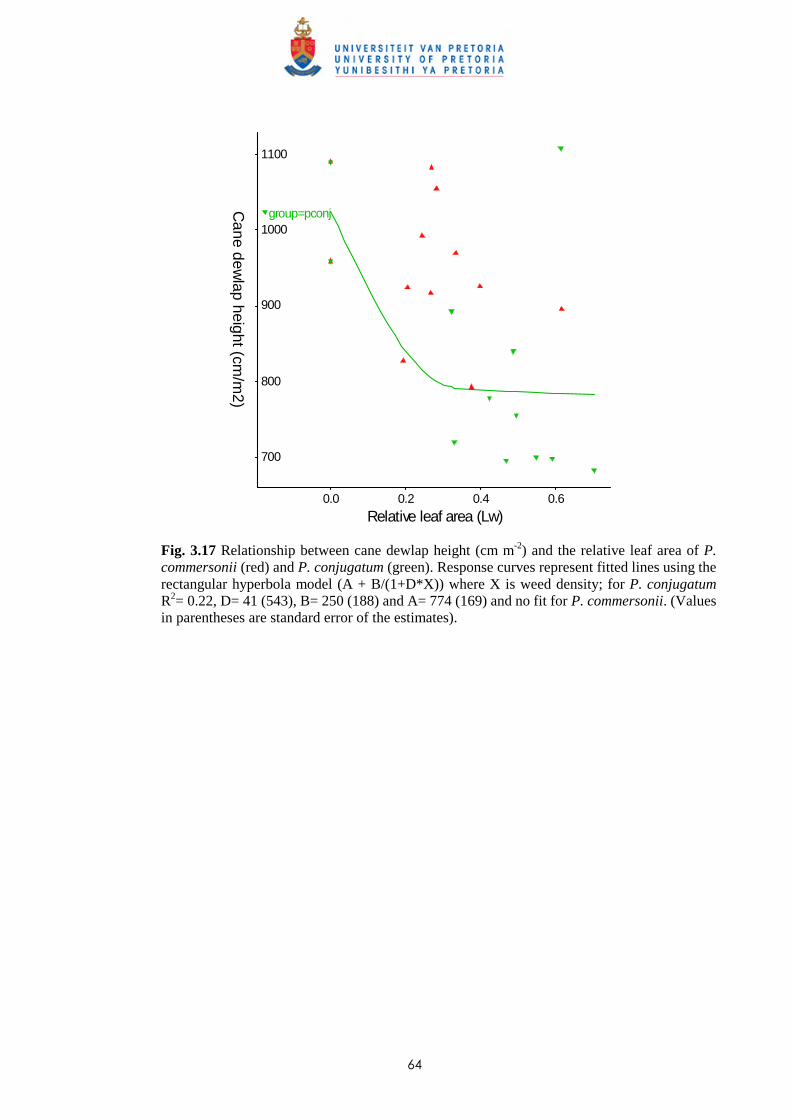
64
group=pconj
Relative leaf area (Lw)
800
1000
1100
0.2
900
0.60.4
700
0.0
Cane dew
lap height (cm/m
2)
Fig. 3.17 Relationship between cane dewlap height (cm m-2) and the relative leaf area of P. commersonii (red) and P. conjugatum (green). Response curves represent fitted lines using the rectangular hyperbola model (A + B/(1+D*X)) where X is weed density; for P. conjugatum R2= 0.22, D= 41 (543), B= 250 (188) and A= 774 (169) and no fit for P. commersonii. (Values in parentheses are standard error of the estimates).
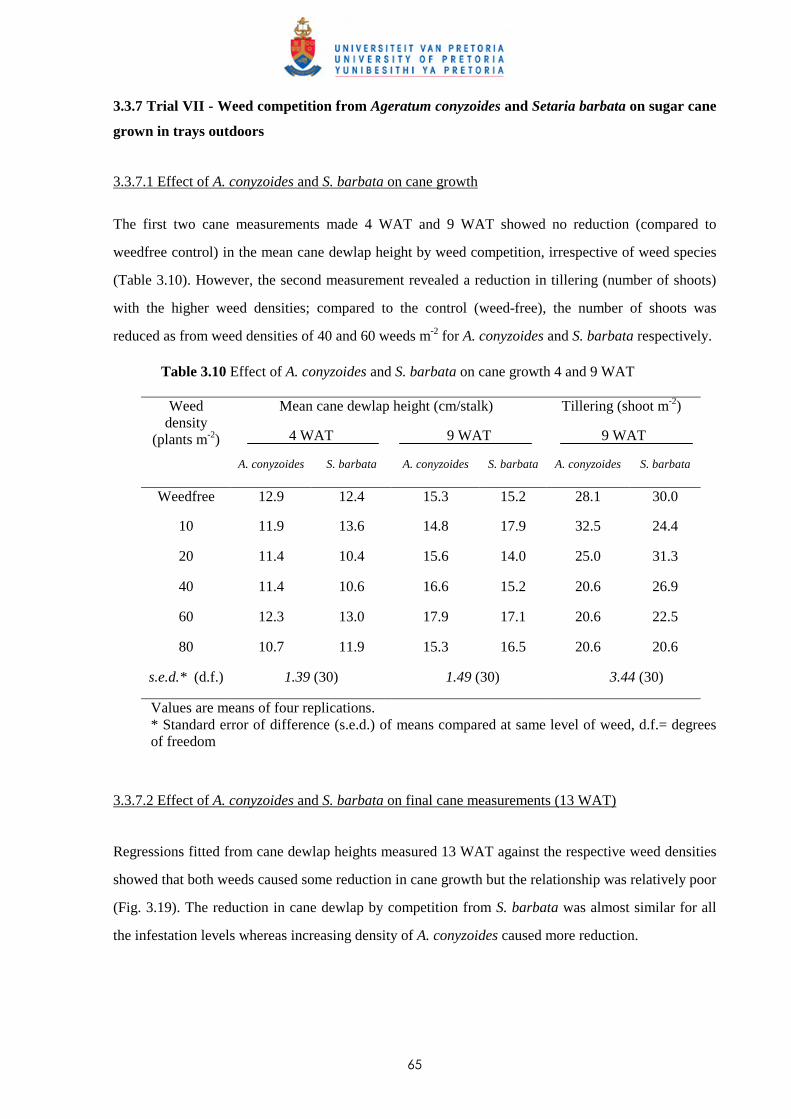
65
3.3.7 Trial VII - Weed competition from Ageratum conyzoides and Setaria barbata on sugar cane
grown in trays outdoors
3.3.7.1 Effect of A. conyzoides and S. barbata on cane growth
The first two cane measurements made 4 WAT and 9 WAT showed no reduction (compared to
weedfree control) in the mean cane dewlap height by weed competition, irrespective of weed species
(Table 3.10). However, the second measurement revealed a reduction in tillering (number of shoots)
with the higher weed densities; compared to the control (weed-free), the number of shoots was
reduced as from weed densities of 40 and 60 weeds m-2 for A. conyzoides and S. barbata respectively. Table 3.10 Effect of A. conyzoides and S. barbata on cane growth 4 and 9 WAT
Mean cane dewlap height (cm/stalk) Tillering (shoot m-2)
4 WAT 9 WAT 9 WAT
Weed density
(plants m-2)
A. conyzoides S. barbata A. conyzoides S. barbata A. conyzoides S. barbata
Weedfree 12.9 12.4 15.3 15.2 28.1 30.0
10 11.9 13.6 14.8 17.9 32.5 24.4
20 11.4
10.4 15.6 14.0 25.0 31.3
40 11.4 10.6 16.6 15.2 20.6 26.9
60 12.3 13.0 17.9 17.1 20.6 22.5
80 10.7 11.9 15.3 16.5 20.6 20.6
s.e.d.* (d.f.) 1.39 (30) 1.49 (30) 3.44 (30)
Values are means of four replications. * Standard error of difference (s.e.d.) of means compared at same level of weed, d.f.= degrees of freedom
3.3.7.2 Effect of A. conyzoides and S. barbata on final cane measurements (13 WAT)
Regressions fitted from cane dewlap heights measured 13 WAT against the respective weed densities
showed that both weeds caused some reduction in cane growth but the relationship was relatively poor
(Fig. 3.19). The reduction in cane dewlap by competition from S. barbata was almost similar for all
the infestation levels whereas increasing density of A. conyzoides caused more reduction.
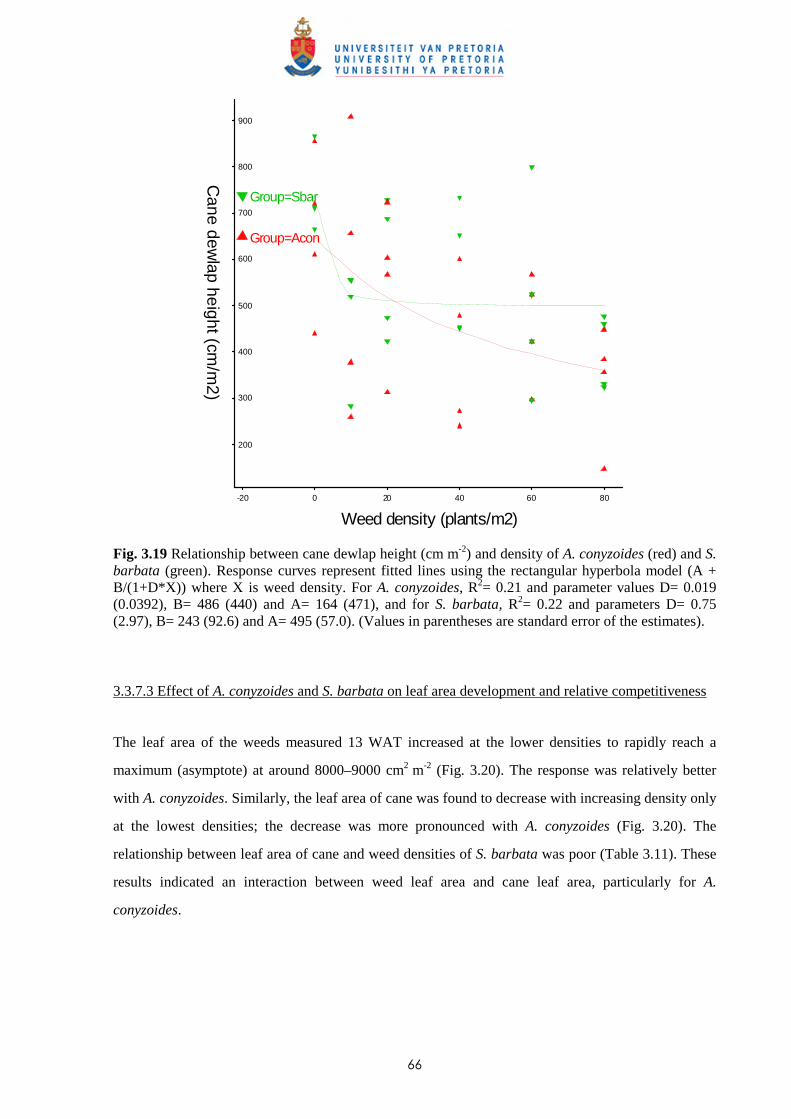
66
Group=Sbar
Group=Acon
Weed density (plants/m2)
900
40
700
800
20
300
400
600
0 8060
200
500
-20
Cane dew
lap height (cm/m
2)
Fig. 3.19 Relationship between cane dewlap height (cm m-2) and density of A. conyzoides (red) and S. barbata (green). Response curves represent fitted lines using the rectangular hyperbola model (A + B/(1+D*X)) where X is weed density. For A. conyzoides, R2= 0.21 and parameter values D= 0.019 (0.0392), B= 486 (440) and A= 164 (471), and for S. barbata, R2= 0.22 and parameters D= 0.75 (2.97), B= 243 (92.6) and A= 495 (57.0). (Values in parentheses are standard error of the estimates).
3.3.7.3 Effect of A. conyzoides and S. barbata on leaf area development and relative competitiveness
The leaf area of the weeds measured 13 WAT increased at the lower densities to rapidly reach a
maximum (asymptote) at around 8000–9000 cm2 m-2 (Fig. 3.20). The response was relatively better
with A. conyzoides. Similarly, the leaf area of cane was found to decrease with increasing density only
at the lowest densities; the decrease was more pronounced with A. conyzoides (Fig. 3.20). The
relationship between leaf area of cane and weed densities of S. barbata was poor (Table 3.11). These
results indicated an interaction between weed leaf area and cane leaf area, particularly for A.
conyzoides.
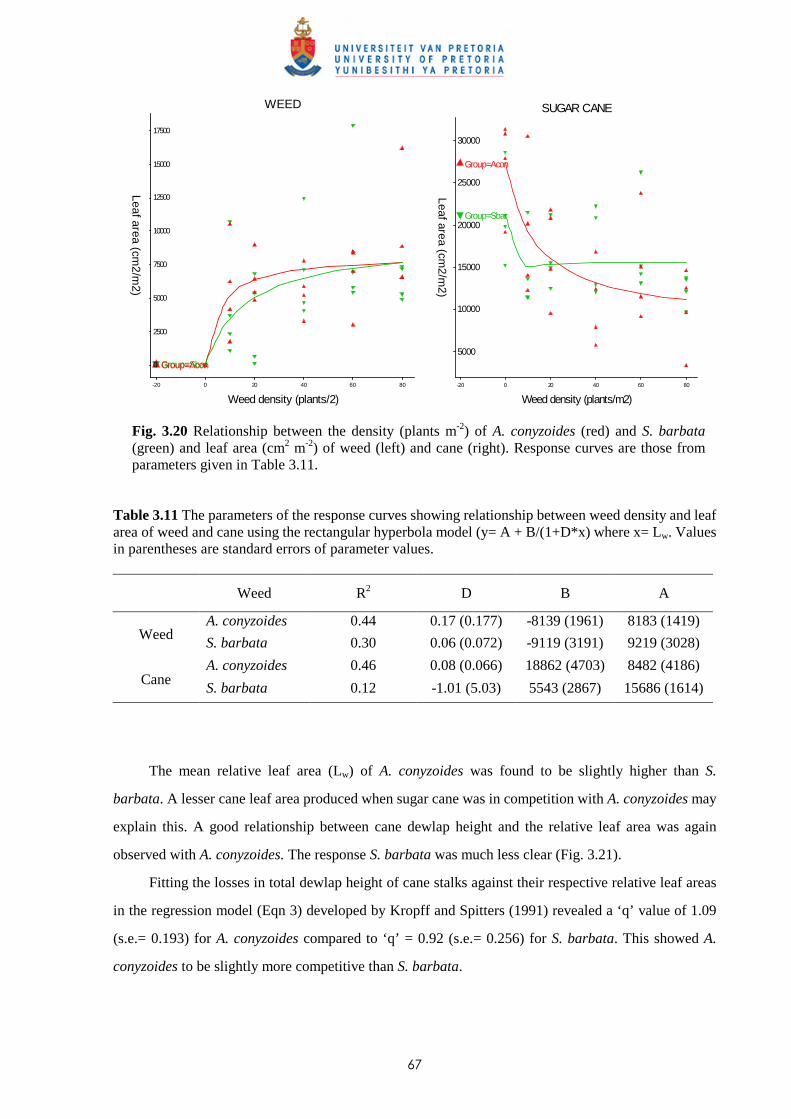
67
Group=SbarGroup=Acon
Weed density (plants/2)40
12500
15000
17500
20
2500
5000
10000
0 8060
0
7500
-20
Leaf area (cm2/m
2)
WEED
Group=Sbar
Group=Acon
Weed density (plants/m2)
15000
20000
20
25000
30000
5000
0
10000
806040-20
Leaf area (cm2/m
2)
SUGAR CANE
Fig. 3.20 Relationship between the density (plants m-2) of A. conyzoides (red) and S. barbata (green) and leaf area (cm2 m-2) of weed (left) and cane (right). Response curves are those from parameters given in Table 3.11.
Table 3.11 The parameters of the response curves showing relationship between weed density and leaf area of weed and cane using the rectangular hyperbola model (y= A + B/(1+D*x) where x= Lw. Values in parentheses are standard errors of parameter values.
Weed R2 D B A
A. conyzoides 0.44 0.17 (0.177) -8139 (1961) 8183 (1419) Weed
S. barbata 0.30 0.06 (0.072) -9119 (3191) 9219 (3028)
A. conyzoides 0.46 0.08 (0.066) 18862 (4703) 8482 (4186) Cane
S. barbata 0.12 -1.01 (5.03) 5543 (2867) 15686 (1614)
The mean relative leaf area (Lw) of A. conyzoides was found to be slightly higher than S.
barbata. A lesser cane leaf area produced when sugar cane was in competition with A. conyzoides may
explain this. A good relationship between cane dewlap height and the relative leaf area was again
observed with A. conyzoides. The response S. barbata was much less clear (Fig. 3.21).
Fitting the losses in total dewlap height of cane stalks against their respective relative leaf areas
in the regression model (Eqn 3) developed by Kropff and Spitters (1991) revealed a ‘q’ value of 1.09
(s.e.= 0.193) for A. conyzoides compared to ‘q’ = 0.92 (s.e.= 0.256) for S. barbata. This showed A.
conyzoides to be slightly more competitive than S. barbata.
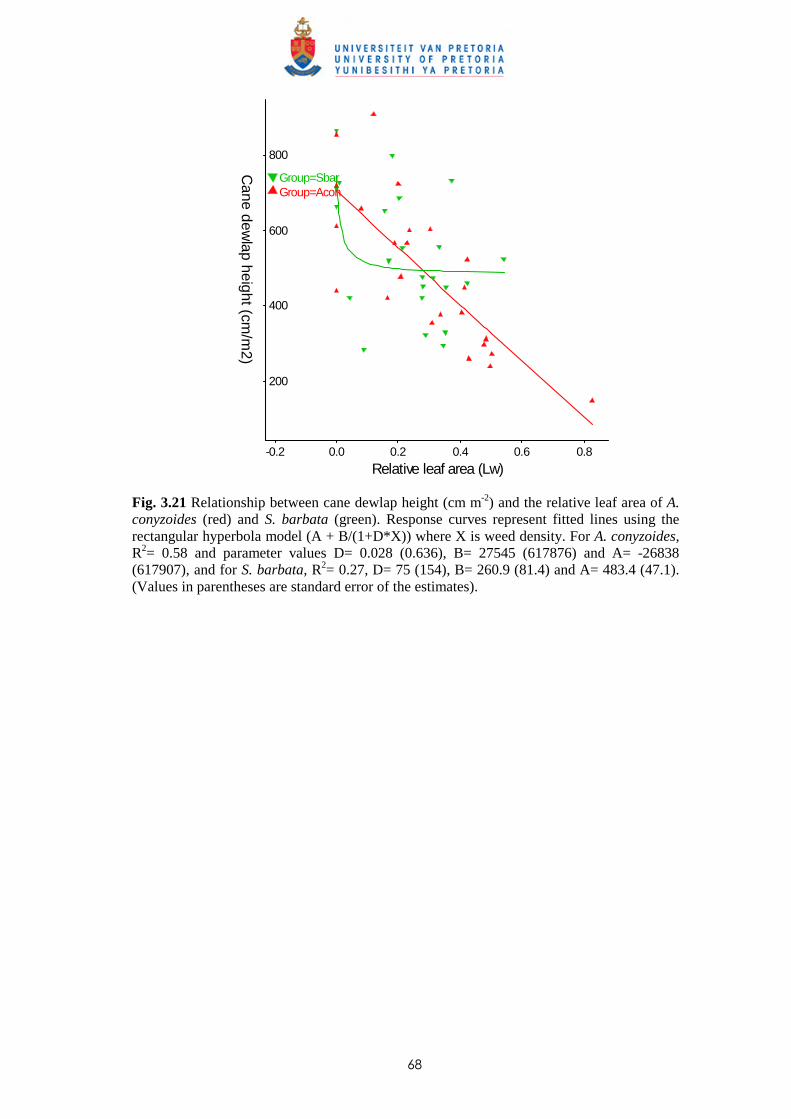
68
Group=SbarGroup=Acon
Relative leaf area (Lw)0.2 0.8
200
400
600
0.0
800
0.60.4-0.2
Cane dew
lap height (cm/m
2)
Fig. 3.21 Relationship between cane dewlap height (cm m-2) and the relative leaf area of A. conyzoides (red) and S. barbata (green). Response curves represent fitted lines using the rectangular hyperbola model (A + B/(1+D*X)) where X is weed density. For A. conyzoides, R2= 0.58 and parameter values D= 0.028 (0.636), B= 27545 (617876) and A= -26838 (617907), and for S. barbata, R2= 0.27, D= 75 (154), B= 260.9 (81.4) and A= 483.4 (47.1). (Values in parentheses are standard error of the estimates).
69
3.4 Discussion and conclusions
Time interval between start of infestation and effect on cane growth
The trials have demonstrated that the effect of competition from the different weed species on sugar
cane was visible only several weeks (e.g. 12-14 weeks) after introducing the infestations although a
few effects were observed earlier in some of the trials at the higher weed densities. This implied that
there should be a minimum level of weed infestation and duration of interference to cause any adverse
effect on cane growth; the higher densities reached that level of infestation earlier. The latter may be
reached even earlier for quick growing species such as B. pilosa (in Trial II) where some effects were
detected at the highest densities as from 3 WAT. The relative rate of growth of the same weed with
respect to the crop may differ with growth conditions; B. pilosa was found to show an adverse effect
on the total dewlap height as from 9 WAT in Trial IV. All the grasses tested took, more or less, the
same time (between 13 and 16 WAT) to show their competitive effect.
Effect of weed competition on cane tillering v/s elongation
The effect on cane growth was, in most cases, due to a reduction in the number of shoots (tillering) but
a reduction in cane elongation with similar tiller densities has also been noted (e.g. Trial IV). The total
dewlap height which is the product of the number of shoots/stalks and mean dewlap height of each
stalk gave a good comparison for the effect on cane growth and was also found to have a good
correlation with the aboveground biomass. In Trials V and VI, a reduction in the total dewlap height
was observed despite no effect on tillering, this may be explained by the fact that the cane had already
reached its peak tillering phase at the time of observation and had started its elongation phase (mean
dewlap height of stalks in the weedfree plots had reached 45 cm and 55 cm in Trials V and VI
respectively). The latter was also observed for P. urvillei in Trial II where the cane stalks had reached
more than 25 cm in height at the time of assessment. As the number of shoots reduces naturally after
the peak of the tillering phase, this may partly mask the effect of any reduction due to competition
which occurred prior to the peak tillering phase as compared to the weedfree control. In the other
trials, the final assessments were made when the cane stalks in the weedfree plots had a mean dewlap
height varying between 18 and 100 cm.
The effect of competition on tillering or cane elongation was sometimes difficult to separate as
observed in Trial VI, or was even found to vary among the different weed species tested as in Trial II
where only D. horizontalis showed a reduction in tillering.
70
Effect of weed density on weed competition
Increasing weed densities was found to influence weed competition but the relationship between cane
dewlap height and weed density was generally poor, the R2 exceeding 0.50 only once (0.68 for P.
urvillei in Trial III). No response was also noted in Trials II and VI. Some of the trials also showed
that beyond certain weed densities, there was intra-specific competition and sometimes even causing
less damage than the lower densities. For example the relative growth of D. horizontalis was higher at
the lower densities in Trial II. The intra-specific competition also influenced the weed infestation over
the period of assessment as leaf area measurements showed a poor consistency between the initial
densities at establishment and those maintained throughout the duration of the trials.
Relative leaf areas of cane and weeds
The leaf areas of the weeds were found to vary with species, density and growing conditions
(temperature, time of observation, field v/s glasshouse, etc). Similarly, the leaf area of cane in the
weed-free treatments was also found to differ with respect to cane variety and the growing conditions.
Furthermore, the leaf area of cane was also found to decrease with the presence of weeds; the decrease
was more pronounced with higher weed leaf areas.
The relative leaf area (Lw) varied with weed species and density. In general, the weed species
with a higher leaf area were found to have a higher Lw; exception to that was observed in Trial V
where P. urvillei showed higher leaf areas (for similar weed densities at establishment of infestations)
than P. paniculatum but the mean relative leaf area (Lw) was found to be the same. The latter was
caused by a more adverse effect of P. paniculatum on the leaf area of the crop.
The use of the relative leaf area instead of weed density to show effect of weed competition on
cane growth was found to give better relationships (correlations). The better response with the relative
leaf areas confirmed the variability in development of weed infestations following their transplanting.
As the cane leaf area was also found to be adversely affected by increasing weed infestations (weed
leaf area), the relative leaf catered for that and also for the difference in growth stages of both the cane
and the weeds at time of transplanting.
Relative competitiveness of weeds in sugar cane
The relative competitiveness of the weeds was compared by applying the model by Kropff and
Spitters (1991). This model has been developed to quantify the effect of weed competition on final
yields. However as the cane growth period is very long and most of the comparisons were either very
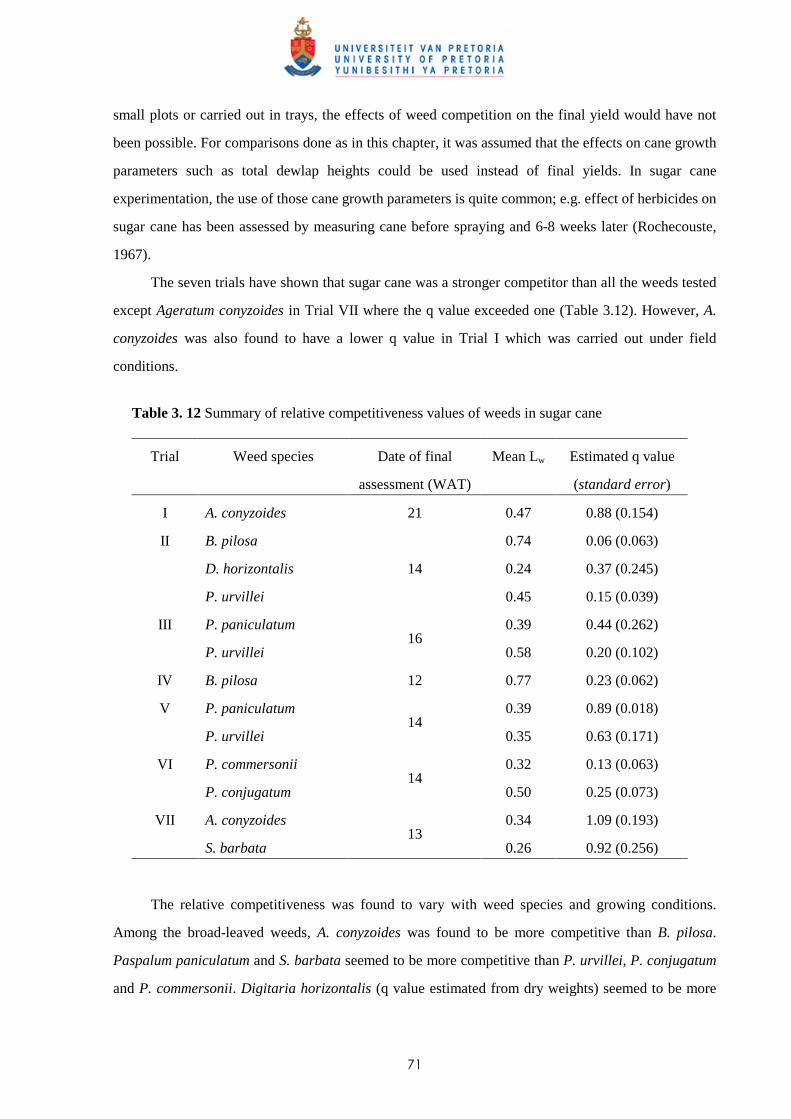
71
small plots or carried out in trays, the effects of weed competition on the final yield would have not
been possible. For comparisons done as in this chapter, it was assumed that the effects on cane growth
parameters such as total dewlap heights could be used instead of final yields. In sugar cane
experimentation, the use of those cane growth parameters is quite common; e.g. effect of herbicides on
sugar cane has been assessed by measuring cane before spraying and 6-8 weeks later (Rochecouste,
1967).
The seven trials have shown that sugar cane was a stronger competitor than all the weeds tested
except Ageratum conyzoides in Trial VII where the q value exceeded one (Table 3.12). However, A.
conyzoides was also found to have a lower q value in Trial I which was carried out under field
conditions.
Table 3. 12 Summary of relative competitiveness values of weeds in sugar cane
Trial Weed species Date of final
assessment (WAT)
Mean Lw Estimated q value
(standard error)
I A. conyzoides 21 0.47 0.88 (0.154)
II B. pilosa 0.74 0.06 (0.063)
D. horizontalis 0.24 0.37 (0.245)
P. urvillei
14
0.45 0.15 (0.039)
III P. paniculatum 0.39 0.44 (0.262)
P. urvillei 16
0.58 0.20 (0.102)
IV B. pilosa 12 0.77 0.23 (0.062)
V P. paniculatum 0.39 0.89 (0.018)
P. urvillei 14
0.35 0.63 (0.171)
VI P. commersonii 0.32 0.13 (0.063)
P. conjugatum 14
0.50 0.25 (0.073)
VII A. conyzoides 0.34 1.09 (0.193)
S. barbata 13
0.26 0.92 (0.256)
The relative competitiveness was found to vary with weed species and growing conditions.
Among the broad-leaved weeds, A. conyzoides was found to be more competitive than B. pilosa.
Paspalum paniculatum and S. barbata seemed to be more competitive than P. urvillei, P. conjugatum
and P. commersonii. Digitaria horizontalis (q value estimated from dry weights) seemed to be more
72
competitive than P. urvillei. However, variations were observed in the q values for the same species
tested under different trial conditions; this indicates that a single q value obtained from a single trial
cannot be used for comparison of relative competitiveness and it would not predict weed competition
correctly under all field conditions. Although more trials under different agro-climatic conditions may
be required, indications on the relative competitiveness of some weeds were consistent; e.g. A.
conyzoides and B. pilosa were both assessed in two trials and the higher competitiveness of the former
weed was maintained.
The two trials (Trials III & V) comparing competition between P. paniculatum and P. urvillei
showed almost the same tendency, i.e. P. paniculatum being more competitive than P. urvillei
although the latter produced more leaf area and grew taller to intercept more light within the canopy.
As both trials were conducted with the same cane variety, the relatively higher q values in Trial V may
have resulted from a higher weed and cane development obtained under field conditions. The relative
growth rate of the crop and weeds, which would be dependent on the agroclimatic conditions together
with the time of weed emergence and observation, would influence the q value. The latter aspect and
the mechanisms for light competition needs to be studied further to understand weed competition in
sugar cane.
In general, the variability of the data was quite high and sometimes resulted in relatively poor
relationships (low R2 values). These were due to variability in cane growth within the trays, lack of
repetitions in some of the trials and the difficulty in maintaining the weed infestations at their initial
densities. The latter problem was partly resolved as the q values were calculated from the relative leaf
areas and the loss in cane growth. The size of the trays limited the duration of the trials and the ‘border
effect’ could have influenced the cane shoots growing near the end of the tray rows. Nevertheless, the
main objectives were achieved and it was possible to show how the different weed species affected
cane growth. But, some caution is needed in interpreting the relative ranking of the different weeds.
73
CHAPTER 4
EFFECT OF TIME AND LEAF AREA DISTRIBUTION ON WEED COMPETITION
BETWEEN SUGAR CANE AND PASPALUM PANICULATUM
OR PASPALUM URVILLEI
4.1 Introduction
In Mauritius, extremely high costs of weed control with herbicides and environmental concerns have
necessitated the development of weed management strategies aimed at minimization of herbicide use
and exploitation of alternative methods of control. An approach based on the critical periods of weed
competition (Chapter 2) and upon the ability to predict the effects of weeds on cane yield is being
developed. Damage relationships that quantify yield losses on the basis of early observations of weed
infestations have been studied for some weed species in sugar cane (Chapter 3) and have revealed that
sugar cane is a stronger competitor than most of the weeds tested. However, the effect on cane growth
would depend on the level of infestation and the relative competitiveness of the weed species. The
latter itself will depend on the time of weed emergence, its rate of growth and stage of growth of the
cane. Lindquist (2001) showed that the relationship between crop yield loss and weed density also
varies with the influence of management practices and environmental factors on crop-weed
competition. A better understanding of competition processes is therefore required for development of
sound weed management strategies.
Trials conducted under both field and glasshouse conditions (Chapter 3 - Trial III & Trial V
respectively) have shown a higher relative competitiveness of P. paniculatum compared to P. urvillei
despite the latter producing more leaf area and growing taller. The competitive difference between the
two weeds may be due to their vertical leaf distribution, as the effects of weed height on reduction of
light penetration through the crop canopy have been reported in weed competition studies (Massinga
et al., 2003). As sugar cane takes a relatively longer time before canopy closure, the relative
competitiveness (q) values obtained for the two weed species need to be examined more closely as this
coefficient is dependent on time, either time after weed emergence or on growth stages when
observations are made (Kropff & Spitters, 1991).
The model developed by Kropff and Spitters (1991) to express yield loss of the crop as a
function of the relative leaf area of the weed is as follows:
74
YL = q Lw (Eqn 1)
1 + (q-1) Lw
where YL is the yield loss, Lw is the relative leaf area of a weed species (weed leaf area / crop + weed
leaf area) , and q the ‘relative damage coefficient’. Parameter q is a measure of the competitiveness of
the weed species with respect to the crop and is thus species specific. The competitive strength of a
species is strongly determined by its share in leaf area at the moment when canopy closes and
interplant competition starts (Spitters & Aerts, 1983; Kropff, 1988). Generally, this model has been
developed to assess yield loss caused by the weeds as early as possible after crop emergence. In sugar
cane where the critical period of weed competition starts a few weeks after crop emergence or
ratooning, and the canopy closure period is relatively long, the ratio of the leaf area per plant of the
crop and the weed is expected to change and it is important to know how the relative leaf area (Lw) of
weeds changes up to canopy closure.
In the early growth phase, when the observations on weed infestation have to be made, the
canopy is not closed and the crop and weed plants generally grow exponentially according to the
function (Kropff & van Laar, 1993):
LA t = LA0 x e(R1 x t) (Eqn 2)
where LAt represents the leaf area per plant at time t, LA0 the leaf area at the reference time 0 (the
moment of observation for which the relative competitiveness q has been determined from
experimental data), R1 is the relative growth rate of leaf area (0C-1 d-1), and t is the time expressed in
degree days (0C d). The relative growth rate of the leaf area R1 is only relevant in early growth phases
when plants grow exponentially and can be determined by growth analysis of free growing plants.
From the above two equations, Kropff and Spitters (1991) and Kropff and van Laar (1993)
derived an equation relating the change in time of the relative competitiveness value q in the period of
exponential growth when the canopy is not closed as follows:
q = q0 x e((R1(c)
– R1(w)
) x t) (Eqn 3)
where q0 is the value of q when Lw is observed at t = 0 (the moment of observation for which the
relative damage coefficient q has been determined from experimental data) and t indicates the period
between t = 0 and the moment of observation (in degree days) for which the relative competitiveness q
will characterize the effects. R1(c) and R1(w) are the relative growth rate of leaf area of the crop and the
75
weed respectively. When q0 is determined for a given crop - weed combination at a certain time period
after crop emergence, the value of the relative competitiveness q value at other dates of observations
can be estimated using this equation.
Under adequate water and soil nitrogen, competition for light is thought to be the primary cause
of yield loss from weeds (Munger et al., 1987). Competition for light is an instantaneous process that
depends on the relative share of light absorbed by a species in a mixed canopy and the efficiency of
energy use in dry matter production (Lawlor, 1995). Light absorption in mixed canopies is determined
by the leaf area index (LAI) of the species, plant height, vertical leaf area distribution and leaf angle
distribution (Lindquist & Mortensen, 1999). The effects of weed height on reduction of light
penetration through the crop canopy have been reported in competition studies between velvetleaf
(Abutilon theophrasti Medikus) and soybean (Akey et al., 1990), tomato and black nightshade
(Solanum ptycanthum Dun.) (McGiffen et al., 1992), and wild oats (Avena fatua L.) and wheat
(Cudney et al., 1991). Massinga et al. (2003) emphasized the importance of evaluating the vertical
distribution of light through the canopy to assess the effect of weed height on light competition, after
showing that in a mixed canopy of corn and Amaranthus palmeri S. Watson more than 60% of light
was intercepted 1 m above ground where 80% of the weed leaf area was concentrated compared to a
weed-free corn situation where 60% of the light was intercepted from 0.5 to 1.5 m above the ground.
For a better understanding of the mechanisms of weed competition in sugar cane, particularly
for light, and the relative competitiveness of weed species with different morphological characteristics,
three field trials comparing competition from P. paniculatum and P. urvillei on sugar cane have been
conducted between 2003 and 2006. The main objectives of the trials were:
- to compare the relative competitiveness q values for the two weed species at different time
of observations after transplanting;
- to study the competition and compare q values of the two weeds with respect to two
transplanting dates;
- to assess the effect of leaf area distribution (vertical) of cane and weeds at different times
after transplanting on weed competition.
76
4.2 Materials and methods
4.2.1 Trial I – Effect of time of observation and two transplanting dates on the relative
competitiveness (q value) of Paspalum paniculatum and Paspalum urvillei in competition with
sugar cane
Trial site and plant material
A field experiment was initiated in November 2003 at Réduit Experiment Station, L soil group (Parish
& Feillafé, 1965), to compare competition from P. paniculatum and P. urvillei on sugar cane. The
field was planted on 24 November 2003 using three-eyed cuttings of cane variety R 575 obtained from
a plant cane field on the station and adopting all other cultural practices as per normal
recommendations. Young plants of the two weeds were collected from abandoned fields in the Belle-
Rive region and transplanted after pruning of the upper part of the leaves to reduce transpiration.
Treatments and experimental layout
The weeds were transplanted at two dates, the first on 23 and 24 January 2004 (9 WAP) and the
second on 17-19 March 2004 (17 WAP). At each date, P. urvillei and P. paniculatum were both
manually transplanted at densities of 6, 10, 15, 20 and 33 plants m-2; a weed-free plot was also
included. Each plot consisted of three cane rows of 1.5 m long and cane planted at a row spacing of
1.5 m; the effective competition area was 1.2 x 1.5 (1.8 m2) for each row of cane, with a walking path
of 0.3 m in the centre of the interrows. The statistical design used was a split-split plot with the two
transplanting dates as main-plots, weed species (P. paniculatum v/s P. urvillei) as sub-plot and six
weed densities as sub-sub-plot treatments. Each treatment was replicated three times. The middle row
within each plot was kept for cane measurement at end of the treatment period whereas the two border
rows were used for destructive sampling for cane and weed dry weight and leaf area data. The field
was irrigated regularly and all emerging weeds other than those transplanted were hand-weeded.
Data collection and analysis
Data on cane and weed (fresh/dry weights, leaf areas, average cane dewlap heights) were collected on
4 March 2004 (5 WAT), 30 March 2004 (9 WAT), 4 May 2004 (14 WAT) and 3 June 2004 (18 WAT)
with respect to the first transplanting date (TD1). For the second transplanting date (TD2), similar data
were collected three times, namely on 7 May 2004 (7 WAT), 8 June 2004 (11 WAT) and 12 July 2004
77
(16 WAT). At each data collection date, a quadrat of 0.5 m X 1.0 m was placed on the external rows
with the longer side across the cane row. Fresh weights of the sampled material were determined
immediately after harvesting, and sub-samples were then dried for 48 hours at 105oC for dry matter
estimation. The trial was harvested on 27 August 2004; all millable stalks in the middle row of each
plot were hand-cut and weighed (fresh weight).
Data collection on leaf area of cane and weeds was done with the CID portable leaf area meter
(see details in Chapter 3 - Trial I); sub-samples representing 10 to 50% of the total fresh weight were
used for this estimation. Daily minimum and maximum temperatures were available from the station’s
records; the mean daily temperature was calculated to estimate the growing degree day (GDD) for the
duration of the trial.
Statistical and regression analysis
The relative leaf area (Lw) was calculated from the cane and weed leaf area data. The effect of
competition from the two Paspalum species were compared by fitting regression curves of their cane
dewlap (total) heights against the relative leaf area using the rectangular hyperbola (linear-by-linear)
function in Genstat (Genstat, 2005) which is similar to the equation proposed by Cousens (1985) (see
details in Chapter 3 – Trial I). Only regressions that were statistically significant (P< 0.05) were
presented, even though the R2 values were sometimes low (where fits were not statistically significant
the regressions lines were not presented). The relative leaf area and cane yield data were subjected to
non-linear regression analysis according to the weed competition model (Eqn 1) developed by Kropff
and Spitters (1991) using Genstat (Genstat, 2005) to estimate the relative competitiveness q values for
the two weed species at each observation and transplanting date. 4.2.2 Trial II – Relative competitiveness of Paspalum paniculatum and Paspalum urvillei on sugar
cane at two observation dates and effect of leaf area distribution on competition
Trial site and plant material
The field experiment to study weed competition from P. paniculatum and P. urvillei on sugar cane
was established in March 2005 at Réduit Experiment Station, L soil group (Parish & Feillafé, 1965).
Sugar cane, variety R 570, was initially planted in November 2004 using three-eyed cuttings obtained
from a plant cane field on the station and using recommended local cultural practices. Young plants of
the two weeds were collected from abandoned fields in the Belle-Rive and Ebène regions and were
78
transplanted on 20 January 2005 after pruning of the upper part of the leaves to reduce transpiration.
At the start of this experiment, on 10 March 2005, the now vigorous cane shoots were stubble-shaved,
to equalise the initial size of the weeds and cane, and to allow new shoots to sprout (ratooning) again
from all plots. The weed infestation were maintained and restored by recruiting some gaps within the
first week of April 2005. Treatments and experimental layout
The two weeds were transplanted at densities of 12, 16, 24, 28 and 36 plants m-2 manually in each plot;
a weedfree plot was also included. Each plot consisted of three cane rows of 1.5 m long and cane
planted at a row spacing of 1.5 m; the effective competition area was 1.2 x 1.5 (1.8 m2) for each cane
row with a walking path of 0.3 m in the centre of the interrows. The statistical design used was a split-
plot with the two weeds as main-plots and weed density as sub-plot treatments. Each treatment was
replicated four times. The middle row was kept for cane measurement at end of the treatment period
whereas the two border rows were used for destructive sampling for dry weight and leaf area
estimation for both cane and the weeds. The field was irrigated regularly and all emerging weeds other
than those transplanted were hand-weeded.
Data collection and analysis
Data on weed and cane (fresh/dry weights, leaf areas, average cane dewlap heights) were collected at
two dates; the first one on 13 May 2005 (8 WAH) and a second one during the first week of August
2005 (20 WAH). At each data collection date, a quadrat of 0.5 m x 1.0 m was placed on the external
rows with the longer side across the centre of the cane row. On the second observation date, leaves of
cane and weeds were collected separately in different layers representing horizontal layers of 0 to 30
cm from ground, between 30 to 60 cm, and a layer with all leaves above 60 cm (Fig. 4.1).
Fresh weights and dried weights were determined as in Trial I. Data collection on leaf area of
cane and weeds was done with a portable leaf area meter as in Trial 1.
Statistical and regression analysis
All cane measurements and leaf area data were subjected to ANOVA. The relative leaf area (Lw) was
calculated from the cane and weed leaf area data. The effect of competition from the two Paspalum
species were compared by fitting regression curves of the loss in cane dewlap (total) height compared
to the weed-free mean against the relative leaf area using the rectangular hyperbola (linear-by-linear)
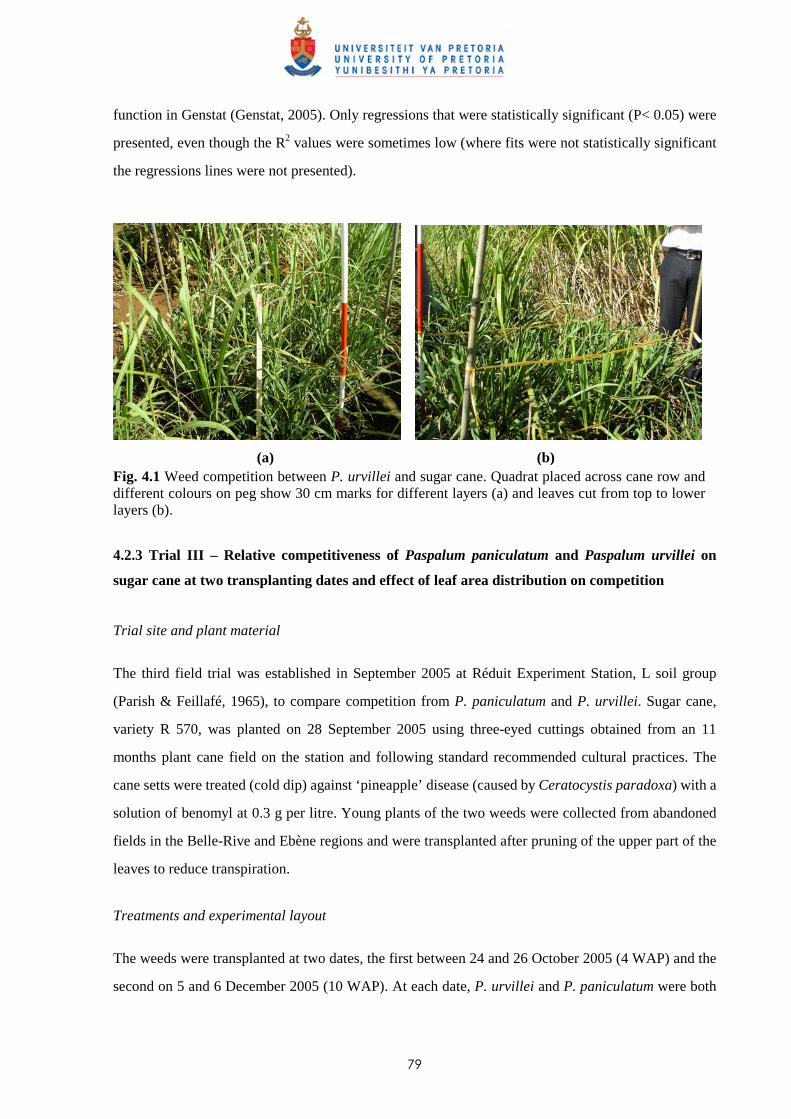
79
function in Genstat (Genstat, 2005). Only regressions that were statistically significant (P< 0.05) were
presented, even though the R2 values were sometimes low (where fits were not statistically significant
the regressions lines were not presented).
(a) (b) Fig. 4.1 Weed competition between P. urvillei and sugar cane. Quadrat placed across cane row and different colours on peg show 30 cm marks for different layers (a) and leaves cut from top to lower layers (b).
4.2.3 Trial III – Relative competitiveness of Paspalum paniculatum and Paspalum urvillei on
sugar cane at two transplanting dates and effect of leaf area distribution on competition
Trial site and plant material
The third field trial was established in September 2005 at Réduit Experiment Station, L soil group
(Parish & Feillafé, 1965), to compare competition from P. paniculatum and P. urvillei. Sugar cane,
variety R 570, was planted on 28 September 2005 using three-eyed cuttings obtained from an 11
months plant cane field on the station and following standard recommended cultural practices. The
cane setts were treated (cold dip) against ‘pineapple’ disease (caused by Ceratocystis paradoxa) with a
solution of benomyl at 0.3 g per litre. Young plants of the two weeds were collected from abandoned
fields in the Belle-Rive and Ebène regions and were transplanted after pruning of the upper part of the
leaves to reduce transpiration.
Treatments and experimental layout
The weeds were transplanted at two dates, the first between 24 and 26 October 2005 (4 WAP) and the
second on 5 and 6 December 2005 (10 WAP). At each date, P. urvillei and P. paniculatum were both
80
manually transplanted at densities of 4, 8, 16, 32 and 48 plants m-2 in each plot; a weed-free plot was
also included. Each plot consisted of three cane rows of 2.0 m long and cane planted at a row spacing
of 1.5 m. The statistical design used was a split-split plot with the two dates of transplanting weeds as
main-plots, weed species (P. paniculatum v/s P. urvillei) as sub-plot and six weed densities as sub-
sub-plot treatments. All treatments were replicated four times. The middle row in each plot was kept
for regular cane measurements and was harvested at the end of the experimentation. The two border
rows were used for destructive sampling for cane and weed dry weight and leaf area data at each
observation date. The field was irrigated regularly and all emerging weeds other than those
transplanted were hand-weeded.
Data collection and analysis
For the first transplanting date (TD1), data on weed and cane (fresh/dry weights, leaf areas, average
cane dewlap heights) were collected on 7 December 2005(6 WAT), 26 December 2005 (9 WAT), 23
January 2006 (13 WAT) and 27 February 2006 (18 WAT). For the second transplanting date (TD2),
similar data were collected three times, namely on 16 January 2006 (6 WAT), 9 February 2006 (9
WAT) and 20 March 2006 (15 WAT). At each data collection date, a quadrat of 0.5 m x 1.0 m was
placed on the external rows with the longer side across the cane row. Mean dewlap height of each
stalk found in the middle cane row were measured on 30 November 2005, 29 December 2005, 7
February 2006 and 25 April 2006. The cane stalks in the middle row of each treatment plot were
harvested on 8 September 2006.
At each observation date, the vertical distribution of leaves was assessed by dividing the canopy
into horizontal layers, fixed at 0 to 20 cm, 20 to 40 cm, 40 to 60 cm, 60 to 80 cm and >80 cm above
ground (Fig. 4.1a). The cane and weed leaves found in each layer were hand-cut and separated for dry
weight and leaf area analysis; the leaves from the topmost layer of the quadrat (0.5 x 1.0 m) were
harvested first (Fig. 4.1b). Fresh and dry weights of sampled material were determined as in Trials I
and II. Data collection on leaf area of cane and weeds was done with a portable leaf area meter as in
the earlier trials.
Statistical and regression analysis
Data with respect to cane measurements (dewlap height, no of shoots), dry weight (aboveground
biomass), leaf area and cane yields at harvest were subjected to ANOVA. The relative leaf area (Lw)
was calculated from the cane and weed leaf area data. Cane yield data were fitted against the weed

81
densities using the rectangular hyperbola (linear-by-linear) function in Genstat (Genstat, 2005). Only
regressions that were statistically significant (P< 0.05) were presented, even though the R2 values were
sometimes low (where fits were not statistically significant the regressions lines were not presented).
Relative leaf area and cane yield loss data were subjected to non-linear regression analysis (weed
competition model developed by Kropff and Spitters (1991)) using Genstat (Genstat, 2005) to estimate
the relative competitiveness q values for the two weed species.
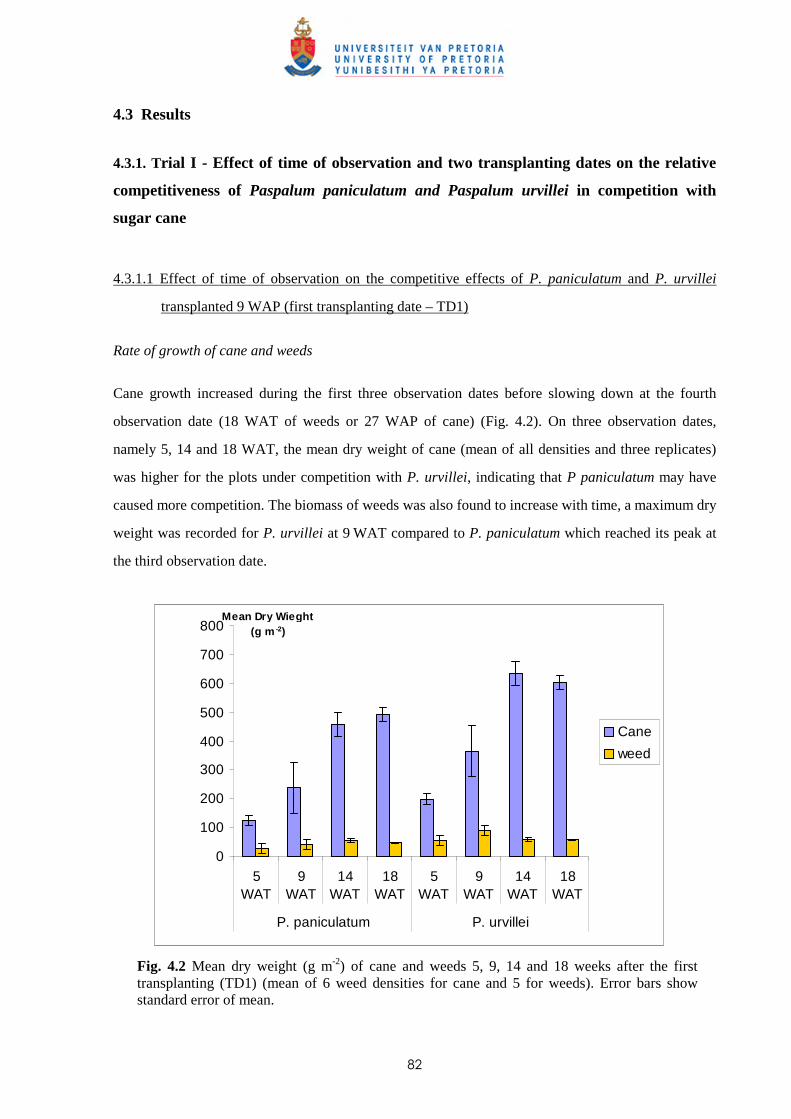
82
4.3 Results
4.3.1. Trial I - Effect of time of observation and two transplanting dates on the relative
competitiveness of Paspalum paniculatum and Paspalum urvillei in competition with
sugar cane
4.3.1.1 Effect of time of observation on the competitive effects of P. paniculatum and P. urvillei
transplanted 9 WAP (first transplanting date – TD1)
Rate of growth of cane and weeds
Cane growth increased during the first three observation dates before slowing down at the fourth
observation date (18 WAT of weeds or 27 WAP of cane) (Fig. 4.2). On three observation dates,
namely 5, 14 and 18 WAT, the mean dry weight of cane (mean of all densities and three replicates)
was higher for the plots under competition with P. urvillei, indicating that P paniculatum may have
caused more competition. The biomass of weeds was also found to increase with time, a maximum dry
weight was recorded for P. urvillei at 9 WAT compared to P. paniculatum which reached its peak at
the third observation date.
0
100
200
300
400
500
600
700
800
5WAT
9WAT
14WAT
18WAT
5WAT
9WAT
14WAT
18WAT
P. paniculatum P. urvillei
Mean Dry Wieght (g m -2)
Cane
weed
Fig. 4.2 Mean dry weight (g m-2) of cane and weeds 5, 9, 14 and 18 weeks after the first transplanting (TD1) (mean of 6 weed densities for cane and 5 for weeds). Error bars show standard error of mean.
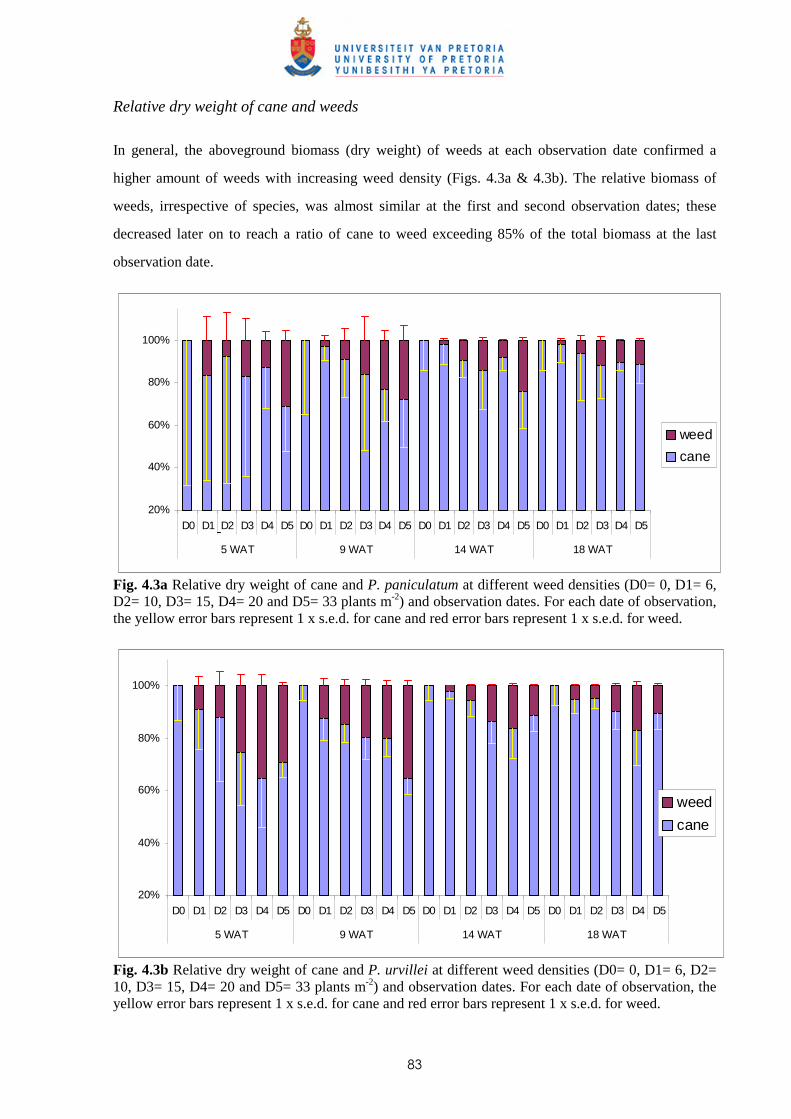
83
Relative dry weight of cane and weeds
In general, the aboveground biomass (dry weight) of weeds at each observation date confirmed a
higher amount of weeds with increasing weed density (Figs. 4.3a & 4.3b). The relative biomass of
weeds, irrespective of species, was almost similar at the first and second observation dates; these
decreased later on to reach a ratio of cane to weed exceeding 85% of the total biomass at the last
observation date.
20%
40%
60%
80%
100%
D0 D1 D2 D3 D4 D5 D0 D1 D2 D3 D4 D5 D0 D1 D2 D3 D4 D5 D0 D1 D2 D3 D4 D5
5 WAT 9 WAT 14 WAT 18 WAT
weed
cane
Fig. 4.3a Relative dry weight of cane and P. paniculatum at different weed densities (D0= 0, D1= 6, D2= 10, D3= 15, D4= 20 and D5= 33 plants m-2) and observation dates. For each date of observation, the yellow error bars represent 1 x s.e.d. for cane and red error bars represent 1 x s.e.d. for weed.
20%
40%
60%
80%
100%
D0 D1 D2 D3 D4 D5 D0 D1 D2 D3 D4 D5 D0 D1 D2 D3 D4 D5 D0 D1 D2 D3 D4 D5
5 WAT 9 WAT 14 WAT 18 WAT
weed
cane
Fig. 4.3b Relative dry weight of cane and P. urvillei at different weed densities (D0= 0, D1= 6, D2= 10, D3= 15, D4= 20 and D5= 33 plants m-2) and observation dates. For each date of observation, the yellow error bars represent 1 x s.e.d. for cane and red error bars represent 1 x s.e.d. for weed.
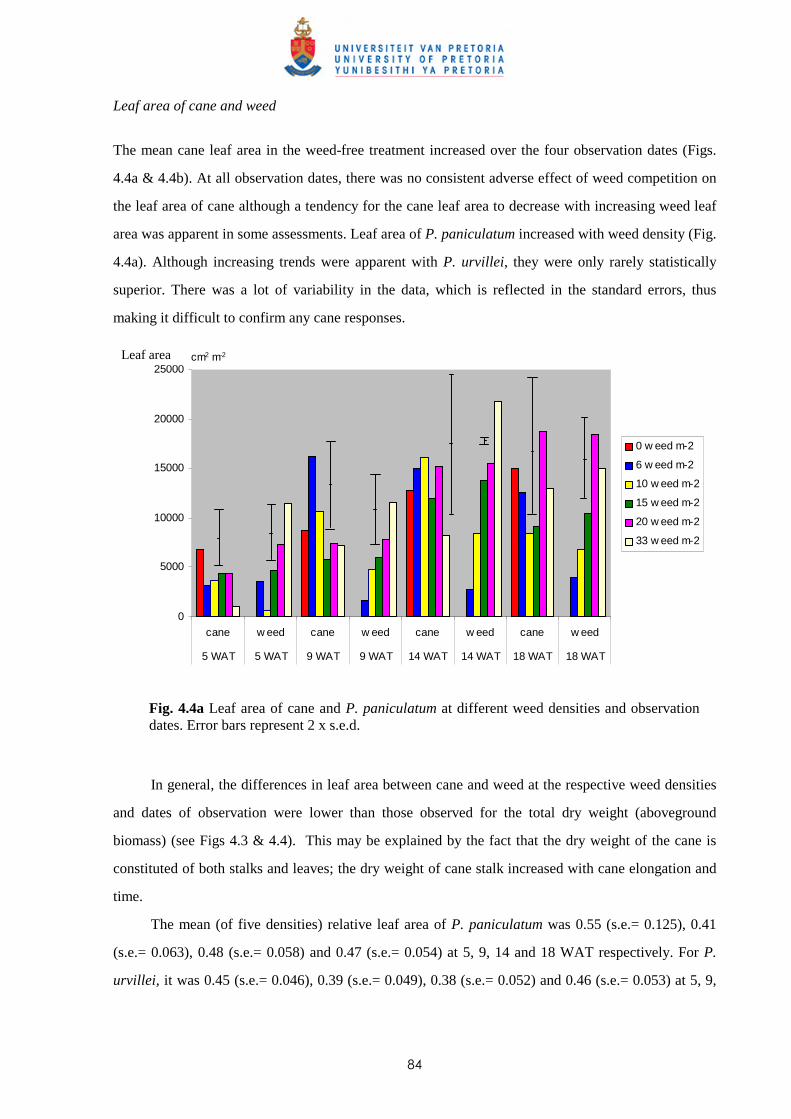
84
Leaf area of cane and weed
The mean cane leaf area in the weed-free treatment increased over the four observation dates (Figs.
4.4a & 4.4b). At all observation dates, there was no consistent adverse effect of weed competition on
the leaf area of cane although a tendency for the cane leaf area to decrease with increasing weed leaf
area was apparent in some assessments. Leaf area of P. paniculatum increased with weed density (Fig.
4.4a). Although increasing trends were apparent with P. urvillei, they were only rarely statistically
superior. There was a lot of variability in the data, which is reflected in the standard errors, thus
making it difficult to confirm any cane responses.
0
5000
10000
15000
20000
25000
cane w eed cane w eed cane w eed cane w eed
5 WAT 5 WAT 9 WAT 9 WAT 14 WAT 14 WAT 18 WAT 18 WAT
0 w eed m-2
6 w eed m-2
10 w eed m-2
15 w eed m-2
20 w eed m-2
33 w eed m-2
cm2 m-2
Fig. 4.4a Leaf area of cane and P. paniculatum at different weed densities and observation dates. Error bars represent 2 x s.e.d.
In general, the differences in leaf area between cane and weed at the respective weed densities
and dates of observation were lower than those observed for the total dry weight (aboveground
biomass) (see Figs 4.3 & 4.4). This may be explained by the fact that the dry weight of the cane is
constituted of both stalks and leaves; the dry weight of cane stalk increased with cane elongation and
time.
The mean (of five densities) relative leaf area of P. paniculatum was 0.55 (s.e.= 0.125), 0.41
(s.e.= 0.063), 0.48 (s.e.= 0.058) and 0.47 (s.e.= 0.054) at 5, 9, 14 and 18 WAT respectively. For P.
urvillei, it was 0.45 (s.e.= 0.046), 0.39 (s.e.= 0.049), 0.38 (s.e.= 0.052) and 0.46 (s.e.= 0.053) at 5, 9,
Leaf area
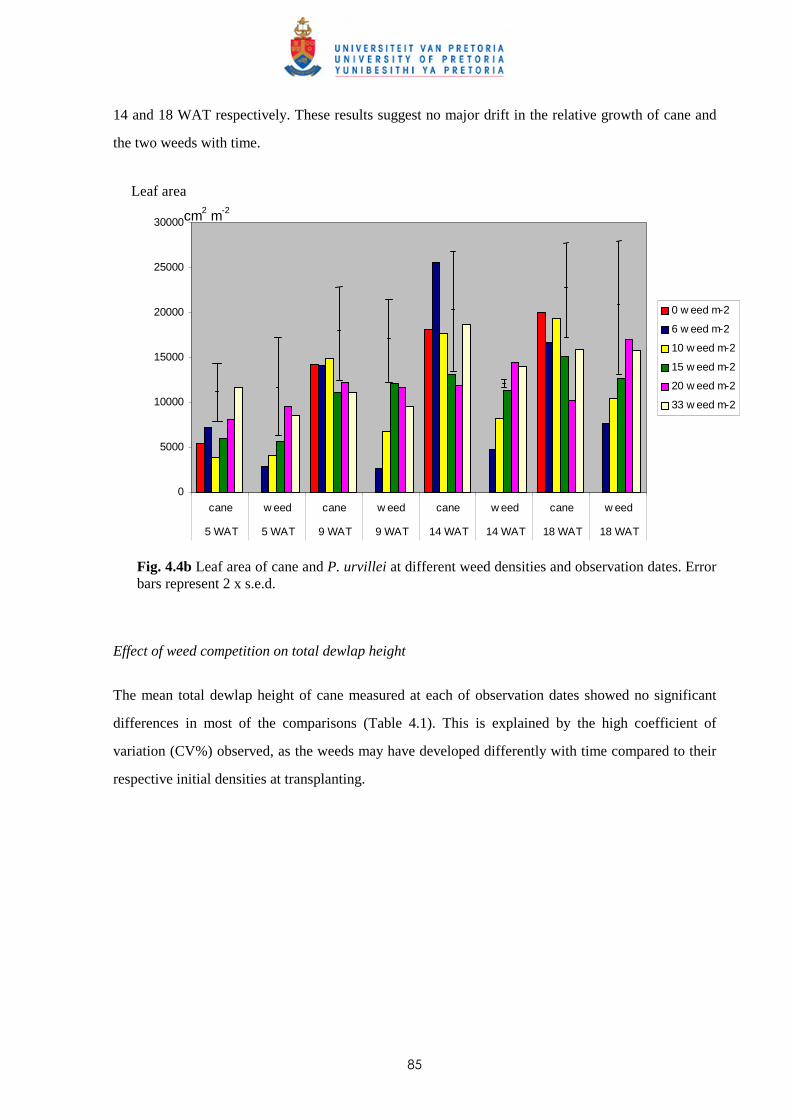
85
14 and 18 WAT respectively. These results suggest no major drift in the relative growth of cane and
the two weeds with time.
0
5000
10000
15000
20000
25000
30000
cane w eed cane w eed cane w eed cane w eed
5 WAT 5 WAT 9 WAT 9 WAT 14 WAT 14 WAT 18 WAT 18 WAT
0 w eed m-2
6 w eed m-2
10 w eed m-2
15 w eed m-2
20 w eed m-2
33 w eed m-2
cm2 m-2
Fig. 4.4b Leaf area of cane and P. urvillei at different weed densities and observation dates. Error bars represent 2 x s.e.d.
Effect of weed competition on total dewlap height
The mean total dewlap height of cane measured at each of observation dates showed no significant
differences in most of the comparisons (Table 4.1). This is explained by the high coefficient of
variation (CV%) observed, as the weeds may have developed differently with time compared to their
respective initial densities at transplanting.
Leaf area
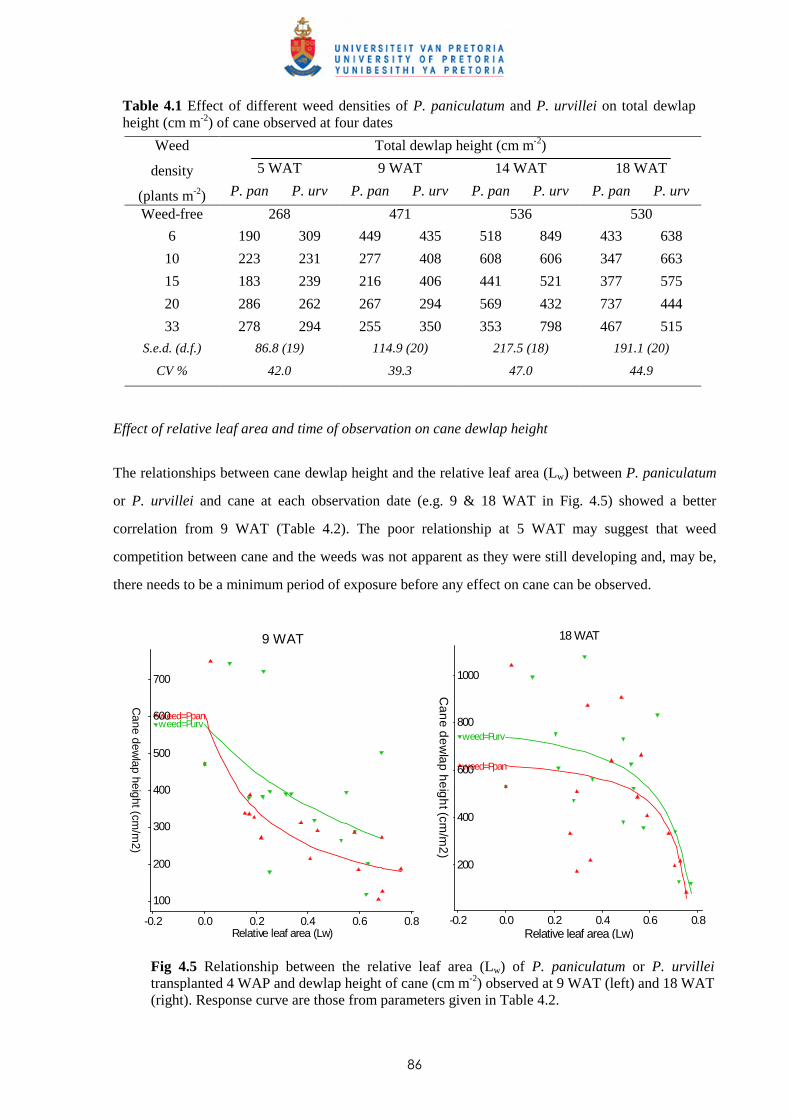
86
Table 4.1 Effect of different weed densities of P. paniculatum and P. urvillei on total dewlap height (cm m-2) of cane observed at four dates
Effect of relative leaf area and time of observation on cane dewlap height
The relationships between cane dewlap height and the relative leaf area (Lw) between P. paniculatum
or P. urvillei and cane at each observation date (e.g. 9 & 18 WAT in Fig. 4.5) showed a better
correlation from 9 WAT (Table 4.2). The poor relationship at 5 WAT may suggest that weed
competition between cane and the weeds was not apparent as they were still developing and, may be,
there needs to be a minimum period of exposure before any effect on cane can be observed.
weed=Purvweed=Ppan
Relative leaf area (Lw)0.4
700
0.2 0.8
100
0.6
400
0.0
300
600
200
500
-0.2
Cane dew
lap height (cm/m
2)9 WAT
weed=Purv
weed=Ppan
Relative leaf area (Lw)
400
600
0.2
800
1000
0.0 0.80.60.4
200
-0.2
Ca
ne
de
wla
p h
eig
ht (cm
/m2
)
18 WAT
Fig 4.5 Relationship between the relative leaf area (Lw) of P. paniculatum or P. urvillei transplanted 4 WAP and dewlap height of cane (cm m-2) observed at 9 WAT (left) and 18 WAT (right). Response curve are those from parameters given in Table 4.2.
Total dewlap height (cm m-2)
5 WAT 9 WAT 14 WAT 18 WAT
Weed
density
(plants m-2) P. pan P. urv P. pan P. urv P. pan P. urv P. pan P. urv
Weed-free 268 471 536 530
6 190 309 449 435 518 849 433 638
10 223 231 277 408 608 606 347 663
15 183 239 216 406 441 521 377 575
20 286 262 267 294 569 432 737 444
33 278 294 255 350 353 798 467 515
S.e.d. (d.f.) 86.8 (19) 114.9 (20) 217.5 (18) 191.1 (20)
CV % 42.0 39.3 47.0 44.9
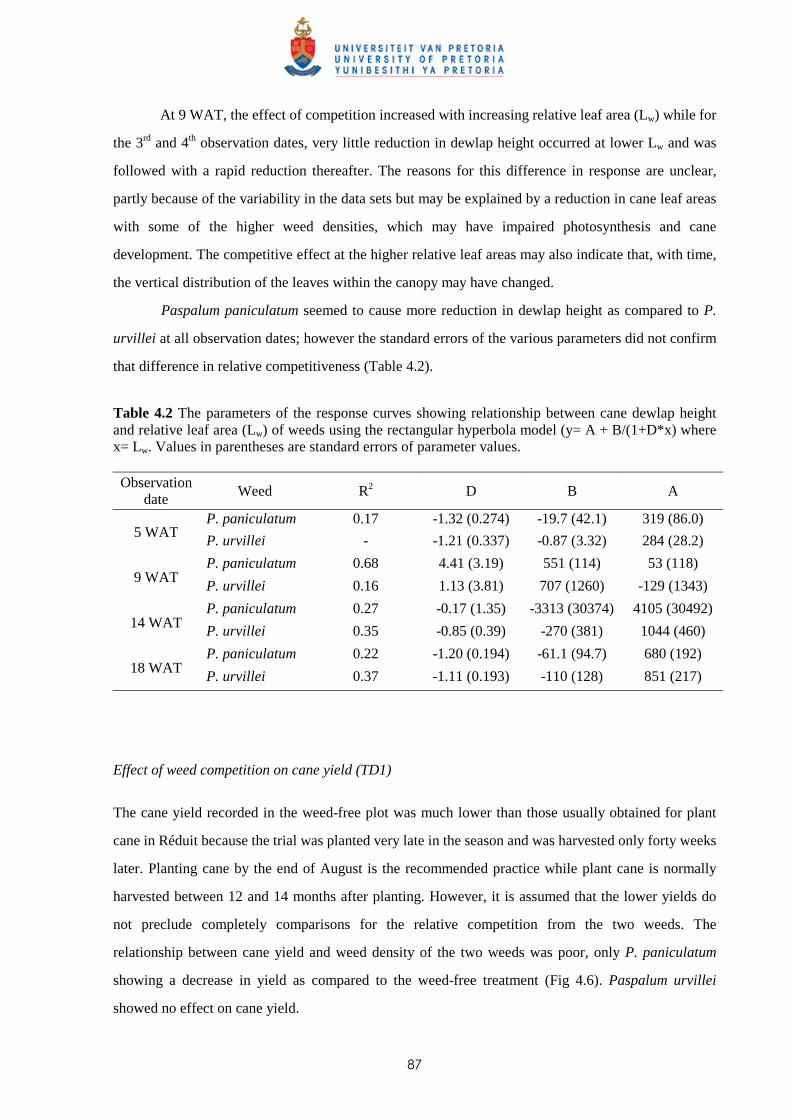
87
At 9 WAT, the effect of competition increased with increasing relative leaf area (Lw) while for
the 3rd and 4th observation dates, very little reduction in dewlap height occurred at lower Lw and was
followed with a rapid reduction thereafter. The reasons for this difference in response are unclear,
partly because of the variability in the data sets but may be explained by a reduction in cane leaf areas
with some of the higher weed densities, which may have impaired photosynthesis and cane
development. The competitive effect at the higher relative leaf areas may also indicate that, with time,
the vertical distribution of the leaves within the canopy may have changed.
Paspalum paniculatum seemed to cause more reduction in dewlap height as compared to P.
urvillei at all observation dates; however the standard errors of the various parameters did not confirm
that difference in relative competitiveness (Table 4.2).
Table 4.2 The parameters of the response curves showing relationship between cane dewlap height and relative leaf area (Lw) of weeds using the rectangular hyperbola model (y= A + B/(1+D*x) where x= Lw. Values in parentheses are standard errors of parameter values. Observation
date Weed R2 D B A
P. paniculatum 0.17 -1.32 (0.274) -19.7 (42.1) 319 (86.0) 5 WAT
P. urvillei - -1.21 (0.337) -0.87 (3.32) 284 (28.2)
P. paniculatum 0.68 4.41 (3.19) 551 (114) 53 (118) 9 WAT
P. urvillei 0.16 1.13 (3.81) 707 (1260) -129 (1343)
P. paniculatum 0.27 -0.17 (1.35) -3313 (30374) 4105 (30492) 14 WAT
P. urvillei 0.35 -0.85 (0.39) -270 (381) 1044 (460)
P. paniculatum 0.22 -1.20 (0.194) -61.1 (94.7) 680 (192) 18 WAT
P. urvillei 0.37 -1.11 (0.193) -110 (128) 851 (217)
Effect of weed competition on cane yield (TD1)
The cane yield recorded in the weed-free plot was much lower than those usually obtained for plant
cane in Réduit because the trial was planted very late in the season and was harvested only forty weeks
later. Planting cane by the end of August is the recommended practice while plant cane is normally
harvested between 12 and 14 months after planting. However, it is assumed that the lower yields do
not preclude completely comparisons for the relative competition from the two weeds. The
relationship between cane yield and weed density of the two weeds was poor, only P. paniculatum
showing a decrease in yield as compared to the weed-free treatment (Fig 4.6). Paspalum urvillei
showed no effect on cane yield.
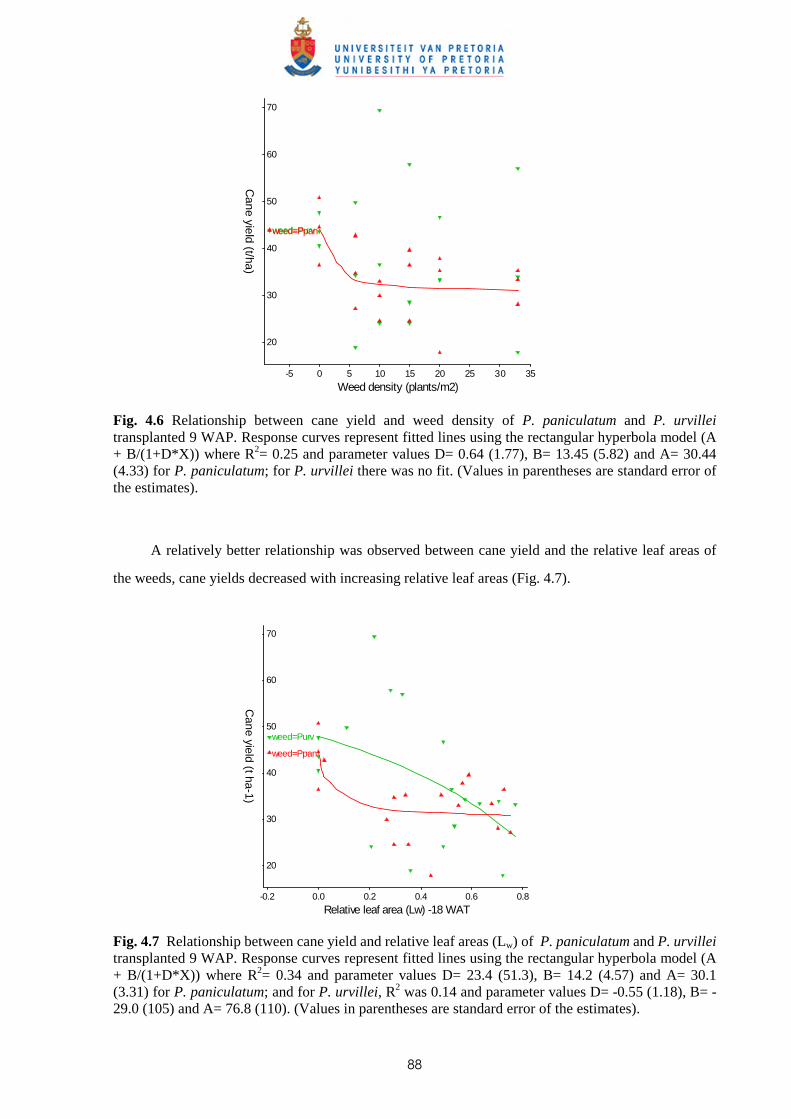
88
weed=Purvweed=Ppan
Weed density (plants/m2)
30
3510 30
50
60
25
70
5 20150
20
40
-5
Cane yield (t/ha)
Fig. 4.6 Relationship between cane yield and weed density of P. paniculatum and P. urvillei transplanted 9 WAP. Response curves represent fitted lines using the rectangular hyperbola model (A + B/(1+D*X)) where R2= 0.25 and parameter values D= 0.64 (1.77), B= 13.45 (5.82) and A= 30.44 (4.33) for P. paniculatum; for P. urvillei there was no fit. (Values in parentheses are standard error of the estimates).
A relatively better relationship was observed between cane yield and the relative leaf areas of
the weeds, cane yields decreased with increasing relative leaf areas (Fig. 4.7).
weed=Purv
weed=Ppan
Relative leaf area (Lw) -18 WAT
50
40
60
0.2
70
20
0.0
30
0.80.60.4-0.2
Cane yield (t ha-1)
Fig. 4.7 Relationship between cane yield and relative leaf areas (Lw) of P. paniculatum and P. urvillei transplanted 9 WAP. Response curves represent fitted lines using the rectangular hyperbola model (A + B/(1+D*X)) where R2= 0.34 and parameter values D= 23.4 (51.3), B= 14.2 (4.57) and A= 30.1 (3.31) for P. paniculatum; and for P. urvillei, R2 was 0.14 and parameter values D= -0.55 (1.18), B= -29.0 (105) and A= 76.8 (110). (Values in parentheses are standard error of the estimates).
89
Relative competitiveness (q value) of P. paniculatum and P. urvillei and time of observation
The loss in cane yield (compared to means of the weed-free treatment) within individual plots with the
same weed species and at the same date of observation was fitted with the corresponding relative leaf
area (Lw) values to determine the relative competitiveness ‘q’ values. At all dates, there was a
tendency for the q value for P. paniculatum to be higher (although differences not significant at P<
0.05) than that of P. urvillei (Table 4.3), as comparisons reported in Chapter 3.
Table 4.3 Relative competitiveness ‘q’ values for P. paniculatum and P. urvillei at different observation dates after transplanting weeds Relative competitiveness q value
Date of observation 5 WAT 9 WAT 14 WAT 18 WAT
P. paniculatum 0.31 (0.078) 0.28 (0.099) 0.28 (0.081) 0.27 (0.083)
P. urvillei 0.16 (0.073) 0.17 (0.136) 0.13 (0.123) 0.20 (0.109)
Values in parentheses represent standard errors (s.e.) of the estimated q value.
The relative competitiveness of both weed species did not change with the time of observations
as discussed by Kropff and Spitters (1991) and Kropff and van Laar (1993). A calculation of the
relative competitiveness q value with time was attempted using the values at 5 WAT as q0 (closer to
weed emergence). The relative growth rate of the leaf areas of cane and weed were calculated using
16.0oC as the base temperature for estimation of growing degree days (oC d) for sugar cane (Inman-
Bamber, 1994) and weed species (assumed to be similar to cane as data for weeds are not available).
Data were fitted into equation 3 (Eqn 3).
The estimated values showed that the observed q values were lower than the expected ones
(Table 4.4). According to the estimated values, the q value for both weed species should have
increased to a peak at the second observation date due to a relatively higher growth rate of the leaf area
of cane as compared the weed. The relatively lower q values recorded may have arisen due to the
difference in vertical distribution of the cane leaves compared to those of the weeds with time. The
difference in competitiveness between the two Paspalum species was maintained.
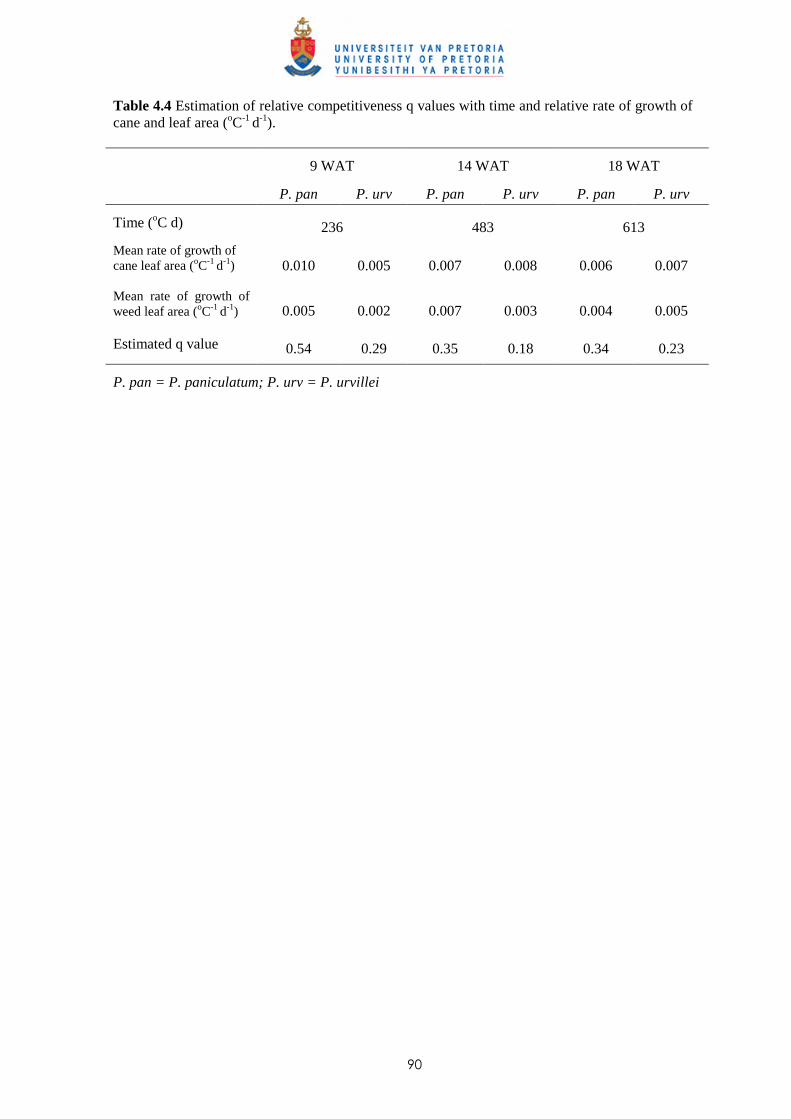
90
Table 4.4 Estimation of relative competitiveness q values with time and relative rate of growth of cane and leaf area (oC-1 d-1).
9 WAT 14 WAT 18 WAT
P. pan P. urv P. pan P. urv P. pan P. urv
Time (oC d) 236 483 613
Mean rate of growth of cane leaf area (oC-1 d-1)
0.010 0.005 0.007 0.008 0.006 0.007
Mean rate of growth of weed leaf area (oC-1 d-1) 0.005 0.002 0.007 0.003 0.004 0.005
Estimated q value 0.54 0.29 0.35 0.18 0.34 0.23
P. pan = P. paniculatum; P. urv = P. urvillei
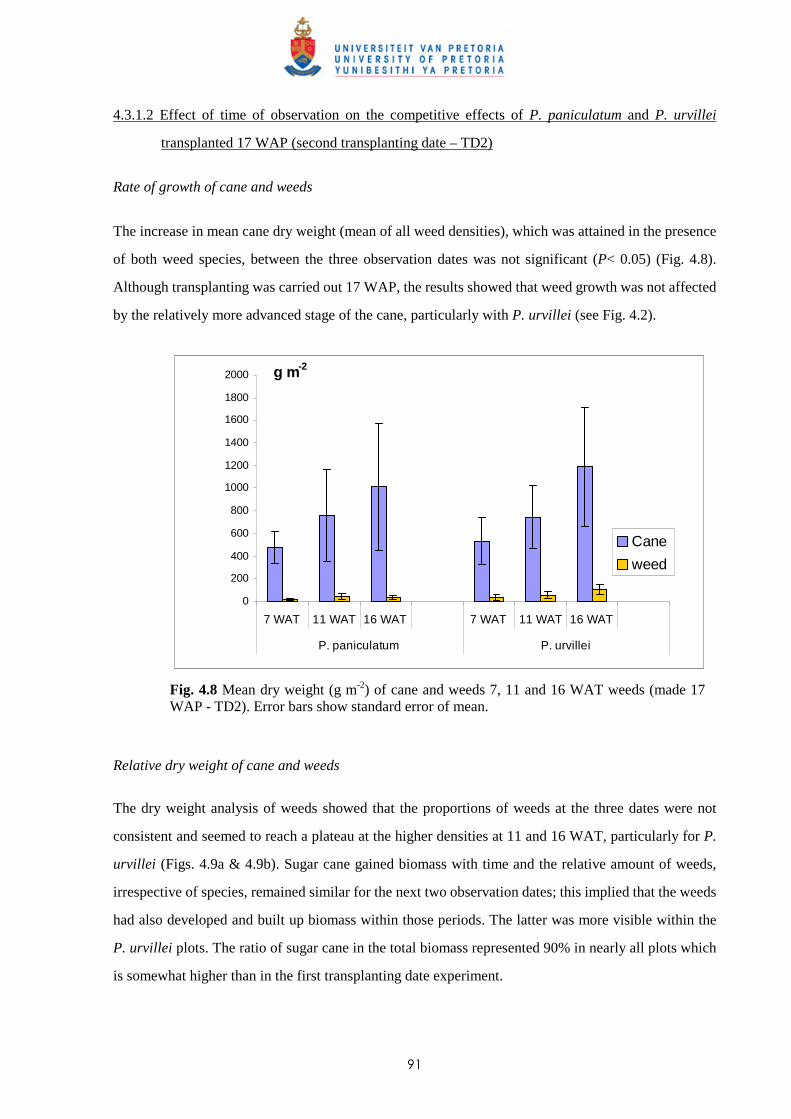
91
4.3.1.2 Effect of time of observation on the competitive effects of P. paniculatum and P. urvillei
transplanted 17 WAP (second transplanting date – TD2)
Rate of growth of cane and weeds
The increase in mean cane dry weight (mean of all weed densities), which was attained in the presence
of both weed species, between the three observation dates was not significant (P< 0.05) (Fig. 4.8).
Although transplanting was carried out 17 WAP, the results showed that weed growth was not affected
by the relatively more advanced stage of the cane, particularly with P. urvillei (see Fig. 4.2).
0
200
400
600
800
1000
1200
1400
1600
1800
2000
7 WAT 11 WAT 16 WAT 7 WAT 11 WAT 16 WAT
P. paniculatum P. urvillei
g m-2
Cane
weed
Fig. 4.8 Mean dry weight (g m-2) of cane and weeds 7, 11 and 16 WAT weeds (made 17 WAP - TD2). Error bars show standard error of mean.
Relative dry weight of cane and weeds
The dry weight analysis of weeds showed that the proportions of weeds at the three dates were not
consistent and seemed to reach a plateau at the higher densities at 11 and 16 WAT, particularly for P.
urvillei (Figs. 4.9a & 4.9b). Sugar cane gained biomass with time and the relative amount of weeds,
irrespective of species, remained similar for the next two observation dates; this implied that the weeds
had also developed and built up biomass within those periods. The latter was more visible within the
P. urvillei plots. The ratio of sugar cane in the total biomass represented 90% in nearly all plots which
is somewhat higher than in the first transplanting date experiment.
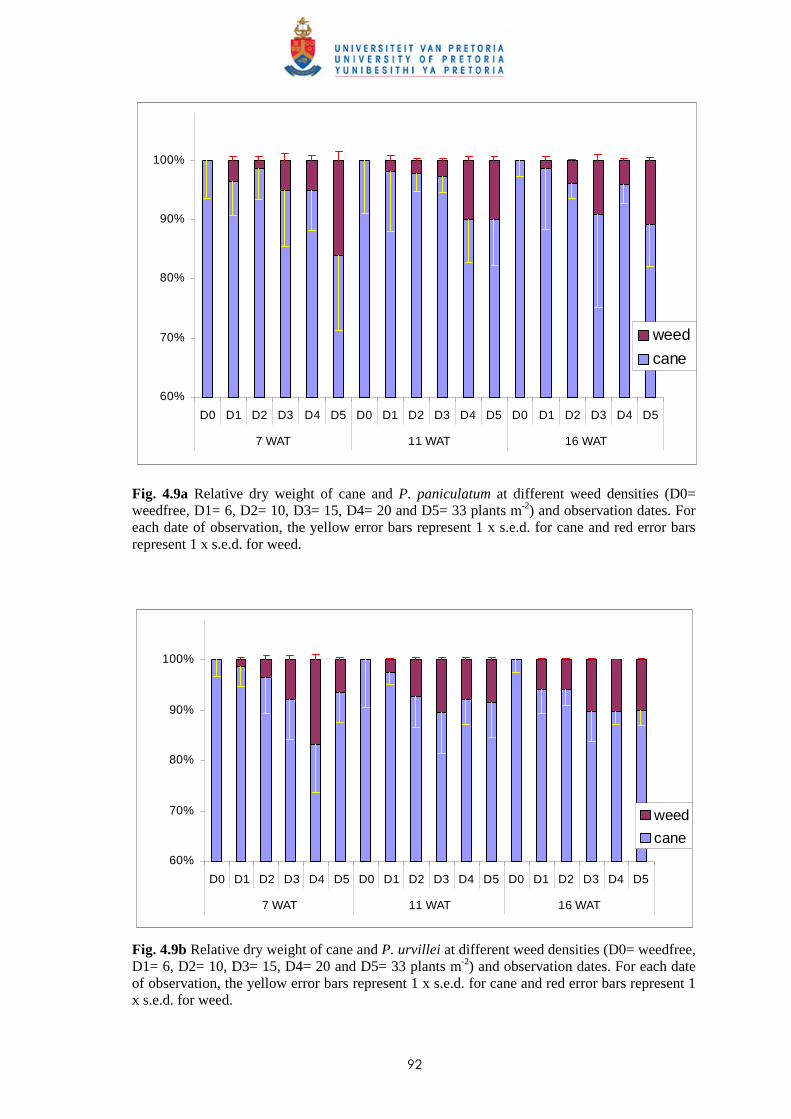
92
60%
70%
80%
90%
100%
D0 D1 D2 D3 D4 D5 D0 D1 D2 D3 D4 D5 D0 D1 D2 D3 D4 D5
7 WAT 11 WAT 16 WAT
weed
cane
Fig. 4.9a Relative dry weight of cane and P. paniculatum at different weed densities (D0= weedfree, D1= 6, D2= 10, D3= 15, D4= 20 and D5= 33 plants m-2) and observation dates. For each date of observation, the yellow error bars represent 1 x s.e.d. for cane and red error bars represent 1 x s.e.d. for weed.
60%
70%
80%
90%
100%
D0 D1 D2 D3 D4 D5 D0 D1 D2 D3 D4 D5 D0 D1 D2 D3 D4 D5
7 WAT 11 WAT 16 WAT
weed
cane
Fig. 4.9b Relative dry weight of cane and P. urvillei at different weed densities (D0= weedfree, D1= 6, D2= 10, D3= 15, D4= 20 and D5= 33 plants m-2) and observation dates. For each date of observation, the yellow error bars represent 1 x s.e.d. for cane and red error bars represent 1 x s.e.d. for weed.
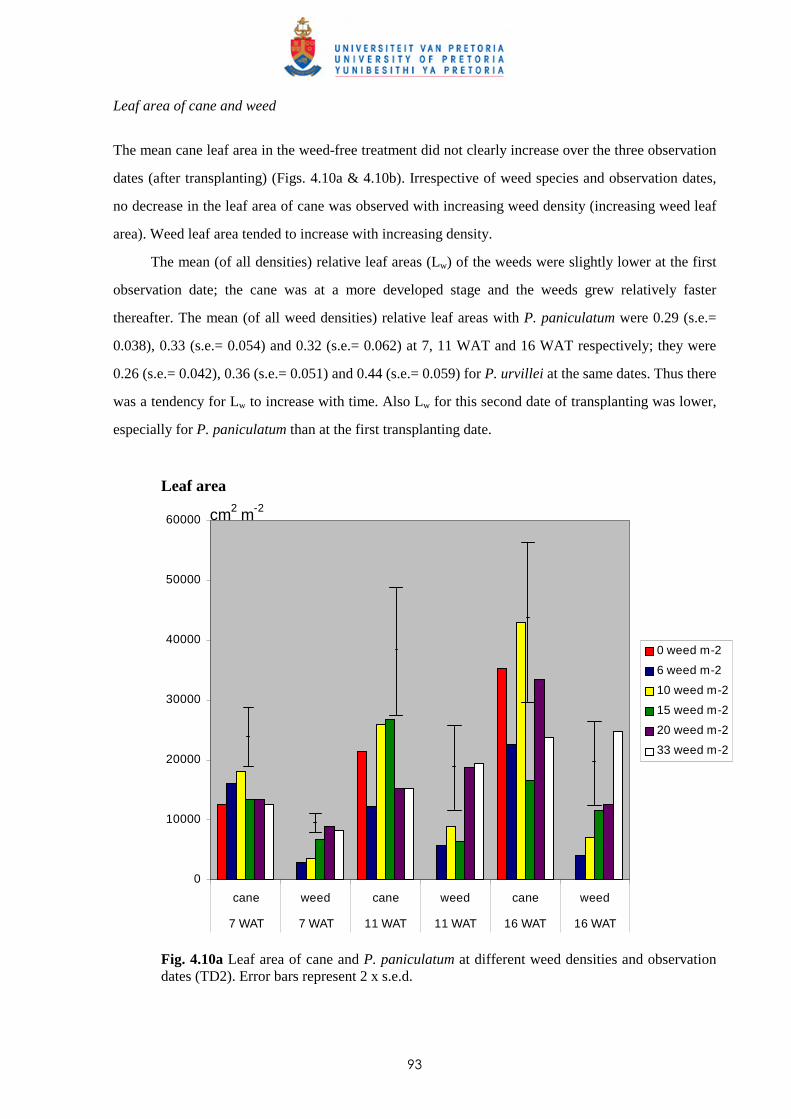
93
Leaf area of cane and weed
The mean cane leaf area in the weed-free treatment did not clearly increase over the three observation
dates (after transplanting) (Figs. 4.10a & 4.10b). Irrespective of weed species and observation dates,
no decrease in the leaf area of cane was observed with increasing weed density (increasing weed leaf
area). Weed leaf area tended to increase with increasing density.
The mean (of all densities) relative leaf areas (Lw) of the weeds were slightly lower at the first
observation date; the cane was at a more developed stage and the weeds grew relatively faster
thereafter. The mean (of all weed densities) relative leaf areas with P. paniculatum were 0.29 (s.e.=
0.038), 0.33 (s.e.= 0.054) and 0.32 (s.e.= 0.062) at 7, 11 WAT and 16 WAT respectively; they were
0.26 (s.e.= 0.042), 0.36 (s.e.= 0.051) and 0.44 (s.e.= 0.059) for P. urvillei at the same dates. Thus there
was a tendency for Lw to increase with time. Also Lw for this second date of transplanting was lower,
especially for P. paniculatum than at the first transplanting date.
Leaf area
0
10000
20000
30000
40000
50000
60000
cane weed cane weed cane weed
7 WAT 7 WAT 11 WAT 11 WAT 16 WAT 16 WAT
0 weed m-2
6 weed m-2
10 weed m-2
15 weed m-2
20 weed m-2
33 weed m-2
cm2 m-2
Fig. 4.10a Leaf area of cane and P. paniculatum at different weed densities and observation dates (TD2). Error bars represent 2 x s.e.d.
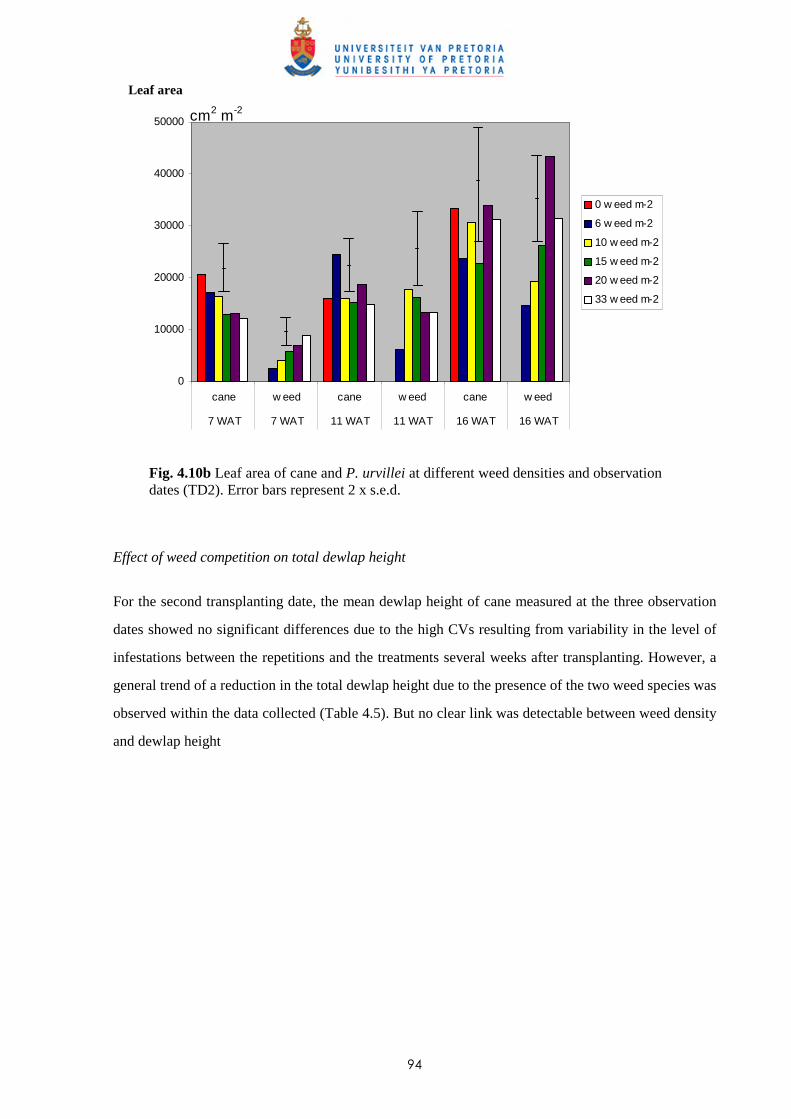
94
0
10000
20000
30000
40000
50000
cane w eed cane w eed cane w eed
7 WAT 7 WAT 11 WAT 11 WAT 16 WAT 16 WAT
0 w eed m-2
6 w eed m-2
10 w eed m-2
15 w eed m-2
20 w eed m-2
33 w eed m-2
cm2 m-2
Fig. 4.10b Leaf area of cane and P. urvillei at different weed densities and observation dates (TD2). Error bars represent 2 x s.e.d.
Effect of weed competition on total dewlap height
For the second transplanting date, the mean dewlap height of cane measured at the three observation
dates showed no significant differences due to the high CVs resulting from variability in the level of
infestations between the repetitions and the treatments several weeks after transplanting. However, a
general trend of a reduction in the total dewlap height due to the presence of the two weed species was
observed within the data collected (Table 4.5). But no clear link was detectable between weed density
and dewlap height
Leaf area
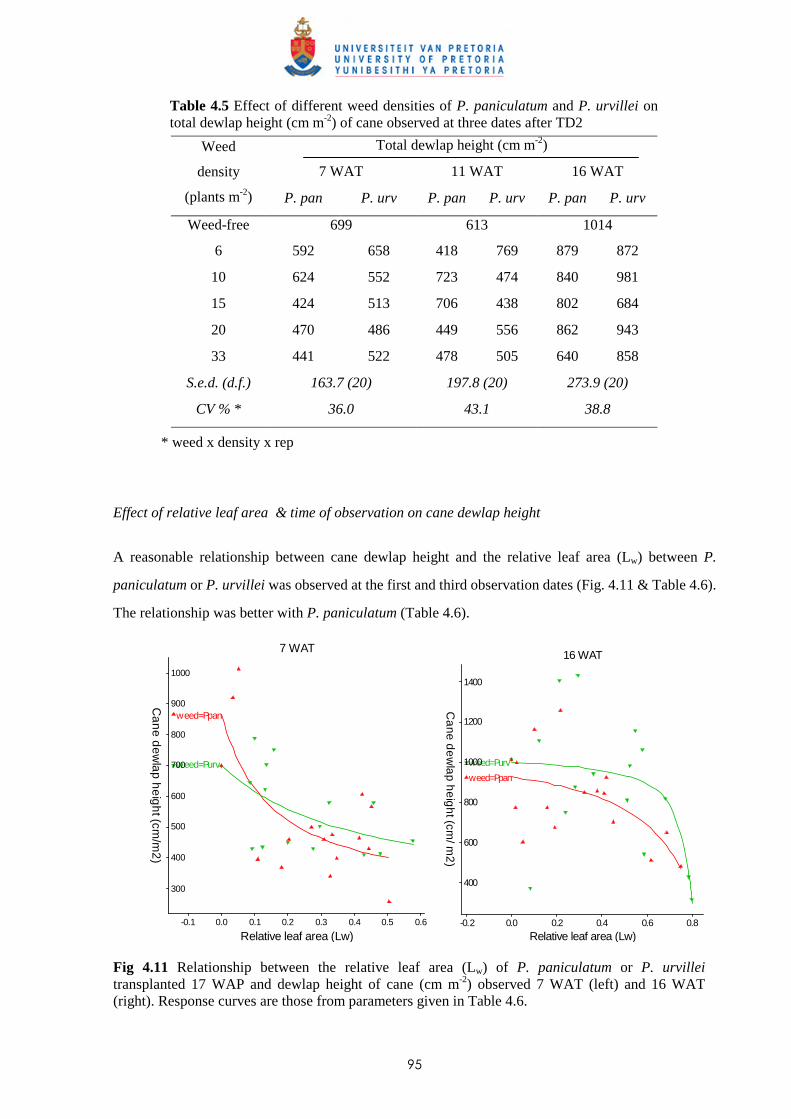
95
Table 4.5 Effect of different weed densities of P. paniculatum and P. urvillei on total dewlap height (cm m-2) of cane observed at three dates after TD2
* weed x density x rep
Effect of relative leaf area & time of observation on cane dewlap height
A reasonable relationship between cane dewlap height and the relative leaf area (Lw) between P.
paniculatum or P. urvillei was observed at the first and third observation dates (Fig. 4.11 & Table 4.6).
The relationship was better with P. paniculatum (Table 4.6).
weed=Purv
weed=Ppan
Relative leaf area (Lw)
700
900
0.2 0.6
1000
0.50.1 0.4
500
0.3
800
0.0
400
300
600
-0.1
Ca
ne
de
wla
p h
eig
ht (cm
/m2
)7 WAT
weed=Purv
weed=Ppan
Relative leaf area (Lw)
1000
1400
0.2 0.80.6
600
0.0 0.4
1200
400
800
-0.2
Ca
ne
de
wla
p h
eig
ht (cm
/ m2
)
16 WAT
Fig 4.11 Relationship between the relative leaf area (Lw) of P. paniculatum or P. urvillei transplanted 17 WAP and dewlap height of cane (cm m-2) observed 7 WAT (left) and 16 WAT (right). Response curves are those from parameters given in Table 4.6.
Total dewlap height (cm m-2)
7 WAT 11 WAT 16 WAT
Weed
density
(plants m-2) P. pan P. urv P. pan P. urv P. pan P. urv
Weed-free 699 613 1014
6 592 658 418 769 879 872
10 624 552 723 474 840 981
15 424 513 706 438 802 684
20 470 486 449 556 862 943
33 441 522 478 505 640 858
S.e.d. (d.f.) 163.7 (20) 197.8 (20) 273.9 (20)
CV % * 36.0 43.1 38.8
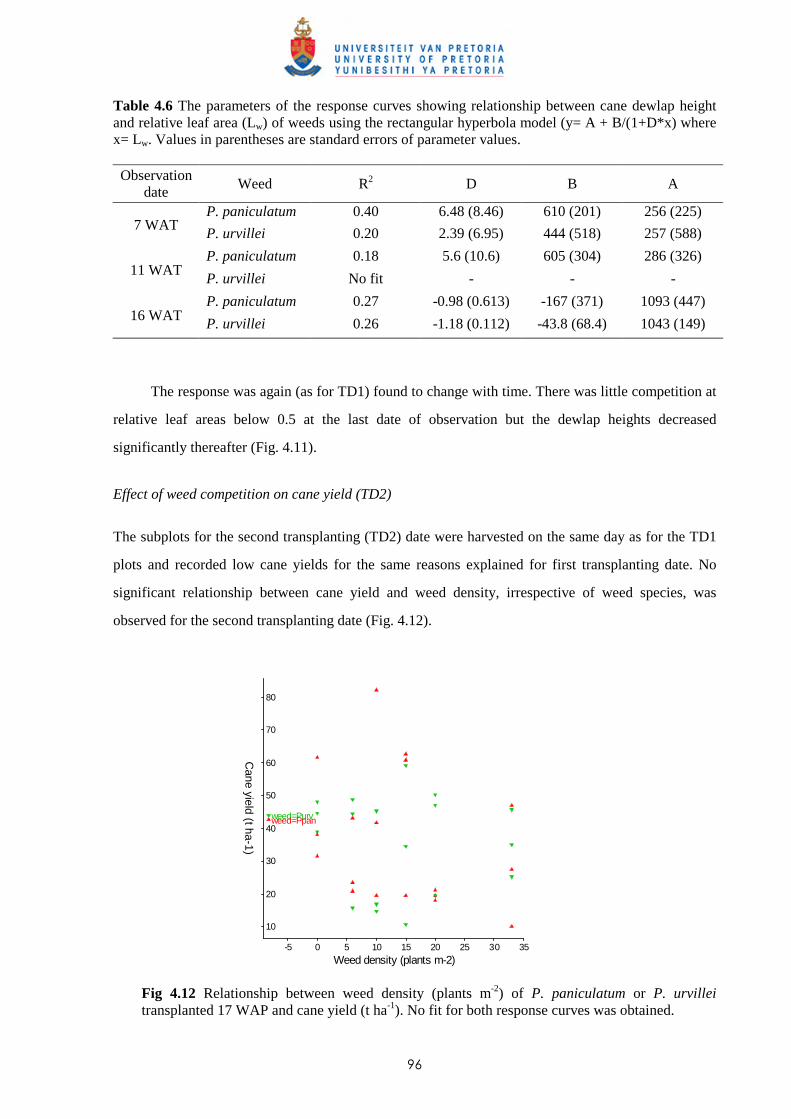
96
Table 4.6 The parameters of the response curves showing relationship between cane dewlap height and relative leaf area (Lw) of weeds using the rectangular hyperbola model (y= A + B/(1+D*x) where x= Lw. Values in parentheses are standard errors of parameter values. Observation
date Weed R2 D B A
P. paniculatum 0.40 6.48 (8.46) 610 (201) 256 (225) 7 WAT
P. urvillei 0.20 2.39 (6.95) 444 (518) 257 (588)
P. paniculatum 0.18 5.6 (10.6) 605 (304) 286 (326) 11 WAT
P. urvillei No fit - - -
P. paniculatum 0.27 -0.98 (0.613) -167 (371) 1093 (447) 16 WAT
P. urvillei 0.26 -1.18 (0.112) -43.8 (68.4) 1043 (149)
The response was again (as for TD1) found to change with time. There was little competition at
relative leaf areas below 0.5 at the last date of observation but the dewlap heights decreased
significantly thereafter (Fig. 4.11).
Effect of weed competition on cane yield (TD2)
The subplots for the second transplanting (TD2) date were harvested on the same day as for the TD1
plots and recorded low cane yields for the same reasons explained for first transplanting date. No
significant relationship between cane yield and weed density, irrespective of weed species, was
observed for the second transplanting date (Fig. 4.12).
weed=Purvweed=Ppan
Weed density (plants m-2)
40
50
60
10
70
80
5
10
30
35300 252015
20
-5
Cane yield (t ha-1)
Fig 4.12 Relationship between weed density (plants m-2) of P. paniculatum or P. urvillei transplanted 17 WAP and cane yield (t ha-1). No fit for both response curves was obtained.
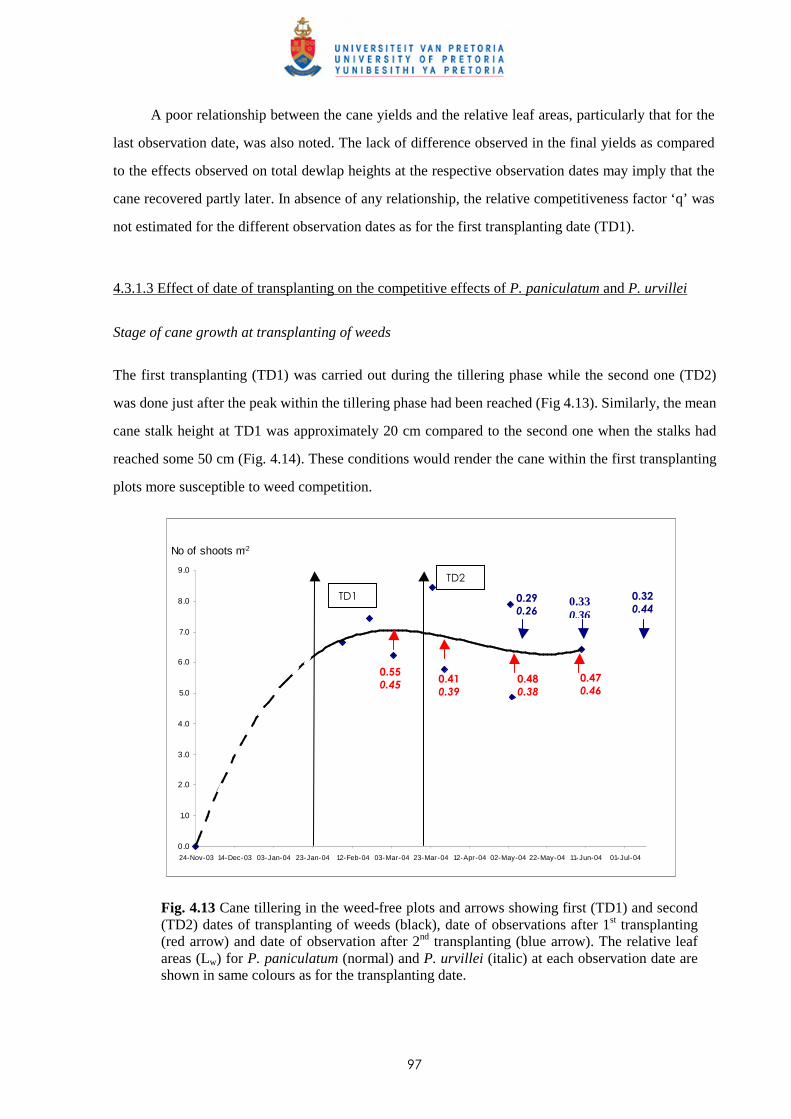
97
A poor relationship between the cane yields and the relative leaf areas, particularly that for the
last observation date, was also noted. The lack of difference observed in the final yields as compared
to the effects observed on total dewlap heights at the respective observation dates may imply that the
cane recovered partly later. In absence of any relationship, the relative competitiveness factor ‘q’ was
not estimated for the different observation dates as for the first transplanting date (TD1).
4.3.1.3 Effect of date of transplanting on the competitive effects of P. paniculatum and P. urvillei
Stage of cane growth at transplanting of weeds
The first transplanting (TD1) was carried out during the tillering phase while the second one (TD2)
was done just after the peak within the tillering phase had been reached (Fig 4.13). Similarly, the mean
cane stalk height at TD1 was approximately 20 cm compared to the second one when the stalks had
reached some 50 cm (Fig. 4.14). These conditions would render the cane within the first transplanting
plots more susceptible to weed competition.
No of shoots m-2
0.0
1.0
2.0
3.0
4.0
5.0
6.0
7.0
8.0
9.0
24-Nov-03 14-Dec-03 03-Jan-04 23-Jan-04 12-Feb-04 03-Mar-04 23-Mar-04 12-Apr-04 02-May-04 22-May-04 11-Jun-04 01-Jul-04
Fig. 4.13 Cane tillering in the weed-free plots and arrows showing first (TD1) and second (TD2) dates of transplanting of weeds (black), date of observations after 1st transplanting (red arrow) and date of observation after 2nd transplanting (blue arrow). The relative leaf areas (Lw) for P. paniculatum (normal) and P. urvillei (italic) at each observation date are shown in same colours as for the transplanting date.
TD1
TD2
0.55
0.45 0.41
0.39
0.48
0.38
0.47 0.46
0.29 0.26
0.33 0.36
0.32
0.44
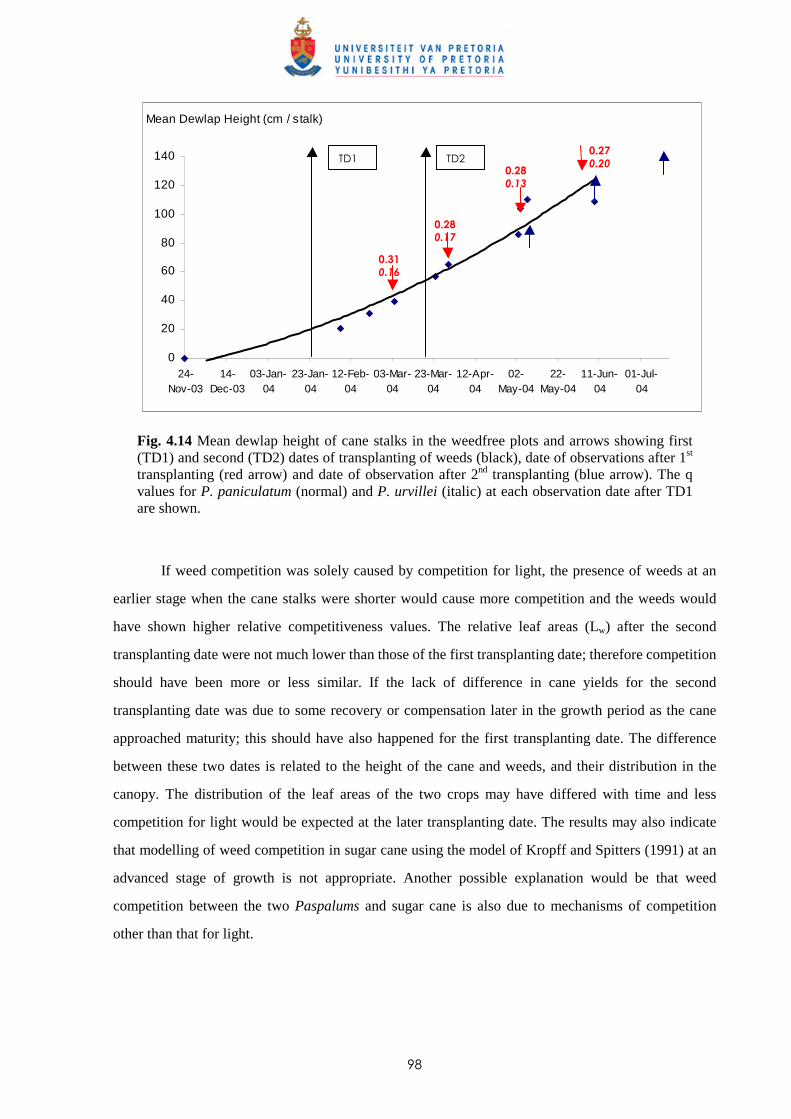
98
Mean Dewlap Height (cm / stalk)
0
20
40
60
80
100
120
140
24-Nov-03
14-Dec-03
03-Jan-04
23-Jan-04
12-Feb-04
03-Mar-04
23-Mar-04
12-Apr-04
02-May-04
22-May-04
11-Jun-04
01-Jul-04
Fig. 4.14 Mean dewlap height of cane stalks in the weedfree plots and arrows showing first (TD1) and second (TD2) dates of transplanting of weeds (black), date of observations after 1st transplanting (red arrow) and date of observation after 2nd transplanting (blue arrow). The q values for P. paniculatum (normal) and P. urvillei (italic) at each observation date after TD1 are shown.
If weed competition was solely caused by competition for light, the presence of weeds at an
earlier stage when the cane stalks were shorter would cause more competition and the weeds would
have shown higher relative competitiveness values. The relative leaf areas (Lw) after the second
transplanting date were not much lower than those of the first transplanting date; therefore competition
should have been more or less similar. If the lack of difference in cane yields for the second
transplanting date was due to some recovery or compensation later in the growth period as the cane
approached maturity; this should have also happened for the first transplanting date. The difference
between these two dates is related to the height of the cane and weeds, and their distribution in the
canopy. The distribution of the leaf areas of the two crops may have differed with time and less
competition for light would be expected at the later transplanting date. The results may also indicate
that modelling of weed competition in sugar cane using the model of Kropff and Spitters (1991) at an
advanced stage of growth is not appropriate. Another possible explanation would be that weed
competition between the two Paspalums and sugar cane is also due to mechanisms of competition
other than that for light.
TD1 TD2
0.31
0.16
0.28 0.17
0.28
0.13
0.27
0.20
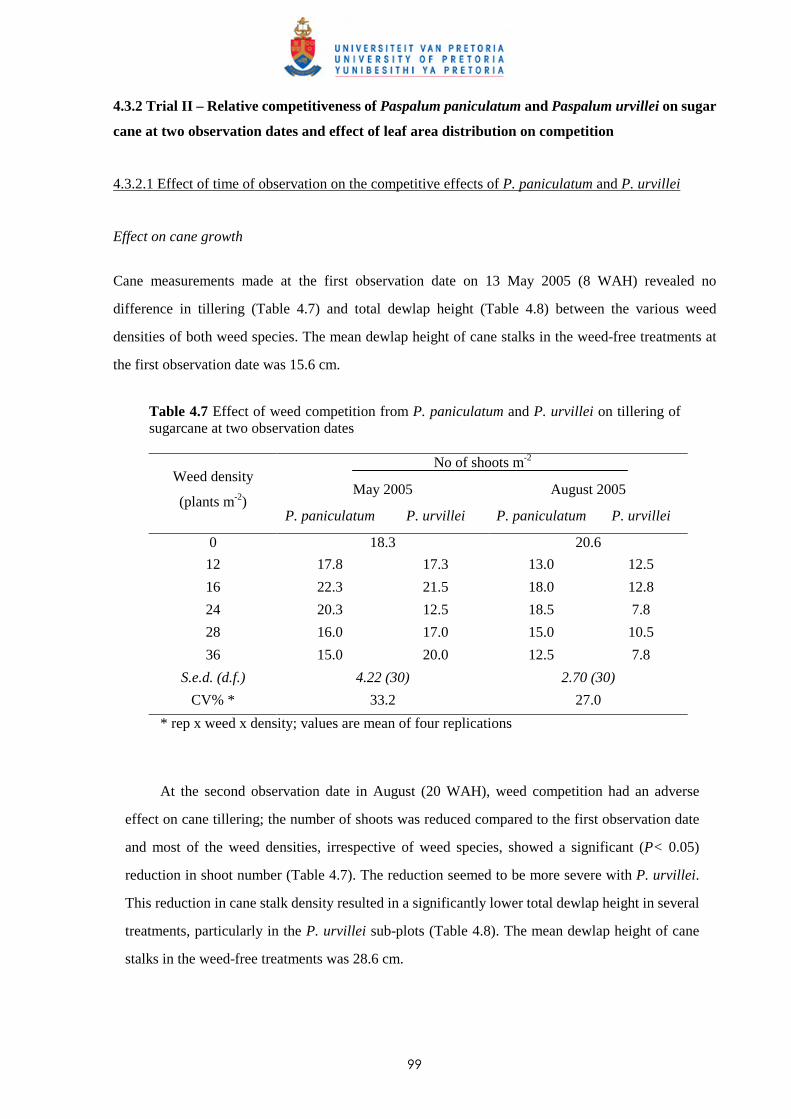
99
4.3.2 Trial II – Relative competitiveness of Paspalum paniculatum and Paspalum urvillei on sugar
cane at two observation dates and effect of leaf area distribution on competition
4.3.2.1 Effect of time of observation on the competitive effects of P. paniculatum and P. urvillei
Effect on cane growth
Cane measurements made at the first observation date on 13 May 2005 (8 WAH) revealed no
difference in tillering (Table 4.7) and total dewlap height (Table 4.8) between the various weed
densities of both weed species. The mean dewlap height of cane stalks in the weed-free treatments at
the first observation date was 15.6 cm.
Table 4.7 Effect of weed competition from P. paniculatum and P. urvillei on tillering of sugarcane at two observation dates
No of shoots m-2
May 2005 August 2005 Weed density
(plants m-2) P. paniculatum P. urvillei P. paniculatum P. urvillei
0 18.3 20.6
12 17.8 17.3 13.0 12.5
16 22.3 21.5 18.0 12.8
24 20.3 12.5 18.5 7.8
28 16.0 17.0 15.0 10.5
36 15.0 20.0 12.5 7.8
S.e.d. (d.f.) 4.22 (30) 2.70 (30)
CV% * 33.2 27.0
* rep x weed x density; values are mean of four replications
At the second observation date in August (20 WAH), weed competition had an adverse
effect on cane tillering; the number of shoots was reduced compared to the first observation date
and most of the weed densities, irrespective of weed species, showed a significant (P< 0.05)
reduction in shoot number (Table 4.7). The reduction seemed to be more severe with P. urvillei.
This reduction in cane stalk density resulted in a significantly lower total dewlap height in several
treatments, particularly in the P. urvillei sub-plots (Table 4.8). The mean dewlap height of cane
stalks in the weed-free treatments was 28.6 cm.
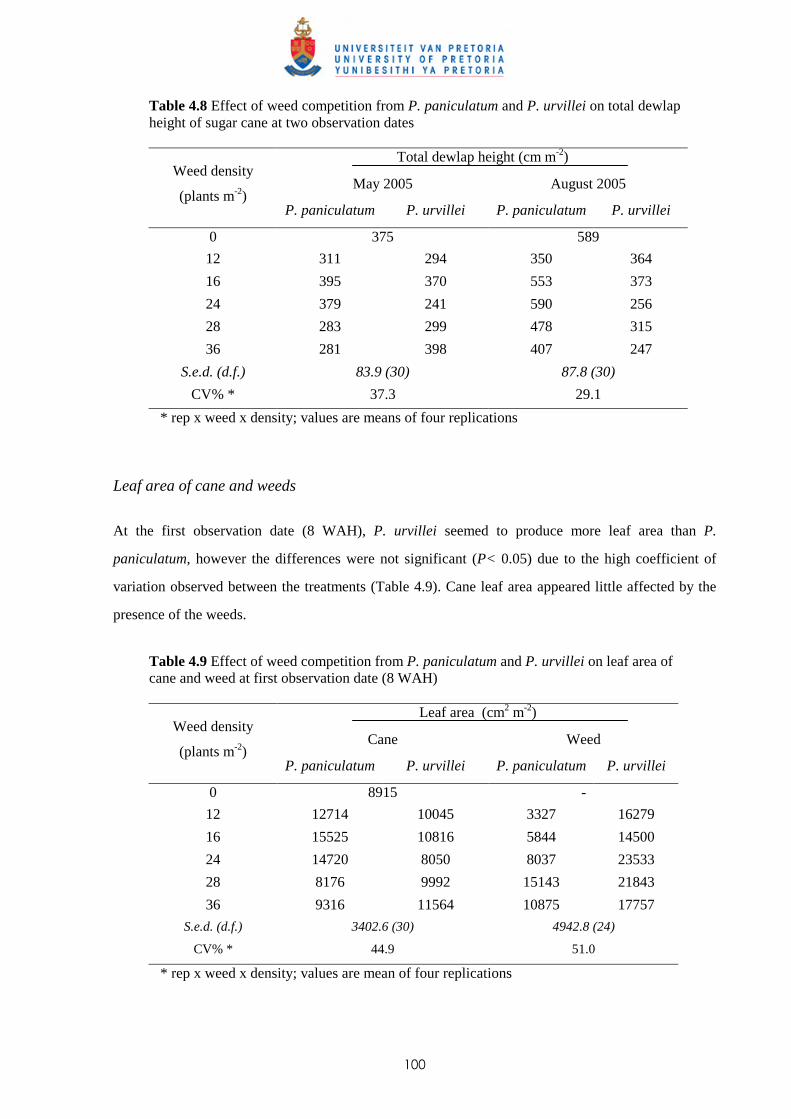
100
Table 4.8 Effect of weed competition from P. paniculatum and P. urvillei on total dewlap height of sugar cane at two observation dates
Total dewlap height (cm m-2)
May 2005 August 2005 Weed density
(plants m-2) P. paniculatum P. urvillei P. paniculatum P. urvillei
0 375 589
12 311 294 350 364
16 395 370 553 373
24 379 241 590 256
28 283 299 478 315
36 281 398 407 247
S.e.d. (d.f.) 83.9 (30) 87.8 (30)
CV% * 37.3 29.1
* rep x weed x density; values are means of four replications
Leaf area of cane and weeds
At the first observation date (8 WAH), P. urvillei seemed to produce more leaf area than P.
paniculatum, however the differences were not significant (P< 0.05) due to the high coefficient of
variation observed between the treatments (Table 4.9). Cane leaf area appeared little affected by the
presence of the weeds.
Table 4.9 Effect of weed competition from P. paniculatum and P. urvillei on leaf area of cane and weed at first observation date (8 WAH)
Leaf area (cm2 m-2)
Cane Weed Weed density
(plants m-2) P. paniculatum P. urvillei P. paniculatum P. urvillei
0 8915 -
12 12714 10045 3327 16279
16 15525 10816 5844 14500
24 14720 8050 8037 23533
28 8176 9992 15143 21843
36 9316 11564 10875 17757
S.e.d. (d.f.) 3402.6 (30) 4942.8 (24)
CV% * 44.9 51.0
* rep x weed x density; values are mean of four replications
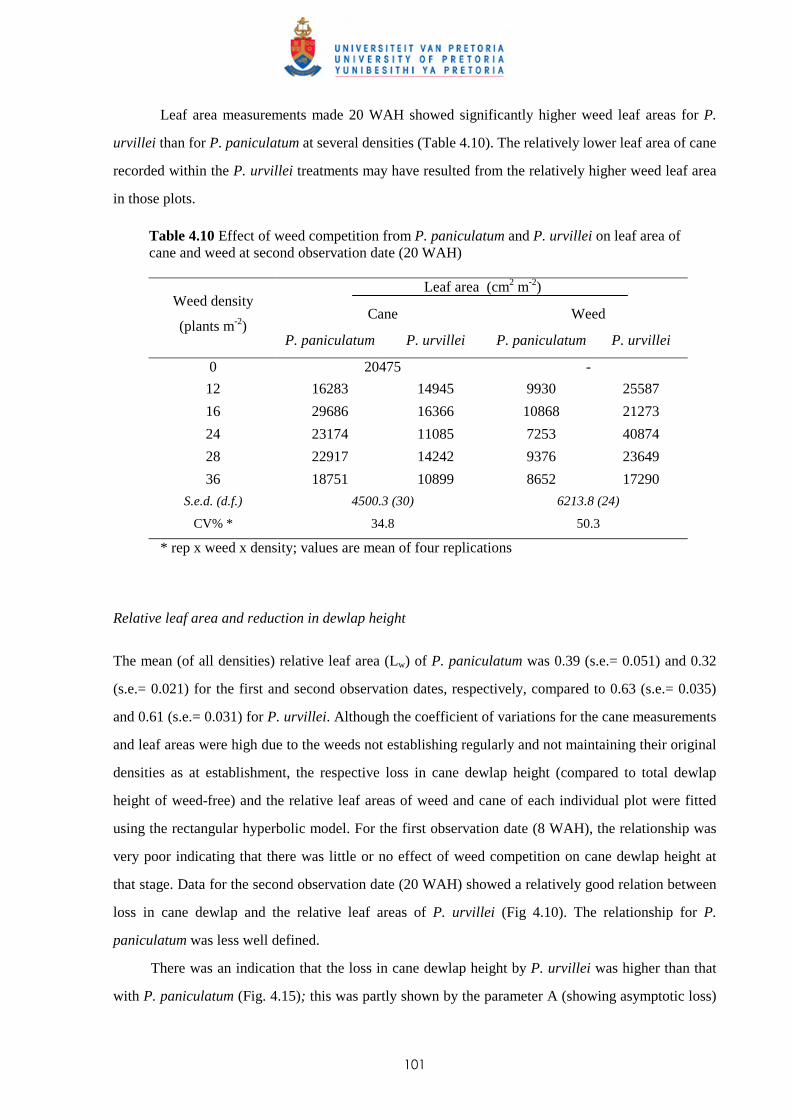
101
Leaf area measurements made 20 WAH showed significantly higher weed leaf areas for P.
urvillei than for P. paniculatum at several densities (Table 4.10). The relatively lower leaf area of cane
recorded within the P. urvillei treatments may have resulted from the relatively higher weed leaf area
in those plots.
Table 4.10 Effect of weed competition from P. paniculatum and P. urvillei on leaf area of cane and weed at second observation date (20 WAH)
Leaf area (cm2 m-2)
Cane Weed Weed density
(plants m-2) P. paniculatum P. urvillei P. paniculatum P. urvillei
0 20475 -
12 16283 14945 9930 25587
16 29686 16366 10868 21273
24 23174 11085 7253 40874
28 22917 14242 9376 23649
36 18751 10899 8652 17290
S.e.d. (d.f.) 4500.3 (30) 6213.8 (24)
CV% * 34.8 50.3
* rep x weed x density; values are mean of four replications
Relative leaf area and reduction in dewlap height
The mean (of all densities) relative leaf area (Lw) of P. paniculatum was 0.39 (s.e.= 0.051) and 0.32
(s.e.= 0.021) for the first and second observation dates, respectively, compared to 0.63 (s.e.= 0.035)
and 0.61 (s.e.= 0.031) for P. urvillei. Although the coefficient of variations for the cane measurements
and leaf areas were high due to the weeds not establishing regularly and not maintaining their original
densities as at establishment, the respective loss in cane dewlap height (compared to total dewlap
height of weed-free) and the relative leaf areas of weed and cane of each individual plot were fitted
using the rectangular hyperbolic model. For the first observation date (8 WAH), the relationship was
very poor indicating that there was little or no effect of weed competition on cane dewlap height at
that stage. Data for the second observation date (20 WAH) showed a relatively good relation between
loss in cane dewlap and the relative leaf areas of P. urvillei (Fig 4.10). The relationship for P.
paniculatum was less well defined.
There was an indication that the loss in cane dewlap height by P. urvillei was higher than that
with P. paniculatum (Fig. 4.15); this was partly shown by the parameter A (showing asymptotic loss)
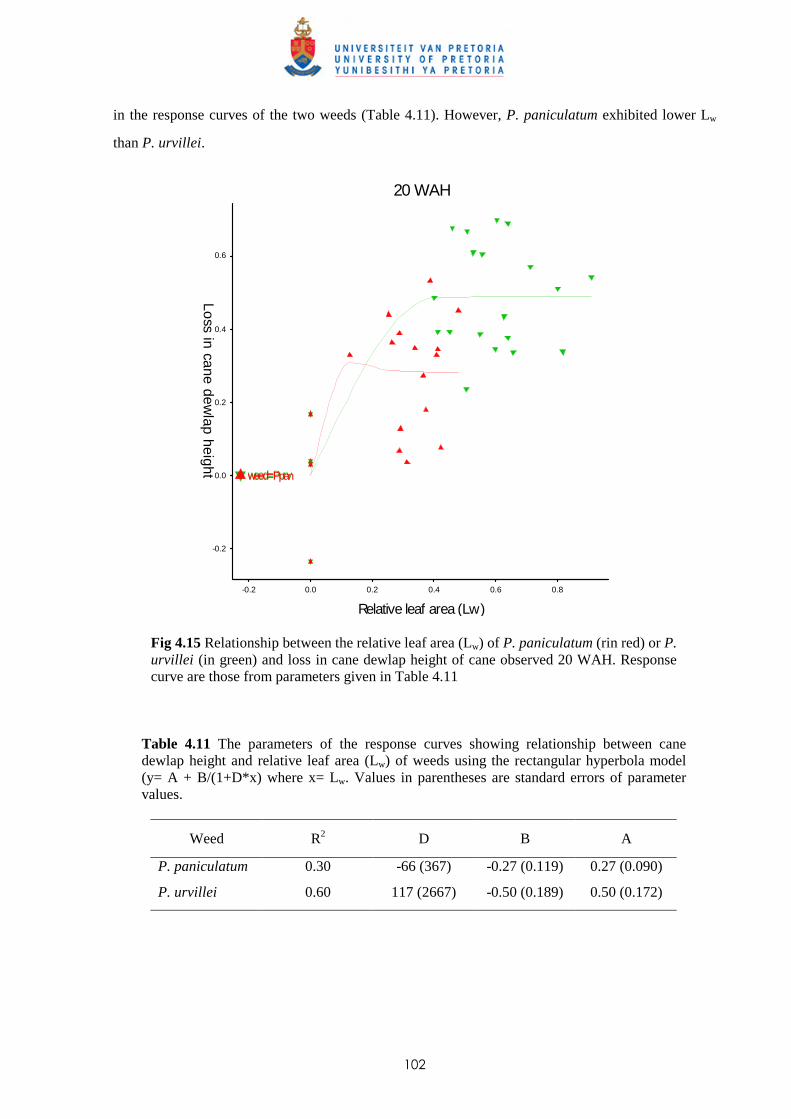
102
in the response curves of the two weeds (Table 4.11). However, P. paniculatum exhibited lower Lw
than P. urvillei.
weed=Purvweed=Ppan
Relative leaf area (Lw)
0.0
0.2
0.2
0.4
0.6
0.0 0.80.60.4
-0.2
-0.2Loss in cane dew
lap height
20 WAH
Fig 4.15 Relationship between the relative leaf area (Lw) of P. paniculatum (rin red) or P. urvillei (in green) and loss in cane dewlap height of cane observed 20 WAH. Response curve are those from parameters given in Table 4.11
Table 4.11 The parameters of the response curves showing relationship between cane dewlap height and relative leaf area (Lw) of weeds using the rectangular hyperbola model (y= A + B/(1+D*x) where x= Lw. Values in parentheses are standard errors of parameter values.
Weed R2 D B A
P. paniculatum 0.30 -66 (367) -0.27 (0.119) 0.27 (0.090)
P. urvillei 0.60 117 (2667) -0.50 (0.189) 0.50 (0.172)
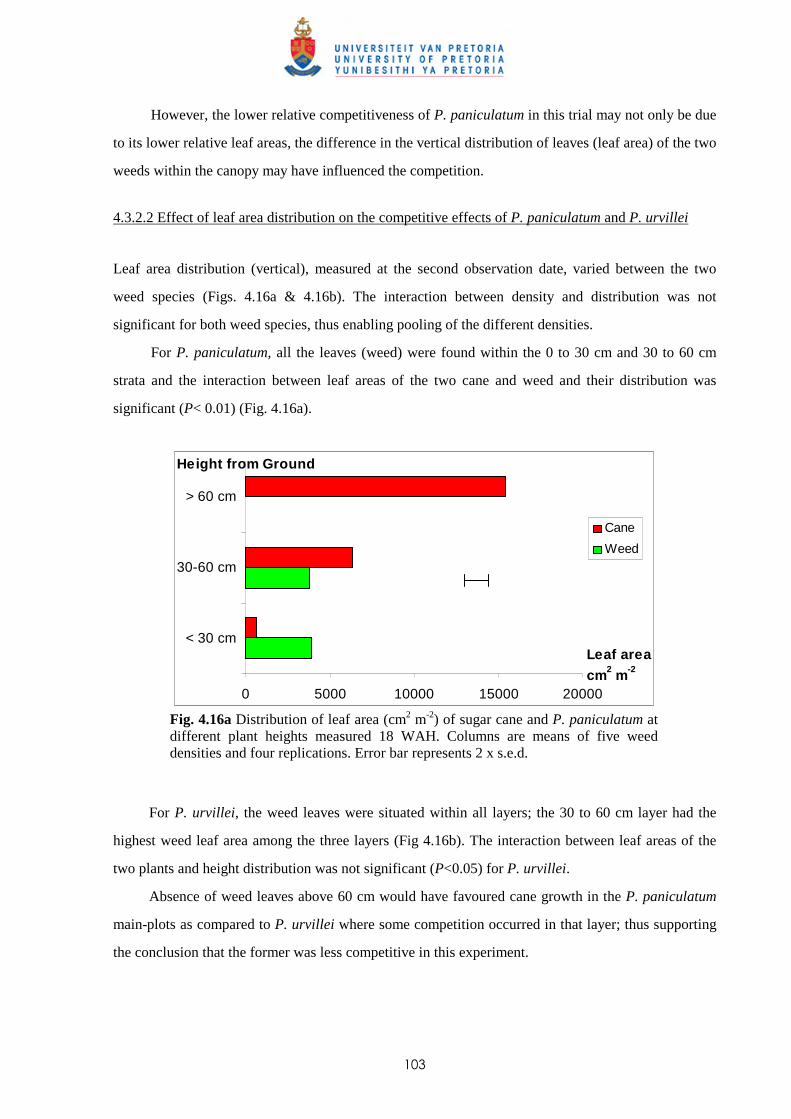
103
However, the lower relative competitiveness of P. paniculatum in this trial may not only be due
to its lower relative leaf areas, the difference in the vertical distribution of leaves (leaf area) of the two
weeds within the canopy may have influenced the competition.
4.3.2.2 Effect of leaf area distribution on the competitive effects of P. paniculatum and P. urvillei
Leaf area distribution (vertical), measured at the second observation date, varied between the two
weed species (Figs. 4.16a & 4.16b). The interaction between density and distribution was not
significant for both weed species, thus enabling pooling of the different densities.
For P. paniculatum, all the leaves (weed) were found within the 0 to 30 cm and 30 to 60 cm
strata and the interaction between leaf areas of the two cane and weed and their distribution was
significant (P< 0.01) (Fig. 4.16a).
0 5000 10000 15000 20000
< 30 cm
30-60 cm
> 60 cm
Leaf area
cm2 m-2
Height from Ground
Cane
Weed
Fig. 4.16a Distribution of leaf area (cm2 m-2) of sugar cane and P. paniculatum at different plant heights measured 18 WAH. Columns are means of five weed densities and four replications. Error bar represents 2 x s.e.d.
For P. urvillei, the weed leaves were situated within all layers; the 30 to 60 cm layer had the
highest weed leaf area among the three layers (Fig 4.16b). The interaction between leaf areas of the
two plants and height distribution was not significant (P<0.05) for P. urvillei.
Absence of weed leaves above 60 cm would have favoured cane growth in the P. paniculatum
main-plots as compared to P. urvillei where some competition occurred in that layer; thus supporting
the conclusion that the former was less competitive in this experiment.
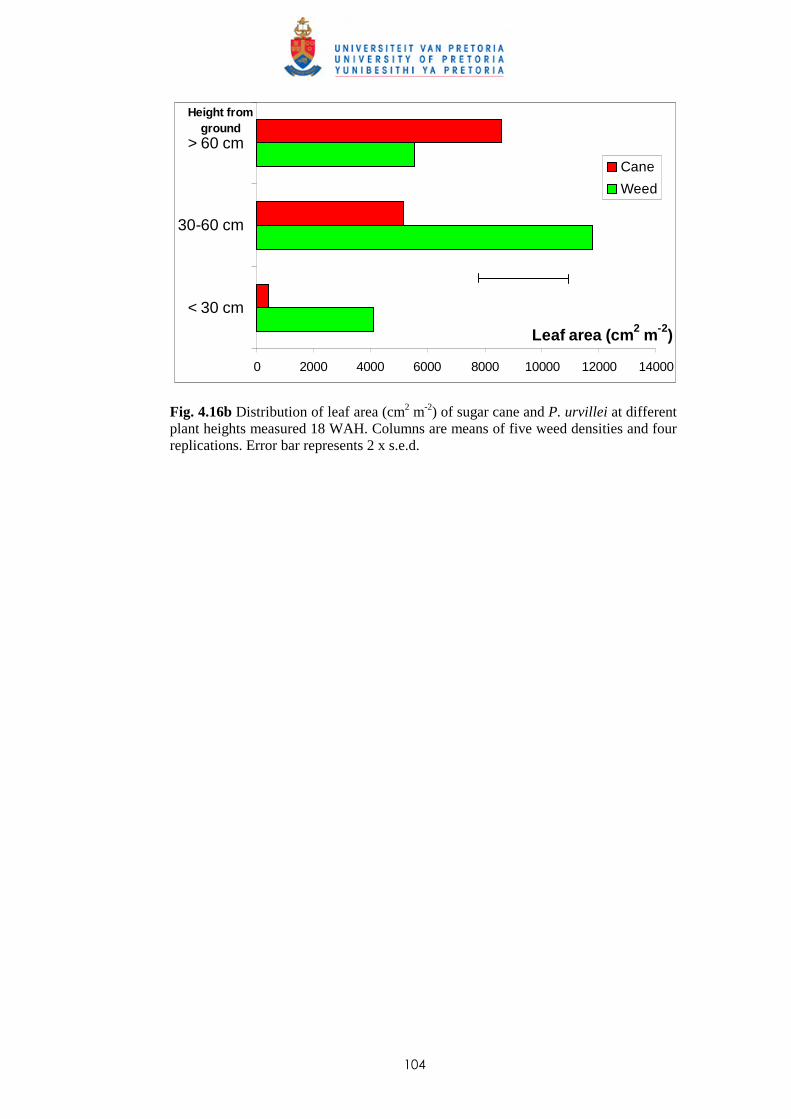
104
0 2000 4000 6000 8000 10000 12000 14000
< 30 cm
30-60 cm
> 60 cm
Height from ground
Leaf area (cm2 m-2)
Cane
Weed
Fig. 4.16b Distribution of leaf area (cm2 m-2) of sugar cane and P. urvillei at different plant heights measured 18 WAH. Columns are means of five weed densities and four replications. Error bar represents 2 x s.e.d.
105
4.3.3 Trial III – Relative competitiveness of Paspalum paniculatum and Paspalum urvillei at two
transplanting dates in sugar cane and effect of leaf area distribution on competition
4.3.3.1 Effect of time of observation on the competitive effects of P. paniculatum and P. urvillei
transplanted 4 WAP (first transplanting date – TD1)
Increase in total cane dewlap height and effect of weed competition
The mean dewlap height of cane within the weed-free treatments increased exponentially up to the
third observation date, with a peak of more than 50 cm m-2 per week increase between the 13th and 18th
week after planting. The rate of increase in dewlap height slowed down between the third and fourth
observation dates.
Total dewlap heights were not significantly (P < 0.05) affected by the different weed densities
except for the highest density 6 WAT and the three more densely infested plots 13 WAT (Table 4.12).
The lack of difference, particularly for observations made 9 WAT and 18 WAT, is explained by the
high coefficients of variation (CV%) observed, as the weed infestations were not consistent and
developed differently compared to their respective initial densities at transplanting. Table 4.12 Effect of different weed densities of P. paniculatum and P. urvillei on total dewlap height (cm m-2) of cane observed at four dates
P. pan = P. paniculatum; P. urv = P. urvillei
Date of observation
6 WAT 9 WAT 13 WAT 18 WAT
Weed
density
(plants m-2) P. pan P. urv P. pan P. urv P. pan P. urv P. pan P. urv
Weed-free 57.4 100.4 314 406
4 52.2 39.7 112.5 80.1 283 219 342 396
8 44.2 42.5 82.0 126.7 255 212 373 212
16 68.2 38.5 121.7 62.2 171 221 348 320
32 44.2 59.7 97.2 95.5 177 163 355 353
48 30.0 33.2 111.5 81.0 190 211 373 246
S.e.d. (d.f.) 11.85 (30) 35.55 (28) 67.7 (30) 110.3 (30)
CV % 35.4 51.5 42.1 45.4
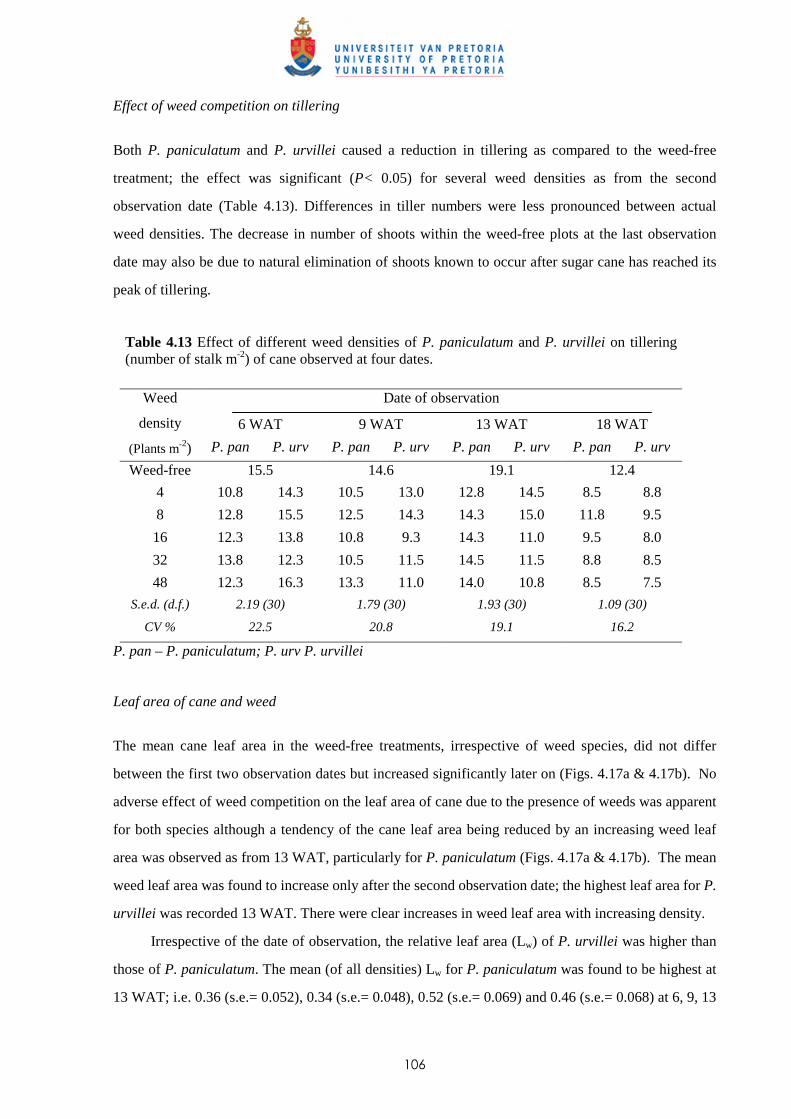
106
Effect of weed competition on tillering
Both P. paniculatum and P. urvillei caused a reduction in tillering as compared to the weed-free
treatment; the effect was significant (P< 0.05) for several weed densities as from the second
observation date (Table 4.13). Differences in tiller numbers were less pronounced between actual
weed densities. The decrease in number of shoots within the weed-free plots at the last observation
date may also be due to natural elimination of shoots known to occur after sugar cane has reached its
peak of tillering.
Table 4.13 Effect of different weed densities of P. paniculatum and P. urvillei on tillering (number of stalk m-2) of cane observed at four dates.
P. pan – P. paniculatum; P. urv P. urvillei
Leaf area of cane and weed
The mean cane leaf area in the weed-free treatments, irrespective of weed species, did not differ
between the first two observation dates but increased significantly later on (Figs. 4.17a & 4.17b). No
adverse effect of weed competition on the leaf area of cane due to the presence of weeds was apparent
for both species although a tendency of the cane leaf area being reduced by an increasing weed leaf
area was observed as from 13 WAT, particularly for P. paniculatum (Figs. 4.17a & 4.17b). The mean
weed leaf area was found to increase only after the second observation date; the highest leaf area for P.
urvillei was recorded 13 WAT. There were clear increases in weed leaf area with increasing density.
Irrespective of the date of observation, the relative leaf area (Lw) of P. urvillei was higher than
those of P. paniculatum. The mean (of all densities) Lw for P. paniculatum was found to be highest at
13 WAT; i.e. 0.36 (s.e.= 0.052), 0.34 (s.e.= 0.048), 0.52 (s.e.= 0.069) and 0.46 (s.e.= 0.068) at 6, 9, 13
Date of observation
6 WAT 9 WAT 13 WAT 18 WAT
Weed
density
(Plants m-2) P. pan P. urv P. pan P. urv P. pan P. urv P. pan P. urv
Weed-free 15.5 14.6 19.1 12.4
4 10.8 14.3 10.5 13.0 12.8 14.5 8.5 8.8
8 12.8 15.5 12.5 14.3 14.3 15.0 11.8 9.5
16 12.3 13.8 10.8 9.3 14.3 11.0 9.5 8.0
32 13.8 12.3 10.5 11.5 14.5 11.5 8.8 8.5
48 12.3 16.3 13.3 11.0 14.0 10.8 8.5 7.5
S.e.d. (d.f.) 2.19 (30) 1.79 (30) 1.93 (30) 1.09 (30)
CV % 22.5 20.8 19.1 16.2
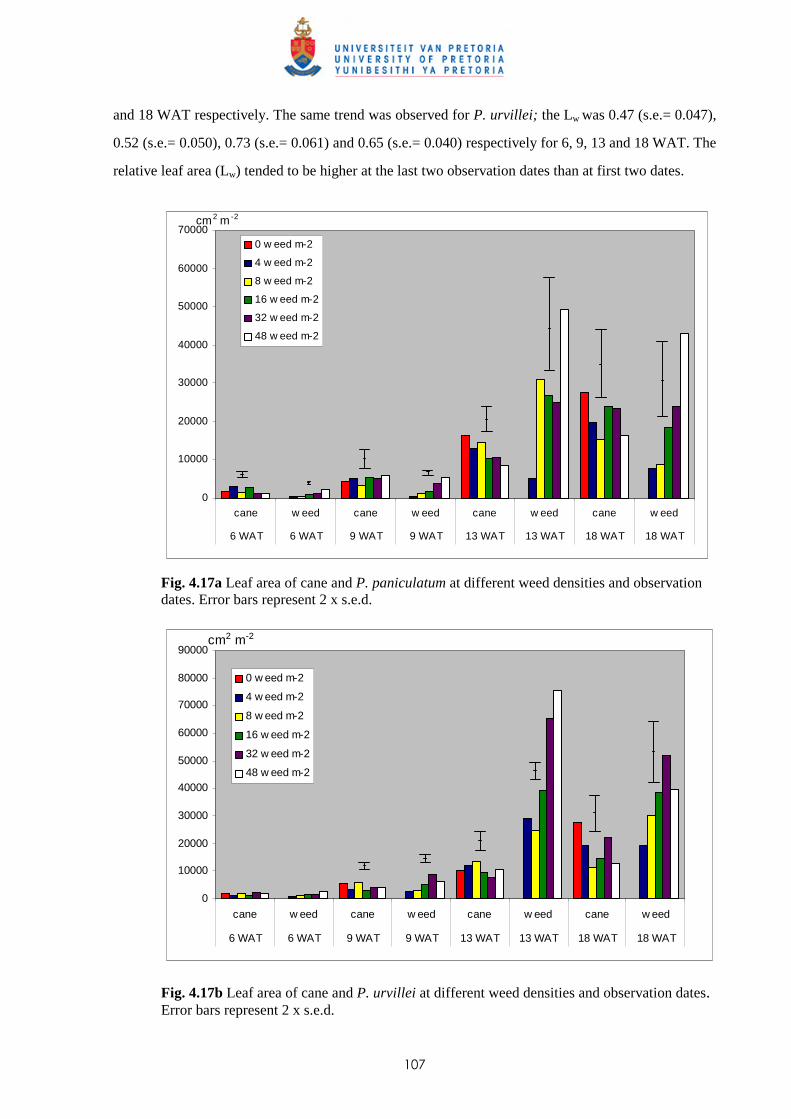
107
and 18 WAT respectively. The same trend was observed for P. urvillei; the Lw was 0.47 (s.e.= 0.047),
0.52 (s.e.= 0.050), 0.73 (s.e.= 0.061) and 0.65 (s.e.= 0.040) respectively for 6, 9, 13 and 18 WAT. The
relative leaf area (Lw) tended to be higher at the last two observation dates than at first two dates.
0
10000
20000
30000
40000
50000
60000
70000
cane w eed cane w eed cane w eed cane w eed
6 WAT 6 WAT 9 WAT 9 WAT 13 WAT 13 WAT 18 WAT 18 WAT
0 w eed m-2
4 w eed m-2
8 w eed m-2
16 w eed m-2
32 w eed m-2
48 w eed m-2
cm2 m -2
Fig. 4.17a Leaf area of cane and P. paniculatum at different weed densities and observation dates. Error bars represent 2 x s.e.d.
0
10000
20000
30000
40000
50000
60000
70000
80000
90000
cane w eed cane w eed cane w eed cane w eed
6 WAT 6 WAT 9 WAT 9 WAT 13 WAT 13 WAT 18 WAT 18 WAT
0 w eed m-2
4 w eed m-2
8 w eed m-2
16 w eed m-2
32 w eed m-2
48 w eed m-2
cm2 m-2
Fig. 4.17b Leaf area of cane and P. urvillei at different weed densities and observation dates. Error bars represent 2 x s.e.d.
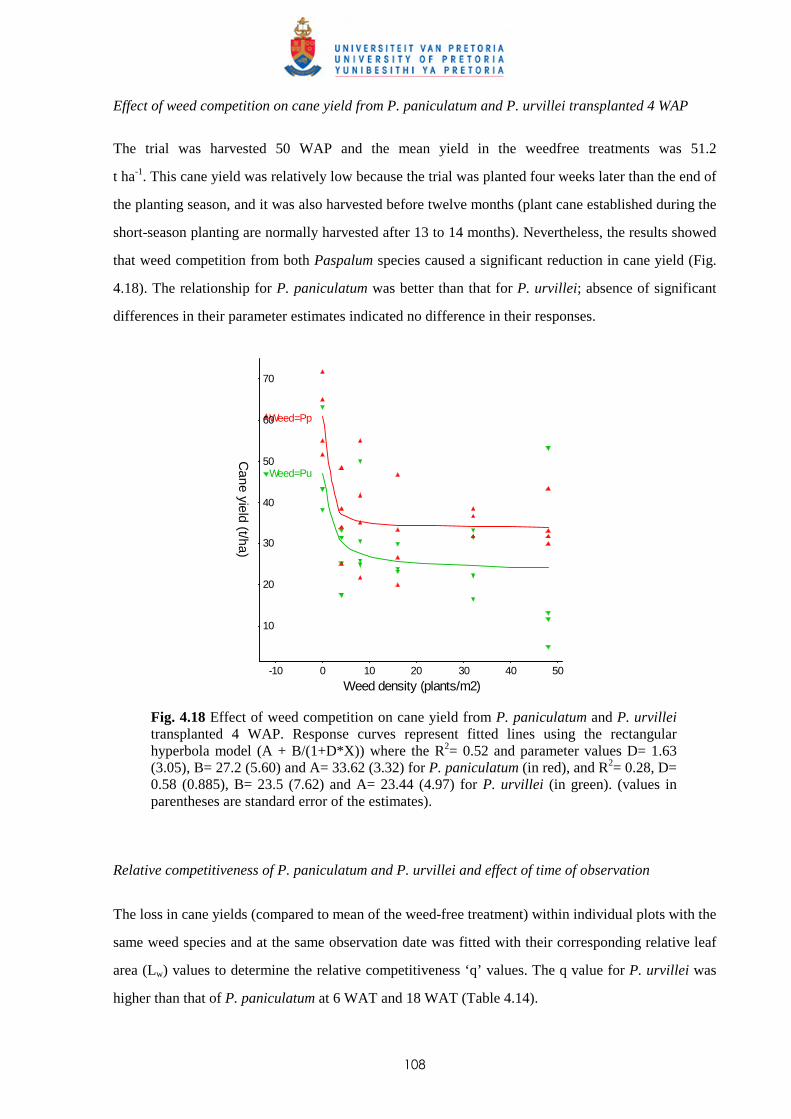
108
Effect of weed competition on cane yield from P. paniculatum and P. urvillei transplanted 4 WAP
The trial was harvested 50 WAP and the mean yield in the weedfree treatments was 51.2
t ha-1. This cane yield was relatively low because the trial was planted four weeks later than the end of
the planting season, and it was also harvested before twelve months (plant cane established during the
short-season planting are normally harvested after 13 to 14 months). Nevertheless, the results showed
that weed competition from both Paspalum species caused a significant reduction in cane yield (Fig.
4.18). The relationship for P. paniculatum was better than that for P. urvillei; absence of significant
differences in their parameter estimates indicated no difference in their responses.
Weed=Pp
Weed=Pu
Weed density (plants/m2)
60
20
40
50
70
10
10
30
0 504030
20
-10
Cane yield (t/ha)
Fig. 4.18 Effect of weed competition on cane yield from P. paniculatum and P. urvillei transplanted 4 WAP. Response curves represent fitted lines using the rectangular hyperbola model (A + B/(1+D*X)) where the R2= 0.52 and parameter values D= 1.63 (3.05), B= 27.2 (5.60) and A= 33.62 (3.32) for P. paniculatum (in red), and R2= 0.28, D= 0.58 (0.885), B= 23.5 (7.62) and A= 23.44 (4.97) for P. urvillei (in green). (values in parentheses are standard error of the estimates).
Relative competitiveness of P. paniculatum and P. urvillei and effect of time of observation
The loss in cane yields (compared to mean of the weed-free treatment) within individual plots with the
same weed species and at the same observation date was fitted with their corresponding relative leaf
area (Lw) values to determine the relative competitiveness ‘q’ values. The q value for P. urvillei was
higher than that of P. paniculatum at 6 WAT and 18 WAT (Table 4.14).
109
Table 4.14 Relative competitiveness ‘q’ values for P. paniculatum and P. urvillei at different observation dates after transplanting weeds 4 WAP). Relative competitiveness q value
Date of observation 6 WAT 9 WAT 13 WAT 18 WAT
P. paniculatum 0.41 (0.155) 0.56 (0.180) 0.11 (0.047) 0.09 (0.051)
P. urvillei 0.80 (0.243) 0.59 (0.194) 0.10 (0.040) 0.36 (0.093)
Values in parentheses represent standard errors (s.e.) of the estimated q value.
The relative competitiveness q value of P. paniculatum was higher at the two first observation
dates than the last two observation dates. The higher q value for P. urvillei at the first observation date
compared to P. paniculatum may suggest that the former developed quicker than P. paniculatum after
transplanting. The data on leaf areas together with time expressed in growing degree days (oC d) were
fitted in the equation derived by Kropff and Spitters (1991) or Kropff and van Laar (1993) (Eqn 3) to
express change in time of the relative damage (competitiveness) coefficient ‘q’ in the period of
exponential growth, as for Trial I.
The increase in mean growth rate of leaf area of the weeds was higher than that of the crop at
most of the observation dates. For all dates, irrespective of the weed species, the estimated q values for
both weeds at 9, 13 and 18 WAT, calculated from the q values at 6 WAT and relative growth rates of
leaf areas were higher than the measured ones (Table 4.15); the difference seemed to increase with
time of observation. The latter change may have been caused by differences in height of the plants and
the vertical distribution of leaves in the cane/weed canopy.
Table 4.15 Estimation of relative competitiveness q values with time and relative rate of growth of cane and leaf area (oC-1 d-1)
Observation dates
9 WAT 13 WAT 18 WAT
P. pan P. urv P. pan P. urvi P. pan P. urv
Time (oC d) 161 405 712 Mean rate of growth of cane leaf area (oC-1 d-1) 0.009 0.008 0.013 0.037 0.014 0.025
Mean rate of growth of weed leaf area (oC-1 d-1) 0.011 0.018 0.014 0.117 0.015 0.036
Estimated q value 0.72 1.44 0.46 0.88 0.45 1.15
P. pan = P. paniculatum; P. urv = P. urvillei
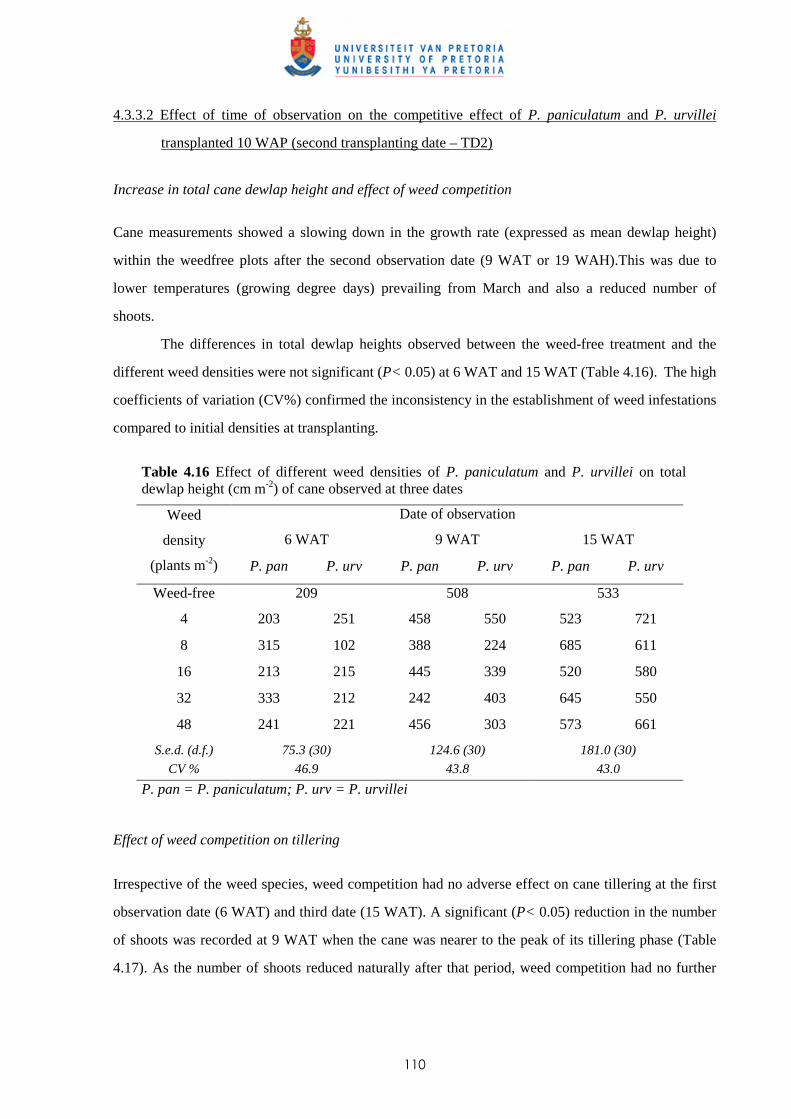
110
4.3.3.2 Effect of time of observation on the competitive effect of P. paniculatum and P. urvillei
transplanted 10 WAP (second transplanting date – TD2)
Increase in total cane dewlap height and effect of weed competition
Cane measurements showed a slowing down in the growth rate (expressed as mean dewlap height)
within the weedfree plots after the second observation date (9 WAT or 19 WAH).This was due to
lower temperatures (growing degree days) prevailing from March and also a reduced number of
shoots.
The differences in total dewlap heights observed between the weed-free treatment and the
different weed densities were not significant (P< 0.05) at 6 WAT and 15 WAT (Table 4.16). The high
coefficients of variation (CV%) confirmed the inconsistency in the establishment of weed infestations
compared to initial densities at transplanting.
Table 4.16 Effect of different weed densities of P. paniculatum and P. urvillei on total dewlap height (cm m-2) of cane observed at three dates
P. pan = P. paniculatum; P. urv = P. urvillei
Effect of weed competition on tillering
Irrespective of the weed species, weed competition had no adverse effect on cane tillering at the first
observation date (6 WAT) and third date (15 WAT). A significant (P< 0.05) reduction in the number
of shoots was recorded at 9 WAT when the cane was nearer to the peak of its tillering phase (Table
4.17). As the number of shoots reduced naturally after that period, weed competition had no further
Date of observation
6 WAT 9 WAT 15 WAT
Weed
density
(plants m-2) P. pan P. urv P. pan P. urv P. pan P. urv
Weed-free 209 508 533
4 203 251 458 550 523 721
8 315 102 388 224 685 611
16 213 215 445 339 520 580
32 333 212 242 403 645 550
48 241 221 456 303 573 661
S.e.d. (d.f.) 75.3 (30) 124.6 (30) 181.0 (30)
CV % 46.9 43.8 43.0
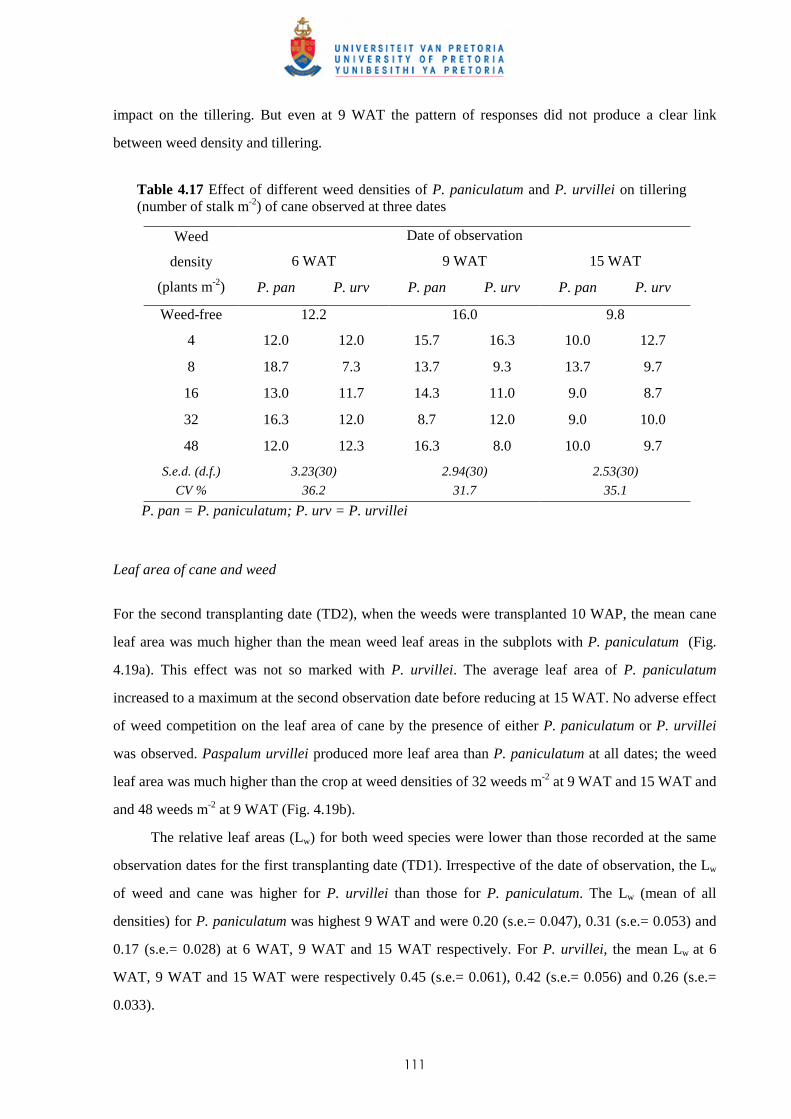
111
impact on the tillering. But even at 9 WAT the pattern of responses did not produce a clear link
between weed density and tillering.
Table 4.17 Effect of different weed densities of P. paniculatum and P. urvillei on tillering (number of stalk m-2) of cane observed at three dates
P. pan = P. paniculatum; P. urv = P. urvillei
Leaf area of cane and weed
For the second transplanting date (TD2), when the weeds were transplanted 10 WAP, the mean cane
leaf area was much higher than the mean weed leaf areas in the subplots with P. paniculatum (Fig.
4.19a). This effect was not so marked with P. urvillei. The average leaf area of P. paniculatum
increased to a maximum at the second observation date before reducing at 15 WAT. No adverse effect
of weed competition on the leaf area of cane by the presence of either P. paniculatum or P. urvillei
was observed. Paspalum urvillei produced more leaf area than P. paniculatum at all dates; the weed
leaf area was much higher than the crop at weed densities of 32 weeds m-2 at 9 WAT and 15 WAT and
and 48 weeds m-2 at 9 WAT (Fig. 4.19b).
The relative leaf areas (Lw) for both weed species were lower than those recorded at the same
observation dates for the first transplanting date (TD1). Irrespective of the date of observation, the Lw
of weed and cane was higher for P. urvillei than those for P. paniculatum. The Lw (mean of all
densities) for P. paniculatum was highest 9 WAT and were 0.20 (s.e.= 0.047), 0.31 (s.e.= 0.053) and
0.17 (s.e.= 0.028) at 6 WAT, 9 WAT and 15 WAT respectively. For P. urvillei, the mean Lw at 6
WAT, 9 WAT and 15 WAT were respectively 0.45 (s.e.= 0.061), 0.42 (s.e.= 0.056) and 0.26 (s.e.=
0.033).
Date of observation
6 WAT 9 WAT 15 WAT
Weed
density
(plants m-2) P. pan P. urv P. pan P. urv P. pan P. urv
Weed-free 12.2 16.0 9.8
4 12.0 12.0 15.7 16.3 10.0 12.7
8 18.7 7.3 13.7 9.3 13.7 9.7
16 13.0 11.7 14.3 11.0 9.0 8.7
32 16.3 12.0 8.7 12.0 9.0 10.0
48 12.0 12.3 16.3 8.0 10.0 9.7
S.e.d. (d.f.) 3.23(30) 2.94(30) 2.53(30)
CV % 36.2 31.7 35.1
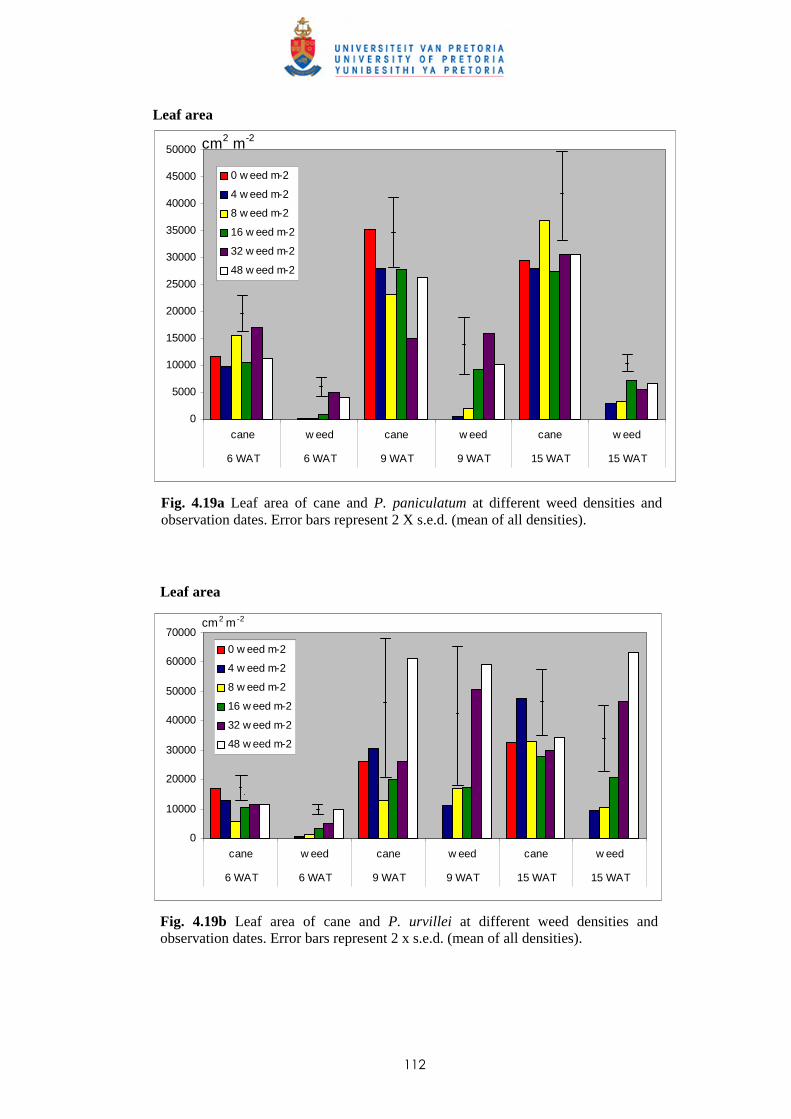
112
Leaf area
0
5000
10000
15000
20000
25000
30000
35000
40000
45000
50000
cane w eed cane w eed cane w eed
6 WAT 6 WAT 9 WAT 9 WAT 15 WAT 15 WAT
0 w eed m-2
4 w eed m-2
8 w eed m-2
16 w eed m-2
32 w eed m-2
48 w eed m-2
cm2 m-2
Fig. 4.19a Leaf area of cane and P. paniculatum at different weed densities and observation dates. Error bars represent 2 X s.e.d. (mean of all densities).
Leaf area
0
10000
20000
30000
40000
50000
60000
70000
cane w eed cane w eed cane w eed
6 WAT 6 WAT 9 WAT 9 WAT 15 WAT 15 WAT
0 w eed m-2
4 w eed m-2
8 w eed m-2
16 w eed m-2
32 w eed m-2
48 w eed m-2
cm2 m -2
Fig. 4.19b Leaf area of cane and P. urvillei at different weed densities and observation dates. Error bars represent 2 x s.e.d. (mean of all densities).
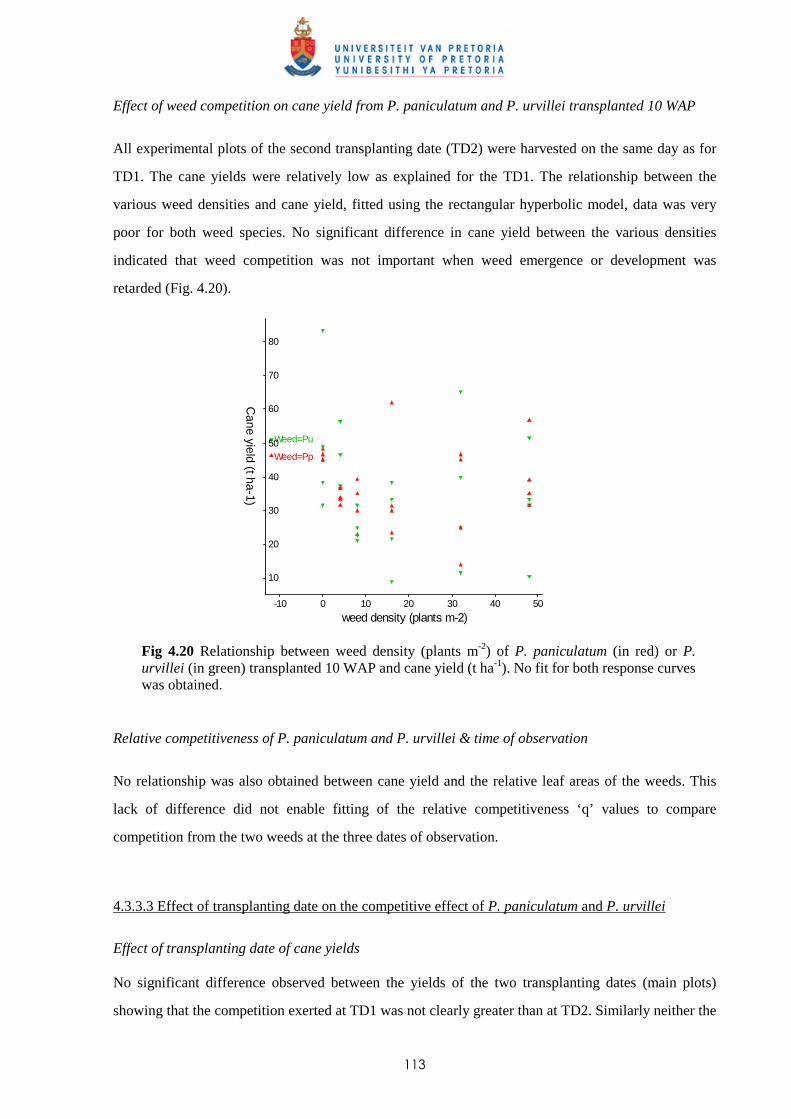
113
Effect of weed competition on cane yield from P. paniculatum and P. urvillei transplanted 10 WAP
All experimental plots of the second transplanting date (TD2) were harvested on the same day as for
TD1. The cane yields were relatively low as explained for the TD1. The relationship between the
various weed densities and cane yield, fitted using the rectangular hyperbolic model, data was very
poor for both weed species. No significant difference in cane yield between the various densities
indicated that weed competition was not important when weed emergence or development was
retarded (Fig. 4.20).
Weed=Pu
Weed=Pp
weed density (plants m-2)
70
50
20
60
80
10
20
30
0 504030
10
40
-10
Cane yield (t ha-1)
Fig 4.20 Relationship between weed density (plants m-2) of P. paniculatum (in red) or P. urvillei (in green) transplanted 10 WAP and cane yield (t ha-1). No fit for both response curves was obtained.
Relative competitiveness of P. paniculatum and P. urvillei & time of observation
No relationship was also obtained between cane yield and the relative leaf areas of the weeds. This
lack of difference did not enable fitting of the relative competitiveness ‘q’ values to compare
competition from the two weeds at the three dates of observation.
4.3.3.3 Effect of transplanting date on the competitive effect of P. paniculatum and P. urvillei
Effect of transplanting date of cane yields
No significant difference observed between the yields of the two transplanting dates (main plots)
showing that the competition exerted at TD1 was not clearly greater than at TD2. Similarly neither the
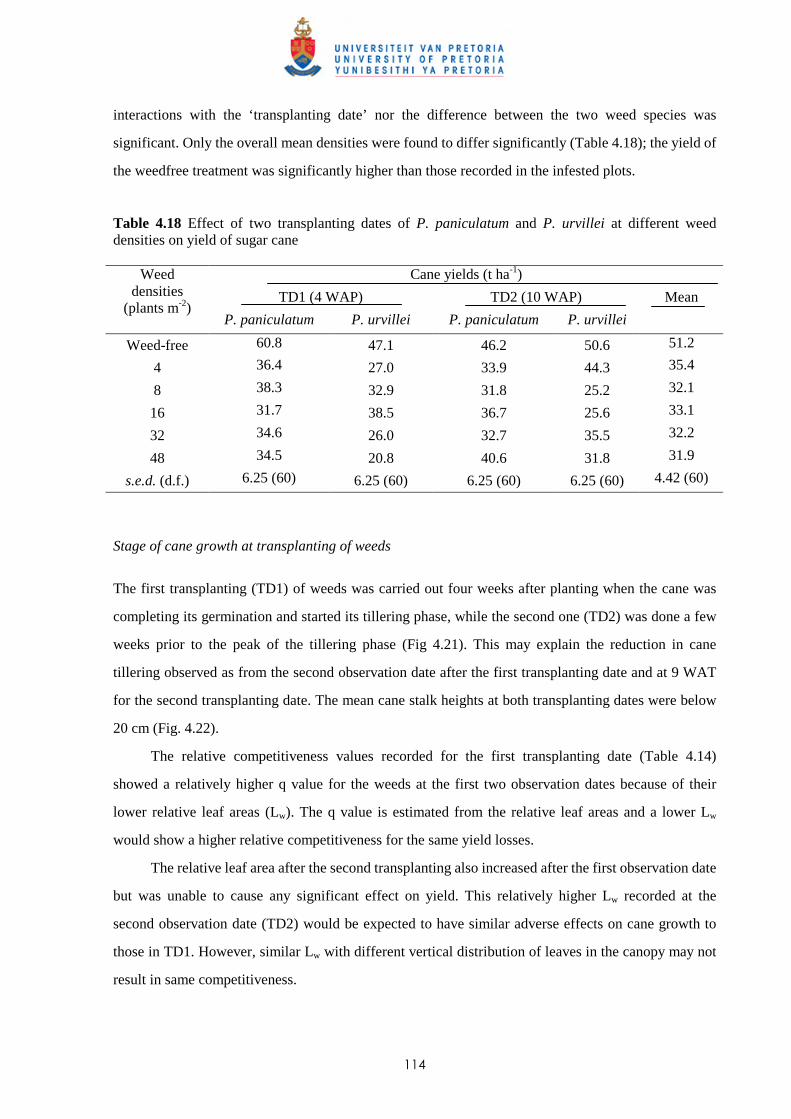
114
interactions with the ‘transplanting date’ nor the difference between the two weed species was
significant. Only the overall mean densities were found to differ significantly (Table 4.18); the yield of
the weedfree treatment was significantly higher than those recorded in the infested plots. Table 4.18 Effect of two transplanting dates of P. paniculatum and P. urvillei at different weed densities on yield of sugar cane
Cane yields (t ha-1)
TD1 (4 WAP) TD2 (10 WAP) Mean
Weed densities
(plants m-2) P. paniculatum P. urvillei P. paniculatum P. urvillei
Weed-free 60.8 47.1 46.2 50.6 51.2
4 36.4 27.0 33.9 44.3 35.4
8 38.3 32.9 31.8 25.2 32.1
16 31.7 38.5 36.7 25.6 33.1
32 34.6 26.0 32.7 35.5 32.2
48 34.5 20.8 40.6 31.8 31.9
s.e.d. (d.f.) 6.25 (60) 6.25 (60) 6.25 (60) 6.25 (60) 4.42 (60)
Stage of cane growth at transplanting of weeds
The first transplanting (TD1) of weeds was carried out four weeks after planting when the cane was
completing its germination and started its tillering phase, while the second one (TD2) was done a few
weeks prior to the peak of the tillering phase (Fig 4.21). This may explain the reduction in cane
tillering observed as from the second observation date after the first transplanting date and at 9 WAT
for the second transplanting date. The mean cane stalk heights at both transplanting dates were below
20 cm (Fig. 4.22).
The relative competitiveness values recorded for the first transplanting date (Table 4.14)
showed a relatively higher q value for the weeds at the first two observation dates because of their
lower relative leaf areas (Lw). The q value is estimated from the relative leaf areas and a lower Lw
would show a higher relative competitiveness for the same yield losses.
The relative leaf area after the second transplanting also increased after the first observation date
but was unable to cause any significant effect on yield. This relatively higher Lw recorded at the
second observation date (TD2) would be expected to have similar adverse effects on cane growth to
those in TD1. However, similar Lw with different vertical distribution of leaves in the canopy may not
result in same competitiveness.
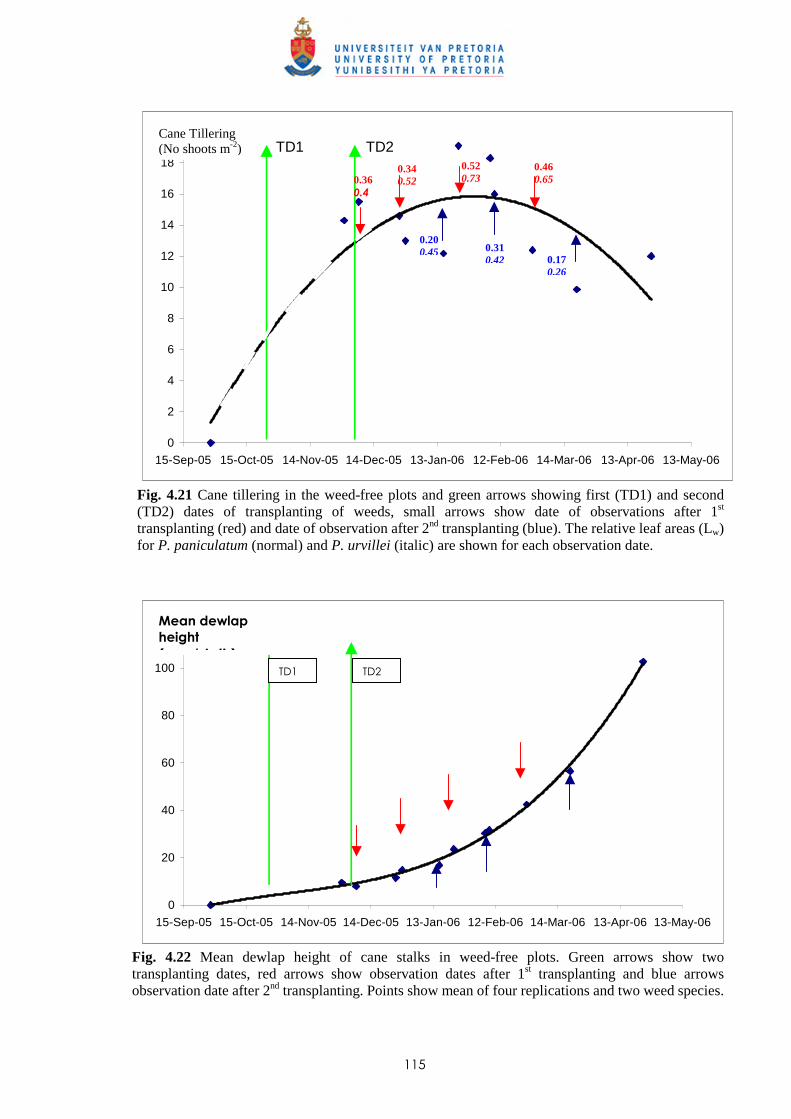
115
Fig. 4.21 Cane tillering in the weed-free plots and green arrows showing first (TD1) and second (TD2) dates of transplanting of weeds, small arrows show date of observations after 1st transplanting (red) and date of observation after 2nd transplanting (blue). The relative leaf areas (Lw) for P. paniculatum (normal) and P. urvillei (italic) are shown for each observation date.
Fig. 4.22 Mean dewlap height of cane stalks in weed-free plots. Green arrows show two transplanting dates, red arrows show observation dates after 1st transplanting and blue arrows observation date after 2nd transplanting. Points show mean of four replications and two weed species.
0
2
4
6
8
10
12
14
16
18
20
15-Sep-05 15-Oct-05 14-Nov-05 14-Dec-05 13-Jan-06 12-Feb-06 14-Mar-06 13-Apr-06 13-May-06
TD1 TD2
0
20
40
60
80
100
120
15-Sep-05 15-Oct-05 14-Nov-05 14-Dec-05 13-Jan-06 12-Feb-06 14-Mar-06 13-Apr-06 13-May-06
TD1 TD2
Mean dewlap
height
(cm /stalk)
Cane Tillering (No shoots m-2)
0.36 0.4
0.34 0.52
0.52 0.73
0.46 0.65
0.20 0.45 0.31
0.42 0.17 0.26
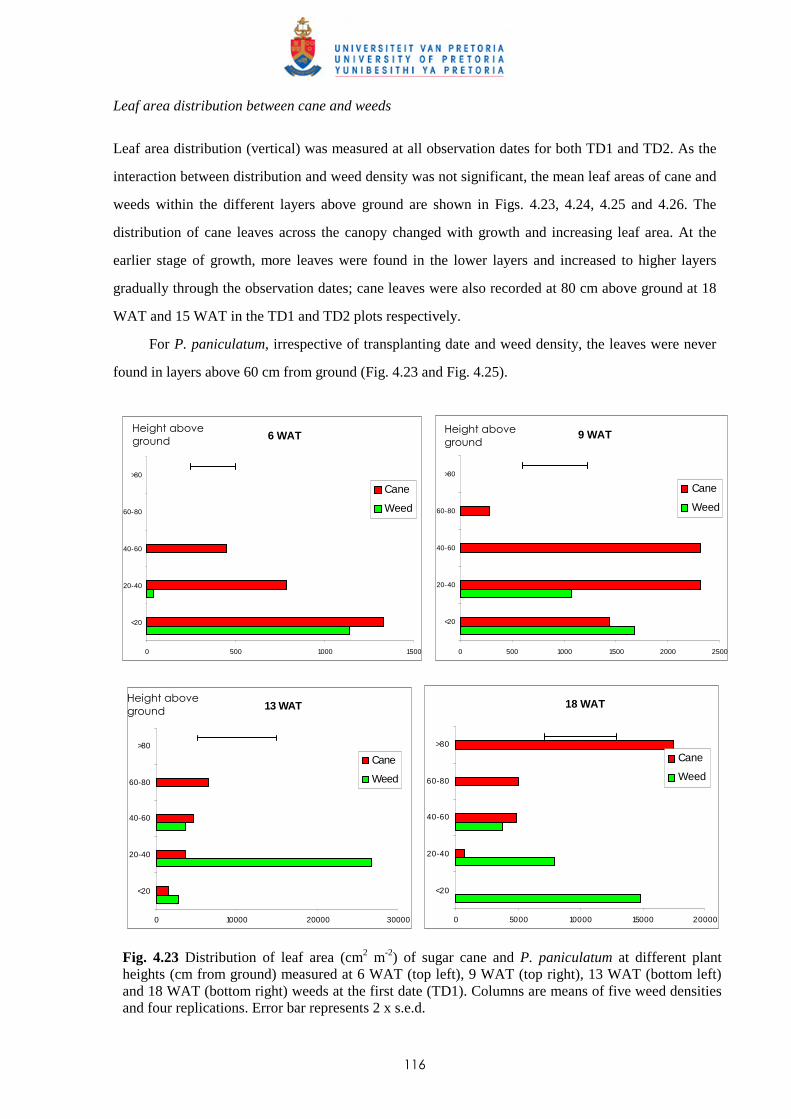
116
Leaf area distribution between cane and weeds
Leaf area distribution (vertical) was measured at all observation dates for both TD1 and TD2. As the
interaction between distribution and weed density was not significant, the mean leaf areas of cane and
weeds within the different layers above ground are shown in Figs. 4.23, 4.24, 4.25 and 4.26. The
distribution of cane leaves across the canopy changed with growth and increasing leaf area. At the
earlier stage of growth, more leaves were found in the lower layers and increased to higher layers
gradually through the observation dates; cane leaves were also recorded at 80 cm above ground at 18
WAT and 15 WAT in the TD1 and TD2 plots respectively.
For P. paniculatum, irrespective of transplanting date and weed density, the leaves were never
found in layers above 60 cm from ground (Fig. 4.23 and Fig. 4.25).
6 WAT
0 500 1000 1500
<20
20-40
40-60
60-80
>80
Cane
Weed
9 WAT
0 500 1000 1500 2000 2500
<20
20-40
40-60
60-80
>80
Cane
Weed
13 WAT
0 10000 20000 30000
<20
20-40
40-60
60-80
>80
Cane
Weed
18 WAT
0 5000 10000 15000 20000
<20
20-40
40-60
60-80
>80
Cane
Weed
Fig. 4.23 Distribution of leaf area (cm2 m-2) of sugar cane and P. paniculatum at different plant heights (cm from ground) measured at 6 WAT (top left), 9 WAT (top right), 13 WAT (bottom left) and 18 WAT (bottom right) weeds at the first date (TD1). Columns are means of five weed densities and four replications. Error bar represents 2 x s.e.d.
Height above
ground
(cm)
Height above
ground
(cm)
Height above
ground
(cm)
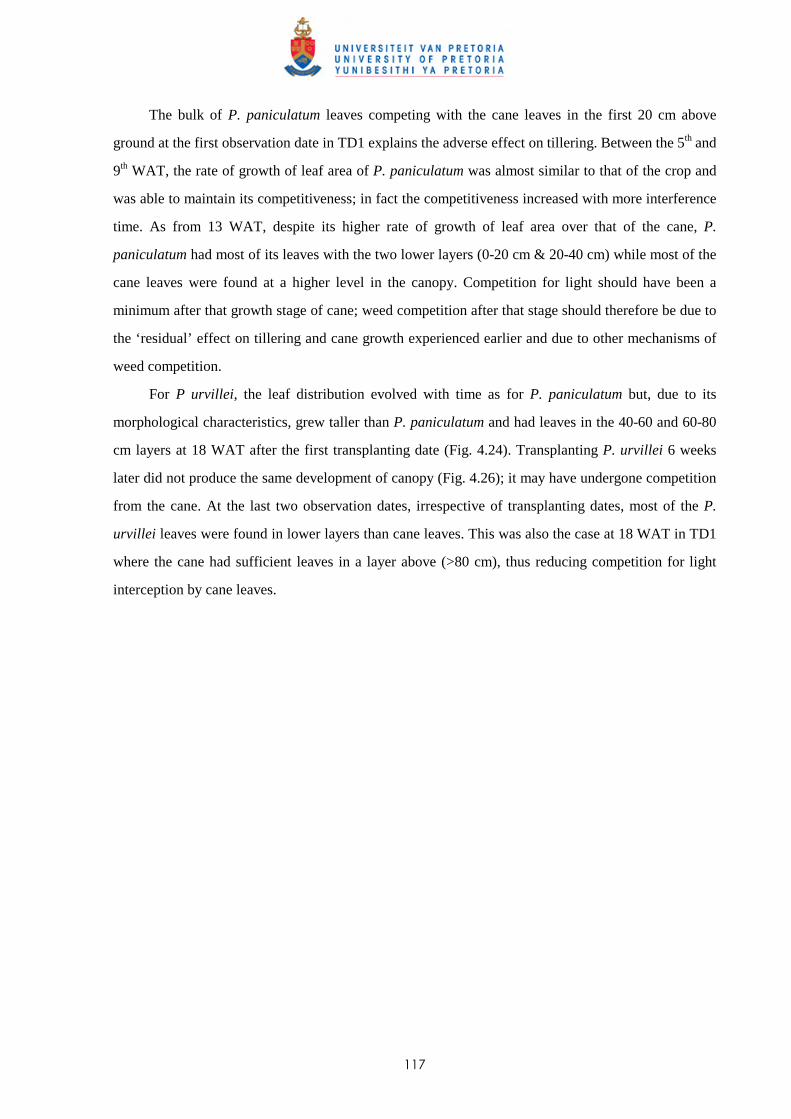
117
The bulk of P. paniculatum leaves competing with the cane leaves in the first 20 cm above
ground at the first observation date in TD1 explains the adverse effect on tillering. Between the 5th and
9th WAT, the rate of growth of leaf area of P. paniculatum was almost similar to that of the crop and
was able to maintain its competitiveness; in fact the competitiveness increased with more interference
time. As from 13 WAT, despite its higher rate of growth of leaf area over that of the cane, P.
paniculatum had most of its leaves with the two lower layers (0-20 cm & 20-40 cm) while most of the
cane leaves were found at a higher level in the canopy. Competition for light should have been a
minimum after that growth stage of cane; weed competition after that stage should therefore be due to
the ‘residual’ effect on tillering and cane growth experienced earlier and due to other mechanisms of
weed competition.
For P urvillei, the leaf distribution evolved with time as for P. paniculatum but, due to its
morphological characteristics, grew taller than P. paniculatum and had leaves in the 40-60 and 60-80
cm layers at 18 WAT after the first transplanting date (Fig. 4.24). Transplanting P. urvillei 6 weeks
later did not produce the same development of canopy (Fig. 4.26); it may have undergone competition
from the cane. At the last two observation dates, irrespective of transplanting dates, most of the P.
urvillei leaves were found in lower layers than cane leaves. This was also the case at 18 WAT in TD1
where the cane had sufficient leaves in a layer above (>80 cm), thus reducing competition for light
interception by cane leaves.
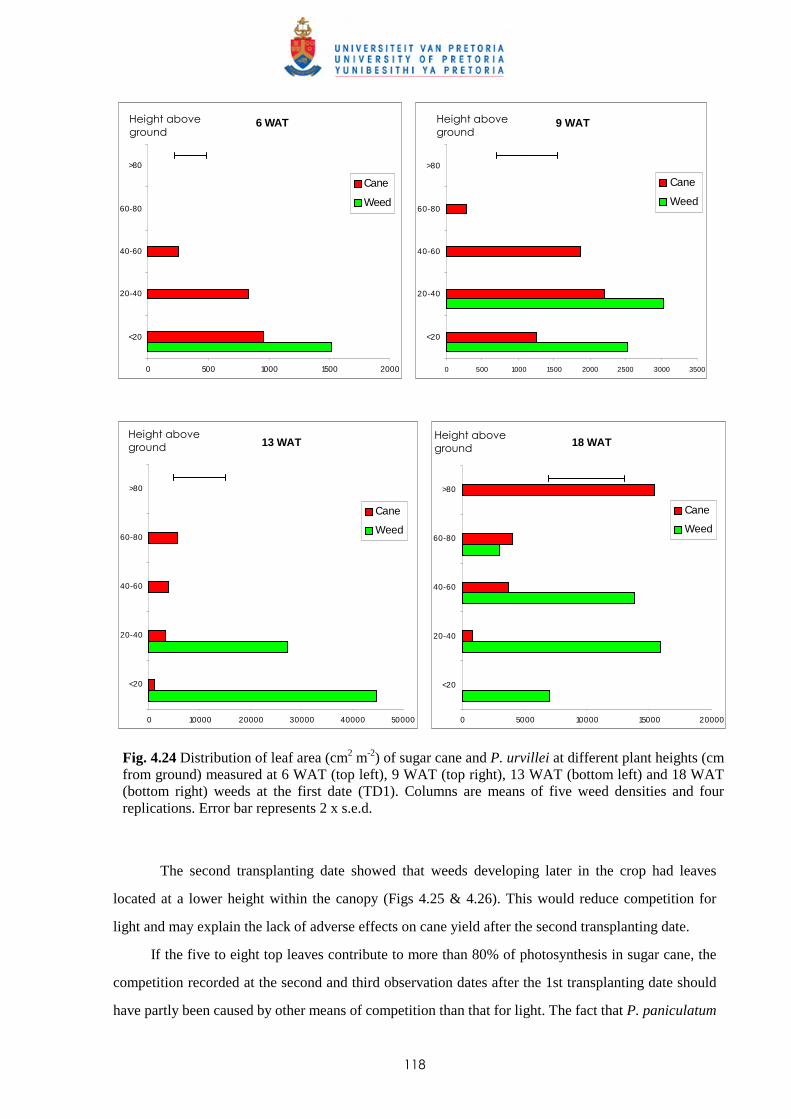
118
6 WAT
0 500 1000 1500 2000
<20
20-40
40-60
60-80
>80
Cane
Weed
9 WAT
0 500 1000 1500 2000 2500 3000 3500
<20
20-40
40-60
60-80
>80
Cane
Weed
13 WAT
0 10000 20000 30000 40000 50000
<20
20-40
40-60
60-80
>80
Cane
Weed
18 WAT
0 5000 10000 15000 20000
<20
20-40
40-60
60-80
>80
Cane
Weed
Fig. 4.24 Distribution of leaf area (cm2 m-2) of sugar cane and P. urvillei at different plant heights (cm from ground) measured at 6 WAT (top left), 9 WAT (top right), 13 WAT (bottom left) and 18 WAT (bottom right) weeds at the first date (TD1). Columns are means of five weed densities and four replications. Error bar represents 2 x s.e.d.
The second transplanting date showed that weeds developing later in the crop had leaves
located at a lower height within the canopy (Figs 4.25 & 4.26). This would reduce competition for
light and may explain the lack of adverse effects on cane yield after the second transplanting date.
If the five to eight top leaves contribute to more than 80% of photosynthesis in sugar cane, the
competition recorded at the second and third observation dates after the 1st transplanting date should
have partly been caused by other means of competition than that for light. The fact that P. paniculatum
Height above
ground
(cm)
Height above
ground
(cm)
Height above
ground
(cm)
Height above
ground
(cm)
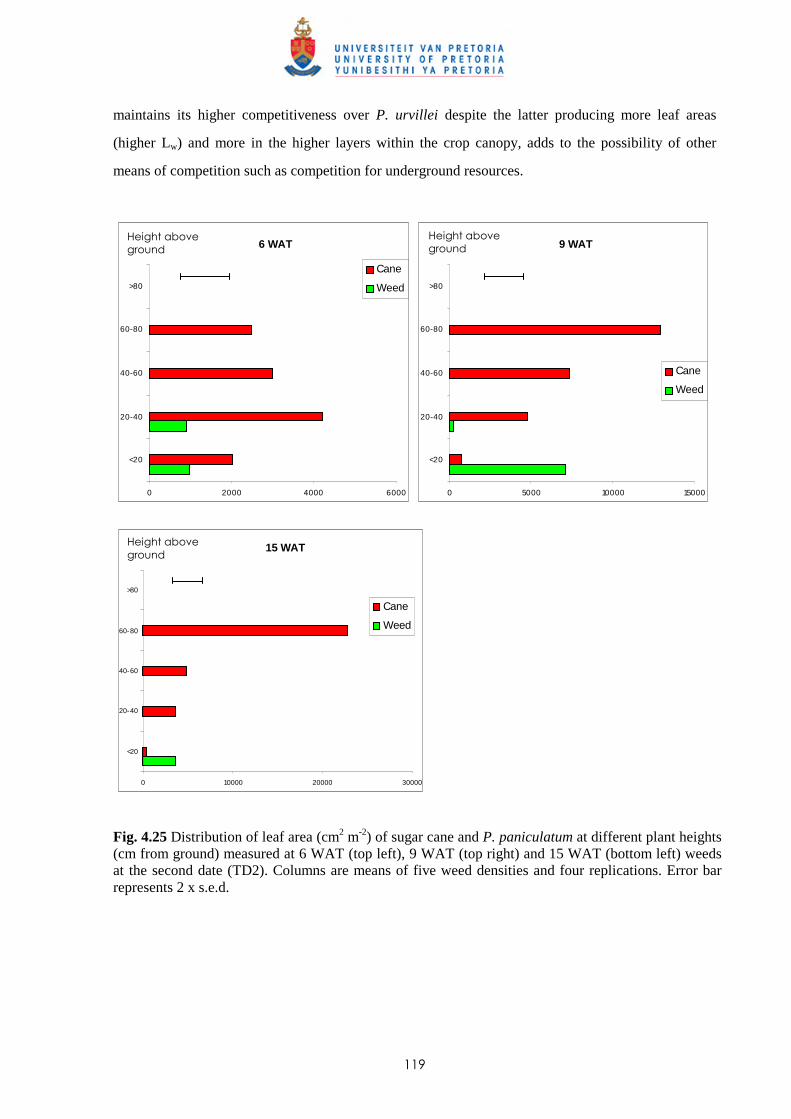
119
maintains its higher competitiveness over P. urvillei despite the latter producing more leaf areas
(higher Lw) and more in the higher layers within the crop canopy, adds to the possibility of other
means of competition such as competition for underground resources.
6 WAT
0 2000 4000 6000
<20
20-40
40-60
60-80
>80
Cane
Weed
9 WAT
0 5000 10000 15000
<20
20-40
40-60
60-80
>80
Cane
Weed
15 WAT
0 10000 20000 30000
<20
20-40
40-60
60-80
>80
Cane
Weed
Fig. 4.25 Distribution of leaf area (cm2 m-2) of sugar cane and P. paniculatum at different plant heights (cm from ground) measured at 6 WAT (top left), 9 WAT (top right) and 15 WAT (bottom left) weeds at the second date (TD2). Columns are means of five weed densities and four replications. Error bar represents 2 x s.e.d.
Height above
ground
(cm)
Height above
ground
(cm)
Height above
ground
(cm)
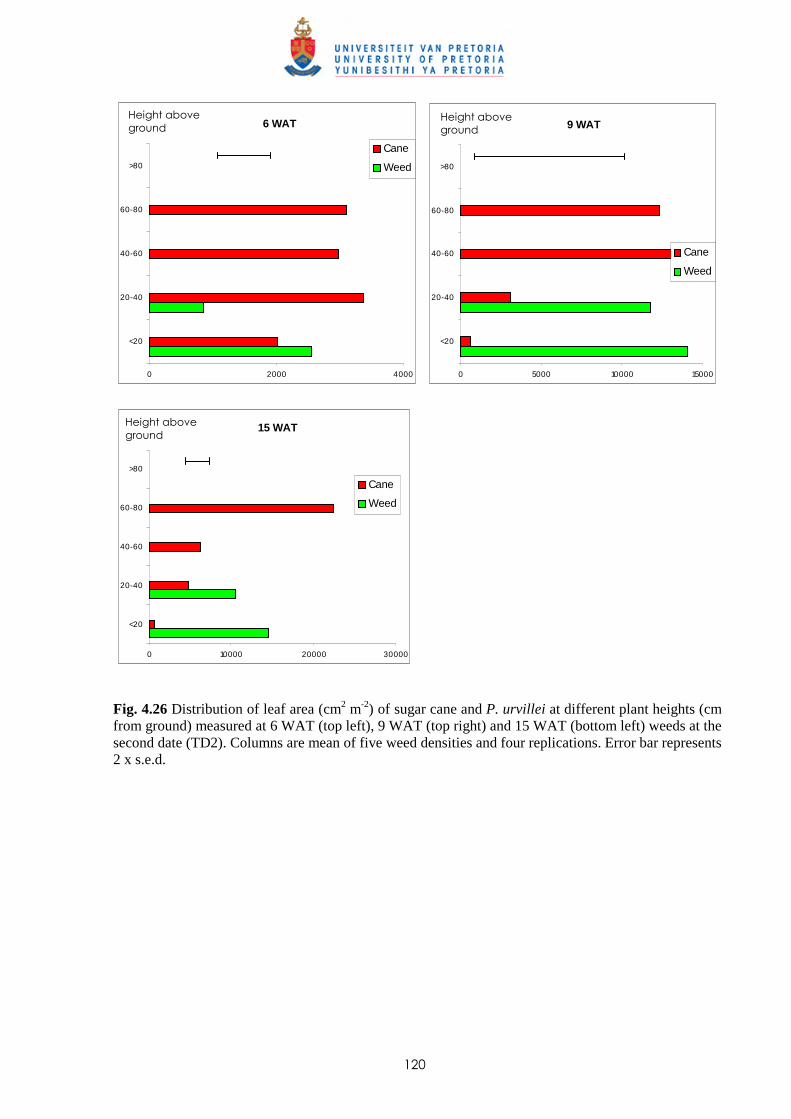
120
6 WAT
0 2000 4000
<20
20-40
40-60
60-80
>80
Cane
Weed
9 WAT
0 5000 10000 15000
<20
20-40
40-60
60-80
>80
Cane
Weed
15 WAT
0 10000 20000 30000
<20
20-40
40-60
60-80
>80
Cane
Weed
Fig. 4.26 Distribution of leaf area (cm2 m-2) of sugar cane and P. urvillei at different plant heights (cm from ground) measured at 6 WAT (top left), 9 WAT (top right) and 15 WAT (bottom left) weeds at the second date (TD2). Columns are mean of five weed densities and four replications. Error bar represents 2 x s.e.d.
Height above
ground
(cm)
Height above
ground
(cm)
Height above
ground
(cm)
121
4.4 Discussion and conclusions
Relative competitiveness of P. paniculatum and P. urvillei
The three trials have shown sugar cane to be a stronger competitor than both P. paniculatum and P.
urvillei in all comparisons. The relatively lower leaf areas and high standard errors associated with the
estimates in the latter cases may explain such differences. Paspalum paniculatum seemed to have a
higher relative competitiveness than P. urvillei in Trial I but this was not the case in the other two
trials; P. urvillei caused greater reduction in cane dewlap heights in Trial II and was similar to P.
paniculatum in Trial III.
Paspalum urvillei produced greater leaf area than P. paniculatum and it seemed that there was
an interaction between weed leaf area and cane leaf area although significance was not shown in all
the trials due to high variations in the data sets. Paspalum urvillei was found to have an equal or
higher relative leaf area (Lw) to P. paniculatum and there were indications that P. urvillei was still
growing at later observation dates and was thus able to maintain a relatively higher Lw at the last
observation date. Early competition resulted in a reduction in tillering (number of shoots per unit area)
and this was almost similar with both weed species although the much higher leaf areas of P. urvillei
in Trial II seemed to have a greater adverse effect on tillering. Tillering rates in sugar cane has been
reported to reduce sharply when tillers start experiencing light competition (Van Dillewijn, 1952) and
this may explain the higher competition from P. urvillei on that parameter of cane growth.
With its relatively lower leaf areas, there may be a tendency to say that P. paniculatum leaves
intercepted less light than P. urvillei. De Wit (1965) reported planophile leaves (horizontally oriented)
to capture light with a higher efficiency than erectophile leaves (vertically oriented). Other work
carried out in wheat shows planophile leaves to be more competitive (Seavers & Wright, 1999).
Paspalum paniculatum leaves tend to have a slightly more planophile leaf structure compared to P.
urvillei. (See Figs. 1.2 & 1.3 in Chapter 1). However, this would apply when leaves of both weeds
and cane are at the same height in the canopy; the three trials showed P. paniculatum to maintain its
relative competitiveness even when the cane leaves were much higher in the canopy. Paspalum
urvillei developed more leaves in the higher layers of the canopy with time.
Relative competitiveness with time (duration of infestation)
The relative competitiveness (q value) of both P. paniculatum and P. urvillei did not change with time
in Trial I while it seemed to decrease at later observation dates in Trial II after the first transplanting
122
date. This may have been due to the difference if the stage of growth at transplanting of weeds.
Estimating q values with the equation developed by Kropff and Spitters (1991) or Kropff and van Laar
(1993) at later growth stages showed higher values for the later q values. This change may partly be
due to the base temperature of the weeds being different to that of cane. Furthermore, the equation by
Kropff and Spitters (1991) or Kropff and van Laar (1993) is recommended up to canopy closure and
when the rate of growth is exponential. This seemed to be different in sugar cane where canopy
closure takes longer and there is a significant difference in the vertical distribution of leaf area
between the period when cane starts elongation and canopy closure.
Effect of transplanting date on weed competition
The effect of time of weed emergence (transplanting weeds at two dates) on weed competition in sugar
cane was well demonstrated in Trial III where the same time intervals were used between the first two
observation dates. The adverse effect of weed competition on cane yield was reduced by transplanting
the weeds later as this resulted in lower relative leaf areas (Lw) and to cane leaves being situated higher
in the crop canopy. This implied that weeds emerging late in the season would cause less damage.
This would, however, be dependent on the growth stage of cane, the relative growth rate of leaf area of
the weed species and their morphological characteristics.
If the competition between sugar cane and weeds was linked to only one physiological process,
e.g. light interception on tillering of cane, then the relative competitiveness for the second
transplanting dates should have been lower than that observed from the earlier ones. This was
demonstrated in both trials. It also seemed that there should be a minimum period of interference
between the weeds and crop for the competition to build on; the reduction in the relative
competitiveness after the peak q values was mainly due to the cane leaves growing higher in the
canopy.
Competition for light and other resources
The three trials have demonstrated that competition in sugar cane is caused by interception of light by
weed leaves. Although some of the effects of light interception occurring early in the growth of cane,
e.g reduced tillering, may be sustained to later stages (cane yields in Trial III), weed competition for
other resources or other mechanism of interference are also possible in sugar cane. Other mechanisms
of competition may also be needed to explain the same (or relatively higher in Trial I) competitiveness
of P. paniculatum compared to P. urvillei despite its lower relative leaf area.
123
CHAPTER 5
COMPARISON OF ROOT AND SHOOT COMPETITION BETWEEN SUGAR CANE
AND PASPALUM PANICULATUM OR PASPALUM URVILLEI
5.1 Introduction
Weeds compete with crops for environmental resources available in limited supply, i.e. nutrients,
water and light. Competition has been defined as the tendency of neighbouring plants to utilise the
same quantum of light, ion of mineral nutrient, molecule of water, or volume of space (Grime, 1979).
In sugar cane, it has been demonstrated that critical periods of weed competition with natural weed
infestations started 12 WAH and ended 26 WAH, under normal growth conditions, in ratoon cane and
control measures may need to be maintained up to 29 weeks after planting to keep yield losses below
5% in plant cane (Chapter 2; Seeruttun & Lutman, 2004). It was also shown that weed competition in
plant cane starts earlier and this would depend on the rate of cane and weed growth, weed species,
density of weed infestations, etc.
The success of weed management programmes which are directed towards minimization of
herbicide use, largely depends upon the ability to predict the effects of weeds on crop yield (Kropff &
Spitters, 1991). Weeds emerge in numerous flushes and the number of species present at any time in a
sugar cane field may vary from 10 to more than 25; therefore the relative competitiveness of each
individual weed is important for predicting impact on growth and yield. The simple descriptive
regression model developed by Kropff and Spitters (1991), based on the hyperbolic yield loss – weed
density model (Cousens, 1985), provides a good description of crop yield loss, expressed in total
aboveground biomass, as a function of the relative leaf area of the weeds early in the development of
the crop. Using this model, the ‘relative damage coefficient’ or relative competitiveness value q for
several weed species in sugar cane has been derived (Chapter 3). However, in Chapters 3 and 4, the
relative competitiveness of P. urvillei, a tussocky mostly erect perennial reaching 150-200 cm in
height and leaves 12-50 cm long (Mc Intyre, 1991), was found to be lower than from the shorter P.
paniculatum (reaching a maximum height of 100-150 cm with lanceolate leaves 20-40 cm long and
1.0-2.5 cm broad). The less competitive P. urvillei also produced relatively more leaf area per unit
area. This result suggested that weed competition in sugar cane cannot be explained solely by
124
aboveground mechanisms (relative leaf area) and competition for belowground resources may also be
a source of interference between the crop and the weeds.
The importance of root competition and the relationship between root and shoot growth have
been demonstrated by many researchers in several crops including rice and cereals. Gibson et al.
(1999) suggested that root competition may be the primary mechanism determining competitive
outcomes between water-seeded rice and Echinochloa phyllopogon (Stapf) Koso-Pol, confirming
similar conclusions in this crop published by Assemat et al. (1981) and Perera et al. (1992). In a
comprehensive review of shoot and root competition, Wilson (1988) reported that in 33 out of 47
studies root competition had a greater effect on plant growth than shoot competition. For several cereal
crops, including spring wheat, barley and oats, root competition was reported to be more important
than competition for light (Aspinall, 1960; Irons & Burnside, 1982; Gamboa & Vandermeer, 1988;
Satorre & Snaydon, 1992). Abdollahian and Froud-Williams (2005) showed that root competition by
Chenopodium album L. caused greater reduction of shoot and root yield of sugar beet than shoot
competition 16 weeks after transplanting. Root competition from an established grass sward was also
demonstrated to affect shoot dry weight of Rumex longifolius DC. and Taraxacum officinale (Web.)
Marss. much more than did shoot competition (Haugland, 1993). Using the divided box technique in
an additive design, Tuor and Froud-Williams (2002) showed that root competition from purple
nutsedge (Cyperus rotundus L.) for soil resources was more severe than competition for aerial
resources in retarding the growth of maize and soyabean.
For a better understanding of the different mechanisms of competition between sugar cane and
weeds, two experiments have been conducted to compare root and shoot competition between P.
paniculatum and P. urvillei when grown with sugar cane. The objectives were to separate the effects
of competition for aboveground and belowground resources by the two weed species and to elucidate
the differences observed between the relative competitiveness of the two Paspalum species.
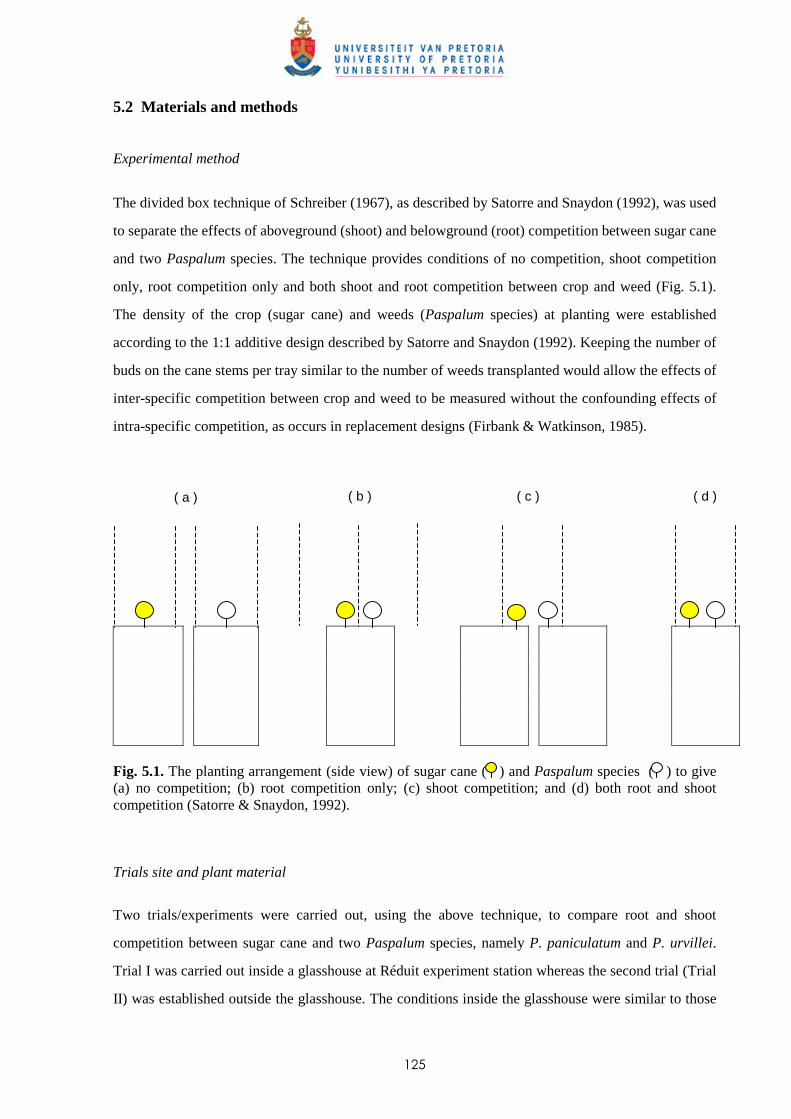
125
5.2 Materials and methods
Experimental method
The divided box technique of Schreiber (1967), as described by Satorre and Snaydon (1992), was used
to separate the effects of aboveground (shoot) and belowground (root) competition between sugar cane
and two Paspalum species. The technique provides conditions of no competition, shoot competition
only, root competition only and both shoot and root competition between crop and weed (Fig. 5.1).
The density of the crop (sugar cane) and weeds (Paspalum species) at planting were established
according to the 1:1 additive design described by Satorre and Snaydon (1992). Keeping the number of
buds on the cane stems per tray similar to the number of weeds transplanted would allow the effects of
inter-specific competition between crop and weed to be measured without the confounding effects of
intra-specific competition, as occurs in replacement designs (Firbank & Watkinson, 1985).
( a )
( b )
( c )
( d )
Fig. 5.1. The planting arrangement (side view) of sugar cane ( ) and Paspalum species ( ) to give (a) no competition; (b) root competition only; (c) shoot competition; and (d) both root and shoot competition (Satorre & Snaydon, 1992).
Trials site and plant material
Two trials/experiments were carried out, using the above technique, to compare root and shoot
competition between sugar cane and two Paspalum species, namely P. paniculatum and P. urvillei.
Trial I was carried out inside a glasshouse at Réduit experiment station whereas the second trial (Trial
II) was established outside the glasshouse. The conditions inside the glasshouse were similar to those
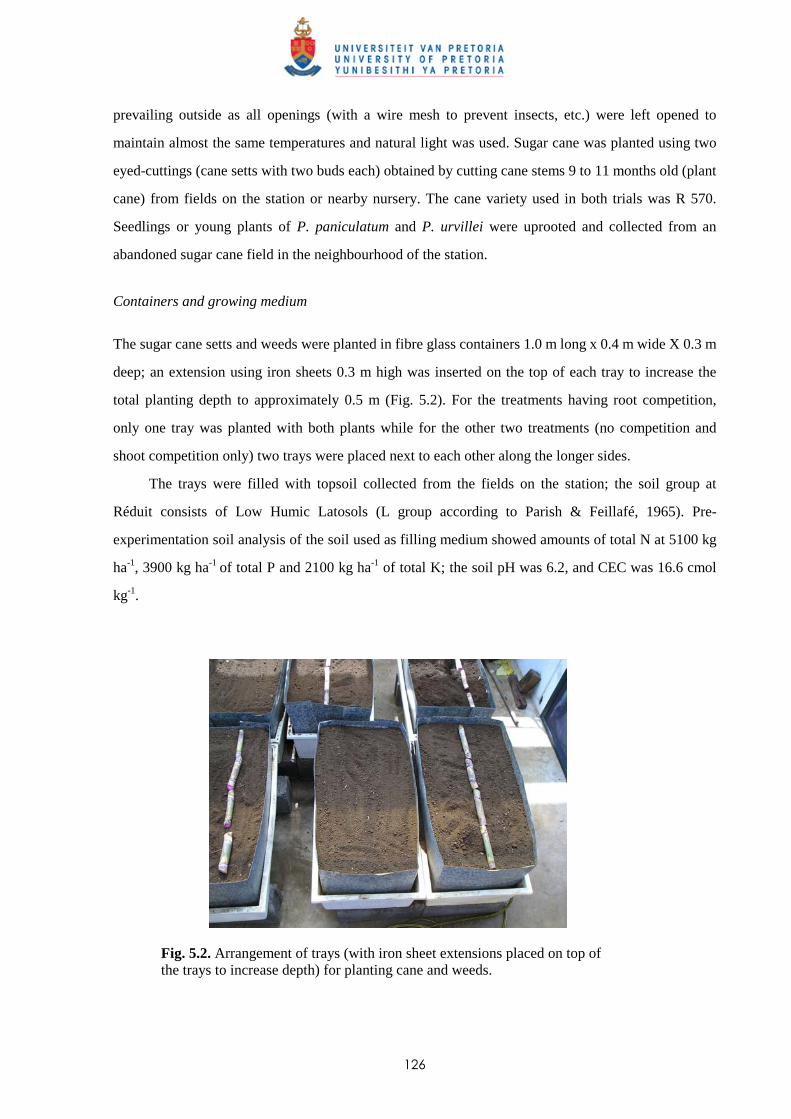
126
prevailing outside as all openings (with a wire mesh to prevent insects, etc.) were left opened to
maintain almost the same temperatures and natural light was used. Sugar cane was planted using two
eyed-cuttings (cane setts with two buds each) obtained by cutting cane stems 9 to 11 months old (plant
cane) from fields on the station or nearby nursery. The cane variety used in both trials was R 570.
Seedlings or young plants of P. paniculatum and P. urvillei were uprooted and collected from an
abandoned sugar cane field in the neighbourhood of the station.
Containers and growing medium
The sugar cane setts and weeds were planted in fibre glass containers 1.0 m long x 0.4 m wide X 0.3 m
deep; an extension using iron sheets 0.3 m high was inserted on the top of each tray to increase the
total planting depth to approximately 0.5 m (Fig. 5.2). For the treatments having root competition,
only one tray was planted with both plants while for the other two treatments (no competition and
shoot competition only) two trays were placed next to each other along the longer sides.
The trays were filled with topsoil collected from the fields on the station; the soil group at
Réduit consists of Low Humic Latosols (L group according to Parish & Feillafé, 1965). Pre-
experimentation soil analysis of the soil used as filling medium showed amounts of total N at 5100 kg
ha-1, 3900 kg ha-1 of total P and 2100 kg ha-1 of total K; the soil pH was 6.2, and CEC was 16.6 cmol
kg-1.
Fig. 5.2. Arrangement of trays (with iron sheet extensions placed on top of the trays to increase depth) for planting cane and weeds.
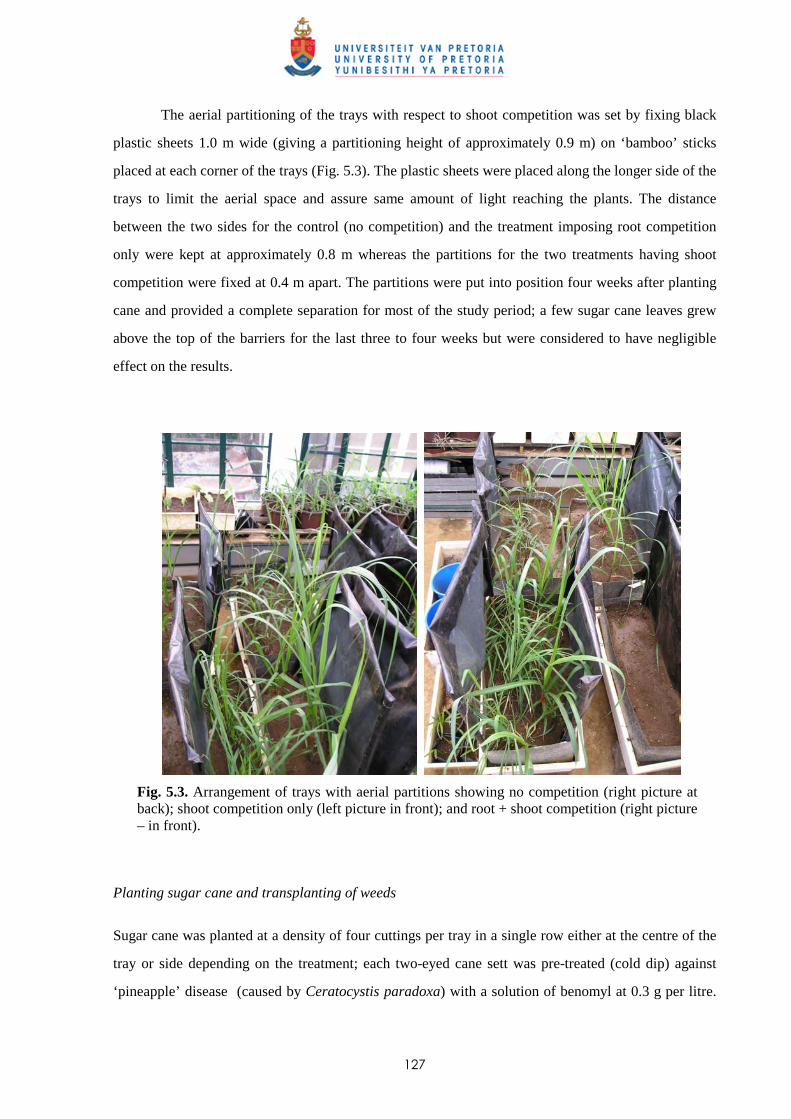
127
The aerial partitioning of the trays with respect to shoot competition was set by fixing black
plastic sheets 1.0 m wide (giving a partitioning height of approximately 0.9 m) on ‘bamboo’ sticks
placed at each corner of the trays (Fig. 5.3). The plastic sheets were placed along the longer side of the
trays to limit the aerial space and assure same amount of light reaching the plants. The distance
between the two sides for the control (no competition) and the treatment imposing root competition
only were kept at approximately 0.8 m whereas the partitions for the two treatments having shoot
competition were fixed at 0.4 m apart. The partitions were put into position four weeks after planting
cane and provided a complete separation for most of the study period; a few sugar cane leaves grew
above the top of the barriers for the last three to four weeks but were considered to have negligible
effect on the results.
Fig. 5.3. Arrangement of trays with aerial partitions showing no competition (right picture at back); shoot competition only (left picture in front); and root + shoot competition (right picture – in front).
Planting sugar cane and transplanting of weeds
Sugar cane was planted at a density of four cuttings per tray in a single row either at the centre of the
tray or side depending on the treatment; each two-eyed cane sett was pre-treated (cold dip) against
‘pineapple’ disease (caused by Ceratocystis paradoxa) with a solution of benomyl at 0.3 g per litre.
128
The weeds were transplanted one or two weeks after planting when the cane setts had started
germination; the weed density used was eight plants/stools per container and they were evenly
distributed and planted in a single row parallel to the cane. The weed leaves were partly pruned to
reduce transpiration at transplanting and both cane and weeds were irrigated regularly to field
capacity. The trays were kept free of other weed species by regular manual weeding which were
carried out at the seedlings stage to avoid any additional competition. The dates of planting and
transplanting of cane and weeds respectively are given in Table 5.1.
Table 5.1 Treatment dates in trials assessing root and shoot competition between sugar cane and two Paspalum species. Dates
Trial Cane planted Weeds transplanted Start of cane
measurements
End of trial
Trial I 15 April 2006 28 April 2006 15 May 2006 6 October 2006
Trial II 16 November 2006 29 November 2006 30 December 2006 10 June 2007
Experimental layout and data collection
Treatments in Trial I were unreplicated because of the limited space inside the glasshouse, therefore,
this is a preliminary trial in which treatment effects should be regarded as tendencies. In Trial II each
treatment was replicated four times. In both trials the trays were disposed in a split-plot design with
main-plots consisting of the two weed species. Data collection consisted of measuring dewlap heights
of the primary cane shoots in each treatment at regular intervals; the dates of the first and last
measurements are shown in Table 5.1. At the end of the experiments, all cane shoots were cut and
measurements were taken for stalk height and dry weight separately for all cane shoots from each tray.
In both trials, the aboveground biomass was collected and samples taken for dry weight
measurements. The plant material was weighed before and after being oven-dried at 105oC for 48
hours. Root biomass of cane and weeds were also measured in both trials after the trays were emptied
and roots of cane and weeds separated, washed and dried.

129
Statistical design and analysis
Genstat (Discovery Edition 2) was used for all the statistical analyses with respect to Trial II. Data for
cane dewlap height, aboveground and root biomass were subjected to analysis of variance (ANOVA)
by using a split-plot design, and main effects and interactions were tested for significance. The two
weeds were the main-plots and the sub-plot treatments consisted of the four combinations of root and
shoot competition. Treatment means obtained by ANOVA were compared using LSD procedures at
P< 0.05 level of significance.
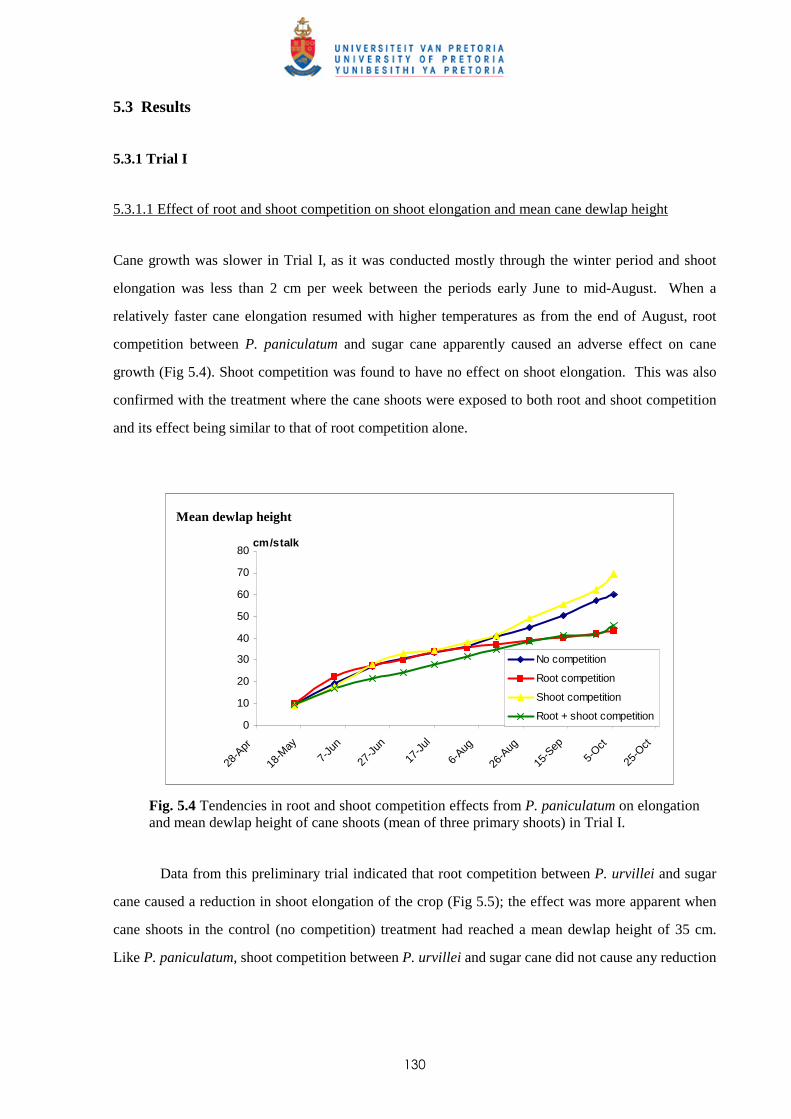
130
5.3 Results
5.3.1 Trial I
5.3.1.1 Effect of root and shoot competition on shoot elongation and mean cane dewlap height
Cane growth was slower in Trial I, as it was conducted mostly through the winter period and shoot
elongation was less than 2 cm per week between the periods early June to mid-August. When a
relatively faster cane elongation resumed with higher temperatures as from the end of August, root
competition between P. paniculatum and sugar cane apparently caused an adverse effect on cane
growth (Fig 5.4). Shoot competition was found to have no effect on shoot elongation. This was also
confirmed with the treatment where the cane shoots were exposed to both root and shoot competition
and its effect being similar to that of root competition alone.
0
10
20
30
40
50
60
70
80
28-A
pr
18-M
ay
7-Ju
n
27-J
un
17-J
ul
6-Aug
26-A
ug
15-S
ep5-
Oct
25-O
ct
cm/stalk
No competition
Root competition
Shoot competition
Root + shoot competition
Fig. 5.4 Tendencies in root and shoot competition effects from P. paniculatum on elongation and mean dewlap height of cane shoots (mean of three primary shoots) in Trial I.
Data from this preliminary trial indicated that root competition between P. urvillei and sugar
cane caused a reduction in shoot elongation of the crop (Fig 5.5); the effect was more apparent when
cane shoots in the control (no competition) treatment had reached a mean dewlap height of 35 cm.
Like P. paniculatum, shoot competition between P. urvillei and sugar cane did not cause any reduction
Mean dewlap height
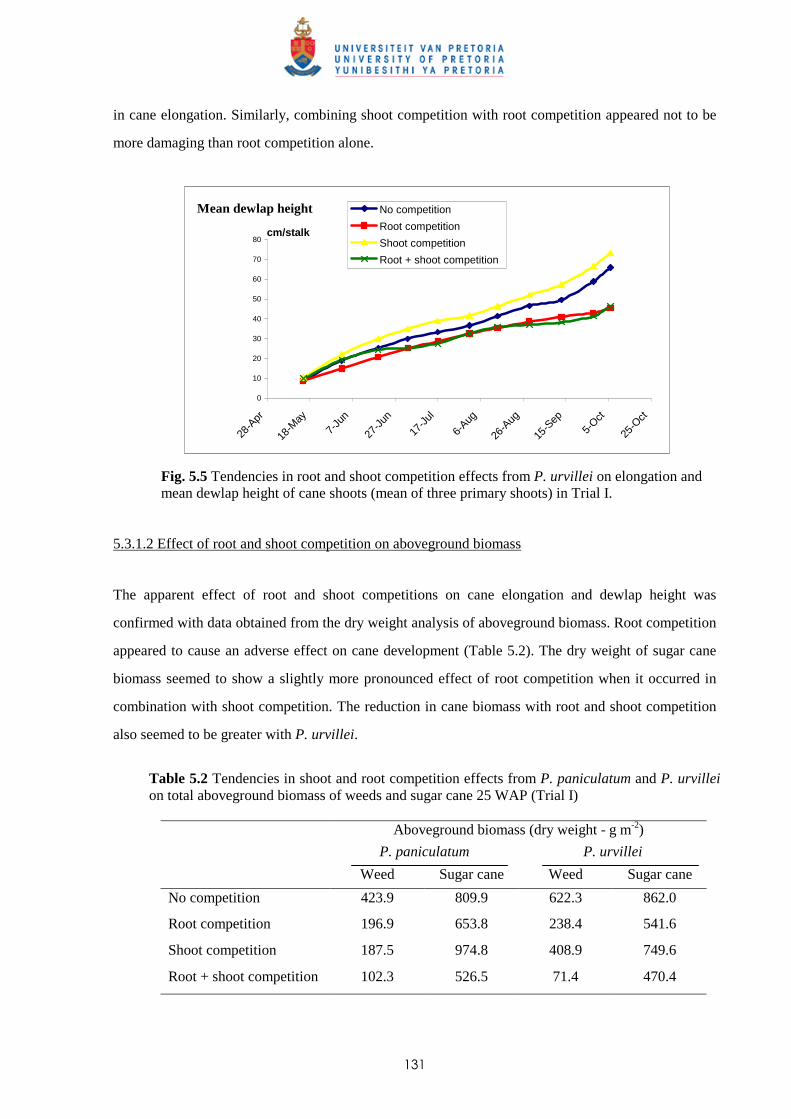
131
in cane elongation. Similarly, combining shoot competition with root competition appeared not to be
more damaging than root competition alone.
0
10
20
30
40
50
60
70
80
28-A
pr
18-M
ay7-
Jun
27-J
un
17-J
ul
6-Aug
26-A
ug
15-S
ep5-
Oct
25-O
ct
cm/stalk
No competition
Root competition
Shoot competition
Root + shoot competition
Fig. 5.5 Tendencies in root and shoot competition effects from P. urvillei on elongation and mean dewlap height of cane shoots (mean of three primary shoots) in Trial I.
5.3.1.2 Effect of root and shoot competition on aboveground biomass
The apparent effect of root and shoot competitions on cane elongation and dewlap height was
confirmed with data obtained from the dry weight analysis of aboveground biomass. Root competition
appeared to cause an adverse effect on cane development (Table 5.2). The dry weight of sugar cane
biomass seemed to show a slightly more pronounced effect of root competition when it occurred in
combination with shoot competition. The reduction in cane biomass with root and shoot competition
also seemed to be greater with P. urvillei.
Table 5.2 Tendencies in shoot and root competition effects from P. paniculatum and P. urvillei on total aboveground biomass of weeds and sugar cane 25 WAP (Trial I)
Aboveground biomass (dry weight - g m-2)
P. paniculatum P. urvillei
Weed Sugar cane Weed Sugar cane
No competition 423.9 809.9 622.3 862.0
Root competition 196.9 653.8 238.4 541.6
Shoot competition 187.5 974.8 408.9 749.6
Root + shoot competition 102.3 526.5 71.4 470.4
Mean dewlap height
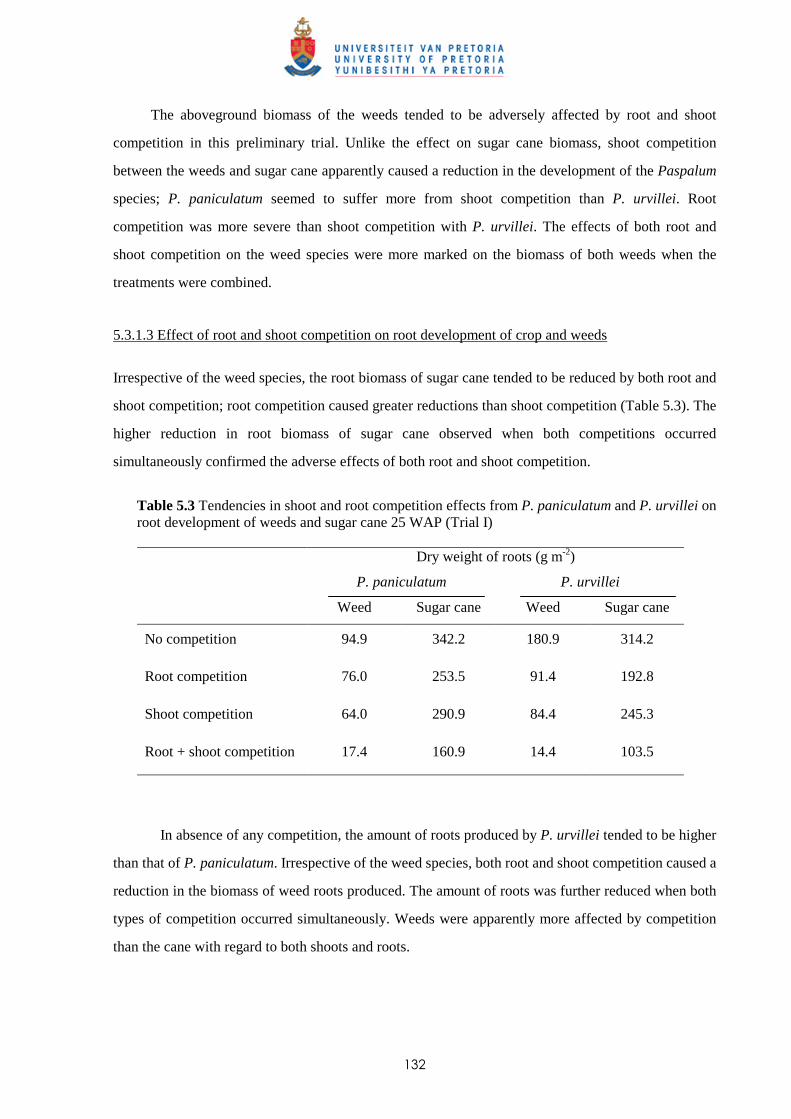
132
The aboveground biomass of the weeds tended to be adversely affected by root and shoot
competition in this preliminary trial. Unlike the effect on sugar cane biomass, shoot competition
between the weeds and sugar cane apparently caused a reduction in the development of the Paspalum
species; P. paniculatum seemed to suffer more from shoot competition than P. urvillei. Root
competition was more severe than shoot competition with P. urvillei. The effects of both root and
shoot competition on the weed species were more marked on the biomass of both weeds when the
treatments were combined.
5.3.1.3 Effect of root and shoot competition on root development of crop and weeds
Irrespective of the weed species, the root biomass of sugar cane tended to be reduced by both root and
shoot competition; root competition caused greater reductions than shoot competition (Table 5.3). The
higher reduction in root biomass of sugar cane observed when both competitions occurred
simultaneously confirmed the adverse effects of both root and shoot competition.
Table 5.3 Tendencies in shoot and root competition effects from P. paniculatum and P. urvillei on root development of weeds and sugar cane 25 WAP (Trial I) Dry weight of roots (g m-2)
P. paniculatum P. urvillei
Weed Sugar cane Weed Sugar cane
No competition 94.9 342.2 180.9 314.2
Root competition 76.0 253.5 91.4 192.8
Shoot competition 64.0 290.9 84.4 245.3
Root + shoot competition 17.4 160.9 14.4 103.5
In absence of any competition, the amount of roots produced by P. urvillei tended to be higher
than that of P. paniculatum. Irrespective of the weed species, both root and shoot competition caused a
reduction in the biomass of weed roots produced. The amount of roots was further reduced when both
types of competition occurred simultaneously. Weeds were apparently more affected by competition
than the cane with regard to both shoots and roots.
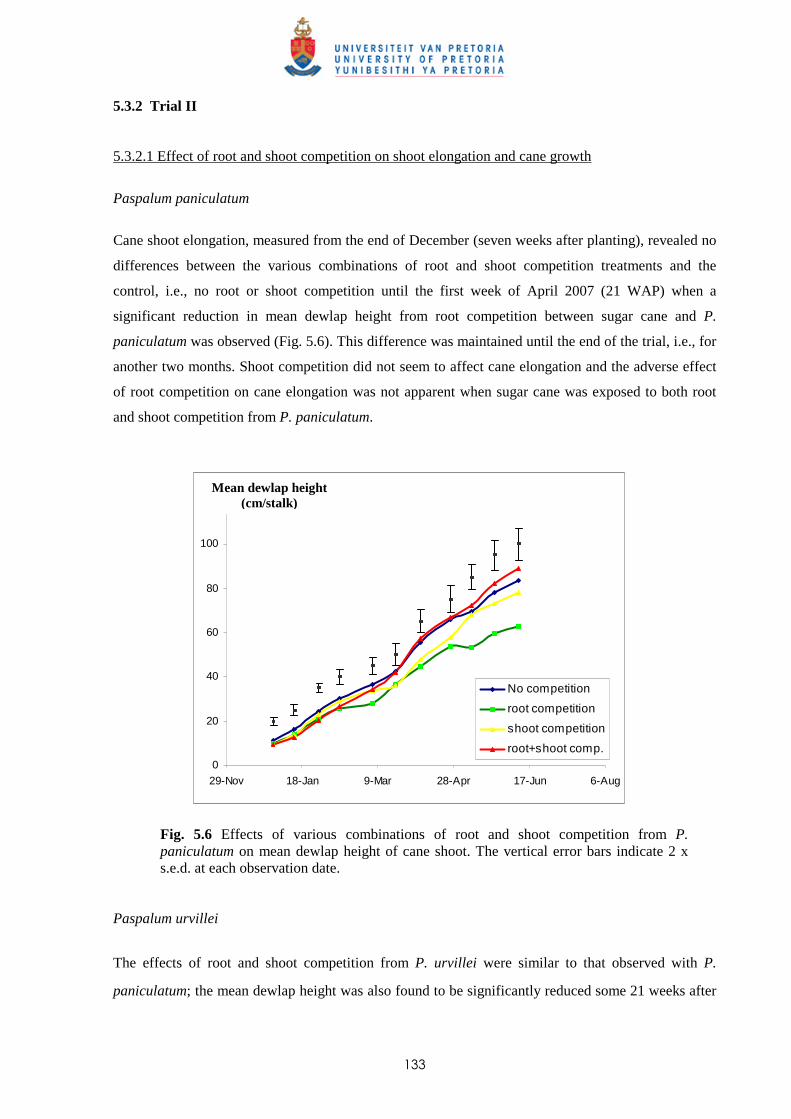
133
5.3.2 Trial II
5.3.2.1 Effect of root and shoot competition on shoot elongation and cane growth
Paspalum paniculatum
Cane shoot elongation, measured from the end of December (seven weeks after planting), revealed no
differences between the various combinations of root and shoot competition treatments and the
control, i.e., no root or shoot competition until the first week of April 2007 (21 WAP) when a
significant reduction in mean dewlap height from root competition between sugar cane and P.
paniculatum was observed (Fig. 5.6). This difference was maintained until the end of the trial, i.e., for
another two months. Shoot competition did not seem to affect cane elongation and the adverse effect
of root competition on cane elongation was not apparent when sugar cane was exposed to both root
and shoot competition from P. paniculatum.
0
20
40
60
80
100
120
29-Nov 18-Jan 9-Mar 28-Apr 17-Jun 6-Aug
cm/stalk
No competition
root competition
shoot competition
root+shoot comp.
Fig. 5.6 Effects of various combinations of root and shoot competition from P. paniculatum on mean dewlap height of cane shoot. The vertical error bars indicate 2 x s.e.d. at each observation date.
Paspalum urvillei
The effects of root and shoot competition from P. urvillei were similar to that observed with P.
paniculatum; the mean dewlap height was also found to be significantly reduced some 21 weeks after
Mean dewlap height (cm/stalk)
134
the start of the trial by root competition (Fig. 5.7). Similarly, no difference in mean dewlap height was
observed between the control and the treatments causing shoot competition. Combining root and shoot
competition did not result in a significant decrease in mean dewlap height of the cane shoots.
0
20
40
60
80
100
120
9-Dec 28-Jan 19-Mar 8-May 27-Jun
cm/stalk
No competition
root competition
shoot competition
root+shoot comp.
Fig. 5.7 Effects of various combinations of root and shoot competition from P. urvillei on mean dewlap height of cane shoots. The vertical error bars indicate 2 x s.e.d. at each observation date.
5.3.2.2 Effect of root and shoot competition on aboveground biomass
Cane shoot
The mean stalk weight (dry) of the three primary shoots which were tagged for elongation
measurements confirmed that root competition had a significant adverse effect on stalk development
of cane (Table 5.4). Unlike the effect on mean dewlap height, shoot competition caused a reduction in
mean stalk weight of cane compared to its growth in the control trays (Table 5.4).
Irrespective of the weed species (main-plot means), root competition caused a higher reduction
of mean stalk weight (of the primary shoots) than the shoot competition treatment. However, root
competition effects from both weeds were not more pronounced than the effects of both types of
competition combined. It appeared that shoot competition had an alleviating effect on root competition
when they occurred together; most probably shoot competition adversely affecting root development
and thereby reducing root competition.
Mean dewlap height (cm/stalk)
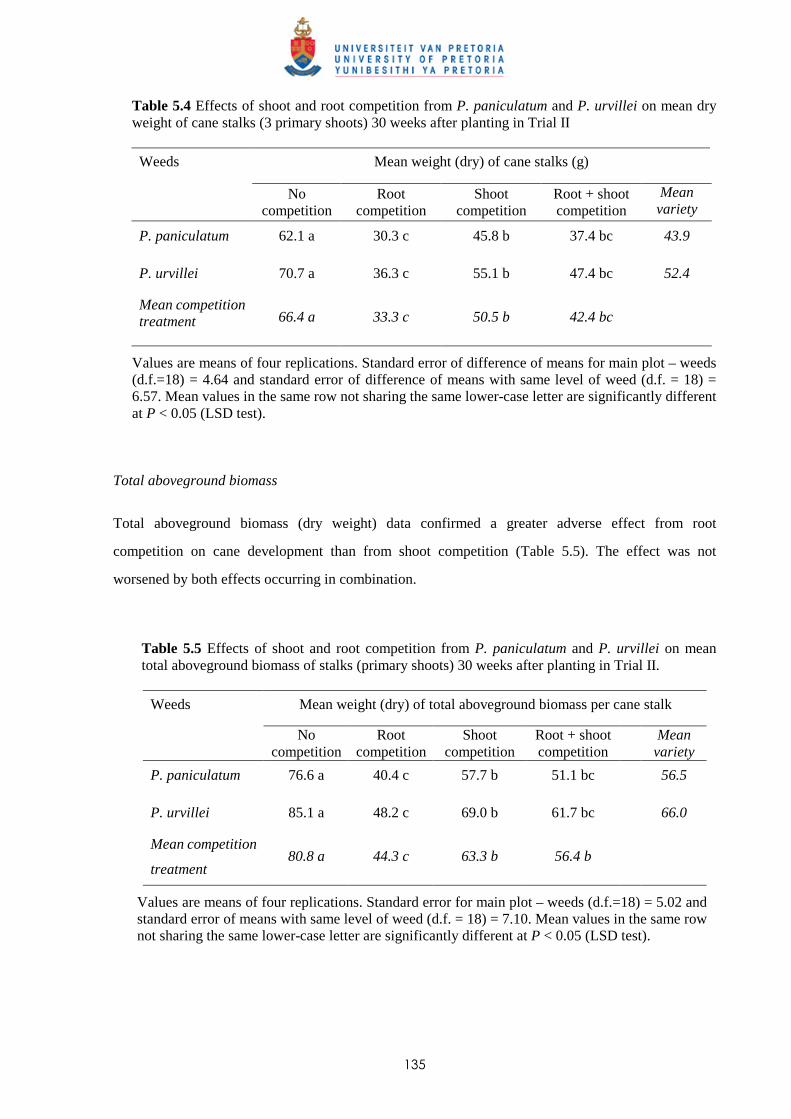
135
Table 5.4 Effects of shoot and root competition from P. paniculatum and P. urvillei on mean dry weight of cane stalks (3 primary shoots) 30 weeks after planting in Trial II
Weeds Mean weight (dry) of cane stalks (g)
No competition
Root competition
Shoot competition
Root + shoot competition
Mean variety
P. paniculatum 62.1 a 30.3 c 45.8 b 37.4 bc 43.9
P. urvillei 70.7 a 36.3 c 55.1 b 47.4 bc 52.4
Mean competition treatment
66.4 a 33.3 c 50.5 b 42.4 bc
Values are means of four replications. Standard error of difference of means for main plot – weeds (d.f.=18) = 4.64 and standard error of difference of means with same level of weed (d.f. = 18) = 6.57. Mean values in the same row not sharing the same lower-case letter are significantly different at P < 0.05 (LSD test).
Total aboveground biomass
Total aboveground biomass (dry weight) data confirmed a greater adverse effect from root
competition on cane development than from shoot competition (Table 5.5). The effect was not
worsened by both effects occurring in combination.
Table 5.5 Effects of shoot and root competition from P. paniculatum and P. urvillei on mean total aboveground biomass of stalks (primary shoots) 30 weeks after planting in Trial II.
Weeds Mean weight (dry) of total aboveground biomass per cane stalk
No competition
Root competition
Shoot competition
Root + shoot competition
Mean variety
P. paniculatum 76.6 a 40.4 c 57.7 b 51.1 bc 56.5
P. urvillei 85.1 a 48.2 c 69.0 b 61.7 bc 66.0
Mean competition
treatment 80.8 a 44.3 c 63.3 b 56.4 b
Values are means of four replications. Standard error for main plot – weeds (d.f.=18) = 5.02 and standard error of means with same level of weed (d.f. = 18) = 7.10. Mean values in the same row not sharing the same lower-case letter are significantly different at P < 0.05 (LSD test).
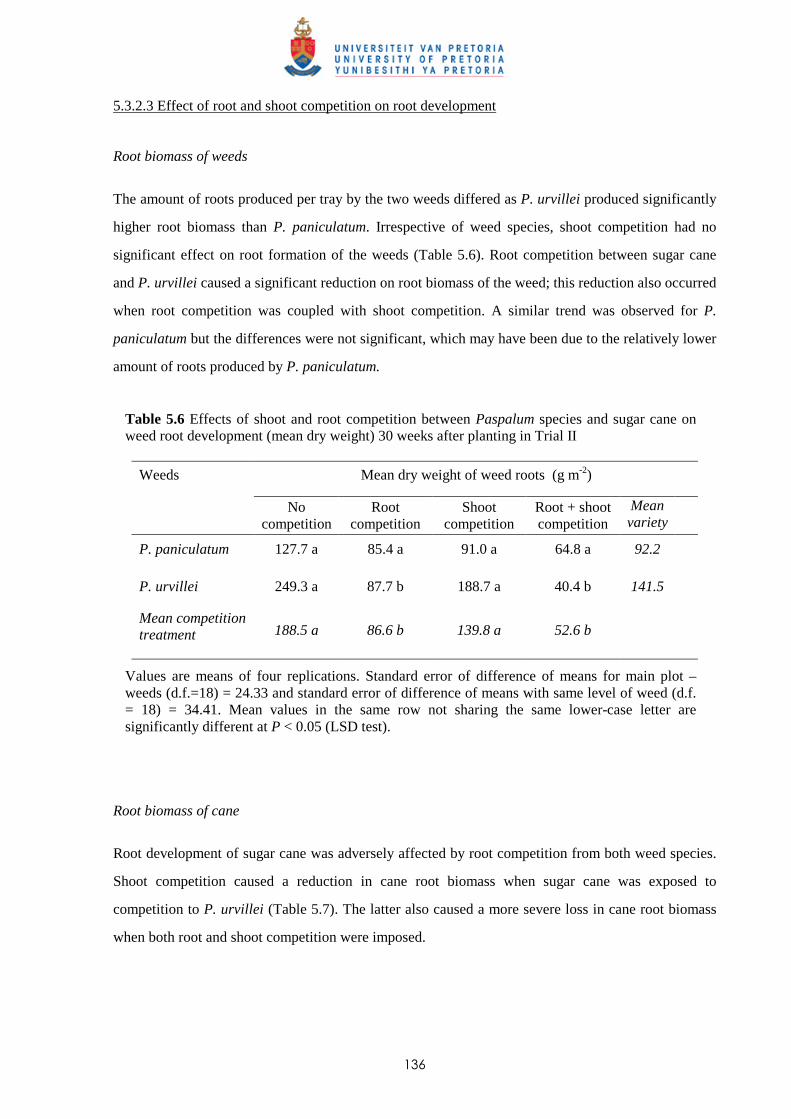
136
5.3.2.3 Effect of root and shoot competition on root development
Root biomass of weeds
The amount of roots produced per tray by the two weeds differed as P. urvillei produced significantly
higher root biomass than P. paniculatum. Irrespective of weed species, shoot competition had no
significant effect on root formation of the weeds (Table 5.6). Root competition between sugar cane
and P. urvillei caused a significant reduction on root biomass of the weed; this reduction also occurred
when root competition was coupled with shoot competition. A similar trend was observed for P.
paniculatum but the differences were not significant, which may have been due to the relatively lower
amount of roots produced by P. paniculatum.
Table 5.6 Effects of shoot and root competition between Paspalum species and sugar cane on weed root development (mean dry weight) 30 weeks after planting in Trial II
Weeds Mean dry weight of weed roots (g m-2)
No competition
Root competition
Shoot competition
Root + shoot competition
Mean variety
P. paniculatum 127.7 a 85.4 a 91.0 a 64.8 a 92.2
P. urvillei 249.3 a 87.7 b 188.7 a 40.4 b 141.5
Mean competition treatment
188.5 a 86.6 b 139.8 a 52.6 b
Values are means of four replications. Standard error of difference of means for main plot – weeds (d.f.=18) = 24.33 and standard error of difference of means with same level of weed (d.f. = 18) = 34.41. Mean values in the same row not sharing the same lower-case letter are significantly different at P < 0.05 (LSD test).
Root biomass of cane
Root development of sugar cane was adversely affected by root competition from both weed species.
Shoot competition caused a reduction in cane root biomass when sugar cane was exposed to
competition to P. urvillei (Table 5.7). The latter also caused a more severe loss in cane root biomass
when both root and shoot competition were imposed.
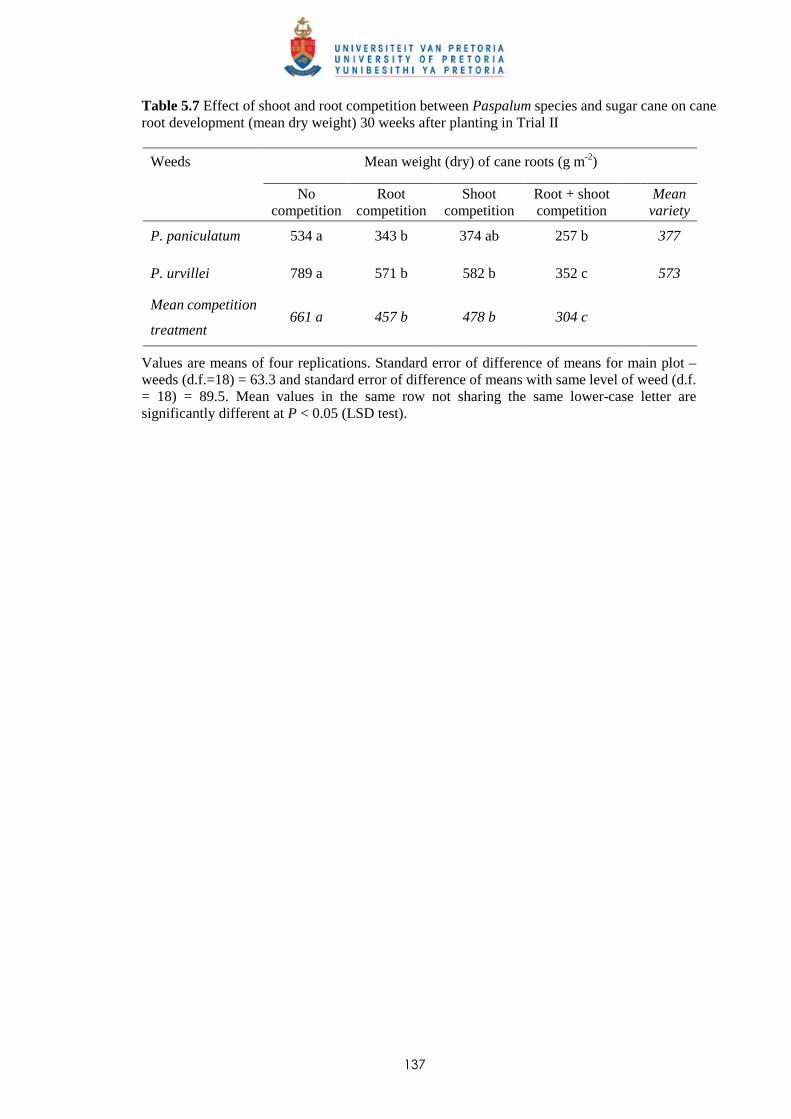
137
Table 5.7 Effect of shoot and root competition between Paspalum species and sugar cane on cane root development (mean dry weight) 30 weeks after planting in Trial II
Weeds Mean weight (dry) of cane roots (g m-2)
No competition
Root competition
Shoot competition
Root + shoot competition
Mean
variety
P. paniculatum 534 a 343 b 374 ab 257 b 377
P. urvillei 789 a 571 b 582 b 352 c 573
Mean competition
treatment 661 a 457 b 478 b 304 c
Values are means of four replications. Standard error of difference of means for main plot – weeds (d.f.=18) = 63.3 and standard error of difference of means with same level of weed (d.f. = 18) = 89.5. Mean values in the same row not sharing the same lower-case letter are significantly different at P < 0.05 (LSD test).
138
5.4 Discussion and conclusions
Results showed that the mechanisms responsible for growth reduction in sugar cane in presence of
Paspalum species seem to include root competition. In fact, for many of the parameters measured, root
competition was found to be more severe than shoot competition. This finding supports those of other
studies that compared shoot and root competition in rice (Assemat et al., 1981; Perera et al., 1992;
Gibson et al., 1999) and in cereals (Aspinall, 1960; Satorre & Snaydon, 1992).
The effect of root competition on mean dewlap height of sugar cane was visible only after
several weeks of exposure to the treatments or when the cane stems had reached more than 35 to 40
cm in dewlap height (Figs 5.4-5.7). Although the mean dewlap heights did not reveal major
differences between combinations of shoot competition and the full (root + shoot) competition on the
last day of the respective trials, bigger differences were noted between the control (no competition)
and the root and shoot treatments for mean weight of the same ‘tagged’ stems measured. This may
partly be explained by the etiolating effect of cane stems for light resources under shoot competition
and may also explain the relatively lower damage observed in some cases by the full competition
effect compared to root competition only.
Haugland (1993) reported an increase in specific leaf area by shading from shoot competition,
which made target plants less susceptible to competition for light. An increase in plant height due to
shoot competition by E. phyllopogon on rice was also observed by Gibson et al. (1999); the ability to
increase plant height could have limited the effect of light competition on the target plant.
Root development of sugar cane was impaired by both root and shoot competition. A more
severe reduction was not recorded when both occurred simultaneously which may suggest that they
were not affecting root development in the same manner. Haugland (1993) reported that shoot
competition reduced root dry weight and increased shoot/root ratio, which in turn probably can reduce
plant survival. Root competition also reduced the amount of weed roots and this was significant for P.
urvillei, which produces more roots than P. paniculatum. The reduction in root biomass of weeds by
shoot competition was not significant in Trial II although there was a tendency that it was more
important than shoot competition in Trial I.
The divided box technique has been criticised because of the restricted soil volumes often
employed and the possibility of greater resources availability to those treatments involving no
competition (Froud-Williams, 2002). However, due to the relatively large size of the tray used in this
study and the planting density imposed, the percentage of crop and weed roots occupying the volume
of soil placed in the tray should have been lower than that under field conditions. Therefore, cane root
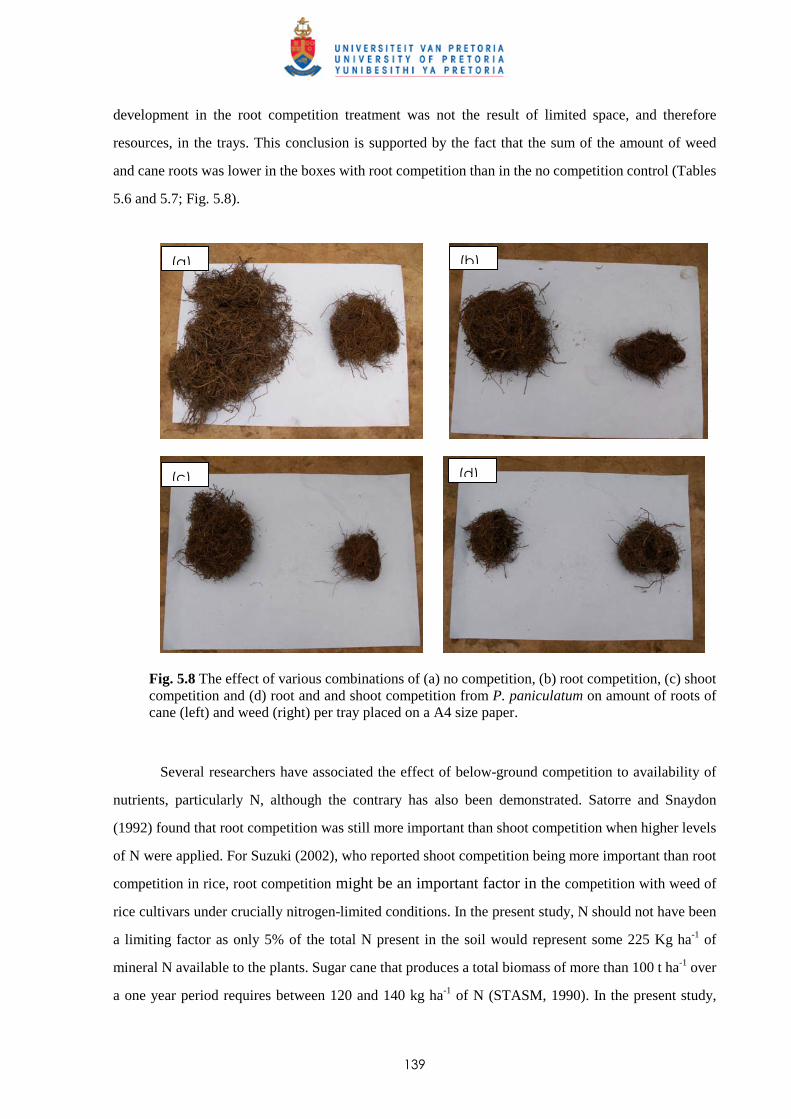
139
development in the root competition treatment was not the result of limited space, and therefore
resources, in the trays. This conclusion is supported by the fact that the sum of the amount of weed
and cane roots was lower in the boxes with root competition than in the no competition control (Tables
5.6 and 5.7; Fig. 5.8).
Fig. 5.8 The effect of various combinations of (a) no competition, (b) root competition, (c) shoot competition and (d) root and and shoot competition from P. paniculatum on amount of roots of cane (left) and weed (right) per tray placed on a A4 size paper.
Several researchers have associated the effect of below-ground competition to availability of
nutrients, particularly N, although the contrary has also been demonstrated. Satorre and Snaydon
(1992) found that root competition was still more important than shoot competition when higher levels
of N were applied. For Suzuki (2002), who reported shoot competition being more important than root
competition in rice, root competition might be an important factor in the competition with weed of
rice cultivars under crucially nitrogen-limited conditions. In the present study, N should not have been
a limiting factor as only 5% of the total N present in the soil would represent some 225 Kg ha-1 of
mineral N available to the plants. Sugar cane that produces a total biomass of more than 100 t ha-1 over
a one year period requires between 120 and 140 kg ha-1 of N (STASM, 1990). In the present study,
(a)
(c)
(b)
(d)
140
cane was grown for only seven months and biomass produced was much smaller than for a normal
crop cycle. Similarly, the available amount of P2O5 should not have been a limiting factor influencing
root development. In the absence of competition for N or other nutrients, there is a need for other
explanations for root reduction. It is possible that allelopathy could have played a role in determining
the growth of cane and weeds. However, several other factors not amenable to testing in the box
experiments can also play a role in determining competition in the field. For example, the rooting
depth and root distribution of some crops and weeds differ appreciably, causing considerable
difference in competitive effects, due to differences in nutrient and water scavenging ability between
the different root systems.
Findings presented in this chapter reveal (no previous work studying this aspect reported) that
weed competition in sugar cane is caused by both root and shoot competition and the relative
competitiveness of an individual weed is more complex and cannot solely be described by
aboveground competition mechanisms, e.g., weed competition models based on relative leaf areas.
141
CHAPTER 6
ALLELOPATHIC EFFECT OF PASPALUM PANICULATUM AND PASPALUM
URVILLEI ON GROWTH OF SUGAR CANE
6.1 Introduction
Sugar cane is a very important crop in Mauritius and occupies approximately 80% of the arable land.
This perennial plant of the grass family is grown over a period of 12 to 18 months during the first year,
followed by a 12-month ratoon crop for another six to eight years. As the growing period is relatively
long, taking between 4 to 8 months for complete canopy closure, weeds need to be controlled
efficiently (Rochecouste, 1967). The traditional practice has been to target 100% control of all weeds
from sugar cane fields irrespective of the amount and species of the weeds and stage of growth of the
cane, by use of large amounts of pre- and post-emergence herbicides. The average amount of
herbicides used annually has varied between 8 to 10 kg a.i. ha-1 during the last three decades (MSIRI,
2004). The costs for weed control have increased significantly during the last ten years; the average
cost for herbicides exceeds MUR 4 000 ha-1 (120 US $ ha-1) annually (see Chapter 1).
Increasing pressure on farmers to optimise their use of pesticides to reduce environmental
effects and to minimize costs has led to the development of strategies for integrated weed management
(IWM) and use of alternative methods to herbicides for weed control. IWM has also become the basis
of all FAO plant protection activities because it contributes directly towards the achievement of
sustainable agriculture in developing countries (Labrada & Parker, 1994). Development of such
strategies in the Mauritian sugar industry became even more urgent with the announcement and
implementation of a price reduction of 37% by 2009 by the EU, the main importer of Mauritian sugar.
Several projects have been initiated since 1998 to develop weed management strategies in sugar cane.
Firstly, trials studying critical periods of weed competition under the worst agroclimatic conditions of
the island have revealed that weed competition started 12 WAH and ended 26 WAH in ratoon cane,
and control measures may need to be maintained up to 29 WAP to keep yield losses below 5% in plant
cane (Chapter 2; Seeruttun & Lutman, 2004). These studies to compare relative competitiveness of
various weed species commonly present in sugar cane fields have revealed sugar cane as a stronger
competitor than most of the weeds tested; the time of emergence and rate of development of the weed
species influencing the effect. The mechanism of the aboveground competition in sugar cane has been
studied by comparing the competitive ability of two Paspalum species with different morphological
142
traits; P. urvillei being a tussocky mostly erect perennial reaching 150-200 cm in height and leaves 12-
50 cm long while P. paniculatum reaches a maximum height of 100-150 cm with lanceolate leaves 20-
40 cm long and 1.0-2.5 cm broad, with a more planophile arrangement (Mc Intyre, 1991). Paspalum
paniculatum has been found to be relatively more competitive than P. urvillei despite the latter
growing taller and having higher relative leaf areas. This difference led to investigations on
mechanisms of competition occurring between sugar cane and the two Paspalum species (Chapter 5).
Shoot versus root competition trials showed that root (underground) competition was important in
sugar cane. However, the trials were not able to elucidate the cause of the difference in
competitiveness between the two Paspalum species.
Weed interference is a term used to express competition by both indirect interaction (e.g. crop
and weeds competing for limited resources such as light, mineral nutrients, water, or volume of space)
and direct interactions/interference (e.g. suppression of growth of one individual by the other releasing
phytotoxic chemicals). Allelopathy is a phenomenon observed in many plants that release chemicals
into their near environment either from their aerial or underground parts in the form of root exudates
(Rice, 1984). The chemical compounds released into the environment act on the other organisms, such
as weeds, plants, animals and microorganisms, by inhibitory or excitatory ways. These chemicals
accumulate and persist for a considerable time, thereby imparting significant interference on the
growth and development of neighbouring weeds and plants (Putman & Duke, 1974). Literature
reviews by Putnam (1988) and Williamson (1990) have described allelopathy caused by substances
from a number of cultivated plants and weeds. Allelopathic potential of many gramineous weeds have
been reported including that of extracts of Paspalum notatum Flueggé (bahiagrass) and other warm-
season grasses on alfalfa and Italian ryegrass (Martin & Smith, 1994), interference between
bermudagrass [Cynodon dactylon (L.) Pers] or johnsongrass [Sorghum halepense (L.) Pers] and cotton
or corn (Vasilakoglou et al., 2005) and nutgrass (Cyperus rotundus) on rice seedlings (Quayyum et al.,
2000). Ishmine et al. (1987) studied the potential of some dominant weeds of sugar cane on the
Ryukyu Islands and reported that exudates of P. urvillei caused an adverse effect on growth of
Phaseolus vulgaris in greenhouse trials. Root exudates of P. notatum have also been reported to
reduce soybean and okra (Hibiscus esculentus) height increments (Pope et al., 1984). Mc Intyre (1998)
reported an allelopathic effect of C. rotundus on sugar cane.
Considerable current research on allelopathy is focused on its use in weed management
strategies, either by identifying allelochemicals for production of bioherbicides or to serve as leads for
synthetic herbicides. Much research effort is also spent on identification of crop cultivars having
allelopathic properties which can suppress weeds. One means of exploiting allelopathy for weed
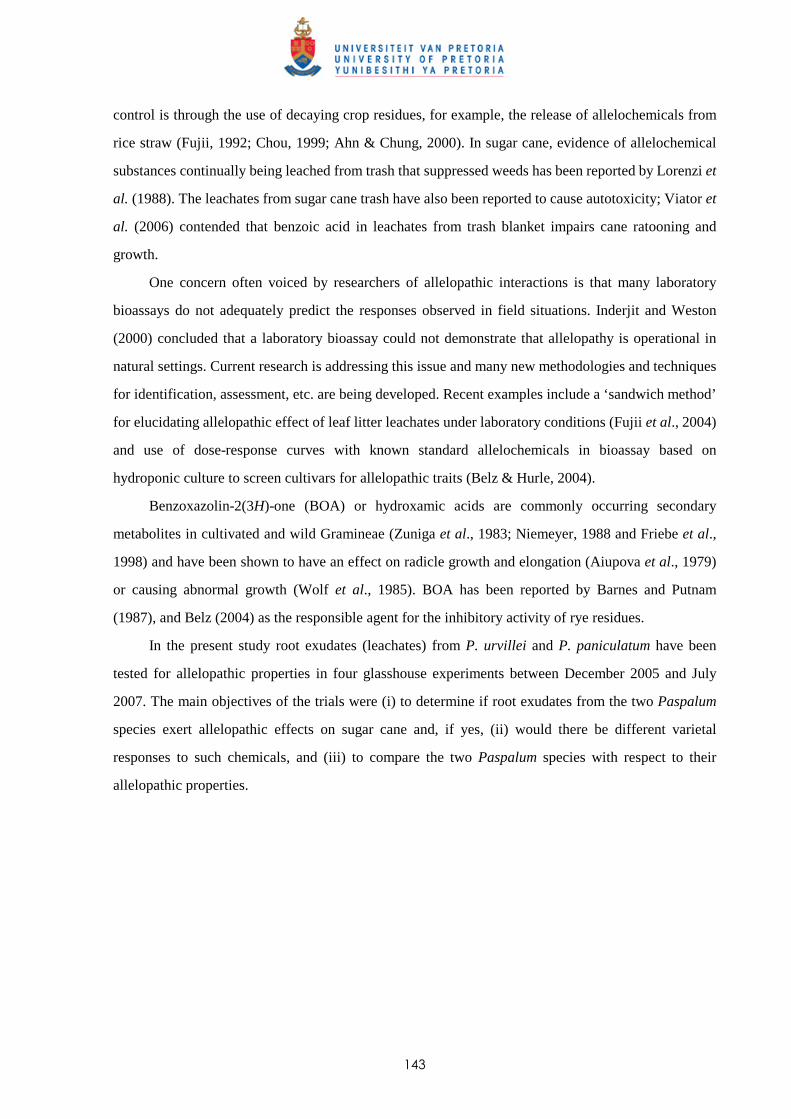
143
control is through the use of decaying crop residues, for example, the release of allelochemicals from
rice straw (Fujii, 1992; Chou, 1999; Ahn & Chung, 2000). In sugar cane, evidence of allelochemical
substances continually being leached from trash that suppressed weeds has been reported by Lorenzi et
al. (1988). The leachates from sugar cane trash have also been reported to cause autotoxicity; Viator et
al. (2006) contended that benzoic acid in leachates from trash blanket impairs cane ratooning and
growth.
One concern often voiced by researchers of allelopathic interactions is that many laboratory
bioassays do not adequately predict the responses observed in field situations. Inderjit and Weston
(2000) concluded that a laboratory bioassay could not demonstrate that allelopathy is operational in
natural settings. Current research is addressing this issue and many new methodologies and techniques
for identification, assessment, etc. are being developed. Recent examples include a ‘sandwich method’
for elucidating allelopathic effect of leaf litter leachates under laboratory conditions (Fujii et al., 2004)
and use of dose-response curves with known standard allelochemicals in bioassay based on
hydroponic culture to screen cultivars for allelopathic traits (Belz & Hurle, 2004).
Benzoxazolin-2(3H)-one (BOA) or hydroxamic acids are commonly occurring secondary
metabolites in cultivated and wild Gramineae (Zuniga et al., 1983; Niemeyer, 1988 and Friebe et al.,
1998) and have been shown to have an effect on radicle growth and elongation (Aiupova et al., 1979)
or causing abnormal growth (Wolf et al., 1985). BOA has been reported by Barnes and Putnam
(1987), and Belz (2004) as the responsible agent for the inhibitory activity of rye residues.
In the present study root exudates (leachates) from P. urvillei and P. paniculatum have been
tested for allelopathic properties in four glasshouse experiments between December 2005 and July
2007. The main objectives of the trials were (i) to determine if root exudates from the two Paspalum
species exert allelopathic effects on sugar cane and, if yes, (ii) would there be different varietal
responses to such chemicals, and (iii) to compare the two Paspalum species with respect to their
allelopathic properties.
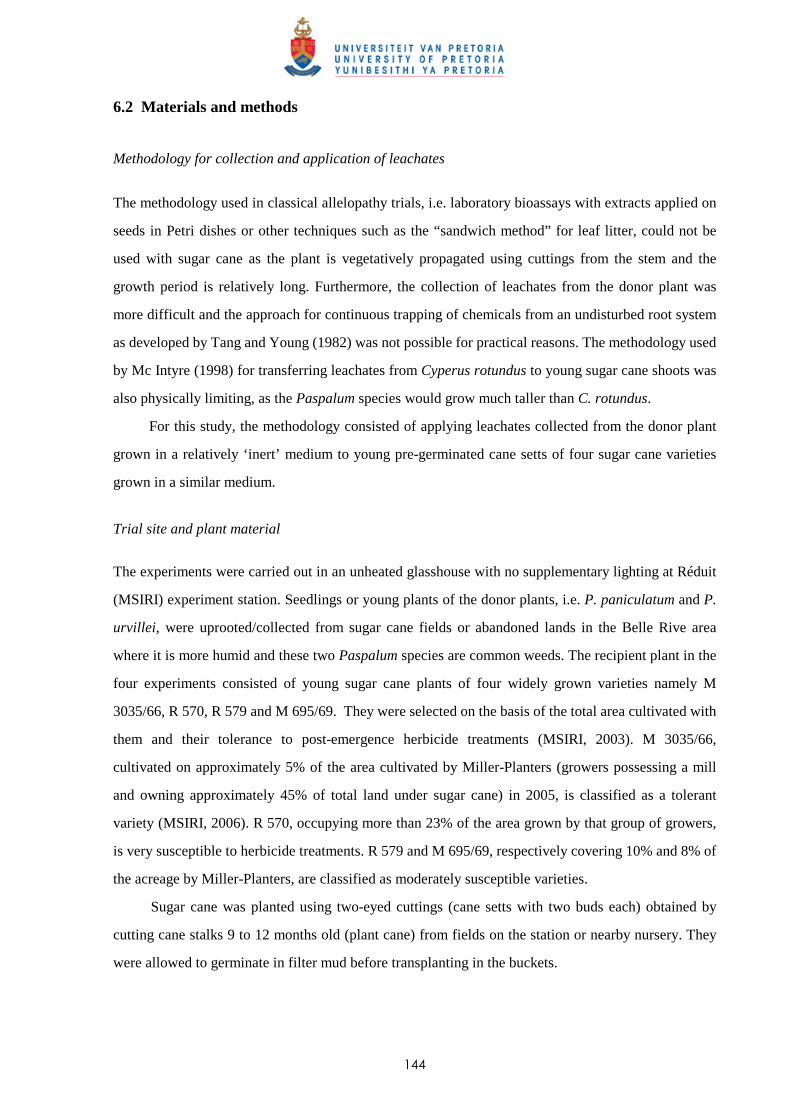
144
6.2 Materials and methods
Methodology for collection and application of leachates
The methodology used in classical allelopathy trials, i.e. laboratory bioassays with extracts applied on
seeds in Petri dishes or other techniques such as the “sandwich method” for leaf litter, could not be
used with sugar cane as the plant is vegetatively propagated using cuttings from the stem and the
growth period is relatively long. Furthermore, the collection of leachates from the donor plant was
more difficult and the approach for continuous trapping of chemicals from an undisturbed root system
as developed by Tang and Young (1982) was not possible for practical reasons. The methodology used
by Mc Intyre (1998) for transferring leachates from Cyperus rotundus to young sugar cane shoots was
also physically limiting, as the Paspalum species would grow much taller than C. rotundus.
For this study, the methodology consisted of applying leachates collected from the donor plant
grown in a relatively ‘inert’ medium to young pre-germinated cane setts of four sugar cane varieties
grown in a similar medium.
Trial site and plant material
The experiments were carried out in an unheated glasshouse with no supplementary lighting at Réduit
(MSIRI) experiment station. Seedlings or young plants of the donor plants, i.e. P. paniculatum and P.
urvillei, were uprooted/collected from sugar cane fields or abandoned lands in the Belle Rive area
where it is more humid and these two Paspalum species are common weeds. The recipient plant in the
four experiments consisted of young sugar cane plants of four widely grown varieties namely M
3035/66, R 570, R 579 and M 695/69. They were selected on the basis of the total area cultivated with
them and their tolerance to post-emergence herbicide treatments (MSIRI, 2003). M 3035/66,
cultivated on approximately 5% of the area cultivated by Miller-Planters (growers possessing a mill
and owning approximately 45% of total land under sugar cane) in 2005, is classified as a tolerant
variety (MSIRI, 2006). R 570, occupying more than 23% of the area grown by that group of growers,
is very susceptible to herbicide treatments. R 579 and M 695/69, respectively covering 10% and 8% of
the acreage by Miller-Planters, are classified as moderately susceptible varieties.
Sugar cane was planted using two-eyed cuttings (cane setts with two buds each) obtained by
cutting cane stalks 9 to 12 months old (plant cane) from fields on the station or nearby nursery. They
were allowed to germinate in filter mud before transplanting in the buckets.
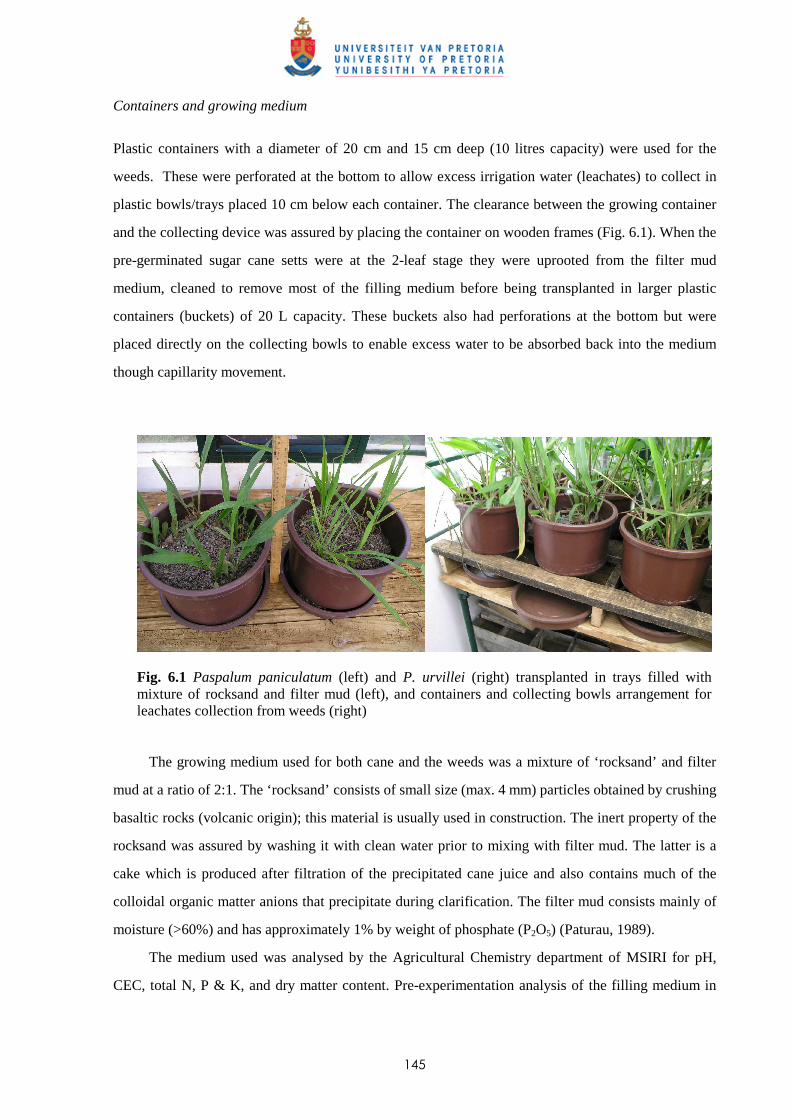
145
Containers and growing medium
Plastic containers with a diameter of 20 cm and 15 cm deep (10 litres capacity) were used for the
weeds. These were perforated at the bottom to allow excess irrigation water (leachates) to collect in
plastic bowls/trays placed 10 cm below each container. The clearance between the growing container
and the collecting device was assured by placing the container on wooden frames (Fig. 6.1). When the
pre-germinated sugar cane setts were at the 2-leaf stage they were uprooted from the filter mud
medium, cleaned to remove most of the filling medium before being transplanted in larger plastic
containers (buckets) of 20 L capacity. These buckets also had perforations at the bottom but were
placed directly on the collecting bowls to enable excess water to be absorbed back into the medium
though capillarity movement.
Fig. 6.1 Paspalum paniculatum (left) and P. urvillei (right) transplanted in trays filled with mixture of rocksand and filter mud (left), and containers and collecting bowls arrangement for leachates collection from weeds (right)
The growing medium used for both cane and the weeds was a mixture of ‘rocksand’ and filter
mud at a ratio of 2:1. The ‘rocksand’ consists of small size (max. 4 mm) particles obtained by crushing
basaltic rocks (volcanic origin); this material is usually used in construction. The inert property of the
rocksand was assured by washing it with clean water prior to mixing with filter mud. The latter is a
cake which is produced after filtration of the precipitated cane juice and also contains much of the
colloidal organic matter anions that precipitate during clarification. The filter mud consists mainly of
moisture (>60%) and has approximately 1% by weight of phosphate (P2O5) (Paturau, 1989).
The medium used was analysed by the Agricultural Chemistry department of MSIRI for pH,
CEC, total N, P & K, and dry matter content. Pre-experimentation analysis of the filling medium in
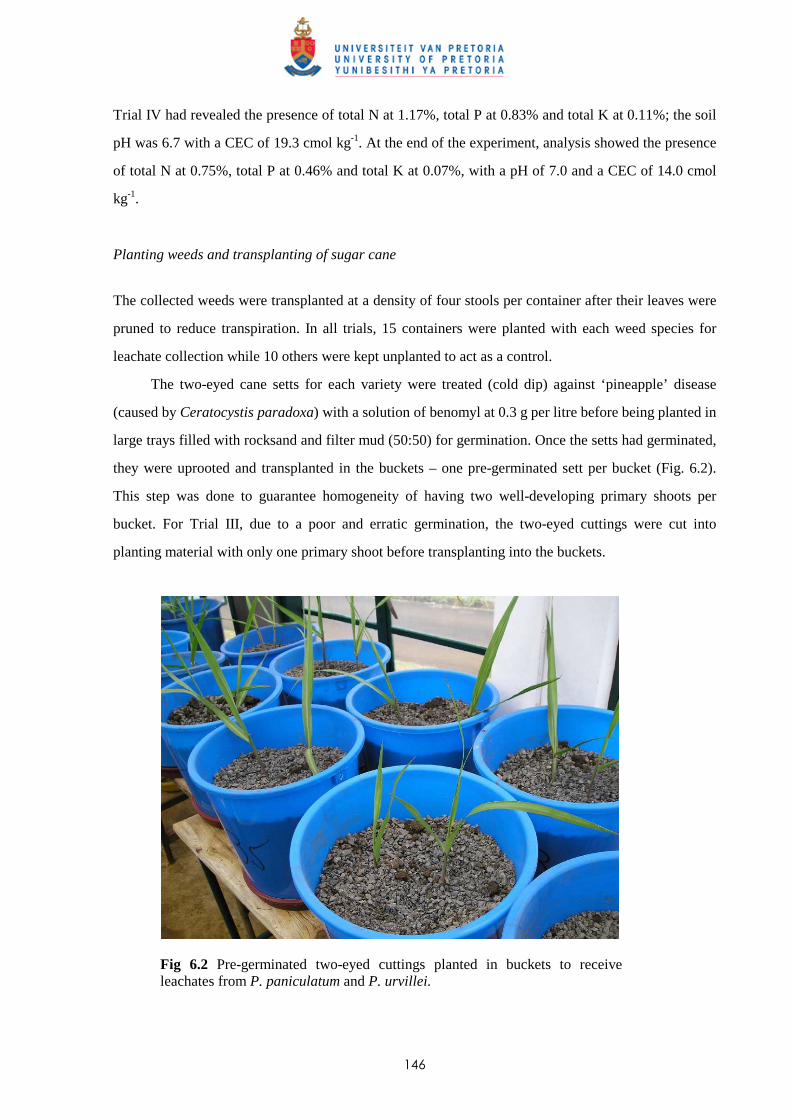
146
Trial IV had revealed the presence of total N at 1.17%, total P at 0.83% and total K at 0.11%; the soil
pH was 6.7 with a CEC of 19.3 cmol kg-1. At the end of the experiment, analysis showed the presence
of total N at 0.75%, total P at 0.46% and total K at 0.07%, with a pH of 7.0 and a CEC of 14.0 cmol
kg-1.
Planting weeds and transplanting of sugar cane
The collected weeds were transplanted at a density of four stools per container after their leaves were
pruned to reduce transpiration. In all trials, 15 containers were planted with each weed species for
leachate collection while 10 others were kept unplanted to act as a control.
The two-eyed cane setts for each variety were treated (cold dip) against ‘pineapple’ disease
(caused by Ceratocystis paradoxa) with a solution of benomyl at 0.3 g per litre before being planted in
large trays filled with rocksand and filter mud (50:50) for germination. Once the setts had germinated,
they were uprooted and transplanted in the buckets – one pre-germinated sett per bucket (Fig. 6.2).
This step was done to guarantee homogeneity of having two well-developing primary shoots per
bucket. For Trial III, due to a poor and erratic germination, the two-eyed cuttings were cut into
planting material with only one primary shoot before transplanting into the buckets.
Fig 6.2 Pre-germinated two-eyed cuttings planted in buckets to receive leachates from P. paniculatum and P. urvillei.
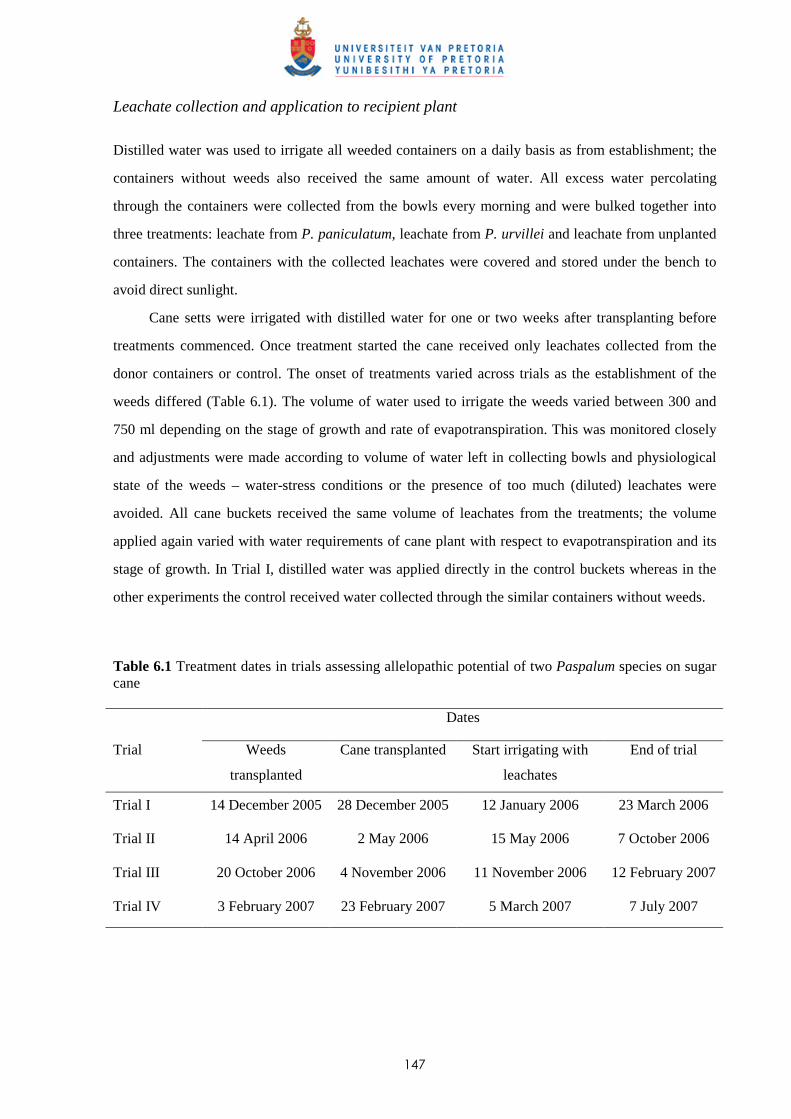
147
Leachate collection and application to recipient plant
Distilled water was used to irrigate all weeded containers on a daily basis as from establishment; the
containers without weeds also received the same amount of water. All excess water percolating
through the containers were collected from the bowls every morning and were bulked together into
three treatments: leachate from P. paniculatum, leachate from P. urvillei and leachate from unplanted
containers. The containers with the collected leachates were covered and stored under the bench to
avoid direct sunlight.
Cane setts were irrigated with distilled water for one or two weeks after transplanting before
treatments commenced. Once treatment started the cane received only leachates collected from the
donor containers or control. The onset of treatments varied across trials as the establishment of the
weeds differed (Table 6.1). The volume of water used to irrigate the weeds varied between 300 and
750 ml depending on the stage of growth and rate of evapotranspiration. This was monitored closely
and adjustments were made according to volume of water left in collecting bowls and physiological
state of the weeds – water-stress conditions or the presence of too much (diluted) leachates were
avoided. All cane buckets received the same volume of leachates from the treatments; the volume
applied again varied with water requirements of cane plant with respect to evapotranspiration and its
stage of growth. In Trial I, distilled water was applied directly in the control buckets whereas in the
other experiments the control received water collected through the similar containers without weeds.
Table 6.1 Treatment dates in trials assessing allelopathic potential of two Paspalum species on sugar cane Dates
Trial Weeds
transplanted
Cane transplanted Start irrigating with
leachates
End of trial
Trial I 14 December 2005 28 December 2005 12 January 2006 23 March 2006
Trial II 14 April 2006 2 May 2006 15 May 2006 7 October 2006
Trial III 20 October 2006 4 November 2006 11 November 2006 12 February 2007
Trial IV 3 February 2007 23 February 2007 5 March 2007 7 July 2007
148
Experimental layout and data collection
The buckets with cane plants were placed on a bench (1 m above floor) on one side of the glasshouse
while the weeds were placed in a similar manner on the opposite side. The temperature in the
glasshouse was slightly higher than the outside temperatures during the day; all window/opening were
left open with a fine mesh wire gauze screen to prevent any insects, etc. Natural day-light was used
and the main advantage of placing the trays indoors were to control water regimes by preventing the
effect of rainfall.
Data collection consisted of measuring dewlap heights of the primary shoots in each bucket at
regular intervals. For Trial I, the first measurement of cane shoot height (dewlap height) was made on
11 January 2006 and was followed by a second one on 6 February 2006. On 23 February 2006 (12
weeks after transplanting), all cane shoots were cut and measurements were taken for stalk height.
The harvested material was sorted into primary tillers and new tillers from each bucket and weighed.
Sub-samples from the harvested material were weighed before and after being oven-dried at 105oC for
48 hours. The buckets were emptied on 25 February 2006 for dry weight analysis of root biomass.
For Trial II, cane measurements started on 15 May 2006 and subsequently were taken on 2 June
2006, 19 June 2006, 3 July 2006, 17 July 2006, 1 August 2006, 14 August 2006, 29 August 2006, 13
September 2006 and 28 September 2006. On 6 October 2006, all shoots were measured for the last
time before being cut at ground level and the roots excavated. All harvested samples were weighed
before and after oven-drying at 105oC for 48 hours.
For Trial III, dewlap height was measured for each primary shoot on 24 November 2006, 4
December 2006, 14 December 2006, 26 December 2006, 10 January 2007, 19 January 2007 and 29
January 2007. Aboveground and root biomass (dry weights) of cane were measured for each treatment
at the end of the trial, as described above.
Cane measurements in Trial IV started on 6 March 2007 and were also carried out on 21 March
2007, 6 April 2007, 26 April 2007, 10 May 2007, 25 May 2007, 20 June 2007 and 5 July 2007. All
cane shoots were chopped and roots excavated on 5 July 2007. They were weighed before and after
being oven-dried at 105 oC for 48 hours; dry weight of cane stalks, cane leaves and biomass of cane
root per bucket were recorded.
For determining root biomass, the buckets were emptied and all roots separated from the filling
material before being washed to remove all filter mud. The roots were separated from cane setts and
oven-dried for 48 hours before being weighed.
149
Statistical design and analysis
Genstat (Discovery Edition 2) was the statistical package used for all the statistical analyses. All data
recorded from cane measurements (dewlap heights), aboveground and root biomasses were subjected
to analysis of variance (ANOVA) by using a split-plot design, and main effects and interactions were
tested for significance. The four cane varieties were the main-plots and the three sub-plot treatments
consisted of leachates from P. paniculatum, P. urvillei and control; each treatment was replicated three
times. Treatment means obtained by ANOVA were compared using LSD procedures at P = 0.05 level
of significance.
Chemical analysis of leachates from P. paniculatum and P. urvillei
Leachates from the two grass weeds were collected from Trial IV and brought to the Agricultural
Chemistry department of MSIRI for analysis for the presence (and quantification if present) of 2(3H)-
benzoxazalinone, commonly called BOA, and for identification of other allelopathic substances
present using gas chromatography-mass spectrometry (GC-MS).
Test for BOA
Analysis of BOA in the leachates was conducted using an HPLC equipped with a DAD detector (HP
1050). A polar C-18 reversed phase column was used, and eluted with a gradient of 5% acetonitrile
and 95% Na2HPO4–buffer (1 mM, pH 2.4, 10% acetonitrile) at 0.35 ml min-1 flow rate. Quantitative
analysis was done by the external calibration method using certified BOA (2-Benzoxazolinone)
standards (Sigma-Aldrich, Germany; CAS 59-49-4). Identification of BOA peaks was based on
retention time window of pure standards; the retention time was 6.5 ± 0.05 minutes.
Identification of allelopathic substances by GC-MSD
Leachate aliquots of 100 ml from both Paspalum species plus samples collected from bowls without
weeds and irrigated with distilled water were extracted twice with dichloromethane and once with
hexane. The combined organic extract was rotary evaporated to 1-2 ml, followed by reconstitution into
7-8 ml hexane. The hexane extracts were evaporated under a gentle N2 stream, followed by
reconstitution in 1 ml hexane (US EPA, 1996). An aliquot of 1 ml was injected (splitless) into the
GCMSD (GC HP 6890, MSD 5973). The chromatographic data were obtained on an HP 5mS column
(30 m x 0.25 mm I.D., 0.25 µm film thickness) and were screened for allelochemicals using the NIST
2002 Mass Spectral library, inbuilt in the software.
150
6.3 Results
6.3.1 Trial I 6.3.1.1 Effect of leachates on shoot elongation and cane growth Pre-treatment cane measurement
Cane measurement made on 11 January 2006 showed a difference in mean stalk height among the
main factors (varieties) and no difference between leachate treatments and control (distilled water),
thus confirming that all shoot heights were similar before irrigation with leachates started (Table 6.2).
Table 6.2 Mean dewlap height at start of experimentation (before irrigating with leachates) in Trial I
Cane variety Mean dewlap height (cm shoot-1)
Distilled
water
P. paniculatum P. urvillei Mean
(varieties)
M 3035/66 8.8 12.0 12.2 11.0
R 570 8.5 8.2 8.7 8.4
R 579 10.3 8.0 9.3 9.2
M 695/69 11.3 13.5 12.8 12.6
Mean (leachates) 9.8 10.4 10.8
Values are means of three replications. Standard error of difference (s.e.d.) of means for variety (d.f.=6) = 1.10 and s.e.d. of means for leachate treatments (d.f. = 16) = 0.92. S.e.d. for comparing between individual varieties x leachate treatments = 1.85 (d.f. = 16).
Second cane measurement
Dewlap height of cane stalks in the all buckets was again measured on 6 February 2006 (3.5 weeks
after start of irrigation with leachates). A few new shoots (tillering) were observed in some of the
buckets. Statistical analysis carried out separately on the mean height of primary shoots alone or the
latter together with the new tillers revealed no significant difference between the leachate treatments
(Table 6.3). Irrespective of the effect of the leachate treatments, variety M 695/69 produced taller cane
shoots than the other three varieties.
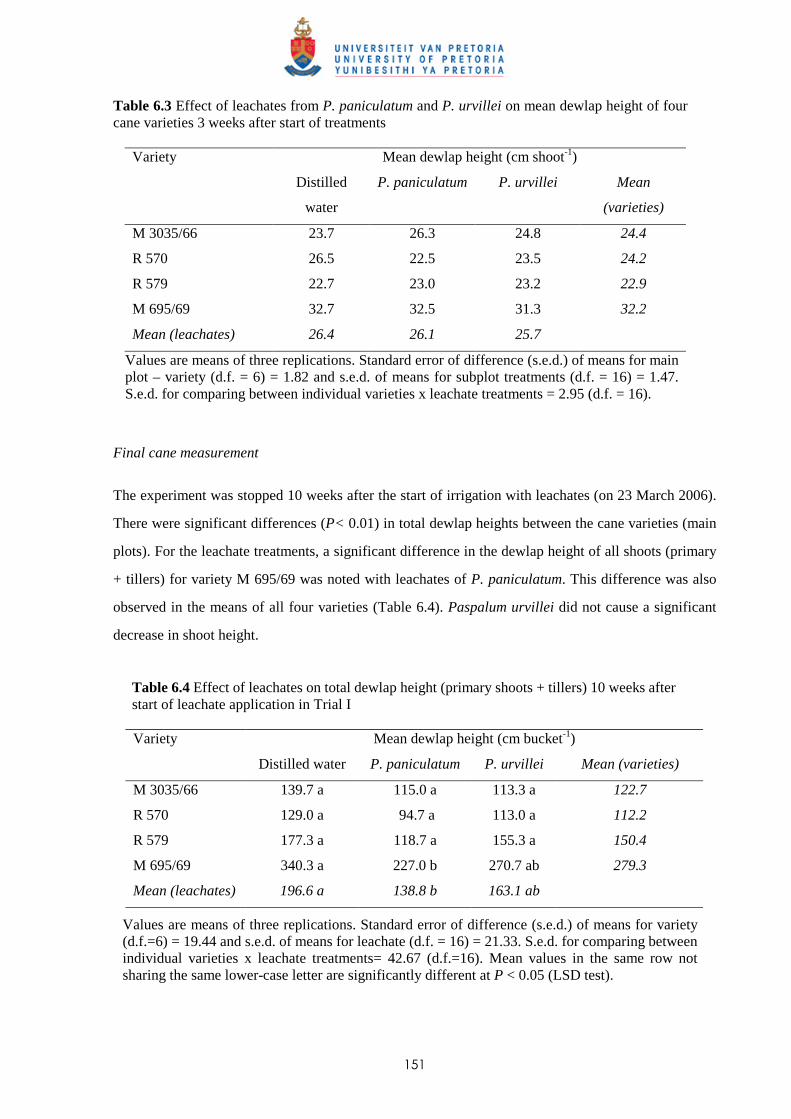
151
Table 6.3 Effect of leachates from P. paniculatum and P. urvillei on mean dewlap height of four cane varieties 3 weeks after start of treatments
Variety Mean dewlap height (cm shoot-1)
Distilled
water
P. paniculatum P. urvillei Mean
(varieties)
M 3035/66 23.7 26.3 24.8 24.4
R 570 26.5 22.5 23.5 24.2
R 579 22.7 23.0 23.2 22.9
M 695/69 32.7 32.5 31.3 32.2
Mean (leachates) 26.4 26.1 25.7
Values are means of three replications. Standard error of difference (s.e.d.) of means for main plot – variety (d.f. = 6) = 1.82 and s.e.d. of means for subplot treatments (d.f. = 16) = 1.47. S.e.d. for comparing between individual varieties x leachate treatments = 2.95 (d.f. = 16).
Final cane measurement
The experiment was stopped 10 weeks after the start of irrigation with leachates (on 23 March 2006).
There were significant differences (P< 0.01) in total dewlap heights between the cane varieties (main
plots). For the leachate treatments, a significant difference in the dewlap height of all shoots (primary
+ tillers) for variety M 695/69 was noted with leachates of P. paniculatum. This difference was also
observed in the means of all four varieties (Table 6.4). Paspalum urvillei did not cause a significant
decrease in shoot height.
Table 6.4 Effect of leachates on total dewlap height (primary shoots + tillers) 10 weeks after start of leachate application in Trial I
Variety Mean dewlap height (cm bucket-1)
Distilled water P. paniculatum P. urvillei Mean (varieties)
M 3035/66 139.7 a 115.0 a 113.3 a 122.7
R 570 129.0 a 94.7 a 113.0 a 112.2
R 579 177.3 a 118.7 a 155.3 a 150.4
M 695/69 340.3 a 227.0 b 270.7 ab 279.3
Mean (leachates) 196.6 a 138.8 b 163.1 ab
Values are means of three replications. Standard error of difference (s.e.d.) of means for variety (d.f.=6) = 19.44 and s.e.d. of means for leachate (d.f. = 16) = 21.33. S.e.d. for comparing between individual varieties x leachate treatments= 42.67 (d.f.=16). Mean values in the same row not sharing the same lower-case letter are significantly different at P < 0.05 (LSD test).
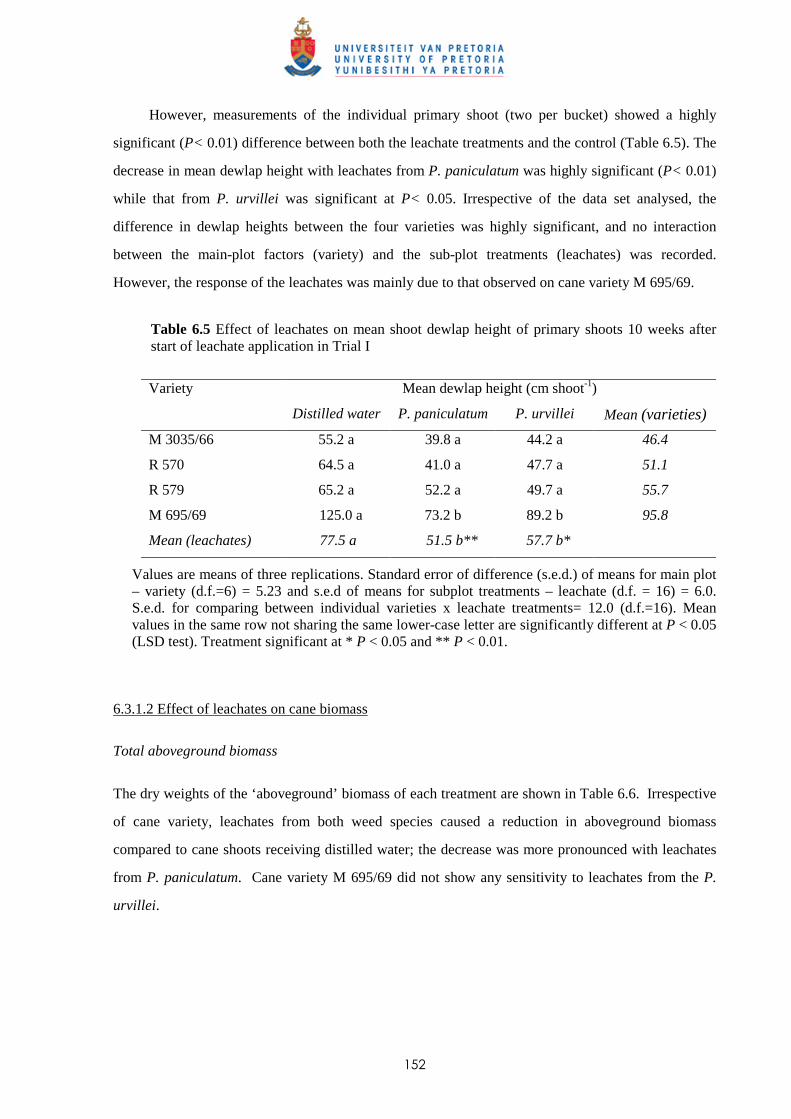
152
However, measurements of the individual primary shoot (two per bucket) showed a highly
significant (P< 0.01) difference between both the leachate treatments and the control (Table 6.5). The
decrease in mean dewlap height with leachates from P. paniculatum was highly significant (P< 0.01)
while that from P. urvillei was significant at P< 0.05. Irrespective of the data set analysed, the
difference in dewlap heights between the four varieties was highly significant, and no interaction
between the main-plot factors (variety) and the sub-plot treatments (leachates) was recorded.
However, the response of the leachates was mainly due to that observed on cane variety M 695/69.
Table 6.5 Effect of leachates on mean shoot dewlap height of primary shoots 10 weeks after start of leachate application in Trial I
Variety Mean dewlap height (cm shoot-1)
Distilled water P. paniculatum P. urvillei Mean (varieties)
M 3035/66 55.2 a 39.8 a 44.2 a 46.4
R 570 64.5 a 41.0 a 47.7 a 51.1
R 579 65.2 a 52.2 a 49.7 a 55.7
M 695/69 125.0 a 73.2 b 89.2 b 95.8
Mean (leachates) 77.5 a 51.5 b** 57.7 b*
Values are means of three replications. Standard error of difference (s.e.d.) of means for main plot – variety (d.f.=6) = 5.23 and s.e.d of means for subplot treatments – leachate (d.f. = 16) = 6.0. S.e.d. for comparing between individual varieties x leachate treatments= 12.0 (d.f.=16). Mean values in the same row not sharing the same lower-case letter are significantly different at P < 0.05 (LSD test). Treatment significant at * P < 0.05 and ** P < 0.01.
6.3.1.2 Effect of leachates on cane biomass
Total aboveground biomass
The dry weights of the ‘aboveground’ biomass of each treatment are shown in Table 6.6. Irrespective
of cane variety, leachates from both weed species caused a reduction in aboveground biomass
compared to cane shoots receiving distilled water; the decrease was more pronounced with leachates
from P. paniculatum. Cane variety M 695/69 did not show any sensitivity to leachates from the P.
urvillei.
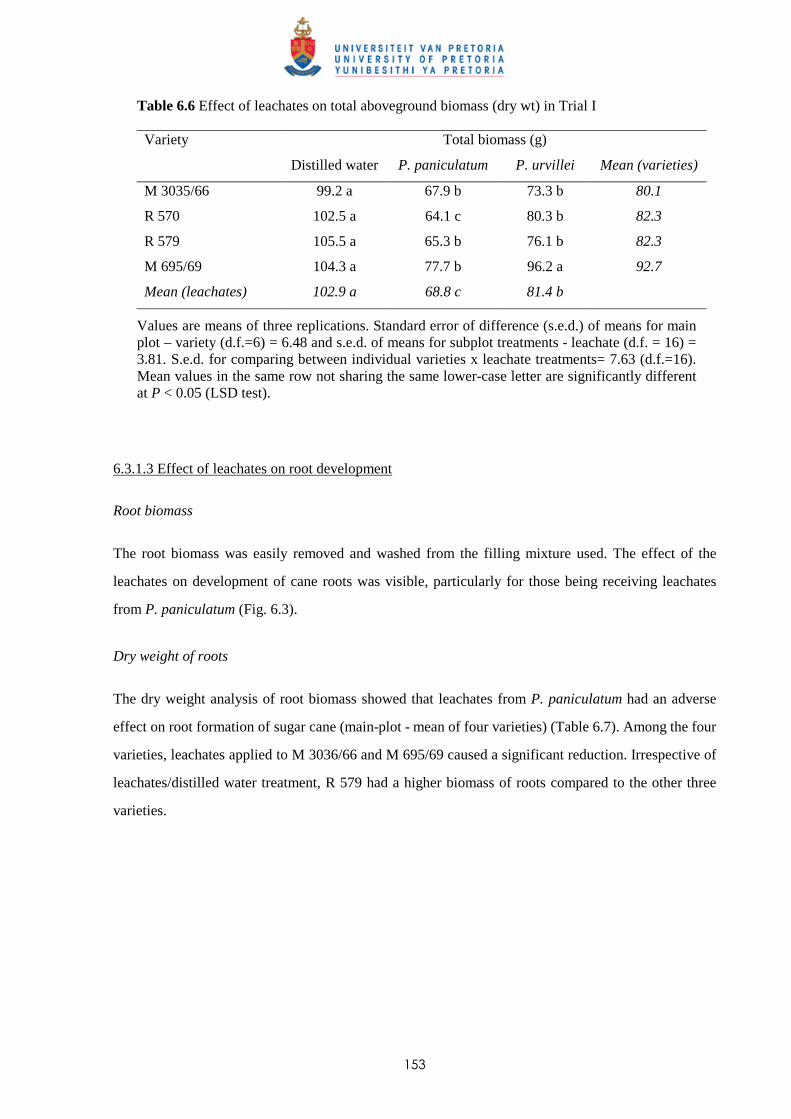
153
Table 6.6 Effect of leachates on total aboveground biomass (dry wt) in Trial I
Variety Total biomass (g)
Distilled water P. paniculatum P. urvillei Mean (varieties)
M 3035/66 99.2 a 67.9 b 73.3 b 80.1
R 570 102.5 a 64.1 c 80.3 b 82.3
R 579 105.5 a 65.3 b 76.1 b 82.3
M 695/69 104.3 a 77.7 b 96.2 a 92.7
Mean (leachates) 102.9 a 68.8 c 81.4 b
Values are means of three replications. Standard error of difference (s.e.d.) of means for main plot – variety (d.f.=6) = 6.48 and s.e.d. of means for subplot treatments - leachate (d.f. = 16) = 3.81. S.e.d. for comparing between individual varieties x leachate treatments= 7.63 (d.f.=16). Mean values in the same row not sharing the same lower-case letter are significantly different at P < 0.05 (LSD test).
6.3.1.3 Effect of leachates on root development
Root biomass
The root biomass was easily removed and washed from the filling mixture used. The effect of the
leachates on development of cane roots was visible, particularly for those being receiving leachates
from P. paniculatum (Fig. 6.3).
Dry weight of roots
The dry weight analysis of root biomass showed that leachates from P. paniculatum had an adverse
effect on root formation of sugar cane (main-plot - mean of four varieties) (Table 6.7). Among the four
varieties, leachates applied to M 3036/66 and M 695/69 caused a significant reduction. Irrespective of
leachates/distilled water treatment, R 579 had a higher biomass of roots compared to the other three
varieties.
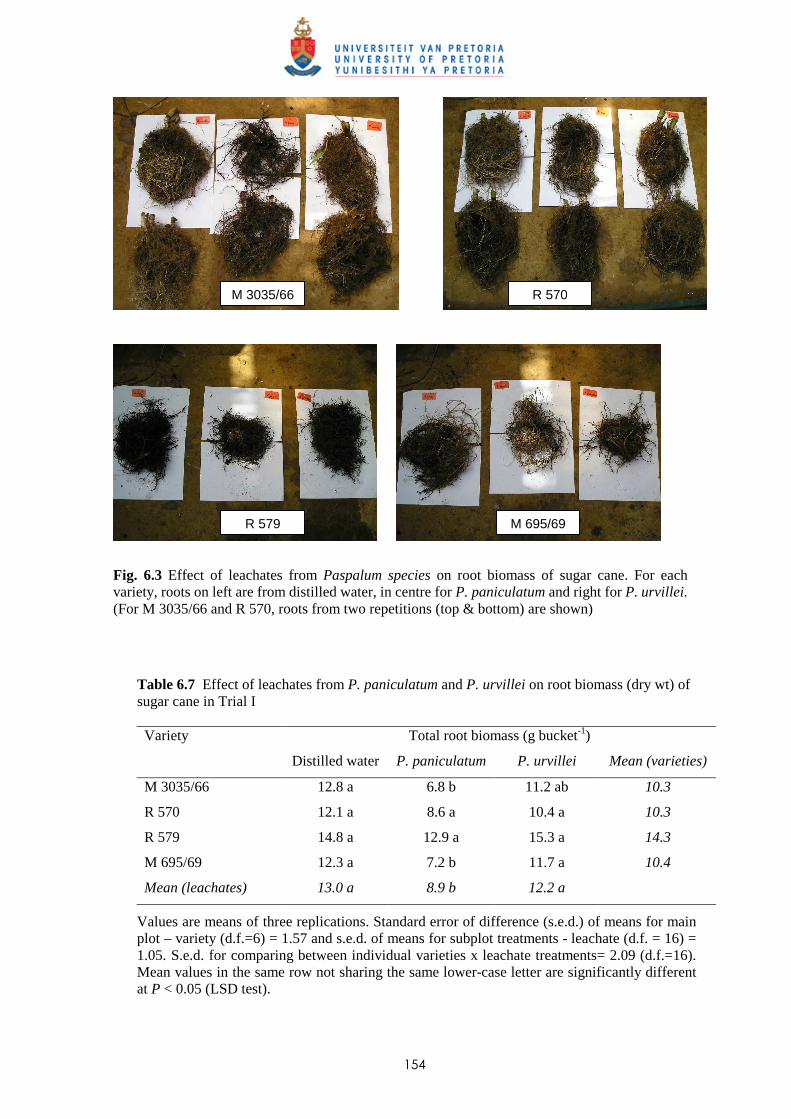
154
Fig. 6.3 Effect of leachates from Paspalum species on root biomass of sugar cane. For each variety, roots on left are from distilled water, in centre for P. paniculatum and right for P. urvillei. (For M 3035/66 and R 570, roots from two repetitions (top & bottom) are shown)
Table 6.7 Effect of leachates from P. paniculatum and P. urvillei on root biomass (dry wt) of sugar cane in Trial I
Variety Total root biomass (g bucket-1)
Distilled water P. paniculatum P. urvillei Mean (varieties)
M 3035/66 12.8 a 6.8 b 11.2 ab 10.3
R 570 12.1 a 8.6 a 10.4 a 10.3
R 579 14.8 a 12.9 a 15.3 a 14.3
M 695/69 12.3 a 7.2 b 11.7 a 10.4
Mean (leachates) 13.0 a 8.9 b 12.2 a
Values are means of three replications. Standard error of difference (s.e.d.) of means for main plot – variety (d.f.=6) = 1.57 and s.e.d. of means for subplot treatments - leachate (d.f. = 16) = 1.05. S.e.d. for comparing between individual varieties x leachate treatments= 2.09 (d.f.=16). Mean values in the same row not sharing the same lower-case letter are significantly different at P < 0.05 (LSD test).
M 3035/66 R 570
R 579 M 695/69
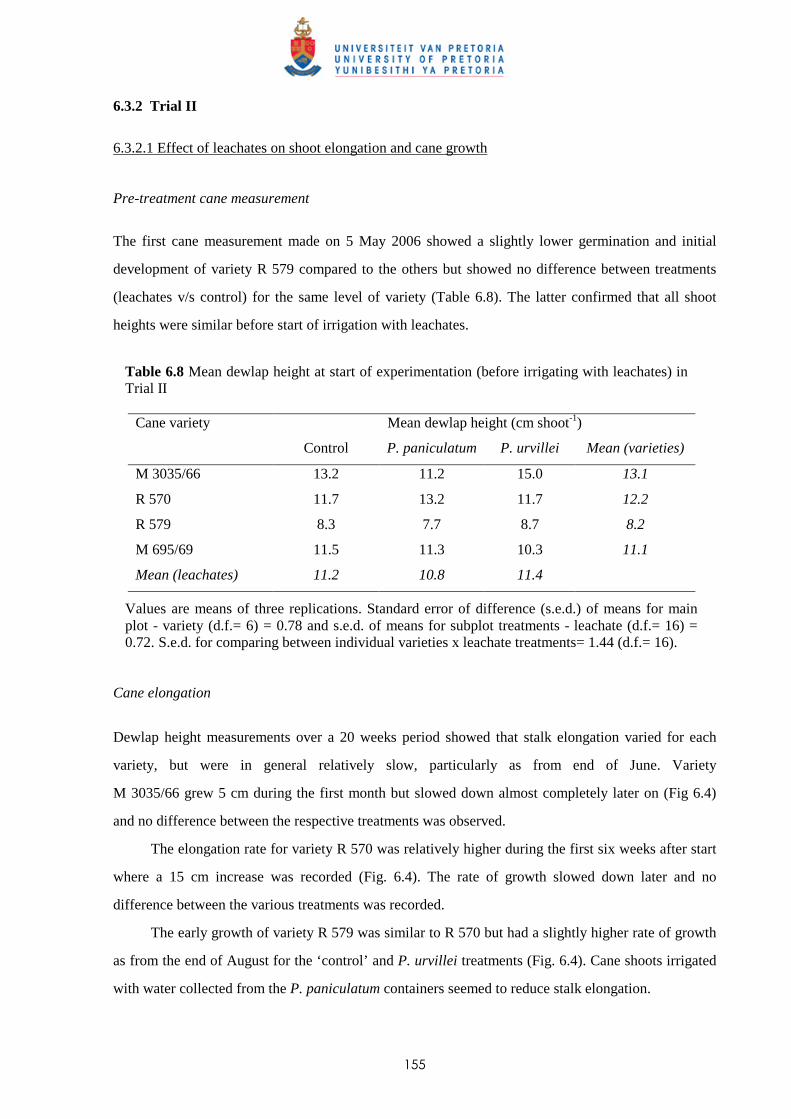
155
6.3.2 Trial II
6.3.2.1 Effect of leachates on shoot elongation and cane growth
Pre-treatment cane measurement
The first cane measurement made on 5 May 2006 showed a slightly lower germination and initial
development of variety R 579 compared to the others but showed no difference between treatments
(leachates v/s control) for the same level of variety (Table 6.8). The latter confirmed that all shoot
heights were similar before start of irrigation with leachates.
Table 6.8 Mean dewlap height at start of experimentation (before irrigating with leachates) in Trial II
Cane variety Mean dewlap height (cm shoot-1)
Control P. paniculatum P. urvillei Mean (varieties)
M 3035/66 13.2 11.2 15.0 13.1
R 570 11.7 13.2 11.7 12.2
R 579 8.3 7.7 8.7 8.2
M 695/69 11.5 11.3 10.3 11.1
Mean (leachates) 11.2 10.8 11.4
Values are means of three replications. Standard error of difference (s.e.d.) of means for main plot - variety (d.f.= 6) = 0.78 and s.e.d. of means for subplot treatments - leachate (d.f.= 16) = 0.72. S.e.d. for comparing between individual varieties x leachate treatments= 1.44 (d.f.= 16).
Cane elongation
Dewlap height measurements over a 20 weeks period showed that stalk elongation varied for each
variety, but were in general relatively slow, particularly as from end of June. Variety
M 3035/66 grew 5 cm during the first month but slowed down almost completely later on (Fig 6.4)
and no difference between the respective treatments was observed.
The elongation rate for variety R 570 was relatively higher during the first six weeks after start
where a 15 cm increase was recorded (Fig. 6.4). The rate of growth slowed down later and no
difference between the various treatments was recorded.
The early growth of variety R 579 was similar to R 570 but had a slightly higher rate of growth
as from the end of August for the ‘control’ and P. urvillei treatments (Fig. 6.4). Cane shoots irrigated
with water collected from the P. paniculatum containers seemed to reduce stalk elongation.
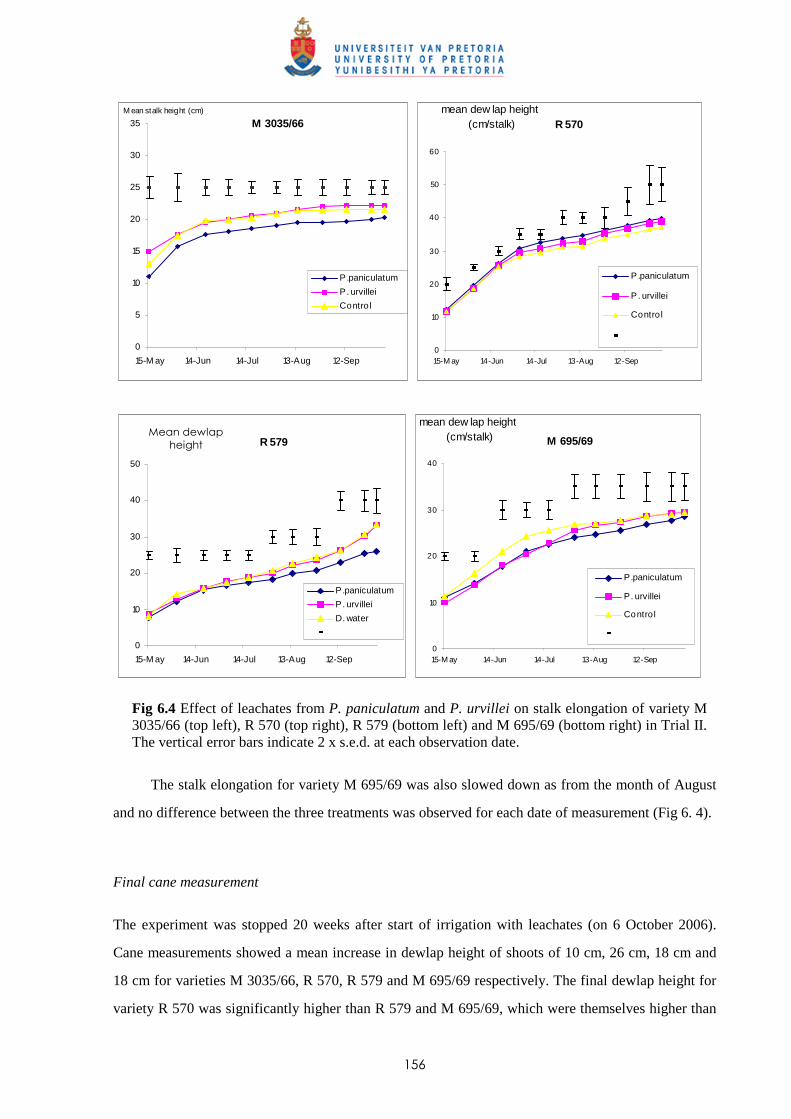
156
M 3035/66
0
5
10
15
20
25
30
35
15-M ay 14-Jun 14-Jul 13-Aug 12-Sep
P.paniculatum
P. urvillei
Control
M ean stalk height (cm)
R 570
0
10
20
30
40
50
60
15-M ay 14-Jun 14-Jul 13-Aug 12-Sep
P.paniculatum
P. urvillei
Control
mean dew lap height (cm/stalk)
R 579
0
10
20
30
40
50
15-M ay 14-Jun 14-Jul 13-Aug 12-Sep
P.paniculatum
P. urvillei
D. water
M 695/69
0
10
20
30
40
15-M ay 14-Jun 14-Jul 13-Aug 12-Sep
P.paniculatum
P. urvillei
Control
mean dew lap height (cm/stalk)
Fig 6.4 Effect of leachates from P. paniculatum and P. urvillei on stalk elongation of variety M 3035/66 (top left), R 570 (top right), R 579 (bottom left) and M 695/69 (bottom right) in Trial II. The vertical error bars indicate 2 x s.e.d. at each observation date.
The stalk elongation for variety M 695/69 was also slowed down as from the month of August
and no difference between the three treatments was observed for each date of measurement (Fig 6. 4). Final cane measurement
The experiment was stopped 20 weeks after start of irrigation with leachates (on 6 October 2006).
Cane measurements showed a mean increase in dewlap height of shoots of 10 cm, 26 cm, 18 cm and
18 cm for varieties M 3035/66, R 570, R 579 and M 695/69 respectively. The final dewlap height for
variety R 570 was significantly higher than R 579 and M 695/69, which were themselves higher than
Mean dewlap
height
(cm/stalk)
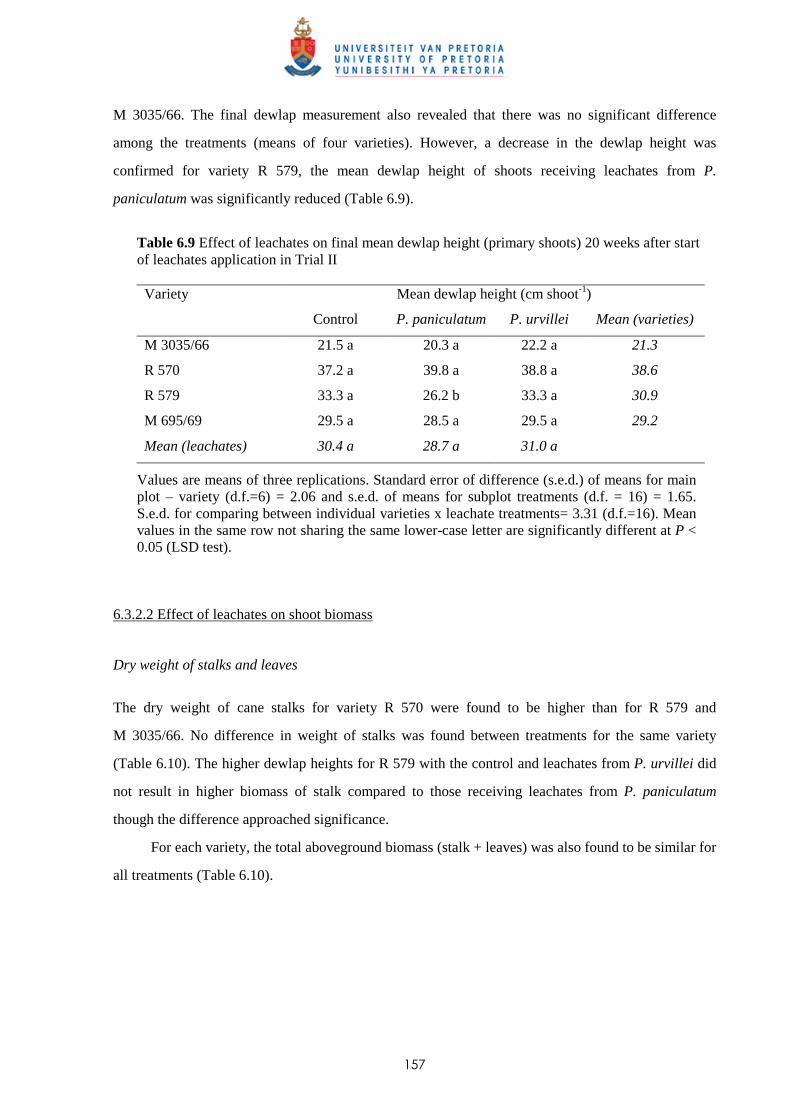
157
M 3035/66. The final dewlap measurement also revealed that there was no significant difference
among the treatments (means of four varieties). However, a decrease in the dewlap height was
confirmed for variety R 579, the mean dewlap height of shoots receiving leachates from P.
paniculatum was significantly reduced (Table 6.9).
Table 6.9 Effect of leachates on final mean dewlap height (primary shoots) 20 weeks after start of leachates application in Trial II Variety Mean dewlap height (cm shoot-1)
Control P. paniculatum P. urvillei Mean (varieties)
M 3035/66 21.5 a 20.3 a 22.2 a 21.3
R 570 37.2 a 39.8 a 38.8 a 38.6
R 579 33.3 a 26.2 b 33.3 a 30.9
M 695/69 29.5 a 28.5 a 29.5 a 29.2
Mean (leachates) 30.4 a 28.7 a 31.0 a
Values are means of three replications. Standard error of difference (s.e.d.) of means for main plot – variety (d.f.=6) = 2.06 and s.e.d. of means for subplot treatments (d.f. = 16) = 1.65. S.e.d. for comparing between individual varieties x leachate treatments= 3.31 (d.f.=16). Mean values in the same row not sharing the same lower-case letter are significantly different at P < 0.05 (LSD test).
6.3.2.2 Effect of leachates on shoot biomass
Dry weight of stalks and leaves
The dry weight of cane stalks for variety R 570 were found to be higher than for R 579 and
M 3035/66. No difference in weight of stalks was found between treatments for the same variety
(Table 6.10). The higher dewlap heights for R 579 with the control and leachates from P. urvillei did
not result in higher biomass of stalk compared to those receiving leachates from P. paniculatum
though the difference approached significance.
For each variety, the total aboveground biomass (stalk + leaves) was also found to be similar for
all treatments (Table 6.10).
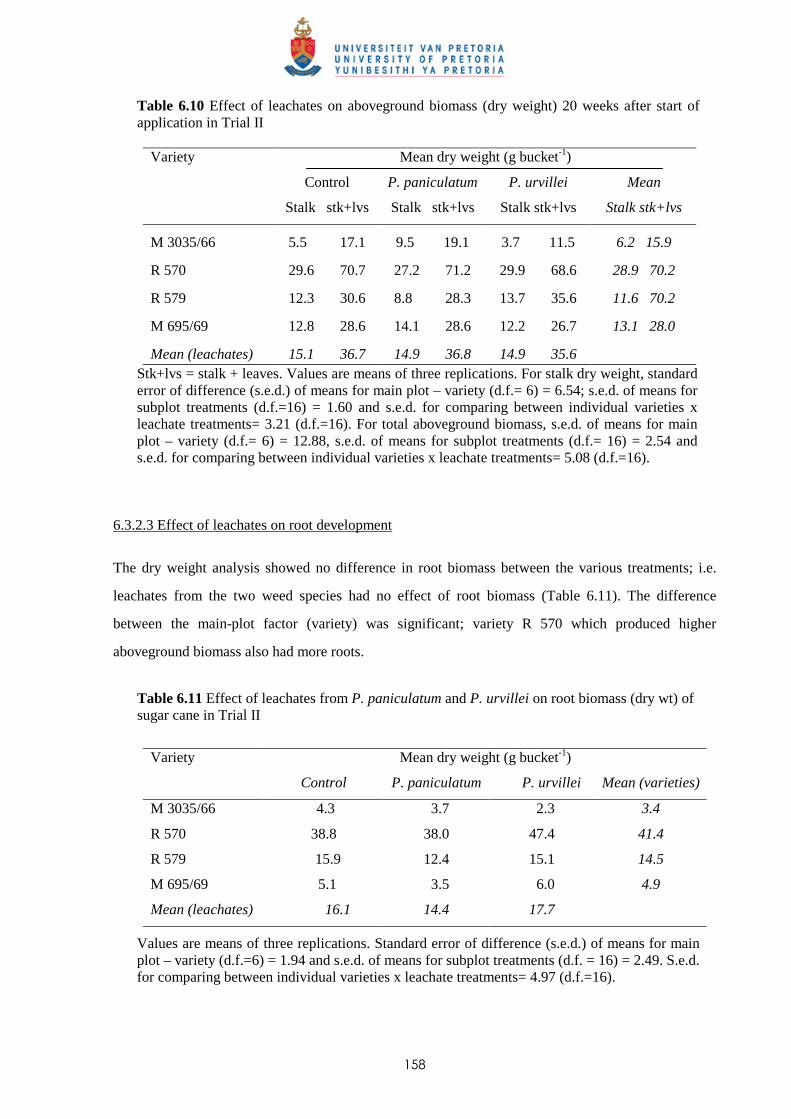
158
Table 6.10 Effect of leachates on aboveground biomass (dry weight) 20 weeks after start of application in Trial II
Variety Mean dry weight (g bucket-1)
Control
Stalk stk+lvs
P. paniculatum
Stalk stk+lvs
P. urvillei
Stalk stk+lvs
Mean
Stalk stk+lvs
M 3035/66 5.5 17.1 9.5 19.1 3.7 11.5 6.2 15.9
R 570 29.6 70.7 27.2 71.2 29.9 68.6 28.9 70.2
R 579 12.3 30.6 8.8 28.3 13.7 35.6 11.6 70.2
M 695/69 12.8 28.6 14.1 28.6 12.2 26.7 13.1 28.0
Mean (leachates) 15.1 36.7 14.9 36.8 14.9 35.6 Stk+lvs = stalk + leaves. Values are means of three replications. For stalk dry weight, standard error of difference (s.e.d.) of means for main plot – variety (d.f.= 6) = 6.54; s.e.d. of means for subplot treatments (d.f.=16) = 1.60 and s.e.d. for comparing between individual varieties x leachate treatments= 3.21 (d.f.=16). For total aboveground biomass, s.e.d. of means for main plot – variety (d.f.= 6) = 12.88, s.e.d. of means for subplot treatments (d.f.= 16) = 2.54 and s.e.d. for comparing between individual varieties x leachate treatments= 5.08 (d.f.=16).
6.3.2.3 Effect of leachates on root development
The dry weight analysis showed no difference in root biomass between the various treatments; i.e.
leachates from the two weed species had no effect of root biomass (Table 6.11). The difference
between the main-plot factor (variety) was significant; variety R 570 which produced higher
aboveground biomass also had more roots.
Table 6.11 Effect of leachates from P. paniculatum and P. urvillei on root biomass (dry wt) of sugar cane in Trial II
Variety Mean dry weight (g bucket-1)
Control P. paniculatum P. urvillei Mean (varieties)
M 3035/66 4.3 3.7 2.3 3.4
R 570 38.8 38.0 47.4 41.4
R 579 15.9 12.4 15.1 14.5
M 695/69 5.1 3.5 6.0 4.9
Mean (leachates) 16.1 14.4 17.7 Values are means of three replications. Standard error of difference (s.e.d.) of means for main plot – variety (d.f.=6) = 1.94 and s.e.d. of means for subplot treatments (d.f. = 16) = 2.49. S.e.d. for comparing between individual varieties x leachate treatments= 4.97 (d.f.=16).
159
6.3.3 Trial III
6.3.3.1 Effect of leachates on shoot elongation and cane growth
Pre-treatment cane measurement
The first cane measurement made on 24 November 2006 showed a slightly lower germination and
initial development with varieties R 579 and M 695/69 compared to the others but no difference
between treatments (leachates v/s control) was obtained for the same level of variety (Table 6.12). The
data confirmed that all shoot heights were similar before start of irrigation with leachates.
Table 6.12 Mean dewlap height at start of experimentation (before applying leachates) in Trial III
Cane variety Mean dewlap height (cm shoot-1)
Control P. paniculatum P. urvillei Mean (varieties)
M 3035/66 14.7 9.7 16.7 13.7
R 570 10.3 9.7 10.3 10.1
R 579 5.7 7.7 7.3 6.9
M 695/69 8.3 7.7 7.2 7.7
Mean (leachates) 9.8 8.7 10.4
Values are means of three replications. Standard error of difference (s.e.d.) of means for main plot – variety (d.f.=6) = 0.96 and s.e.d. of means for subplot treatments (d.f. = 16) = 1.19. S.e.d. for comparing between individual varieties x leachate treatments= 2.38 (d.f.=16).
Cane elongation
Dewlap height measurements made over a 12 weeks period showed that stalk elongation was quite
satisfactory; each stalk gained an average of 70 cm over that period. The elongation was quite similar
for all varieties, irrespective of the treatments, for the first four to six weeks before some differences
started to occur. For variety M 3035/66, stalk elongation for the three treatments were similar till the
first weeks of January 2007 when a slowing down in the P. urvillei treatment was observed
(Fig. 6.5). Similarly, a more rapid growth was recorded in the control treatment compared to P.
paniculatum; the difference was, however, not significant.
Stalk elongation of variety R 570 was similar for the three treatments for the first seven weeks
(Fig. 6.5). After that, the cane shoots receiving leachate from containers with no Paspalum plants
(control) elongated at a higher rate than the two treatments receiving leachates from the weeds.
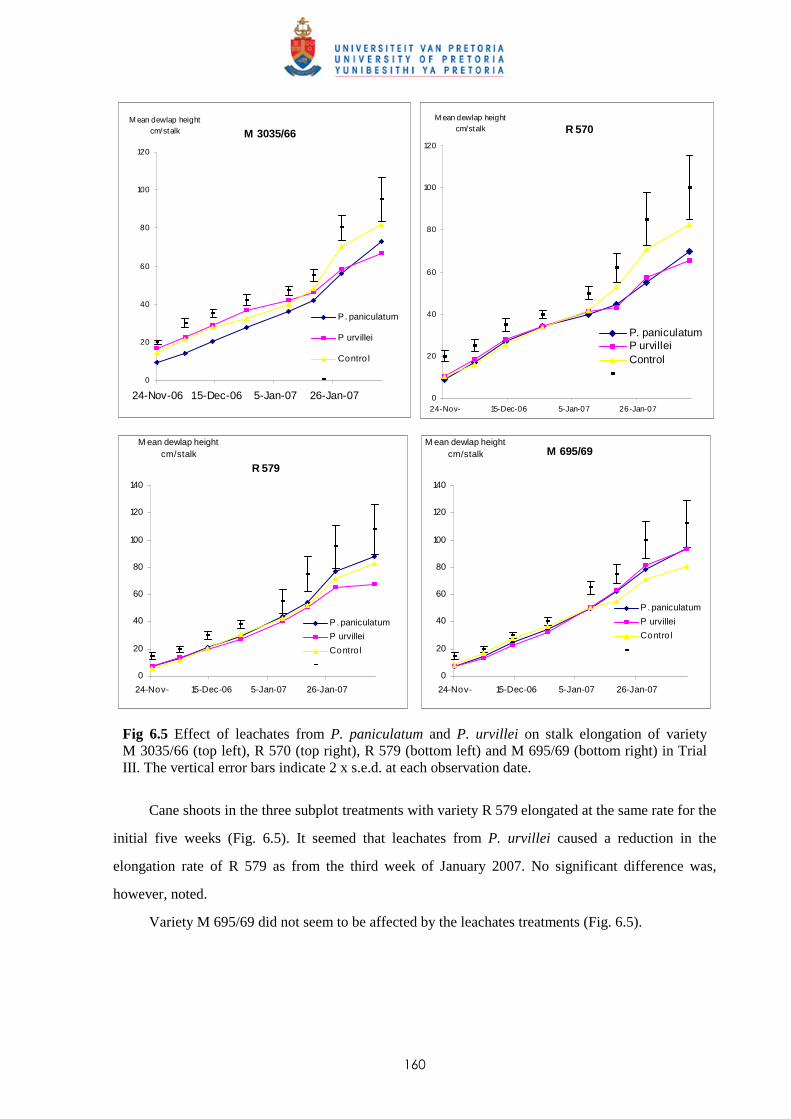
160
M 3035/66
0
20
40
60
80
100
120
24-Nov-06 15-Dec-06 5-Jan-07 26-Jan-07
P. paniculatum
P urvillei
Contro l
M ean dewlap heightcm/stalk R 570
0
20
40
60
80
100
120
24-Nov- 15-Dec-06 5-Jan-07 26-Jan-07
P. paniculatumP urvilleiControl
M ean dewlap heightcm/stalk
R 579
0
20
40
60
80
100
120
140
24-Nov- 15-Dec-06 5-Jan-07 26-Jan-07
P. paniculatum
P urvillei
Contro l
M ean dewlap heightcm/stalk
M 695/69
0
20
40
60
80
100
120
140
24-Nov- 15-Dec-06 5-Jan-07 26-Jan-07
P. paniculatum
P urvillei
Contro l
M ean dewlap heightcm/stalk
Fig 6.5 Effect of leachates from P. paniculatum and P. urvillei on stalk elongation of variety M 3035/66 (top left), R 570 (top right), R 579 (bottom left) and M 695/69 (bottom right) in Trial III. The vertical error bars indicate 2 x s.e.d. at each observation date.
Cane shoots in the three subplot treatments with variety R 579 elongated at the same rate for the
initial five weeks (Fig. 6.5). It seemed that leachates from P. urvillei caused a reduction in the
elongation rate of R 579 as from the third week of January 2007. No significant difference was,
however, noted.
Variety M 695/69 did not seem to be affected by the leachates treatments (Fig. 6.5).
161
Final cane measurement
As some of the cane shoots had reached more than 80 cm in dewlap height, the experiment was
stopped 12 weeks after start of leachates application. Cane measurements showed the mean dewlap
height of M 695/69 to be slightly higher than the other varieties, the difference, however, was not
significant. Compared to the control, a tendency for P. urvillei causing a reduction in dewlap heights
of all the varieties was observed; the differences were, however, not significant.
6.3.3.2 Effect of leachates on shoot biomass
Dry weight of stalks and leaves
The aboveground biomass (dry weight) of cane shoots was found to vary with variety; R 570
producing higher biomass and M 695/69 the least (Table 6.13). Irrespective of cane variety, the effect
of leachates on mean (main-plot means) aboveground biomass was significant, P. urvillei caused a
reduction in shoot development. Paspalum urvillei adversely affected shoot development of varieties
M 3035/66 and R 570. Leachates from P. paniculatum caused no adverse effect on weight of
aboveground biomass, thus confirming effect on dewlap height.
Table 6.13 Effect of leachates on aboveground biomass (dry weight) 12 weeks after start of application in Trial III
Variety Mean dry weight (g bucket-1)
Control P. paniculatum P. urvillei Mean (varieties)
M 3035/66 83.0 a 71.4 ab 52.8 b 69.1
R 570 100.4 a 101.6 a 81.1 b 94.4
R 579 83.1 a 83.2 a 67.2 a 77.8
M 695/69 51.3 a 66.7 a 49.4 a 55.8
Mean (leachates) 79.5 a 80.7 a 62.6 b Values are means of three replications. For stalk dry weight, standard error of difference (s.e.d.) of means for main plot – variety (d.f.= 6)= 3.35 and s.e.d. of means for subplot treatments (d.f.= 16)= 4.54. S.e.d. for comparing between individual varieties x leachate treatments= 9.08 (d.f.= 16). Mean values in the same row not sharing the same lower-case letter are significantly different at P < 0.05 (LSD test).
6.3.3.3 Effect of leachates on root development
A significant reduction in root biomass between the control and the two leachates treatments was
obtained for the main-plot treatments (four varieties). Significant effects on individual cultivars were
162
less evident, though the data showed similar trends for all cultivars. Leachates from P. urvillei were
found to cause a significant reduction only in variety M 695/69 (Table 6.14).
Table 6.14 Effect of leachates on root biomass (dry weight) 12 weeks after start in Trial III
Variety Mean dry weight (g bucket-1)
Control P. paniculatum P. urvillei Mean (varieties)
M 3035/66 17.1 a 14.8 a 14.5 a 15.4
R 570 18.8 a 18.3 a 20.9 a 19.4
R 579 15.7 a 13.1 a 13.5 a 14.1
M 695/69 12.9 a 10.6 a 8.2 b 10.5
Mean (leachates) 16.1 a 14.2 b 14.3 b Values are means of three replications. For stalk dry weight, standard error of difference (s.e.d.) of means for main plot – variety (d.f.= 6)= 0.48 and s.e.d. of means for subplot treatments (d.f.= 16)= 0.83. S.e.d. for comparing between individual varieties x leachate treatments= 1.67 (d.f.=16). Mean values in the same row not sharing the same lower-case letter are significantly different at P < 0.05 (LSD test).
163
6.3.4 Trial IV
6.3.4.1 Effect of leachates on shoot elongation and cane growth
Pre-treatment cane measurement
The first cane measurement made on 6 March 2007 showed a lower germination and initial
development with variety R 579 (Table 6.15). No difference between treatments (leachates v/s
control) was obtained for the same level of variety, thus confirming that all shoot heights were similar
before start of irrigation with leachates.
Table 6.15 Mean dewlap height at start of experimentation (before applying leachates) in Trial IV
Cane variety Mean dewlap height (cm shoot-1)
Control P. paniculatum P. urvillei Mean (varieties)
M 3035/66 11.8 11.3 10.8 11.3
R 570 11.3 10.7 12.0 11.3
R 579 8.7 8.0 8.2 8.3
M 695/69 11.8 11.0 10.7 11.2
Mean (leachates) 10.9 10.3 10.4
Values are means of three replications. Standard error of difference (s.e.d.) of means for main plot – variety (d.f.=6) = 0.73 and s.e.d. of means for subplot treatments (d.f. = 16) = 0.80. S.e.d. for comparing between individual varieties x leachate treatments= 1.60 (d.f.=16).
Cane elongation
Dewlap height measurements made over a 17 weeks period showed that stalk elongation was quite
steady; stalk elongation gained between 55 and 70 cm over that period. Variety R 579 had the highest
gain in dewlap and M 3035/66 the least. The elongation was quite similar for all varieties, irrespective
of the treatments, during the first six weeks before some differences started to occur as from the end of
April 2007.
For variety M 3035/66, stalk elongation for the three treatments were similar till the end of
April 2007. As from early May, the rate of elongation recorded in the P. urvillei treatment was slower
than the other two treatments, the gap increasing with time (Fig. 6.6). No difference in rate of
elongation was noted between the P. paniculatum treatment and the control.
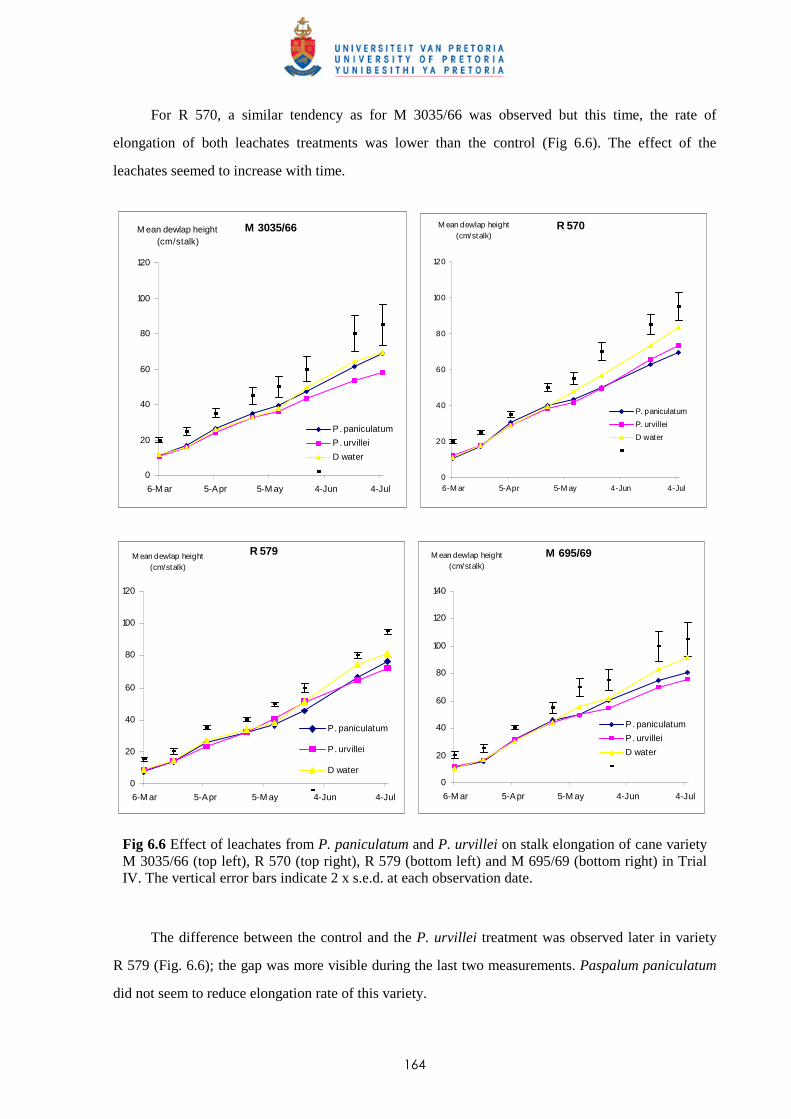
164
For R 570, a similar tendency as for M 3035/66 was observed but this time, the rate of
elongation of both leachates treatments was lower than the control (Fig 6.6). The effect of the
leachates seemed to increase with time.
M 3035/66
0
20
40
60
80
100
120
6-M ar 5-Apr 5-M ay 4-Jun 4-Jul
P. paniculatum
P. urvillei
D water
M ean dewlap height(cm/stalk)
R 570
0
20
40
60
80
100
120
6-M ar 5-Apr 5-M ay 4-Jun 4-Jul
P. paniculatum
P. urvillei
D water
M ean dewlap height(cm/stalk)
R 579
0
20
40
60
80
100
120
6-M ar 5-Apr 5-M ay 4-Jun 4-Jul
P. paniculatum
P. urvillei
D water
M ean dewlap height(cm/stalk)
M 695/69
0
20
40
60
80
100
120
140
6-M ar 5-Apr 5-M ay 4-Jun 4-Jul
P. paniculatum
P. urvillei
D water
M ean dewlap height(cm/stalk)
Fig 6.6 Effect of leachates from P. paniculatum and P. urvillei on stalk elongation of cane variety M 3035/66 (top left), R 570 (top right), R 579 (bottom left) and M 695/69 (bottom right) in Trial IV. The vertical error bars indicate 2 x s.e.d. at each observation date.
The difference between the control and the P. urvillei treatment was observed later in variety
R 579 (Fig. 6.6); the gap was more visible during the last two measurements. Paspalum paniculatum
did not seem to reduce elongation rate of this variety.
165
Variety M 695/69 behaved similarly to R 570 and the mean dewlap height with the control
seemed to increase faster than those treated with leachates from the two grasses at the later observation
dates (Fig. 6.6).
Final cane measurement
The experiment was stopped 17 weeks after start of leachates application as cane was relatively tall in
the buckets. Cane measurements showed the mean dewlap height of M 695/69 to be significantly
higher than M 3035/66 but they were not different to R 570 and R 579. Leachates from P. urvillei
caused a reduction in the mean dewlap height of cane shoots of main-plot treatments (varieties) though
no significant effects were recorded for the individual varieties (Table 6.16). Paspalum paniculatum
also appeared to cause a reduction compared to the control but the difference was not significant.
Table 6.16 Effect of leachates on final mean dewlap height (primary shoots) 17 weeks after start of application of treatments in Trial IV
Variety Mean dewlap height (cm shoot-1)
Control P. paniculatum P. urvillei Mean (varieties)
M 3035/66 69.5 68.5 56.5 64.8
R 570 83.3 68.0 73.2 74.8
R 579 80.5 75.8 72.2 76.2
M 695/69 91.2 83.2 79.7 84.7
Mean (leachates) 81.1 a 73.9 a 70.4 b Values are means of three replications. Standard error of difference (s.e.d.) of means for main plot – variety (d.f.=6) = 5.21 and s.e.d. of means for subplot treatments (d.f. = 16) = 4.61. S.e.d. for comparing between individual varieties x leachate treatments = 9.22 (d.f.=16). Mean values in the same row not sharing the same lower-case letter are significantly different at P < 0.05 (LSD test).
6.3.4.2 Effect of leachates on shoot biomass
Aboveground biomass
The total biomass of leaves and stalks were reduced by the P. urvillei treatment (mean of main-
plot treatments) (Table 6.17). For individual varieties, the response was again not significant as for the
total dewlap and weight of leaves.
166
Table 6.17 Effect of leachates on aboveground biomass (dry weight) 17 weeks after start of application in Trial IV
Variety Mean dry weight (g bucket-1)
Control P. paniculatum P. urvillei Mean (varieties)
M 3035/66 137.6 124.5 109.7 123.9
R 570 139.7 129.0 128.9 132.6
R 579 124.2 131.0 117.0 124.0
M 695/69 114.9 90.9 91.4 99.0
Mean (leachates) 129.1 a 118.8 a 111.7 b Values are means of three replications. Standard error of difference (s.e.d.) of means for main plot – variety (d.f.=6) = 6.20 and s.e.d. of means for subplot treatments (d.f. = 16) = 7.49. S.e.d. for comparing between individual varieties x leachate treatments = 14.99 (d.f.=16). Mean values of four varieties not sharing the same lower-case letter are significantly different at P < 0.05 (LSD test).
6.3.4.3 Effect of leachates on root development
As seen in earlier trials, M 695/69 produced less roots irrespective of treatments. For the main-plot
treatments, a reduction in root biomass was observed between the control and treatments consisting of
leachates from P. paniculatum; the latter was not different from P. urvillei (Table 6.18).
Table 6.18 Effect of leachates on root biomass (dry weight) 17 weeks after start in Trial IV
Variety Mean dry weight (g bucket-1)
Control P. paniculatum P. urvillei Mean (varieties)
M 3035/66 33.4 29.4 33.2 32.0
R 570 50.6 41.4 40.5 44.1
R 579 28.7 17.6 20.9 22.4
M 695/69 19.3 12.3 17.8 16.5
Mean (leachates) 33.0 a 25.2 b 28.1 ab Values are means of three replications. Standard error of difference (s.e.d.) of means for main plot (variety) = 3.53 (d.f.= 6) and s.e.d. of means for subplot treatments= 2.89 (d.f.= 16). S.e.d. for comparing between individual varieties x leachate treatments= 5.78 (d.f.=16). For mean of four varieties, values not sharing the same lower-case letter are significantly different at P < 0.05 (LSD test).
167
6.3.5 Chemical analysis of leachates from P. paniculatum and P. urvillei
6.3.5.1 Presence of BOA (2-benzoxazolinone)
The samples analysed did not show any presence of BOA in the leachate samples collected. Although
BOA often exists or is converted to other derivatives such as DIBOA, MBOA, etc, any trace of BOA
should have been detected by the analysis. These preliminary analyses therefore excluded detectable
levels of BOA in leachates from the two Paspalum species.
6.3.5.2 Chemical composition of leachates from P. paniculatum and P. urvillei
The GC-MSD revealed the presence of 2-Propenoic acid, 3-(4-methoxyphenyl)- (CAS number: 5466-
77-3) in leachates from both weeds but not from the control treatment. The retention time was
26.94/26.95 minutes. 2-Propenoic acids form part of the family commonly known as cinnamic acids
which include cinnamic acid (2-propenoic acid, 3-phenyl), ferulic acid (2-propenoic acid, 3-(4-hydrxy-
3-methoxyphenyl)-), p-coumaric acid (2-propenoic acid, 3-(4-hydroxyphenyl)-), isoferulic acid (2-
propenoic acid, 3-(3-hydroxy-4-methoxyphenyl)-) and caffeic acid (2-propenoic acid, 3-(3,4-
dihydroxyphenyl)-). All these compounds are known to have allelopathic properties (Fernandez et al.,
2006). P-Coumaric acid, in particular, has been proven to cause a significant effect on the growth of
roots and aboveground organs of Linum usitatissimum (Ray & Hastings, 1992).
The chromatograph area (%) covered by the 2-propenoic acid, 3-(4-methoxyphenyl) was three
to four times higher in the P. paniculatum samples than in leachates from P. urvillei (Appendix 1).
This may suggest that P. paniculatum produced more of that allelopathic chemical, but this needs to be
studied further as the amount of chemicals released from the roots would vary with time and several
other factors. However, the presence of this chemical in the two Paspalums confirms the potential
interference from allelopathic substances released by weeds over and above the other mechanisms of
competition between sugar cane and weeds.
168
6.4 Discussion and conclusions
Stalk elongation and cane growth
This study has shown that leachates from both Paspalum species can cause an adverse effect on cane
growth. Irrespective of varieties (mean of main-plot treatments), leachates from P. urvillei caused a
significant reduction in mean dewlap of primary shoots in three trials (Trial I, III and IV). A
significant reduction was obtained by leachates of P. paniculatum in Trial I where the effect was more
pronounced to that of P. urvillei. No difference between the three treatments was observed in Trial II
where cane growth was much slower than the other trials; this may be attributed to the lower mean
temperatures which prevailed during the respective trials (Table 6.19).
Table 6.19 Effect of temperature on rate of cane stalk elongation
Trial Mean daily temperatures (oC) Rate of stalk elongation
Max. Min. cm/week
Trial I 28.4 21.0 6.7
Trial II 23.9 15.3 1.0
Trial III 28.7 20.6 6.0
Trial IV 26.0 18.2 4.2
The lower cane growth in Trial II resulted in maximum dewlap heights not exceeding 35 cm per
shoot except for variety R 570. A reduction in stalk elongation with P. paniculatum leachates on
R 579 was also recorded in this trial.
Cane growth and initiation of allelopathic effect
Cane measurements showed that the difference between the control and the ‘leachate’ treatments was
not apparent during the early weeks after start of experimentation. The difference was in general
visible after the cane shoots had reached a mean dewlap height of 40 cm or more. This may also
explain why no difference was noted in Trial II. In general, the differences between the control and the
leachate treatments increased with time; it is possible that more significant differences would have
been observed if the trials were prolonged for a few weeks more. Increasing growth-inhibiting or
169
phytotoxic effects from the weeds on sugar cane with time could have been due to increased
allelochemical release from weed roots as the plants matured.
Variety response to leachate treatments
There was no interaction between variety and treatments; all varieties showed susceptibility to the
leachates. The order of susceptibility of the cane varieties to leachates differed from their known
relative tolerances towards herbicides or herbicide mixtures. M 3035/66 is known to be a more
resistant variety towards herbicides than M 695/69 and R 579, with R 570 classified as a susceptible
variety. As the leachates were applied as irrigation water underneath the leaves (not applied on cane
leaves), it means that water and allelochemical uptake were solely by the roots. Variability in the
tolerance of sugar cane varieties to herbicides is mostly associated with foliar-applied herbicides.
Effect of leachates on root biomass
The leachates from both weed species were found to have a growth-inhibiting effect on root
development in all the trials except in Trial II where a slight (non-significant) reduction was caused by
P. paniculatum leachate on roots of varieties M 3035/66 and M 695/69. The difference in root biomass
observed in Trials I and III seems to explain the difference caused by the leachates; a correlation
between reduction in root biomass and effect on dewlap height indicated that the primary effect of the
allelochemicals was on root development. An adverse effect on root development also impacted
negatively on aboveground biomass development, although M 695/69 with the least root biomass
produced the tallest stalks (dewlap height).
P. paniculatum vs P. urvillei
On basis of results from the four trials, P. urvillei was found to cause more allelopathic (phytotoxic)
effects than P. paniculatum, although the reverse occurred in Trial I. Although both weeds were
transplanted at the same initial density, growth of P. urvillei was more vigorous and it produced more
leaves and biomass; suggesting that more root exudates may have been released. Both weeds had a
quick and similar development in Trial I and this may have influenced the allelochemical production
of P. paniculatum to the extent that the latter species seemed to cause more reduction in root biomass
than P. urvillei in that trial. The implication of this finding is that, on a unit mass basis, P. paniculatum
may be more allelopathic than P. urvillei.
170
The effect on root growth may have been due to the presence of 2-propenoic acid, 3-(4-
methoxyphenyl) found in root exudates from both weeds. Cinnamic acids are known for their
allelopathic properties, in particular for impairing root development (Rice, 1984; Fernandez et al.,
2006). The presence of a higher concentration of 2-propenoic acid in P. paniculatum leachates may
partly explain the greater reduction in root biomass of sugar cane that was observed at this treatment.
These results confirm the allelopathic potential of weeds on sugar cane; the effect of leachates from
Cyperus rotundus has been reported by Mc Intyre (1998). However, the results presented in this study
are only preliminary ones as there may be other allelochemicals involved and the exact effects of
cinnamic acids need to be confirmed by simulating effects using pure chemicals. With the same
approach, dose-response curves may be used to estimate the minimum concentrations required for any
effect on cane. Allelopathic effects also need to be verified under natural conditions.
Although this study proved some interference due to allelopathic effects from the two
Paspalums on sugar cane, the results cannot completely explain the higher interference
(competitiveness) reported earlier for P. paniculatum, as both weeds seemed to cause similar
allelopathic effects. Their relative rates of development and competitiveness under field conditions
need to be studied more closely together with the identification and quantification of the major
allelochemicals involved as well as their effects on sugar cane. Further studies are also required to
ascertain whether allelochemical production in the live weeds and their release from live plants or
from decomposing plant material is governed by growth stage, plant part (leaves or roots), or by stage
of decomposition of residual plant material.
171
CHAPTER 7
A NEW HERBICIDE TANK-MIX OF TRIFLOXYSULFURON + AMETRYN AND
AMICARBAZONE TO PROVIDE A COST-EFFECTIVE BROAD-SPECTRUM
PRE- AND POST-EMERGENCE TREATMENT FOR MANAGING WEEDS
IN SUGAR CANE
7.1 Introduction
Traditionally, weed control in sugar cane in Mauritius was geared towards eradication of all weeds
from planting or harvest up to complete canopy closure. In the humid and superhumid areas, canopy
closure may take between 20 to 30 weeks; consequently, two or three herbicide applications had to be
made, often complemented by manual weeding (MSIRI, 2004). The work presented in earlier Chapters
have shown that it is possible to reduce costs of weed control by developing, new weed management
strategies based on critical periods of weed competition. The research presented in Chapter 2 showed
that critical periods varied between 6 and 27 weeks after planting or 12 and 26 weeks after harvest in
the humid areas where cane growth is slower and weed infestations are higher (Chapter 2; Seeruttun &
Lutman, 2004). The new strategies proposed included delaying of the first herbicide application to
coincide with onset of the critical periods of weed competition. The success of such an approach
would rely on the efficacy of the herbicide treatment in knocking down all emerged weeds present on
the day of spraying and providing a relatively long residual activity against a broad spectrum of
weeds.
A mixture of trifloxysulfuron 1.85% + ametryn 73.15% (Krismat® - WDG 75), developed by
Syngenta Crop Protection AG has been tested in Brazil where all the key sugar cane weed species
including the most economically important grass species such as Brachiaria spp., had been controlled
(Howard et al., 2001). The efficacy of this mixture on many grass species including Rottboellia
cochinchinensis (Lour.) Claiton and some broad-leaved weeds such as Euphorbia heterophylla L. has
also been reported in Cuba (Diaz et al., 2004). At rates of 1.5 kg a.i. ha-1, the new herbicide was well
tolerated by sugar cane. Amicarbazone (triazolinone) (Dinamic® WDG 70), from Arysta LifeScience
has also been reported to provide excellent control of many major annual dicotyledonous weeds and
grasses in sugarcane (Philbrook et al., 1999).
The current standard herbicide treatments available in Mauritius have limited effectiveness on
some grasses and sedges and are not fully effective if control is delayed until after early weed

172
emergence. A tank-mixture of trifloxysulfuron + ametryn and amicarbazone appeared from research
elsewhere to have the potential to provide broad-spectrum pre- and post-emergence control. The new
management strategies proposed would imply the application of early post-emergence treatments at
timings which differ from the traditional approach where the selectivity of the herbicides was achieved
by applying either pre-emergence of the cane, or when the latter had reached at least a growth stage of
12 to 14 weeks after planting. At 12 or 14 weeks, the crop better tolerates some of the herbicide
treatments. According to the new strategies, herbicide treatments would be applied post-emergence of
the crop (and weeds) and most probably at a stage of growth between four to eight weeks after
planting when risks of herbicide phytotoxicity would be higher. Consequently, this set of experiments
was done to assess the performance of these two new products and to investigate the feasibility of
developing new weed control approaches based on the critical period research. The objectives of the
trials were to:
1. Evaluate the pre-emergence potential of the two products and their tank-mixes against the
weeds present in sugar cane in Mauritius, and to compare the length of residual activities
obtained to that of other currently available herbicides.
2. Assess the potential and spectrum of control of the new herbicides and their tank-mixes
applied post-emergence to weeds in both plant and ratoon cane.
3. Determine any phytotoxicity of the new products or tank-mixes on the crop when applied both
pre- and post-emergence of cane.
173
7.2 Materials and methods
Trial characteristics and treatments
Eleven trials were conducted in plant and ratoon cane between March and December 2005. Details and
characteristics of the trial sites are given in Table 7.1. In the first four trials, treatments were applied
pre-emergence of plant cane and weeds. Amicarbazone at 0.7, 0.875, 1.05 and 1.4 kg a.i. ha-1,
trifloxysulfuron+ametryn at 0.0263 + 1.097 and 0.0315 + 1.317 kg a.i. ha-1, and amicarbazone at 0.875
and 1.05 kg a.i. ha-1 tank-mixed with trifloxysulfuron + ametryn at 0.0263 + 1.097 kg a.i. ha-1 were
compared to two standards, namely, oxyfluorfen + diuron (0.5 + 2.0 kg a.i. ha-1) and tebuthiuron +
atrazine (1.6 + 2.0 kg a.i. ha-1). An untreated control was also included.
In the second series of four trials (Trials V - VIII), treatments were applied post-emergence at
the same corresponding sites between 10 and 12 weeks after planting. Treatments comprised of
amicarbazone at 0.875, 1.05, 1.25 and 1.4 kg a.i. ha-1, trifloxysulfuron + ametryn at 0.0263 + 1.097
and 0.0315 + 1.317 and amicarbazone at 0.875 and 1.05 kg a.i. ha-1 tank-mixed with trifloxysulfuron +
ametryn at 0.0263 + 1.097 kg a.i. ha-1. A standard treatment consisting of the tank-mix tebuthiuron +
atrazine + 2,4-D amine salt (1.3 + 2.0 + 2.0 kg a.i. ha-1) and an untreated control were also included.
The last three trials (Trials IX, X and XI) were conducted in ratoon cane and post-emergence of
the weeds. The rates of amicarbazone, trifloxysulfuron + ametryn and amicarbazone +
trifloxysulfuron+ametryn were similar to those used post-emergence of plant cane, except that
amicarbazone alone at 1.25 kg a.i. ha-1 was excluded. A tank-mix of hexazinone + atrazine + 2,4-D
amine salt (0.6 + 2.0 + 2.0 kg a.i. ha-1) was included as an additional standard.
Experimental layout and treatment application
In all post-emergence trials, a non-ionic surfactant at 0.025% v/v was added to all treatments. At all
sites, the experimental design was a randomized complete block with three replicates and a plot size of
64 m2 (4 rows of 10 m length at a spacing of 1.6 m). Treatments were applied with hand-operated
knapsack sprayers with double hollow cone jet nozzles delivering 350 L ha-1 of spray mixture at a
working pressure of 300 kPa.
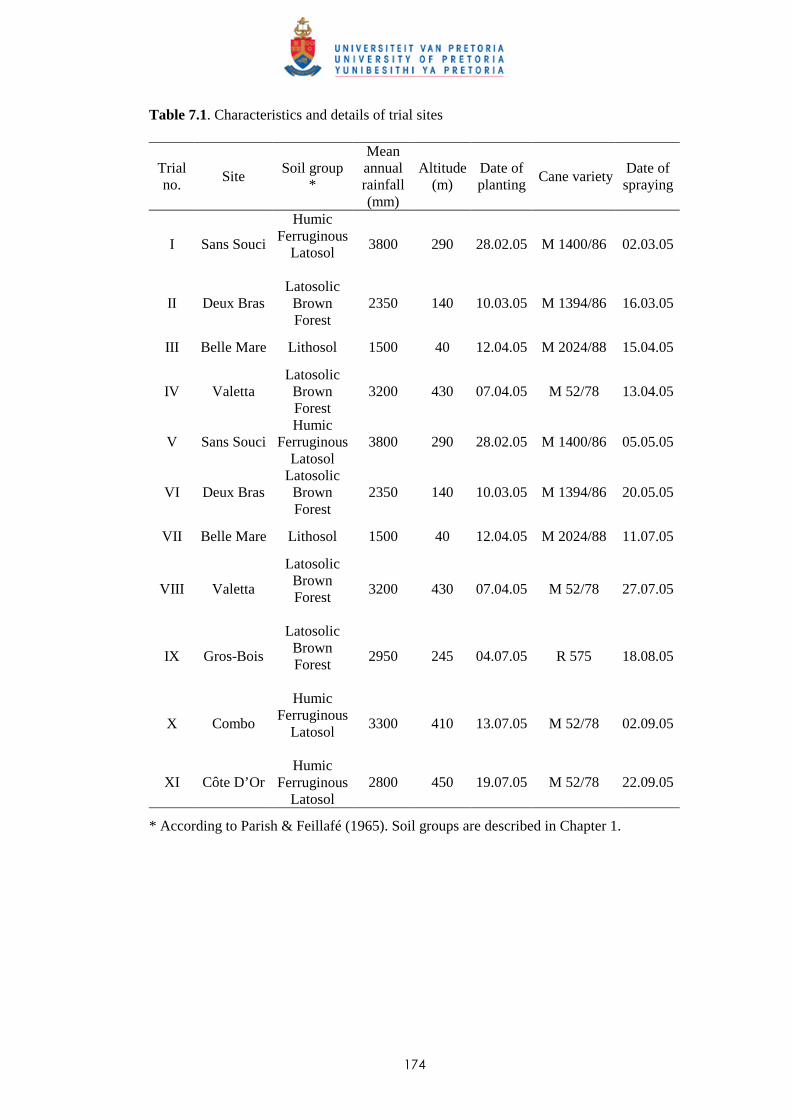
174
Table 7.1. Characteristics and details of trial sites
Trial no.
Site Soil group
*
Mean annual rainfall (mm)
Altitude (m)
Date of planting
Cane variety Date of spraying
I Sans Souci
Humic Ferruginous
Latosol
3800 290 28.02.05 M 1400/86 02.03.05
II Deux Bras Latosolic Brown Forest
2350 140 10.03.05 M 1394/86 16.03.05
III Belle Mare Lithosol 1500 40 12.04.05 M 2024/88 15.04.05
IV Valetta Latosolic Brown Forest
3200 430 07.04.05 M 52/78 13.04.05
V Sans Souci Humic
Ferruginous Latosol
3800 290 28.02.05 M 1400/86 05.05.05
VI Deux Bras Latosolic Brown Forest
2350 140 10.03.05 M 1394/86 20.05.05
VII Belle Mare Lithosol 1500 40 12.04.05 M 2024/88 11.07.05
VIII Valetta
Latosolic Brown Forest
3200 430 07.04.05 M 52/78 27.07.05
IX Gros-Bois
Latosolic Brown Forest
2950 245 04.07.05 R 575 18.08.05
X Combo
Humic Ferruginous
Latosol
3300 410 13.07.05 M 52/78 02.09.05
XI Côte D’Or Humic
Ferruginous Latosol
2800 450 19.07.05 M 52/78 22.09.05
* According to Parish & Feillafé (1965). Soil groups are described in Chapter 1.
175
Data collection and statistical analysis
For pre-emergence trials in plant cane, data collection comprised regular observations on weed
infestation and cane growth. Visual observations were made at 4 and 8 weeks after spraying (WAS),
whereas weed surveys were carried out twice between 12 and 19 WAS using the ‘Frequency
Abundance Method’ (Rochecouste, 1967). The latter method consists of, firstly, a listing of all weeds
present in the treatment plots, and then assigning their relative presence/cover on a scale varying
between 0 and 8. Stalk height was measured from ground level to the first visible dewlap at 12 WAS.
For the post-emergence trials in plant cane, a weed survey was carried out prior to spraying in
each individual plot to identify and quantify all weeds present. The first post-treatment weed survey
was conducted between 4 and 6 weeks after spraying to assess the post-emergence potential of each
treatment. Results were expressed in % weed kill for each plot by dividing the difference in weed
infestation (Frequency Abundance Method) between the two surveys by the initial infestation. The
second survey carried out between 10 and 13 WAS was mainly geared towards assessing the residual
activity following early post-emergence application.
For the post-emergence trials in ratoon cane, a weed survey was conducted to record weed
species and infestation levels in all plots a few days prior to spraying of treatments. Two formal weed
surveys were carried out between 6 and 12 WAS using the ‘Frequency Abundance Method’ to
calculate the % weed kill. Regular visual observations were made to assess any phytotoxicity on the
different cane varieties.
Data for weed control (expressed as % of the untreated control) and % weed kill were
transformed using the arcsine square root before statistical analysis was performed. Likewise, the %
increase in stalk height (x) for effect of the treatments on cane elongation was transformed using (x +
0.5)0.5 (Steel et al., 1997).
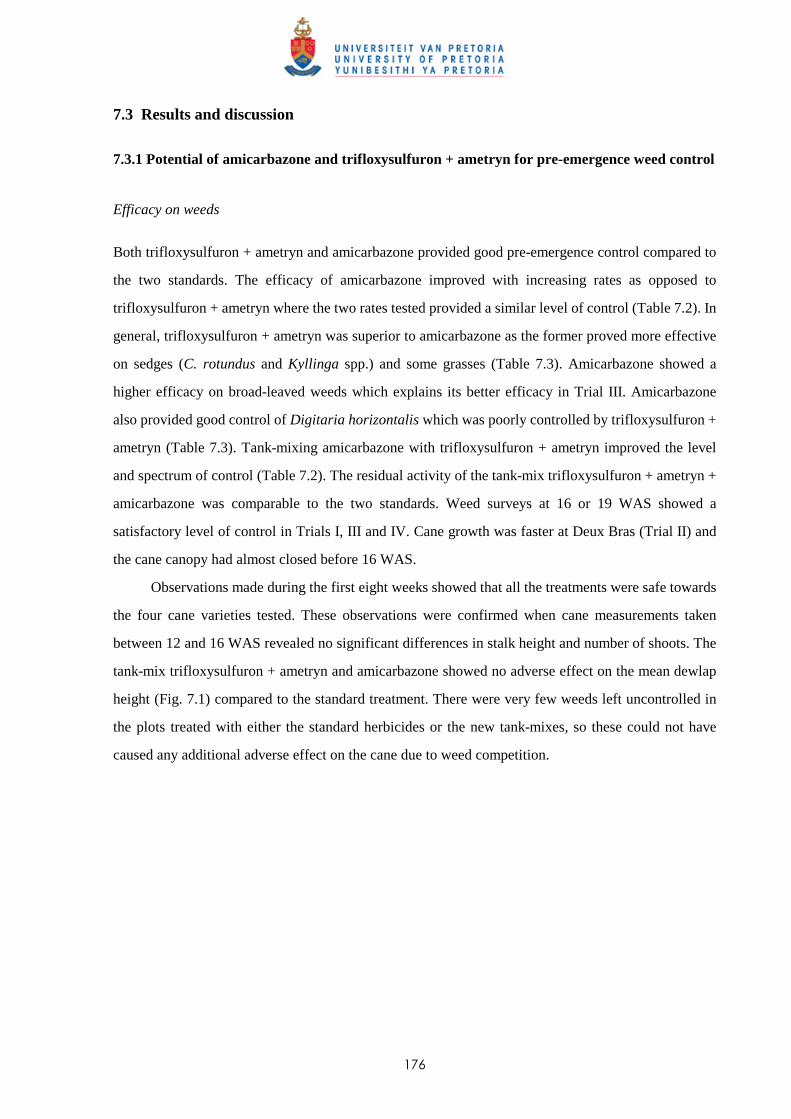
176
7.3 Results and discussion
7.3.1 Potential of amicarbazone and trifloxysulfuron + ametryn for pre-emergence weed control
Efficacy on weeds
Both trifloxysulfuron + ametryn and amicarbazone provided good pre-emergence control compared to
the two standards. The efficacy of amicarbazone improved with increasing rates as opposed to
trifloxysulfuron + ametryn where the two rates tested provided a similar level of control (Table 7.2). In
general, trifloxysulfuron + ametryn was superior to amicarbazone as the former proved more effective
on sedges (C. rotundus and Kyllinga spp.) and some grasses (Table 7.3). Amicarbazone showed a
higher efficacy on broad-leaved weeds which explains its better efficacy in Trial III. Amicarbazone
also provided good control of Digitaria horizontalis which was poorly controlled by trifloxysulfuron +
ametryn (Table 7.3). Tank-mixing amicarbazone with trifloxysulfuron + ametryn improved the level
and spectrum of control (Table 7.2). The residual activity of the tank-mix trifloxysulfuron + ametryn +
amicarbazone was comparable to the two standards. Weed surveys at 16 or 19 WAS showed a
satisfactory level of control in Trials I, III and IV. Cane growth was faster at Deux Bras (Trial II) and
the cane canopy had almost closed before 16 WAS.
Observations made during the first eight weeks showed that all the treatments were safe towards
the four cane varieties tested. These observations were confirmed when cane measurements taken
between 12 and 16 WAS revealed no significant differences in stalk height and number of shoots. The
tank-mix trifloxysulfuron + ametryn and amicarbazone showed no adverse effect on the mean dewlap
height (Fig. 7.1) compared to the standard treatment. There were very few weeds left uncontrolled in
the plots treated with either the standard herbicides or the new tank-mixes, so these could not have
caused any additional adverse effect on the cane due to weed competition.
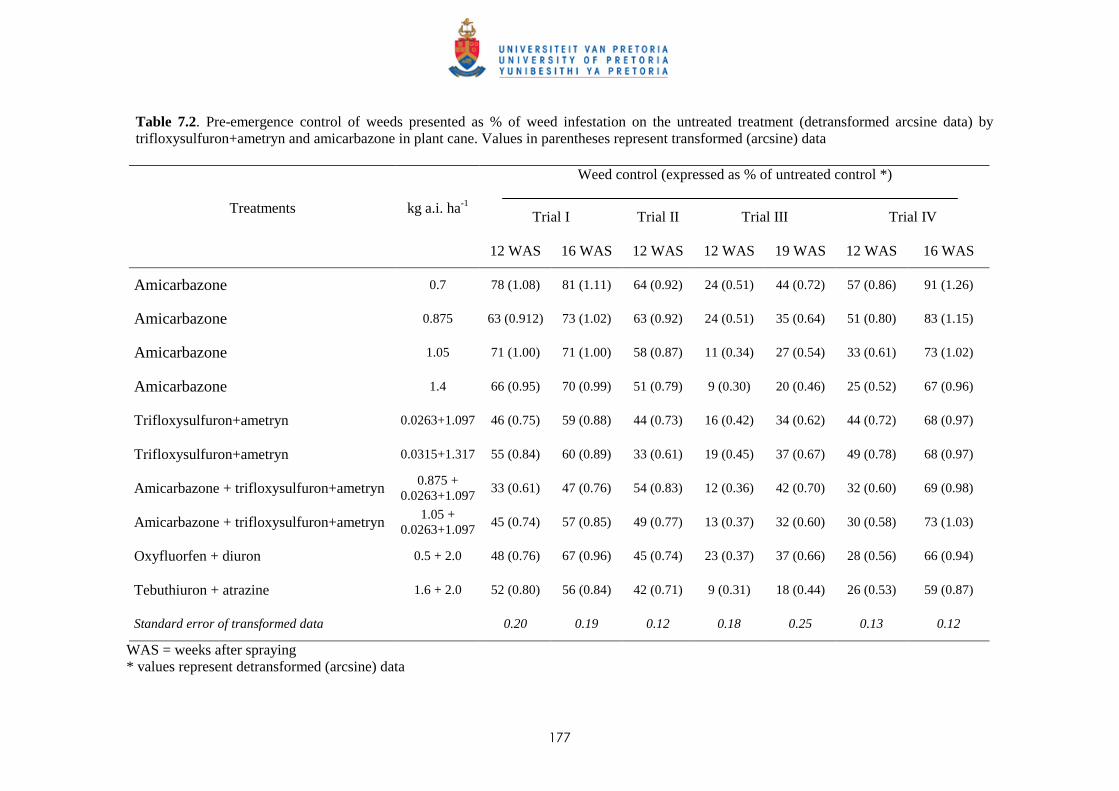
177
Table 7.2. Pre-emergence control of weeds presented as % of weed infestation on the untreated treatment (detransformed arcsine data) by trifloxysulfuron+ametryn and amicarbazone in plant cane. Values in parentheses represent transformed (arcsine) data
Weed control (expressed as % of untreated control *)
Trial I Trial II Trial III Trial IV Treatments
kg a.i. ha-1 12 WAS 16 WAS 12 WAS 12 WAS 19 WAS 12 WAS 16 WAS
Amicarbazone 0.7 78 (1.08) 81 (1.11) 64 (0.92) 24 (0.51) 44 (0.72) 57 (0.86) 91 (1.26)
Amicarbazone 0.875 63 (0.912) 73 (1.02) 63 (0.92) 24 (0.51) 35 (0.64) 51 (0.80) 83 (1.15)
Amicarbazone 1.05 71 (1.00) 71 (1.00) 58 (0.87) 11 (0.34) 27 (0.54) 33 (0.61) 73 (1.02)
Amicarbazone 1.4 66 (0.95) 70 (0.99) 51 (0.79) 9 (0.30) 20 (0.46) 25 (0.52) 67 (0.96)
Trifloxysulfuron+ametryn 0.0263+1.097 46 (0.75) 59 (0.88) 44 (0.73) 16 (0.42) 34 (0.62) 44 (0.72) 68 (0.97)
Trifloxysulfuron+ametryn 0.0315+1.317 55 (0.84) 60 (0.89) 33 (0.61) 19 (0.45) 37 (0.67) 49 (0.78) 68 (0.97)
Amicarbazone + trifloxysulfuron+ametryn 0.875 +
0.0263+1.097 33 (0.61) 47 (0.76) 54 (0.83) 12 (0.36) 42 (0.70) 32 (0.60) 69 (0.98)
Amicarbazone + trifloxysulfuron+ametryn 1.05 +
0.0263+1.097 45 (0.74) 57 (0.85) 49 (0.77) 13 (0.37) 32 (0.60) 30 (0.58) 73 (1.03)
Oxyfluorfen + diuron 0.5 + 2.0 48 (0.76) 67 (0.96) 45 (0.74) 23 (0.37) 37 (0.66) 28 (0.56) 66 (0.94)
Tebuthiuron + atrazine 1.6 + 2.0 52 (0.80) 56 (0.84) 42 (0.71) 9 (0.31) 18 (0.44) 26 (0.53) 59 (0.87)
Standard error of transformed data 0.20 0.19 0.12 0.18 0.25 0.13 0.12
WAS = weeks after spraying * values represent detransformed (arcsine) data
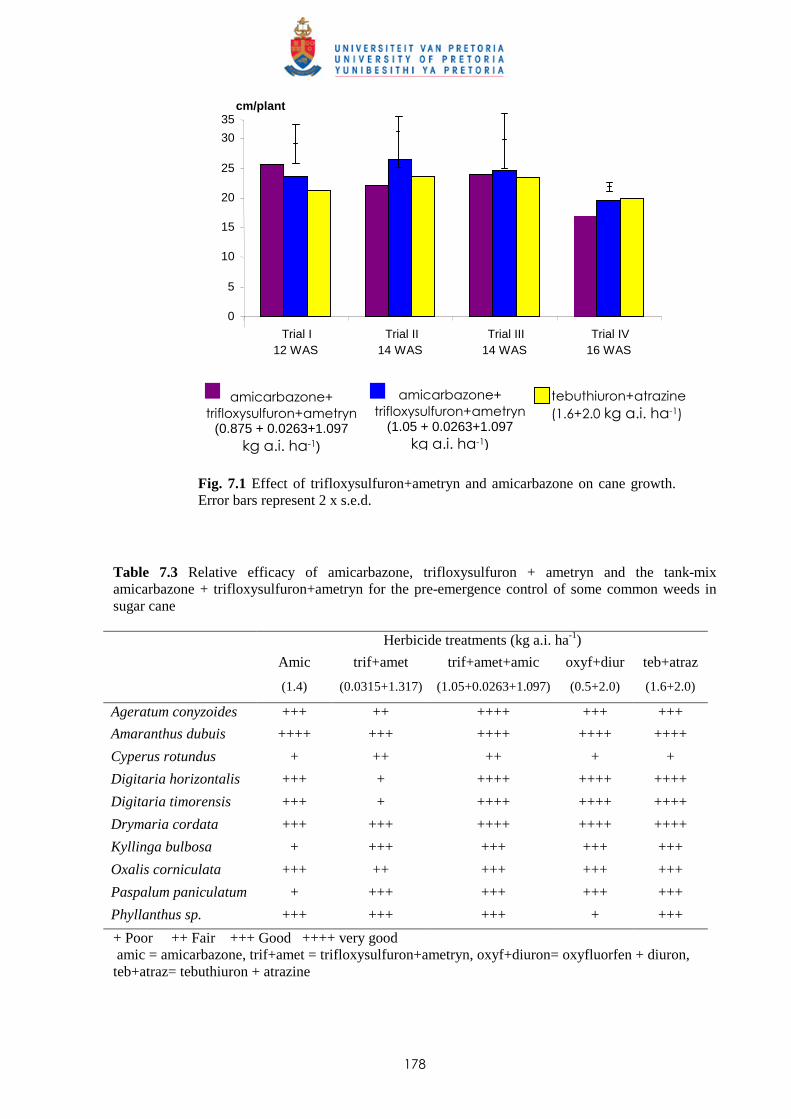
178
Fig. 7.1 Effect of trifloxysulfuron+ametryn and amicarbazone on cane growth. Error bars represent 2 x s.e.d.
Table 7.3 Relative efficacy of amicarbazone, trifloxysulfuron + ametryn and the tank-mix amicarbazone + trifloxysulfuron+ametryn for the pre-emergence control of some common weeds in sugar cane
Herbicide treatments (kg a.i. ha-1)
Amic
(1.4)
trif+amet
(0.0315+1.317)
trif+amet+amic
(1.05+0.0263+1.097)
oxyf+diur
(0.5+2.0)
teb+atraz
(1.6+2.0)
Ageratum conyzoides +++ ++ ++++ +++ +++
Amaranthus dubuis ++++ +++ ++++ ++++ ++++
Cyperus rotundus + ++ ++ + +
Digitaria horizontalis +++ + ++++ ++++ ++++
Digitaria timorensis +++ + ++++ ++++ ++++
Drymaria cordata +++ +++ ++++ ++++ ++++
Kyllinga bulbosa + +++ +++ +++ +++
Oxalis corniculata +++ ++ +++ +++ +++
Paspalum paniculatum + +++ +++ +++ +++
Phyllanthus sp. +++ +++ +++ + +++
+ Poor ++ Fair +++ Good ++++ very good amic = amicarbazone, trif+amet = trifloxysulfuron+ametryn, oxyf+diuron= oxyfluorfen + diuron, teb+atraz= tebuthiuron + atrazine
amicarbazone+
trifloxysulfuron+ametryn (0.875 + 0.0263+1.097
kg a.i. ha-1)
amicarbazone+
trifloxysulfuron+ametryn (1.05 + 0.0263+1.097
kg a.i. ha-1)
tebuthiuron+atrazine
(1.6+2.0 kg a.i. ha-1)
0
5
10
15
20
25
30
35
Trial I 12 WAS
Trial II 14 WAS
Trial III 14 WAS
Trial IV
16 WAS
cm/plant
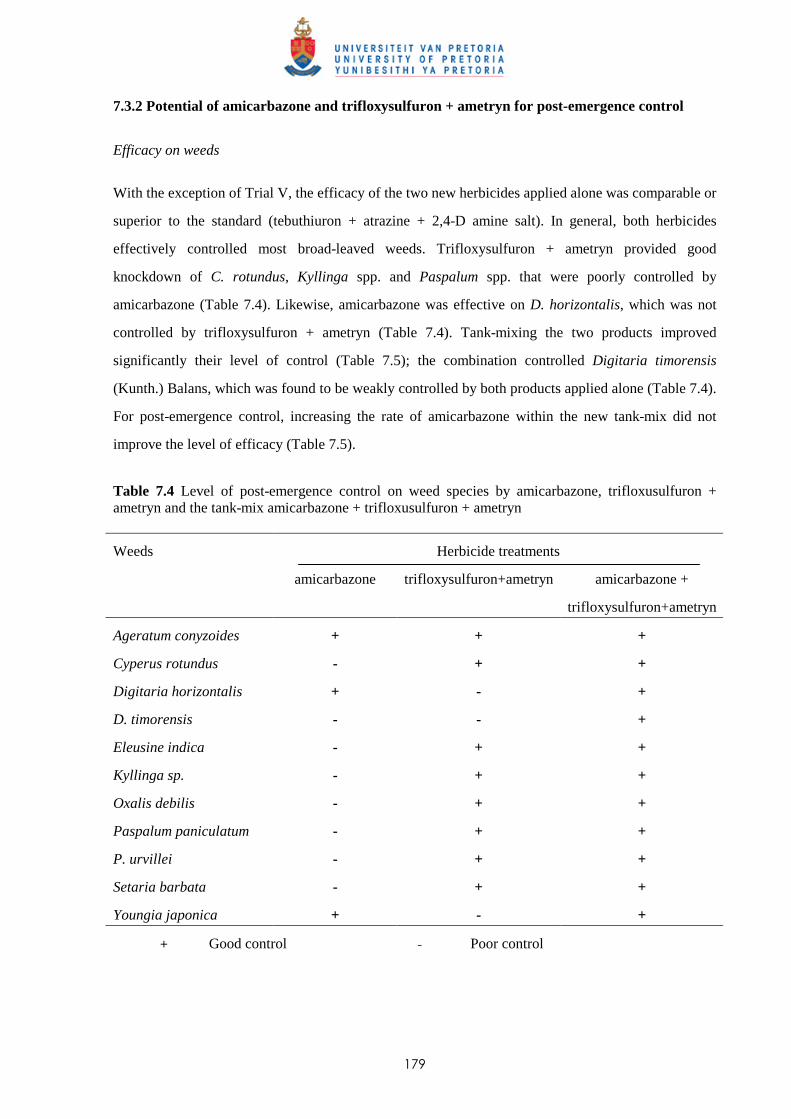
179
7.3.2 Potential of amicarbazone and trifloxysulfuron + ametryn for post-emergence control
Efficacy on weeds
With the exception of Trial V, the efficacy of the two new herbicides applied alone was comparable or
superior to the standard (tebuthiuron + atrazine + 2,4-D amine salt). In general, both herbicides
effectively controlled most broad-leaved weeds. Trifloxysulfuron + ametryn provided good
knockdown of C. rotundus, Kyllinga spp. and Paspalum spp. that were poorly controlled by
amicarbazone (Table 7.4). Likewise, amicarbazone was effective on D. horizontalis, which was not
controlled by trifloxysulfuron + ametryn (Table 7.4). Tank-mixing the two products improved
significantly their level of control (Table 7.5); the combination controlled Digitaria timorensis
(Kunth.) Balans, which was found to be weakly controlled by both products applied alone (Table 7.4).
For post-emergence control, increasing the rate of amicarbazone within the new tank-mix did not
improve the level of efficacy (Table 7.5).
Table 7.4 Level of post-emergence control on weed species by amicarbazone, trifloxusulfuron + ametryn and the tank-mix amicarbazone + trifloxusulfuron + ametryn
Weeds Herbicide treatments
amicarbazone trifloxysulfuron+ametryn amicarbazone +
trifloxysulfuron+ametryn
Ageratum conyzoides + + +
Cyperus rotundus - + +
Digitaria horizontalis + - +
D. timorensis - - +
Eleusine indica - + +
Kyllinga sp. - + +
Oxalis debilis - + +
Paspalum paniculatum - + +
P. urvillei - + +
Setaria barbata - + +
Youngia japonica + - +
Good control Poor control
+ -
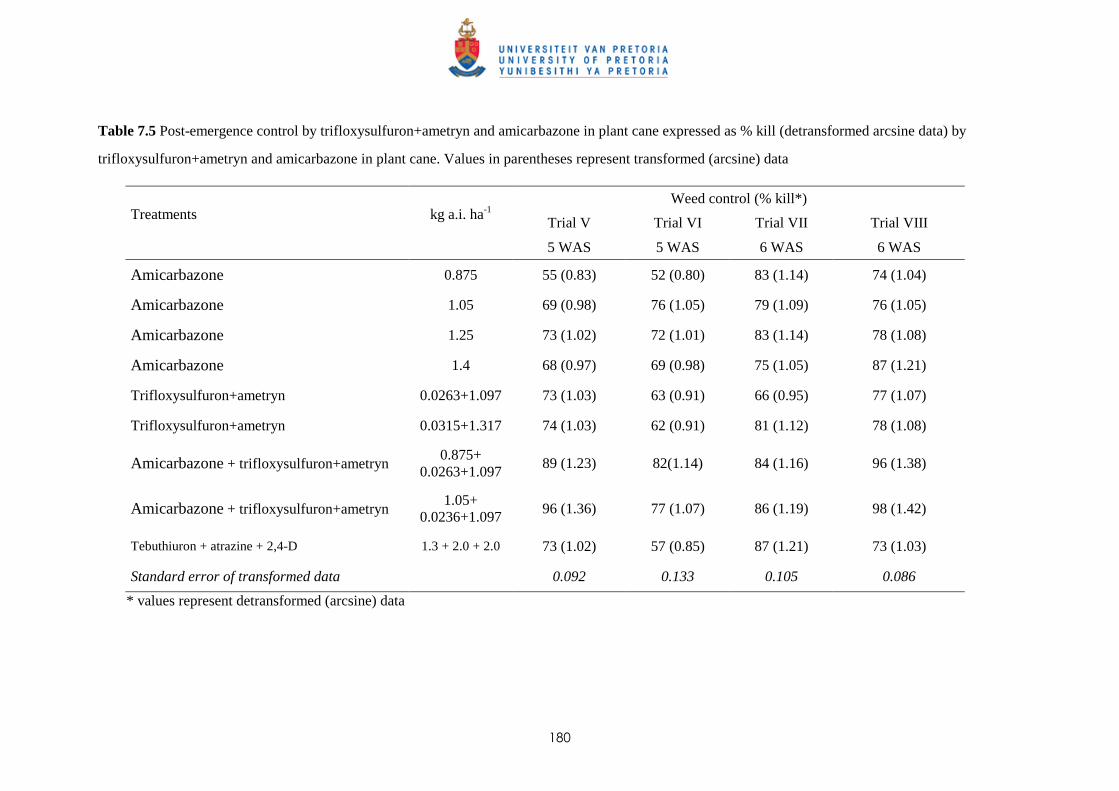
180
Table 7.5 Post-emergence control by trifloxysulfuron+ametryn and amicarbazone in plant cane expressed as % kill (detransformed arcsine data) by
trifloxysulfuron+ametryn and amicarbazone in plant cane. Values in parentheses represent transformed (arcsine) data
Weed control (% kill*)
Trial V Trial VI Trial VII Trial VIII Treatments
kg a.i. ha-1
5 WAS 5 WAS 6 WAS 6 WAS
Amicarbazone 0.875 55 (0.83) 52 (0.80) 83 (1.14) 74 (1.04)
Amicarbazone 1.05 69 (0.98) 76 (1.05) 79 (1.09) 76 (1.05)
Amicarbazone 1.25 73 (1.02) 72 (1.01) 83 (1.14) 78 (1.08)
Amicarbazone 1.4 68 (0.97) 69 (0.98) 75 (1.05) 87 (1.21)
Trifloxysulfuron+ametryn 0.0263+1.097 73 (1.03) 63 (0.91) 66 (0.95) 77 (1.07)
Trifloxysulfuron+ametryn 0.0315+1.317 74 (1.03) 62 (0.91) 81 (1.12) 78 (1.08)
Amicarbazone + trifloxysulfuron+ametryn 0.875+
0.0263+1.097 89 (1.23) 82(1.14) 84 (1.16) 96 (1.38)
Amicarbazone + trifloxysulfuron+ametryn 1.05+
0.0236+1.097 96 (1.36) 77 (1.07) 86 (1.19) 98 (1.42)
Tebuthiuron + atrazine + 2,4-D 1.3 + 2.0 + 2.0 73 (1.02) 57 (0.85) 87 (1.21) 73 (1.03)
Standard error of transformed data 0.092 0.133 0.105 0.086
* values represent detransformed (arcsine) data
181
Effect on cane growth
Cane measurements made prior to spraying and 6 weeks later revealed that neither of the two new
herbicides nor their tank-mixes caused a reduction in tillers or lower cane dewlap heights when
compared to the standard (tebuthiuron + atrazine + 2,4 D amine salts). As the latter is known to be safe
for post-emergence application in sugar cane, the new tank-mix should therefore be relatively safe for
such application. As the level of post-emergence weed control by the new tank-mixes was superior to
that obtained in the standard plots, the few weeds left uncontrolled in the latter plots may suggest some
weed competition which would mask the effect of crop damage by the new herbicides. The possibility
of the latter occurring was minimised by also comparing the cane growth parameters with the
measurements recorded in the plots from the pre-emergence trials, which were initiated in the same
field at each locality (same variety and planting dates).
7.3.3 Potential of amicarbazone and trifloxysulfuron+ametryn for early post-emergence weed
control in ratoon cane
Post-emergence control of weeds
The three trials conducted in ratoon cane were sprayed 6 to 8 weeks after harvest to assess
trifloxysulfuron+ametryn and amicarbazone for use within the newly developed weed management
strategy. The two new herbicides, applied alone, were again found to be as effective as the two
standards for their knockdown effect. Higher rates of amicarbazone resulted in increased efficacy
(Table 7.6). The tank-mix of trifloxysulfuron+ametryn + amicarbazone once more tended to show
higher level of control than the two standards. Thus, superiority was achieved as a result of a more
effective control of species such as D. horizontalis, P. paniculatum, P. urvillei, S. barbata, Kyllinga
spp. and C. rotundus (see Table 7.4).
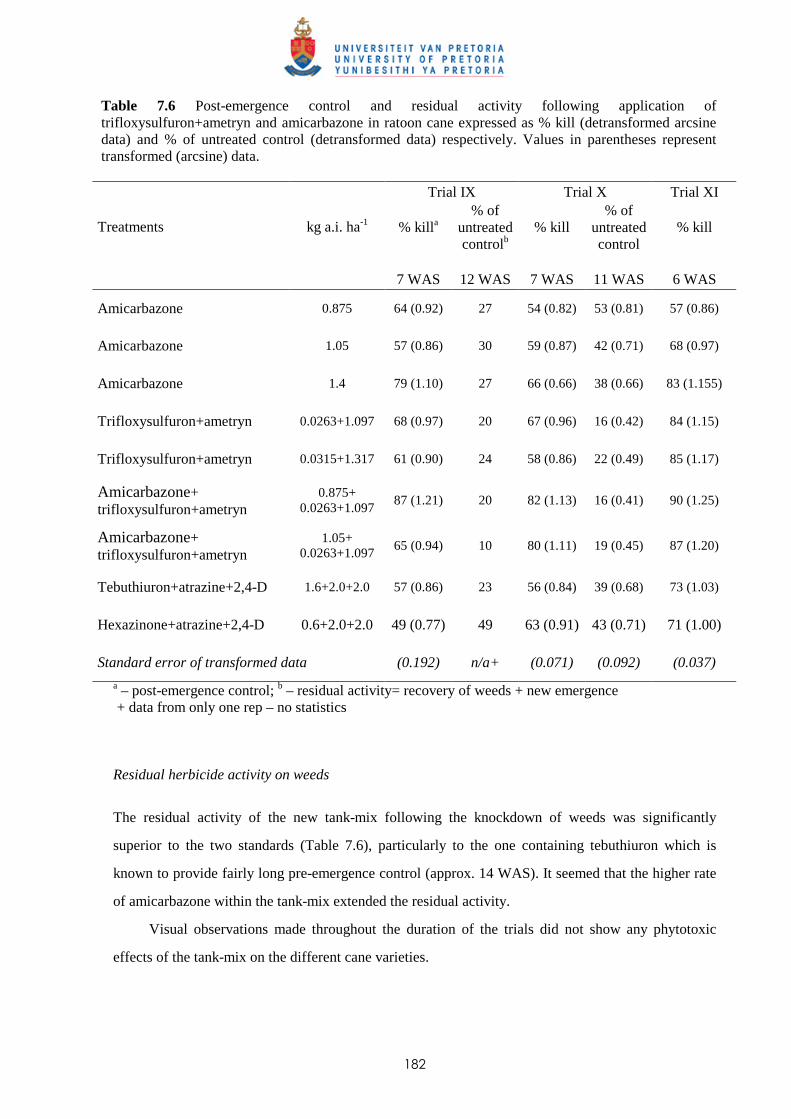
182
Table 7.6 Post-emergence control and residual activity following application of trifloxysulfuron+ametryn and amicarbazone in ratoon cane expressed as % kill (detransformed arcsine data) and % of untreated control (detransformed data) respectively. Values in parentheses represent transformed (arcsine) data.
Trial IX Trial X Trial XI
% killa
% of untreated controlb
% kill
% of untreated control
% kill
Treatments
kg a.i. ha-1
7 WAS 12 WAS 7 WAS 11 WAS 6 WAS
Amicarbazone 0.875 64 (0.92) 27 54 (0.82) 53 (0.81) 57 (0.86)
Amicarbazone 1.05 57 (0.86) 30 59 (0.87) 42 (0.71) 68 (0.97)
Amicarbazone 1.4 79 (1.10) 27 66 (0.66) 38 (0.66) 83 (1.155)
Trifloxysulfuron+ametryn 0.0263+1.097 68 (0.97) 20 67 (0.96) 16 (0.42) 84 (1.15)
Trifloxysulfuron+ametryn 0.0315+1.317 61 (0.90) 24 58 (0.86) 22 (0.49) 85 (1.17)
Amicarbazone+ trifloxysulfuron+ametryn
0.875+ 0.0263+1.097
87 (1.21) 20 82 (1.13) 16 (0.41) 90 (1.25)
Amicarbazone+ trifloxysulfuron+ametryn
1.05+ 0.0263+1.097
65 (0.94) 10 80 (1.11) 19 (0.45) 87 (1.20)
Tebuthiuron+atrazine+2,4-D 1.6+2.0+2.0 57 (0.86) 23 56 (0.84) 39 (0.68) 73 (1.03)
Hexazinone+atrazine+2,4-D 0.6+2.0+2.0 49 (0.77) 49 63 (0.91) 43 (0.71) 71 (1.00)
Standard error of transformed data (0.192) n/a+ (0.071) (0.092) (0.037)
a – post-emergence control; b – residual activity= recovery of weeds + new emergence + data from only one rep – no statistics Residual herbicide activity on weeds
The residual activity of the new tank-mix following the knockdown of weeds was significantly
superior to the two standards (Table 7.6), particularly to the one containing tebuthiuron which is
known to provide fairly long pre-emergence control (approx. 14 WAS). It seemed that the higher rate
of amicarbazone within the tank-mix extended the residual activity.
Visual observations made throughout the duration of the trials did not show any phytotoxic
effects of the tank-mix on the different cane varieties.

183
7.4 Discussion and conclusions
The good potential of herbicides trifloxysulfuron + ametryn and amicarbazone as both pre- and post-
emergence treatments was demonstrated in plant and ratoon cane. Applied pre-emergence of weeds,
both herbicides were effective on most broad-leaved weeds and some annual grasses. Trifloxysulfuron
+ ametryn was less effective on Digitaria horizontalis and D. timorensis, and amicarbazone did not
control Cyperus rotundus, Paspalum spp. and Kyllinga spp (Table 7.3). Tank-mix at lower rates of
both herbicides overcame their individual weaknesses while maintaining a residual activity of over 14
to 16 weeks. When applied early post-emergence of weeds, both trifloxysulfuron + ametryn and
amicarbazone were effective on most broad-leaved weeds and some grasses. The efficacy of
trifloxysulfuron + ametryn on Paspalum spp., C. rotundus and other sedges, and that of amicarbazone
on Digitaria horizontalis compensated for their individual inefficacies when they were tank-mixed
(Table 7.4). As far as could be ascertained from the trials, which were not set up to specifically assess
crop tolerance, the tank-mixes trifloxysulfuron + ametryn + amicarbazone were well tolerated by both
young plant and ratoon cane.
The efficacy (pre- and post-emergence) of the new tank-mix offers a new perspective for
managing weeds in sugarcane by delaying of the first herbicide application which will result in
savings of at least one herbicide treatment per season. The tank-mix trifloxysulfuron + ametryn +
amicarbazone (0.0263 + 1.097 + 0.875-1.05 kg a.i. ha-1) has been registered and recommended for use
in Mauritius; the higher rate of amicarbazone would be useful where a relatively longer residual
activity is required. At these rates, the cost of the new tank-mix is comparable to the conventional
treatments, but the possibility of saving one treatment per season renders the new tank-mix more cost-
effective.
184
CHAPTER 8
GENERAL DISCUSSIONS & CONCLUSIONS
8.1 Weed competition in sugar cane
Competition between sugar cane and the major weeds
This study has shown that sugar cane is affected by competition from weeds just like other crops but
the effect is often relatively small. Under the worst scenarios assessing the critical period of weed
competition in sugar cane, the maximum reduction in cane yield was recorded in plant cane and was
53% of the weed-free treatments after weeds were left in competition with sugar cane for nearly 30
weeks. This reduction is lower than that reported by Suwanarak (1990) who found cane yields to be
lowered by more than 70% after no weeding during the first four months after planting in the wet
season in Thailand. In ratoon cane, the maximum losses in cane yields varied between 20% and 30%.
Similarly, in the trials evaluating competition from individual species (Chapters 3 & 4), competition
on the total dewlap height or biomass from very high weed densities rarely exceeded 50%. In other
crops, some yield losses due to weed competition have been reported by Naylor (2002); a summary of
51 experiments carried out in UK and involving wild oats densities ranging 8 to 662 plants m-2 caused
yields of spring barley to decrease by 0 to 72% while canary grass (Phalaris minor) and black grass
(Alopecurus myosuroides) reduced yields of winter wheat by 26% and 45% at densities of 300 and 500
plants m-2 respectively.
Relative competitiveness ‘q’ values of eight weed species commonly found in sugar fields,
determined by model developed by Kropff and Spitters (1991), showed that sugar cane was a stronger
competitor than most of the weeds tested. Although use of this model, based on the relative leaf areas
of the weed and crop, showed similar trends when the same weeds were compared, their q values were
found to vary across trials. However, the variations in q values found for weeds in sugar cane are
smaller than those reported for competition between Sinapis alba L. (white mustard) and sugar beet
(Beta vulgaris L.) or spring wheat (Triticum aestivum L.) (Lotz et al., 1996). The varying q values
may limit the use of this model for predicting yield losses in sugar cane and comparisons between
various species would only be possible if all the weeds were tested under a range of similar conditions.
Despite these limitations, it was, however, possible to identify some of the weeds as being more
competitive, i.e. A. conyzoides, P. paniculatum, D. horizontalis and S. barbata, compared to a lesser
competitive group including B. pilosa, P. urvillei, P. conjugatum and P. commersonii. The latter
185
information conflicts with the perception of many growers that grasses are more competitive than
broad-leaved weeds. The difficulty of achieving control of all grasses with selective herbicides in
sugar cane may have created this belief. Timing of competition
The critical periods of weed competition determined in Chapter 2 revealed that the adverse effect of
weed competition in sugar cane was not experienced before several weeks following cane and weed
emergence. This was also confirmed in the different trials, both under glasshouse and field conditions,
assessing competition from one weed species at a time; the adverse effects on cane growth were
measurable only 10-12 weeks after imposing weed infestations. In some of the trials with the broad-
leaved weeds, some treatments at higher densities showed the adverse effects earlier due to the quicker
rate of growth of the weeds. This lag period between weed emergence and competition explains why
the onset of the critical periods of weed competition is several weeks later in ratoon cane. Competition
started earlier (6 WAP) in the critical period trial carried out in plant cane and this may be explained
by the presence of more broad-leaved weeds at that site, the period of the year and the relatively
slower cane growth.
The relative competitiveness based on ‘q’ values of both P. paniculatum and P. urvillei was
found to remain unchanged with time within the first nine weeks after establishment of weed
infestations. A reduction in their competitiveness was recorded after 13 WAT (in Trial III, chapter 4),
mainly explained by the distribution of the leaves within the canopy though they had similar relative
leaf areas (Lw).
The timing of weed emergence on the final cane yield was illustrated in Chapter 4 (Trials 1 &
III). Both trials revealed that the second transplanting of weeds tested caused no significant difference
on cane yield. The physiological difference between the two dates of transplanting included both mean
height of shoots and the stage of tillering. The results indicate that weed infestations, occurring when
the cane approaches peak tiller density for that variety and when shoot heights are more than 40 cm,
would be less prone to weed competition.
Measurements of the total cane dewlap height at the different observation dates had shown some
significant reduction although the same treatments did not show any difference at harvest. It is
believed that due to its long growing period after the cane leaves are less exposed to the competition
for light till harvest, sugar cane has an ability to recover and compensate for earlier losses. Apparent
186
effects of weed competition observed before canopy closure do not necessarily translate into yield
losses.
Effect of weed density on weed competition
Although it was difficult to maintain the ‘original’ densities as at transplanting, increasing weed
density was found to influence weed competition and result in earlier weed competition. However,
there was often little difference between the higher weed densities, as a result of high level of intra-
specific competition between the weeds. Broad-leaved weeds such as A. conyzoides and B. pilosa have
a more prostrate growth and hence were subjected to more intra-specific competition as compared to
the grasses with a more upright growth of the leaves. This may explain the lack of a major difference
between the two infestation levels studied in some of the critical period trials; the 50% infestation
level was most probably not so different to the natural infestations.
Mechanisms of weed competition
Weed competition impaired both tillering (shoot density) and stalk elongation (dewlap height of
stalks). In most of the trials, early weed competition resulted more in a reduction of the number of
shoots or stalks. Stalk elongation was reduced when competition occurred after the peak of the
tillering phase or stalks had reached a mean dewlap height of 25 cm or more. The effect of competition
on stalk elongation was also demonstrated in the split-box and allelopathy trials where the effect of
competition was observed only after the stalks had reached a dewlap height of 35 to 40 cm.
One of outcomes of this study has been the identification of the involvement of other
mechanisms of weed competition as well as that for light. In the critical period trials, competition was
still observed with weeds that emerged towards the end of the CPWC or when the cane stalks were
higher than the weeds. This was confirmed with the comparison of P. paniculatum and P. urvillei
where the former proved to be more competitive in some treatments although the latter produced more
leaf area (for similar densities) and grew taller to intercept more light within the canopy. The vertical
distribution of leaf area of cane and weeds (Chapter 4) showed that P. paniculatum was as or more
competitive even though most of the cane leaf area was found higher in the canopy than the weeds.
This indicated that other mechanisms might be involved and that competition for light was more
important during the earlier growth stages where tillering was mostly affected.
Root competition was shown to be as important as shoot competition or more in Chapter 5. Root
development of sugar cane was impaired by both root and shoot competition and the fact that they
187
were not resulting in a more severe competition when both occurred simultaneously suggested that
they were not affecting root development in the same manner. The effects of root competition were
observed several weeks after imposing competition when the cane stalks reached more then 35 cm in
dewlap height suggesting that root competition was more important than competition for light after the
post-tillering phase.
Although root competition seemed to cause more reduction in root biomass of P. urvillei
compared to P. paniculatum, the higher competitiveness of the latter was still not completely
explained. Collection of leachates (root exudates) from the two grasses applied daily to sugar cane
confirmed an effect from allelopathic compounds resulting in a reduction of root biomass of sugar
cane. In one trial (Trial I), P. paniculatum developed vigorously and the effect of its leachates on cane
growth was more pronounced than those from P. urvillei. In the other trials, where an adverse effect
from the allelochemicals was observed, P. urvillei was more competitive; P. paniculatum had not
developed so vigorously as in the first trial. One chemical identified from the leachates that may be
responsible for the allelopathic effects was 2-Propenoic acid, 3-(4-methoxyphenyl), from the known
(for their allelopathic properties) family of cinnamic acids. The presence of higher concentration of
this chemical in the leachates (samples taken in Trial IV) from P. paniculatum suggests a link with the
greater reduction in root biomass observed between this treatment and the control (distilled water).
In conclusion, although weeds appear to impact on the growth of sugar cane by competing for
light, there are also effects arising from below ground competition. This may be linked to competition
for water and nutrients but may also involve allelochemicals. The allelopathic potential of the other
weeds, particularly grasses such as D. horizontalis and Panicum species, occurring in sugar cane fields
need to be assessed. The allelopathic properties of C. rotundus on sugar cane had been demonstrated
by Mc Intyre (1998). Further research is needed in the mechanism of below ground competition and its
importance for other weed species apart from the two Paspalum spp.
The mechanisms of weed competition may be summarized by competition for light at the earlier
stages of growth (germination/tillering) and root competition, with or without allelopathic exudates
from the weeds, later within the tillering/elongation phase.
8.2 Applications and recommendations for the Mauritian sugar industry arising from this research study
The main application of the above findings for the Mauritian sugar industry would be a change in the
timing of application of herbicide treatments. The critical periods study shows that the ‘traditional’
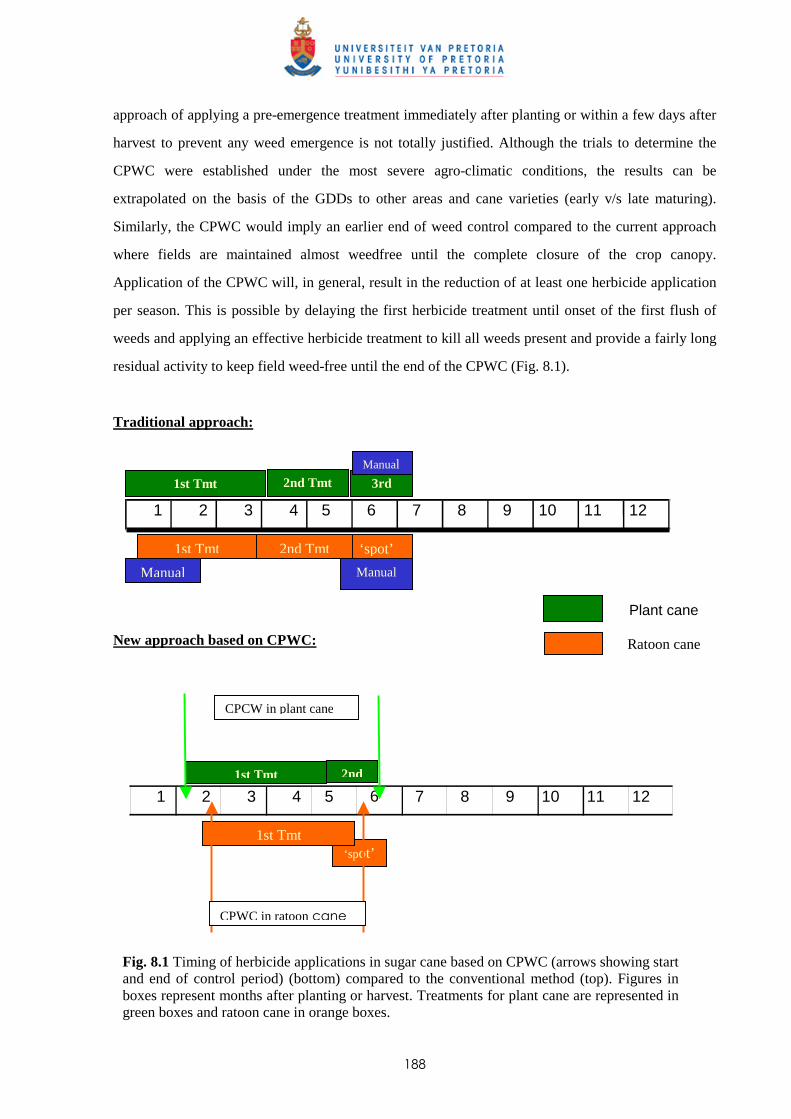
188
approach of applying a pre-emergence treatment immediately after planting or within a few days after
harvest to prevent any weed emergence is not totally justified. Although the trials to determine the
CPWC were established under the most severe agro-climatic conditions, the results can be
extrapolated on the basis of the GDDs to other areas and cane varieties (early v/s late maturing).
Similarly, the CPWC would imply an earlier end of weed control compared to the current approach
where fields are maintained almost weedfree until the complete closure of the crop canopy.
Application of the CPWC will, in general, result in the reduction of at least one herbicide application
per season. This is possible by delaying the first herbicide treatment until onset of the first flush of
weeds and applying an effective herbicide treatment to kill all weeds present and provide a fairly long
residual activity to keep field weed-free until the end of the CPWC (Fig. 8.1).
Traditional approach:
New approach based on CPWC:
Fig. 8.1 Timing of herbicide applications in sugar cane based on CPWC (arrows showing start and end of control period) (bottom) compared to the conventional method (top). Figures in boxes represent months after planting or harvest. Treatments for plant cane are represented in green boxes and ratoon cane in orange boxes.
1 2 4 5 6
7 8 9 10 11 12 3
3rd Tmt
1st Tmt 2nd Tmt
Ratoon cane
‘spot’ 1st Tmt 2nd Tmt
Manual
Manual Manual
1 2 4 5 6
7 8 9 10 11 12 3
Plant cane
1st Tmt 2nd
‘spot’ 1st Tmt
CPCW in plant cane
CPWC in ratoon cane
189
Row spacing influences the critical timing for weed removal (Knezevic et al., 2003). Planting
cane at higher density by changing the row spacing would reduce further the period of control based
on the CPWC. Dual row planting, consisting of pairs of cane rows 0.5 m apart with 1.8 m between
their centres, has been tested successfully and recommended to the producers in 2006 (MSIRI, 2006;
Ismael et al., 2007). The new row spacing also has the potential of increasing cane yield with the same
amount of planting material and with no increase in fertilizer used compared to conventional planting
(1.62 m spacing). It also reduces costs of production by improving weed management and the
efficiency of chopper-harvesters. This improvement in weed management results from earlier canopy
closure and consequently the end of the CPWC is reached four to eight weeks earlier (Ismael et al.,
2007).
The success of such a weed management strategy as above would only be possible if the
herbicide treatments are able to kill all the weeds present at the time of application and provide
effective residual control of most of the weeds present for the duration of the CPWC. Traditional
herbicide treatments did not have that potential and the evaluation and the recommendation of the new
tank-mix amicarbazone + trifloxysulfuron+ametryn (Chapter 7) has satisfied this requirement. The
new tank-mix consisting of trifloxysulfuron+ametryn (0.0263+1.097 kg a.i. ha-1) and amicarbazone
(0.875 to 1.05 kg a.i./ha) has a residual activity varying between 14 to 16 weeks and, has post-
emergence activity. It is able to control almost all weeds found in sugar cane in Mauritius including
D. horizontalis, D. timorensis, C. rotundus, Paspalum spp. and Kyllinga spp. Moreover,
trifloxysulfuron+ametryn has the potential of controlling partly C. rotundus pre-emergence. The tank-
mix, amicarbazone + trifloxysulfuron+ametryn (0.875-1.05 + 0.0263+1.097 kg a.i. ha-1) did not cause
crop injury in young plant or ratoon cane. The efficacy (pre- and post-emergence) of this new tank-
mix has offered a new opportunity for managing weeds in sugar cane, as delaying of the first herbicide
application will result in savings of at least one herbicide treatment per season.
New weed management strategies based on the CPWC include the exploitation of control
methods other than use of herbicides. The use of mechanical weeding during the first two or three
months after planting has also been tested successfully (MSIRI, 2006). Two or three passes of duck’s
foot cultivators have proved to be sufficient to control weeds up to the end of the critical periods. This
method of weed control has been recommended in plant cane and where fields are either in rock-free
soils or have been derocked for mechanized harvest; this approach would be possible on some 50% of
the replanted area every year.
The concept of limiting weed control during the CPWC period, particularly that of leaving
weeds uncontrolled after the end of the CPWC, has been discussed by many growers in the past. They
190
were concerned about the production of seeds from the ‘residual’ weeds and its consequences on the
seedbank in the mid- or long-term. Trials (not reported in this study) initiated in parallel to the above
development have shown that there was no significant increase in the seedbank between the same
plots where weed control had been stopped 16 weeks after harvest for three consecutive years and
plots which were kept weed-free. This study is being pursued but as the new weed management
strategies are geared towards weed control until 20 to 26 WAH, the risks of increasing the seedbank is
minimised. Riemens et al. (2007) has shown that appropriate weed management practices in organic
farming resulted in no increase in the weed seedbank after seven years. Weed control strategies based
on density thresholds were found more cost-effective than spraying every year after modelling seed
production of Alopecurus myosuroides and Poa annua (Munier-Jolain et al., 2002). Similarly, Smith
et al. (1999) reported a reduction in the population of Anisantha sterilis in winter wheat through
changes in patterns of management. In sugar cane, Witharama et al. (1997) reported that the similarity
between species in the seed bank and emerged seedling population in the field was low. This may
imply that all the seeds produced do not necessarily pose a threat of more competition later on.
Green cane trash blanketing (GCTB) is practised on approximately 25% of the area harvested
and is expected to increase as more fields are harvested mechanically in the near future. The trash
blanket controls the weeds effectively until it decays; in humid areas this may happen before end of
the CPWC and a herbicide treatment may be required. Similarly under some agro-climatic conditions,
especially in plant cane, a second treatment, over and above the new tank-mix applied before the onset
of the CPWC, may be justified. Under these conditions, the use of models to predict the weed
competition expected from the different infestation levels and weed species present would be
beneficial and would suggest further savings of herbicides. However, the findings of this study have
revealed varying relative competitiveness (q) values across trials and standardization of the results
needs more work. Furthermore, the use of such parameters in sugar cane would be more difficult due
to the length of the growing season; the q values changes with time of weed emergence and
assessment date.
The allelopathic potential of the other weeds needs to be determined before making any decision
on leaving such weeds in the fields after the end of the CPWC. As root competition seems to be
important and sugar cane roots do not exploit the cane interrows entirely, weed management could be
envisaged that was focused in the vicinity of the stubble or cane roots. This is supported by work
carried out by Witharama et al. (2007) who found that more weeds emerged in the cane furrows than
on the ridges and the difference was influenced by the soil moisture. The latter may imply a herbicide
treatment on a localised band nearer to the cane stools in situations where a second post-emergence
191
treatment would be required to reach the end of the CPWC. As the soil moisture varies within the
three agroclimatic zones of Mauritius, such approaches would require more research and development.
8.3 Suggestions for future research
Relative competitiveness (q value) for more weeds
This study has indicated two groups of weeds according to their relative competitiveness. More trials
should be conducted to evaluate the relative competitiveness (q values) of more weed species
occurring in sugar cane fields; the data would be useful for prediction of yield losses for management
purposes or Decision Support Systems. The q values could be used to regroup weeds into two or three
categories. The results of this study would assist in redefining the various densities for estimating q
values. New technologies using Multi Spectral Reflectance (MSR) or radiospectrometry are being
successfully tested and calibrated in sugar cane. The use of such technology would give quicker leaf
areas estimations.
Threshold for sugar cane and testing of herbicides
The variability within the weed infestations and cane measurements or leaf area estimates observed in
this study may restrict the use of threshold infestation levels in sugar cane under the Mauritian
conditions. However, with a reliable estimation of leaf areas with the new or forthcoming
technologies, prediction of yield losses near the end of the critical periods may assist in the necessity
of a second or ‘spot’ application.
The q values of the different weed species will certainly be useful in the choice of the herbicide
treatments. DSS using the relative competitiveness (or any other index) together with information on
the level of infestation of each species (e.g. frequency abundance method) will certainly enable more
precise selection of herbicide treatments and their rates for cost-effective management of weeds.
The current methods for evaluating herbicides for sugar cane do not provide information on the
interaction between weed infestation level or size of weeds and rates of treatments. The efficacy of
lower rates on weaker weed infestation levels or smaller weeds or less competitive ones would permit
further savings of herbicides.

192
Allelopathic potentials of more weeds
The screening of more allelopathic compounds from the weeds occurring in sugar cane fields will not
only enable a better understanding of the mechanisms of weed competition, but could be used to
identify some potential bio-herbicides, for use in other crops.
Future work would be necessary to identify, using dose-response curves with known amounts of
the chemicals, the minimum dose of the allelochemicals (e.g. cinnamic acids) required to cause
adverse effects on sugar cane. The release of the various chemicals with time and the amounts
released will also enable a more complete understanding of the mechanism of weed competition in
sugar cane.
193
REFERENCES
ABDOLLAHIAN M & FROUD-WILLIAMS RJ (2005) Above- and below-ground competition between
Chenopodium album and sugar beet. Iranian Journal of Weed Science 1, 5-18.
AHN JK & CHUNG IM (2000) Allelopathic potential of rice hulls on germination and seedling growth
of barnyardgrass. Agronomy Journal 92, 1162-1167.
AIUPOVA AT, MOLCHANOV LV, KADRYOV CS, ALIEV NA, GIASOV K, LOI NP, TSOI Z & UMAROV AA.
(1985) Benzoxazolinone, 2,4-dihydroxy-1,4-bezoxazin-3-one, and its glucoside from Acanthus
mollis seed inhibit velvetleaf germination and growth. Journal of Natural Products 48, 59-63.
AKEY WC, JURRIK TW & DEKKER J (1990) Competition for light between a velvetleaf (Abutilon
theophrasti) and soybean (Glycine max). Weed Research 30, 403-411.
ALEXANDER AG (1973) Sugar cane physiology: a comprehensive study of the Saccharum source-to-
sink system. Elsevier, Amsterdam.
ASPINALL D (1960) An analysis of competition between barley and white persicaria. II. Factors
determining the course of competition. Annals of applied Biology 48, 637-654.
ASSEMAT L, MORISHIMA H & OKA HI (1981) Neighbor effect between rice (Oryza sativa L.) and
barnyardgrass (Echinochloa crus-galli Beauv.) strains. Some experiments on the mechanisms of
interaction between plants. Acta oecologia (Oecologica Plantarum) 2, 63-78.
AUTREY JC & TONTA JA (2005) From sugar production to biomass utilisation: the reform process to
ensure the viability of the Mauritian sugar cane industry. International Sugar Journal
107(1283), 646-652.
BARNES JP & PUTNAM AR (1987) Role of benzoxazinones in allelopathy by rye (Secale cereale L.).
Journal of Chemical Ecology 13, 889-905.
BELZ RG & HURLE K (2004) A novel laboratory screening bioassay for crop seedling allelopathy.
Journal of Chemical Ecology 30(1), 175-198.
BELZ RG (2004) Evaluation of allelopathic traits in Triticum L. spp. and Secale cereale L. Dissertation
(PhD), University of Hohenheim (360), Department of Weed Science, Germany.
194
CHOU CH (1999) Role of allelopathy in plant biodiversity and sustainable agriculture. Crit. Rev. Plant
Science 18, 609-636.
COLVIN DL (1980) Principle of Weed Management, Agronomy Department, Cooperative Extension
Service, Institute of Food and Agricultural Sciences, University of Florida, Gainesville, 32611.
http://www.hammock.ifas.ufl.edu.
COUSENS R (1985) An empirical model relating crop yield to weed and crop density and a statistical
comparison with other models. Journal of Agricultural Science 105, 513-521.
COUSENS R (1987) Theory and reality of weed control thresholds. Plant Protection Quartely 2(1), 13-
20.
COUSENS R (1988) Misinterpretations of results in weed research through inappropriate use of
statistics. Weed Research 28, 281-289.
COUSENS R, BRAIN P, O’DONOVAN JT & O’SULLIVAN A (1987) The use of biologically realistic
equations to describe the effects of weed density and relative time of emergence on crop yield.
Weed Science 35, 720-5.
CUDNEY DW, JORDAN LS & HALL AE (1991) Effect of wild oat (Avena fatua) infestations on light
interception and growth rate of wheat (Triticum aestivum). Weed Science 39, 175-179.
CURVEEXPERT 1.3 (1995-2001) Daniel Hyams, 204 Winterset Drive. Starkville, MS 39759, USA.
DE SORNAY (1926) Manuel de la canne à sucre à l'usage des chargés des cours et des élèves des
grandes écoles coloniales. Port Louis: General Printing & Stationery Cy Ltd.
DE WIT CT (1965) On Competition. Agricultural Research reports 66 (8), Pudoc, Wageningen,
82 pp.
DIAZ JC, HERNANDEZ F, FERNANDEZ C, ZUAZNABAR R & DIAZ JJ (2004) Herbicide efficacy and
selectivity of new trifloxysulfuron + ametryn formulation and tank mixture in sugar cane. In:
International Weed Science Society. Abstract book – 4th International Weed Science Congress,
Durban, Rep. of South Africa, 20-24 June 2004. (Abstract only).
FERNANDEZ C, LELONG B, VILA B, MEVY JP, ROBLES C, GREFF S, DUPOUYET S & BOUSQUET-MELOU A.
(2006) Potential allelopathic effect of Pinus halepensis in the secondary succession: an
experimental approach. Chemoecology 16, 97-105.
195
FIRBANK LG & WATKINSON AR (1985) On the analysis of competition within two-species mixtures of
plants. Journal of Applied Ecology 22, 503-517.
FRIEBE A, VILICH V, HENNING L, KLUGE M & SICKER D (1998) Detoxication of benzoxalinone
allelochemicals from wheat by Gaeumonnonmyces graminis var. tritici, G. graminis, G.
graminis var. aveneae and Fusarium culmorum. Applied Environmental Microbiology 64: 2386-
2391.
FROUD-WILLIAMS , RJ (2002) Weed Competition In Weed Management Handbook, edited by R.E.L.
Naylor. Published for British Crop Protection Council by Blackwell Science.
FUJII Y (1992) The potential for biological control of paddy and aquatic weeds with allelopathy:
Allelopathic effect of some rice varieties. Proceedings of the International Symposium on
Biological Control and Integrated Management of Paddy and Aquatic Weeds, Tsukuba, Japan,
pp. 305-320.
FUJII Y, SHIBUYA T, NAKATANI K, ITANI T, HIRADATE S & PARVEZ MM (2004) Assessment method for
allelopathic effect from leaf litter leachates. Weed Biology and Management 4, 19-23.
GAMBOA W & VANDERMEER J (1988) Root and shoot competition in Phaseolus vulgaris and Cyperus
rotundus in Nicaragua, Tropical Ecology 84, 586-591.
GENSTAT (2005) GensStat Release 8.1 Copyright 2005, Lawes Agricultural Trust (Rothamsted
Experimental Station). VSN International, Oxford, UK.
GIBSON KD, FOIN TC & HILL JE (1999) The relative importance of root and shoot competition
between water-seeded rice and Echinochloa phyllopogon. Weed Research 39, 181-190.
GRIME JP (1979) Plant Strategies and Vegetation Processes. Wiley, Chichester, 222 pp.
HAKANSSON S (1983) Competition and production in short-lived crop-weed stands. Svergies
Landbrucks University Report No. 127.
HALL RM, SWANTON CJ & ANDERSON GW (1992) The critical period of weed control in grain corn.
Weed Science 40, 441-447.
HAUGLAND E (1993) Competition between an established grass sward and seedlings of Rumex
longifolius DC. and Taraxacum officinale (Web.) Marss. Norwegian-Journal-of-Agricultural-
Sciences 7, 409-420.
196
HOLM SD, PLUCKNETT D, PANCHO JV & HERBERGER J (1977) The Word’s Worst Weeds – Distribution
and Biology. The University Press of Hawaii, 609 pp.
HOWARD S, HUDETZ M & A LLARD JL (2001) Trifloxysulfuron-sodium: a new post-emergence herbicide
for use in cotton and sugar cane 2001 Brighton crop protection conference: Weeds. Proceedings
of an international conference. Brighton, UK. 12–15 November 2001, Volume 1, 29–34.
HUBBARD CE & VAUGHAN RE (1940) The grasses of Mauritius and Rodriguez. Waterlow & Sons
Limited, London and Dunstable. 18 pp.
INDERJIT & WESTON LA (2000) Are laboratory bioassays for allelopathy suitable for prediction of field
responses. Journal of Chemical Ecology 26(9), 2111-2118.
INMAN-BAMBER NG (1994) Temperature and seasonal effects on canopy development and light
interception of sugar cane. Field Crops Research 36, 41-51.
IRONS SM & BURNSIDE OC (1982) Competitive and allelopathic effects of sunflower (Helianthus
annus). Weed Science 30, 372-377.
ISHMINE Y, NAKAMA M & M ATSUMOTO S (1987) Allelopathic potential of Paspalum urvillei STEUD,
Bidens pilosa L. var. radiata SCHEFF., and Stellaria aquatica SCOP., dominant weeds in sugar
cane fields in the Ryukyu Islands. Weed Research, Japan 32(4), 274-281.
ISMAEL FM, SEERUTTUN S & BARBE C (2007) Improving cane productivity with dual row planting in
Mauritius. Proc. int. Soc. Sug. Cane Technol. 26, 220-228.
JOLLY L & WOODS J (2004). A new dawn for mandated fuel-ethanol programmes: Separating fact from
fiction. International Sugar Journal, 1066 (1263) 118-125.
KNEZEVIC SZ, EVANS SP & MAINZ M (2003) Row spacing influences the critical timing for weed
removal in soybean (Glycine max). Weed Technology 17, 666-673.
KNEZEVIC SZ, EVANS SP, BLANKENSHIP EE, VAN ACKER RC & LINDQUIST JL (2002) Critical period for
weed control: the concept and data analysis. Weed Science 50, 773-786.
KOENIG J (1988) Mauritius and Sugar edited by C. Ricaud. Printed by Précigraph Limited, Les Pailles,
Mauritius.
KROPFF MJ & LOTZ LAP (1992a) Systems approaches to quantify crop-weed interactions and their
application in weed management. Agricultural Systems 40, 265-282.
197
KROPFF MJ & LOTZ LAP (1992b) Optimization of weed management systems: The role of
ecophysiological models of interplant competition. Weed Technology 6, 462-470.
KROPFF MJ & SPITTERS JT (1991) A simple model of crop loss by weed competition from early
observations on relative leaf area of the weeds. Weed Research 31, 97-105.
KROPFF MJ & VAN LAAR HH (1993) Modelling crop-weed interactions. CAB International,
Wallingford, Oxon OX10 8DE, UK.
KROPFF MJ & WALTER H (2000) EWRS and the challenges for weed research at the start of a new
millennium. Weed Research 40(1), 7-10.
KROPFF MJ (1988) Modelling the effects of weeds on crop production. Weed Research 28, 465-71.
LABRADA R & PARKER C (1994) Weed control in the context of integrated pest management. In
Labrada , R., Caseley, J.C. and Parker, C., eds. Weed Management for Developing Countries. Pp
3-26. FAO, Rome.
LAMUSSE MJM (1965) The effects of weed competition on sugar content and yield of sugar cane.
Tropical Agriculture, Trin., 42, 1 (January 1965).
LAWLOR DW (1995) Photosynthesis, productivity and environment. Journal of Experimental Botany
46 (special issue), 1449-1461.
LINDQUIST JL & MORTENSEN DA (1999) Ecophysiological characteristics of four maize hybrids and
Abutilon theophrasti. Weed Research 39, 271-285.
LINDQUIST JL (2001) Performance of INTERCOM for predicting Zea Mays-Abutilon theophrasti
interference across north central United States. Weed Science 49, 195-201.
LORENZI HJ, GANDINI MO & GAZON AL (1988) Trash blankets: the potential to control weeds and the
effect on ratoon cane development. Proceedings International Society of Sugar Cane
Technologists 20 (2): 571-576.
LOTZ LAP, CHRISTENSEN S, CLOUTIER D, FERNANDEZ-QUINTANILLA C, LEGERE A, LEMIEUX C, LUTMAN
PJW, PARDO-IGLESIS A, SALONEN J, SATTIN M, STIGLIANI M & TEI F (1996). Prediction of the
competitive effects of weeds on crop yields based on the relative leaf area of weeds. Weed
Research 36 (1), 93-101.
198
MARION D & MARNOTTE P (1991) Nuisibilité de l’enherbement sur une culture de canne à sucre. Coll.
AFCAS. Montpellier. 9-14 juin 1991.
MARTIN LD & SMITH AE (1994) Allelopathic potential of some warm-season grasses. Crop Protection
13(5): 388-392.
MASSINGA RA, CURRIE RS & TROOIEN TP (2003) Water use and light interception under Palmer
amaranth (Amaranth palmeri) and corn competition. Weed Science 51, 523-531.
MAURITIUS CHAMBER OF AGRICULTURE (2006) Annual report 2005-2006. Port-Louis: Mauritius
Chamber of Agriculture. 95 p.
MC INTYRE G (1991) Weeds of sugar cane in Mauritius: their description and control. Réduit:
Mauritius Sugar Industry Research Institute. 151 pp.
MC INTYRE G (1998) Cyperus rotundus – Allelopathy, competition and reactions to herbicides. PhD
Thesis, University of London.
MC INTYRE G & BARBE C (1995) Oxyfluorfen, acetochlor and metolachlor; new long residual
herbicides for sugar cane. Proceeding International Society Sugar Cane Technologists 21, 1-10.
MC INTYRE G, SEERUTTUN S & BARBE C (1996) Trash management in Mauritian sugar cane
plantations. Proceedings International Society of Cane Technologists 22, 213-216. (Abstract
also published in Sugar Cane 1995(6), 32 and in International Sugar Journal (suppl.), 97
(1162).
McGIFFEN ME JR, MASIUNAS JB & HESKETH JD (1992) Competition for light between tomatoes and
nightshades (Solanum nigrum or S. ptycanthum). Weed Science 40, 220-226.
MINISTRY OF AGRICULTURE, FOOD TECHNOLOGY & NATURAL RESOURCES (2001) The sugar sector
package scheme. Port-Louis: Ministry of Agriculture, Food Technology and Natural resources.
MINISTRY OF AGRO-INDUSTRY & FISHERIES (2006) Multi-Annual Adaptation Strategy Action plan 2006-
2015: Safeguarding the future through consensus. Port-Louis: Ministry of Agro-Industry and
Fisheries. 96 p.
MSIRI (1998) Research and Development Programme 1998-2003. Mauritius Sugar Industry Research
Institute, Réduit.
199
MSIRI (2002) Annual Report (2001) Mauritius Sugar Industry Research Institute, Réduit, Mauritius.
Rep. Mauritius Sugar Industry Research Institute 40.
MSIRI (2003) Annual Report (2002) Mauritius Sugar Industry Research Institute, Réduit, Mauritius.
Rep. Mauritius Sugar Industry Research Institute 41.
MSIRI (2004) Annual Report (2003) Mauritius Sugar Industry Research Institute, Réduit, Mauritius.
Rep. Mauritius Sugar Industry Research Institute 42.
MSIRI (2005) Annual Report (2004) Mauritius Sugar Industry Research Institute, Réduit, Mauritius.
Rep. Mauritius Sugar Industry Research Institute 43.
MSIRI (2006) Annual Report (2005) Mauritius Sugar Industry Research Institute, Réduit, Mauritius.
Rep. Mauritius Sugar Industry Research Institute 44.
MSIRI/ACIAR (2001) Offsite movement of agrochemicals in tropical sugar cane production: Extension
Workshop, Bundaberg, Australia, 8-9 May 2001. Réduit: Mauritius Sugar Industry Research
Institute (MSIRI); Bundaberg: Queensland Department of Natural Resources and Mines;
Canberra: Australian Centre for International Agricultural Research (ACIAR). 111 p.: incl. a
CD-ROM.
MUNGER PH, CHANLDER JM, COTHREN JT & HONS FM (1987) Soybean (Glycine max)-velvetleaf
(Abutilon theophrasti) interspecific competition. Weed Science 35, 647-653.
MUNIER-JOLAIN NM, CHAUVEL B & GASQUEZ J (2002) Long-term modeling of weed control strategies:
analysis of threshold-based options for weed species with contrasted competitive abilities. Weed
Research 42, 107-122.
NAYAMUTH AR, CHEEROO-NAYAMUTH BF & SOOPRAMANIEN GC (1999) Agro-physiological
characteristics underlying the sucrose accumulation pattern of early and late varieties.
Proceedings South African Sugar Technologists Association 73, 157-163.
NAYLOR REL (2002) Weed Management Handbook (9th edition) Published for the British Crop
Protection Council by Blackwell Science.
NIEMEYER HM (1988) Hydroxamic acids (4-hydroxy-1,4-benzoxazin-3-ones), defense chemicals in
Gramineae. Phytochemistry 27, 3349-3358.
PADYA BM (1984) The Climate of Mauritius. Meteorological Office, Mauritius.

200
PARISH, DH & FEILLAFE, SM (1965) Notes on the 1:100 000 Soil Map of Mauritius. Mauritius Sugar
Industry Research Institute, Occasional Paper 22. Réduit, Mauritius: MSIRI.
PATURAU JM (1989) By-products of the cane sugar industry – an introduction to their industrial
utilization. Sugar Series, 3. Elsevier Scientific Publishing Company.
PERERA KK, AYRES PG & GUANASENA HPM (1992) Root growth and the relative importance of root
and shoot competition in interaction between rice (Oryza sativa) and Echinochloa crus-galli.
Weed Research 32, 67-76.
PHILBROOK BD, KREMER M, MUELLER KH & DEEGE R (1999). BAY MKH 3586 – a new herbicide for
broad spectrum control in corn (maize) and sugar cane. 1999 Brighton crop protection
conference: Weeds. Proceedings of an international conference. Brighton, UK. 15-18
November 1999, Volume 1, 29-34.
POPE DF, THOMPSON AC & COLE AW (1984) Biological activity of weed root exudates. Proceedings
Southern Weed Science Society, 37th annual meeting (abstract only).
PUTMAN AR & DUKE WB (1974) Biological suppression of weeds: Evidence for allelopathy in
accessions of cucumber. Science 185, 370-372.
PUTMAN AR (1988) Allelopathy: problems and opportunities in weed management. In: Altieri, M.A.
and Liebman, M. (eds) Weed Management in Agroecosystems: Ecological Approaches. CRC
press, Boca Raton, Florida, pp. 77-88.
QUAYYUM HA, MALLIK AU, LEACH DM & GOTTARDO C (2000) Growth inhibitory effects of nutgrass
(Cyperus rotundus) on rice (Oryza sativa) seedlings. Journal of Chemical Ecology. 26(9), 2221-
2231.
RAY H & HASTINGS PJ (1992) Ariation within Flax (Linum usitatissimum) and barley (Hordeum
vulgare) in response to allelopathic chemicals. Theorical and Applied Genetics 84(3), 460-465.
RICE EL (1984) Allelopathy, 2nd edn. Academic Press, New York.
RIEMENS MM, GROENEVELD RMW, LOTZ LAP & KROPFF MJ (2007) Effects of three management
strategies on the seedbank, emergence and the need for hand weeding in an organic arable
cropping system. Weed Research 47, 442-451.
ROACH BT and DANIELS J (1987) A review of the origin and improvement of sugar cane. In Copersucar
International Sugarcane Breeding workshop: 1-32.
201
ROCHECOUSTE E (1967) Weed control in sugar cane. Mauritius Sugar Industry Research Institute,
Réduit, Mauritius: MSIRI. 117 pp.
SATORRE EH & SNAYDON RW (1992) A comparison of root and shoot competition between spring
cereals and Avena fatua L. Weed Research 32, 45-55.
SCHREIBER MM (1967) A technique for studying weed competition in forage legume establishment.
Weeds 15, 1-4.
SEAVERS GP & WRIGHT KJ (1999) Crop canopy development and structure influence weed
suppression. Weed Research 44, 319-324.
SEERUTTUN S, BARBE C & GAUNGOO A (2007) New herbicide tank-mix, Krismat + Dinamic: a cost-
effective broad-spectrum pre- and post-emergence treatment for managing weeds in sugarcane.
Proceedings International Society-. Sugar Cane Technologists. 26, 229-237.
SEERUTTUN S, BARBE C & MC INTYRE G (1999) "Le paillis complet dans la canne à sucre en zone à forte
pluviosité". Revue Agricole et Sucrière de l’île Maurice 77 (2&3), 42-49.
SEERUTTUN S, Mc INTYRE G & BARBE C (1992) Agronomic and economic significance of trash
blanketing in the sub-humid areas of Mauritius. Revue Agricole et Sucrière de l’Ile Maurice 71
(2&3), 324-331.
SEERUTTUN S & LUTMAN P (2004) Critical periods of weed control in sugar cane in Mauritius. In:
International Weed Science Society. Abstract book – 4th International Weed Science Congress,
Durban, Rep. of South Africa, 20-24 June 2004. (Abstract only).
SKERMAN PJ & RIVEROS F (1990) Tropical grasses. Food and Agriculture Organization (FAO) of the
United Nations. Rome.
SMITH GL, FRECKLETON RP, FIRBANK LG & WATKINSON AR (1999) The population dynamics of
Anisantha sterilis in winter wheat: comparative demography and the role of management.
Journal of Applied Ecology 36 (4), 455-471.
SPITTERS CJT & AERTS R (1983) Simulation of competition for light and water in crop weed
associations. Aspects of Applied Biology. 4, 467-484.
SPITTERS CJT (1983) An alternative approach to the analysis of mixed competition effects. 1.
Estimation of competition effects. Netherlands Journal of Agricultural Sciences 31, 1-11.
202
STASM (1990). Manual of sugar cane agronomy. Réduit (Mauritius) : Société de Technologie Agricole
et Sucrière de Maurice (STASM). 106 pp.
STEEL RGD, TORRIE JH & DICKEY DA (1997) Principles and Procedures of Statistics: A Biometrical
Approach. McGraw-Hill, 3rd edn., 666 p.
SUWANARAK K (1982) Weed competition in sugarcane. Thai Journal of Weed Science 1(3), 41-53.
SUWANARAK K (1990) Weed management in sugar cane in Thailand. Symposium on weed
management held in Bogor, Indonesia, 7-9 June 1989. Biotrop-special publication. 1990. 38,
199-214.
SUZUKI T, SHIRAIVA T & HORIE T (2002) Competitiveness of four rice cultivars against barnyardgrass,
Echinochloa oryzicola Vasing, with reference to root and shoot competition. Plant Production
Science 5, 77-82.
SWANTON CJ & WEISE SF (1991) Integrated weed management: rationale and approach. Weed
Technology 5, 657-663.
TANG CS & YOUNG CC (1982) Collection and identification of allelopathic compounds from the
undisturbed root system of Bigalta Limpograss (Hemarthria altissima). Plant Physiology 69,
155-160.
THOMAS V & K WONG A (2001) Ethanol as lead replacement: phasing out leaded gasoline in Africa.
Energy Policy 29, 1133-1143.
TUOR FA & FROUD-WILLIAMS RJ (2002) Influence of nitrogen on competition between purple
nutsedge, maize and soybean. International Journal of Pest Management 48(1), 73-79.
US EPA (1996) United State Environment Protection Agency Method 8280. Office of water. USEPA,
Washington, DC.
VAN ACKER RC, SWANTON CJ & WEISE S (1993) The critical period of weed control in soybean
(Glycine max). Weed Science 41, 194-200.
VAN DER ZWEEP, W. & HANCE, R. J. (2000) A brief history of the European Weed Research Society.
Weed Research: 40, 3-6.
VAN DILLEWIJN C (1952) Botany of Sugar cane. Waltham, MA, USA.
203
VAN HEEMST HDJ (1985) The influence of weed competition on crop yield. Agricultural Systems 18,
81-93.
VASILAKOGLOU I, DHIMA K & ELEFTHEROHORINOS I (2005) Allelopathic potential of Bermudagrass and
Johnsongrass and their interference with cotton and corn. Agronomy Journal 97(1), 303-313.
V IATOR RP, JOHNSON RM, GRIMM CC & RICHARD EPJR (2006) Allelopathic, autotoxic, and Hormetic
effects of postharvest sugarcane residue. Agronomy Journal 98(6), 1526-1531.
WEAVER SE, KROPFF MJ & GROENEVELD RMW (1992) Use of ecophysiological models for crop-weed
interference: the critical period of weed interference. Weed Science 40(2), 302-307.
WILLIAMSON GB (1990) Allelopathy, Koch’s postulates, and the riddle. In: Grace, J.B. and Tilman, D.
(eds) Perspectives in plant competition. Academic Press, New York, pp. 143-162.
WILSON JB (1988) Shoot competition and root competition. Journal of Applied Ecology 25, 279-296.
WITHARAMA WRG, NAYLOR REL & WHYTOCK GP (1997) The seed bank and weed seedling
emergence in sugarcane in Sri Lanka. 1997 Brighton crop protection conference: weeds.
Proceedings of an international conference, Brighton, UK, 17-20 November 1997; 2, 663-664.
WITHARAMA WRG, NAYLOR REL & WHYTOCK GP (2007). Influence of planting date and microsite on
weed dynamics in sugarcane in Sri Lanka. Weed Science 55(1), 23-29.
WOLF RB, SPENCER GF & PLATTNER RD (1985) Benzoxalinone, 2,4-dihydroxy-1,4-bezoxazin-3-one,
and its glucoside from Acanthus mollis seed inhibit velvetleaf germination and growth. Journal
of Natural Products 48, 59-63.
ZIMDAHL RL (1980) Weed-Crop Competition – a Review. International Plant Protection Center,
Oregon State University, Corvallis.
ZIMDAHL RL (1993) Fundamentals of weed science. Academic Press, Inc., San Diego, California: 128.
ZUNIGA GE, ARGANDONA VH, NIEMEYER HM & CORCUERA LJ (1983) Hydroxamic acid content in wild
and cultivated Gramineae. Phytochemistry 22, 2665-2668.
204
Weed management in sugar cane: critical periods of weed competition and
mechanisms of interference from Paspalum paniculatum and P. urvillei
by
Sumantlall Seeruttun
Promoter: Prof C F Reinhardt
Co-promoter: Dr P J W Lutman
Department: Plant Production and Soil Science
Degree: PhD Agronomy
SUMMARY
The aim of this project was to provide sound scientific underpinning for the development of new weed
management strategies in sugar cane by exploring competition from the major weeds, and explaining
the different mechanisms of weed interference from Paspalum paniculatum and P. urvillei.
Critical periods of weed control (CPWC) were studied in six field trials. In ratoon cane, CPWC
with natural weed infestations started between 228 and 916 GDD, and ended between 648 and 1311
GDD, depending on the site and cane variety. These results represented a maximum CPWC of 12 to
28 weeks after harvest (WAH). In plant cane, the CPWC started earlier (6 WAP) and was longer than
those in ratoon cane.
Relative competitiveness ‘q’ values of eight common weed species showed that sugar cane was
a stronger competitor than most of the weeds tested. The adverse effect of weed competition in sugar
cane is not experienced before several weeks following weed emergence. The competitiveness of both
P. paniculatum and P. urvillei was found to remain unchanged with time within the first nine weeks
after transplanting (WAT). A reduction in their competitiveness was recorded from 13 WAT, mainly
explained by the distribution of the leaves within the canopy.
Trials, studying two timings of weed emergence, revealed that transplanting weeds later caused
no significant change in cane yield response. However, measurements made after the second
transplanting showed some significant reduction in the total cane dewlap height. Due to its long
205
growing period sugar cane has the ability to recover and compensate for some impediments caused by
weeds.
Paspalum paniculatum was often found to be more competitive than P. urvillei, although the
latter produced more leaf area and grew taller to intercept more light within the canopy. This indicated
that other mechanisms of weed interference might be involved and that competition for light was more
important during the earlier (tillering) growth stages. Root competition was shown to be as important
as shoot competition. Root competition effects were observed several weeks after imposing
competition, when cane stalks reached more than 35 cm in dewlap height, suggesting that root
competition was more important than competition for light after the post-tillering phase. The shoot
versus root competition trials were not able to completely explain the higher relative competitiveness
of P. paniculatum compared to P. urvillei. Application of root exudates from the two grasses to sugar
cane confirmed an allelopathic effect on the root biomass of sugar cane. One chemical identified for
the allelopathic effects was 2-propenoic acid, 3-(4-methoxyphenyl).
The main implications of the above findings for the Mauritian sugar industry would be to delay
the first treatment until onset of the first flush of weeds. A new tank-mix consisting of
trifloxysulfuron+ametryn and amicarbazone has been studied and was found to meet this objective.
This strategy will enable a savings of at least one herbicide treatment per season.
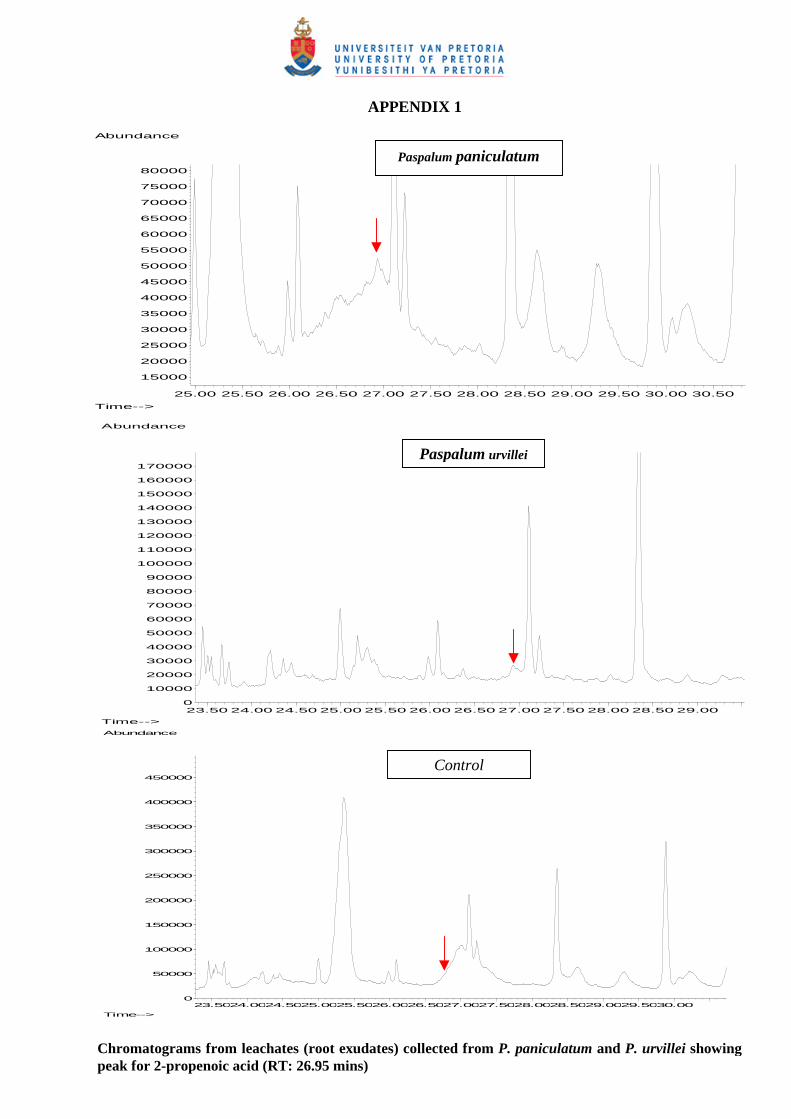
206
APPENDIX 1
25.00 25.50 26.00 26.50 27.00 27.50 28.00 28.50 29.00 29.50 30.00 30.50
15000
20000
25000
30000
35000
40000
45000
50000
55000
60000
65000
70000
75000
80000
Time-->
Abundance
TIC: LEACH6.DPaspalum paniculatum
23.50 24.00 24.50 25.00 25.50 26.00 26.50 27.00 27.50 28.00 28.50 29.000
10000
20000
30000
40000
50000
60000
70000
80000
90000
100000
110000
120000
130000
140000
150000
160000
170000
Time-->
Abundance
TIC: LEACH2.DPaspalum urvillei
23.5024.0024.5025.0025.5026.0026.5027.0027.5028.0028.5029.0029.5030.000
50000
100000
150000
200000
250000
300000
350000
400000
450000
Time-->
Abundance
TIC: LEACH8.D
Control
Chromatograms from leachates (root exudates) collected from P. paniculatum and P. urvillei showing peak for 2-propenoic acid (RT: 26.95 mins)