Embed Size (px)
Citation preview

Media Contact Investor ContactAlice Ferreira, 203-578-2610 Terry Mangan, [email protected] [email protected]
WEBSTER REPORTSFIRST QUARTER 2020 EARNINGS OF $0.39 PER DILUTED SHARE
WATERBURY, Conn., April 21, 2020 - Webster Financial Corporation (NYSE: WBS), the holding company for Webster Bank, N.A. and its HSA Bank division, today announced earnings applicable to common shareholders of $36.0 million, or $0.39 per diluted share, for the quarter ended March 31, 2020, compared to $97.5 million, or $1.06 per diluted share, for the quarter ended March 31, 2019. Results in the quarter reflect a provision for credit losses of $76.0 million under the Current Expected Credit Loss (CECL) accounting standard effective January 1, 2020 compared to a provision for credit losses of $8.6 million in prior year.
“During these uncertain, challenging and unprecedented times, Webster bankers have once again stepped up to take care of our customers, our communities and, importantly, each other. I am so proud of every one of our 3,400 bankers,” said John R. Ciulla, president and chief executive officer. “We continue to take swift actions to keep our employees safe while effectively providing our customers with the banking services and financial assistance they need to navigate through the economic storm brought on by this pandemic.”
Highlights for the first quarter of 2020:
• Results include the adoption of CECL and the impact of COVID-19 resulting in a provision of $76.0 million; allowance coverage of 1.60 percent.
• Revenue of $304.2 million.• Loan growth of $2.1 billion, or 11.0 percent from a year ago, led by commercial and
commercial real estate, which increased 15.6 percent.• Deposit growth of $1.8 billion, or 7.7 percent from a year ago, with growth of $527
million, or 8.5 percent, in HSA deposits.• Net interest margin of 3.23 percent.• Efficiency ratio (non-GAAP) of 58.0 percent.
“Webster’s strong capital and liquidity positions enable us to support our customers and communities during this trying time,” said Glenn MacInnes, executive vice president and chief financial officer. “Our Common Equity Tier 1 capital ratio of 11 percent exceeds the regulatory well-capitalized level by $1 billion, and our loan-to-deposit ratio of 85 percent reflects our funding strength.”
Webster has responded quickly with programs to support our Employees, Customers and the Communities where we live and work. These actions included:
Support for our Employees:
• 75% of our bankers are currently working remotely • Special pay considerations and additional PTO for essential front line employees• No furloughs; bankers are at 100% pay • Zero-interest loans up to $5,000 are available to assist employees and their families facing
unforeseen challenges due to COVID-19
Support for Individuals and Businesses:
• Instituted a 90-day foreclosure moratorium on residential loans• Increased deposit limits; waiving penalties for early CD withdrawals• Waiving or reducing certain fees• Not reporting payment deferrals to credit bureaus• Participating in the SBA Paycheck Protection Program with the initial round resulting in
approximately $650 million in SBA approved loans• Payment modifications (needs based / COVID related impact)
Support for the Communities we serve
• More than $375,000 in donations for urgent basic needs including:◦ Feeding America◦ American Red Cross◦ United Way (CT, RI, MA, NY, WI)
• Additional re-targeting of existing sponsorships and grants to nonprofits to support COVID-19 related activities including:
◦ Masks for Heroes◦ Junior Achievement◦ Governor’s Prevention Partnership

Line of Business performance compared to the first quarter of 2019
Commercial Banking
Webster’s Commercial Banking segment serves middle market, commercial real estate, asset-based lending, equipment finance, private banking, and treasury and payment solutions clients. As of March 31, 2020, Commercial Banking had $12.3 billion in loans and leases and $5.0 billion in deposit balances.
Commercial Banking Operating Results:
PercentThree months ended March 31, Favorable/
(In thousands) 2020 2019 (Unfavorable)Net interest income $99,316 $98,342 1.0 %Non-interest income 13,239 14,011 (5.5)Operating revenue 112,555 112,353 0.2Non-interest expense 46,544 44,618 (4.3)Pre-tax, pre-provision net revenue $66,011 $67,735 (2.5)
PercentAt March 31, Increase/
(In millions) 2020 2019 (Decrease)Loans and leases $12,282 $10,631 15.5 %Deposits 5,041 4,191 20.3
Note: In 1Q20, segment net interest income was updated to reflect changes in the funds transfer pricing methodology related to allocated capital. Prior periods were restated to reflect the change.
Pre-tax, pre-provision net revenue decreased $1.7 million to $66.0 million in the quarter as compared to prior year. Net interest income increased $1.0 million to $99.3 million, primarily due to loan growth. Non-interest income decreased $0.8 million to $13.2 million, primarily due to lower one-time fees in the quarter. Non-interest expense increased $1.9 million to $46.5 million, primarily due to investments in people, product enhancements, and infrastructure.

HSA Bank
Webster’s HSA Bank division offers a comprehensive consumer-directed healthcare solution that includes health savings accounts, health reimbursement arrangements, flexible spending accounts and commuter benefits. Health savings accounts are distributed nationwide directly to employers and individual consumers, as well as through national and regional insurance carriers, benefit consultants and financial advisors. As of March 31, 2020, HSA Bank had $8.6 billion in total footings comprising $6.7 billion in deposit balances and $1.9 billion in assets under administration through linked investment accounts.
HSA Bank Operating Results:
PercentThree months ended March 31, Favorable/
(In thousands) 2020 2019 (Unfavorable)Net interest income $42,673 $43,098 (1.0)%Non-interest income 26,383 25,577 3.2Operating revenue 69,056 68,675 0.6Non-interest expense 37,078 33,522 (10.6)Pre-tax, net revenue $31,978 $35,153 (9.0)
PercentAt March 31, Increase/
(Dollars in millions) 2020 2019 (Decrease)Number of accounts (thousands) 3,119 2,933 6.3 %
Deposits $6,736 $6,209 8.5Linked investment accounts * 1,855 1,703 8.9Total footings $8,591 $7,912 8.6
* Linked investment accounts are held off balance sheetNote: In 1Q20, segment net Interest income was updated to reflect changes in the funds transfer pricing methodology related to allocated capital. Prior periods were restated to reflect the change.
Pre-tax net revenue decreased $3.2 million to $32.0 million in the quarter as compared to prior year. Net interest income decreased $0.4 million to $42.7 million, due to 8.5 percent growth in deposits and a decline in deposit spreads. Non-interest income increased $0.8 million to $26.4 million, primarily due to 6.3 percent growth in accounts over the past year. Non-interest expense increased $3.6 million to $37.1 million, primarily due to account growth and expanded distribution.

Community Banking
Community Banking serves consumer and business banking customers primarily throughout southern New England and into Westchester County, New York. Community Banking is comprised of the Personal Banking and Business Banking operating segments, as well as a distribution network consisting of 157 banking centers and 308 ATMs, a customer care center, and a full range of web and mobile-based banking services. As of March 31, 2020, Community Banking had $8.6 billion in loans and $12.6 billion in deposit balances.
Community Banking Operating Results:
PercentThree months ended March 31, Favorable/
(In thousands) 2020 2019 (Unfavorable)Net interest income $99,470 $106,290 (6.4)%Non-interest income 27,620 25,382 8.8Operating revenue 127,090 131,672 (3.5)Non-interest expense 98,967 95,075 (4.1)Pre-tax, pre-provision net revenue $28,123 $36,597 (23.2)
PercentAt March 31, Increase/
(In millions) 2020 2019 (Decrease)Loans $8,610 $8,184 5.2 %Deposits 12,640 12,271 3.0
Note: In 1Q20, segment net Interest income was updated to reflect changes in the funds transfer pricing methodology related to allocated capital. Prior periods were restated to reflect the change.
Pre-tax, pre-provision net revenue decreased $8.5 million to $28.1 million in the quarter as compared to prior year. Net interest income decreased $6.8 million to $99.5 million, due to declining interest rates on loans coupled with decreasing credit value of deposits; partially offset by balance growth in the loan and deposit portfolios. Non-interest income increased $2.2 million driven by growth in fees from mortgage banking, investment services, and interest rate hedging activities. This growth was partially offset by reductions in deposit-related service charges and the impact of gains from asset sales that occurred in the prior year. Non-interest expense increased $3.9 million to $99.0 million resulting from higher employee-related expenses, continued investments in technology, and other corporate overhead; offset by lower occupancy, legal, and card processing costs.
Consolidated financial performance:
Quarterly net interest income compared to the first quarter of 2019:
• Net interest income was $230.8 million compared to $241.6 million.
• Net interest margin was 3.23 percent compared to 3.74 percent. The yield on interest-earning assets declined by 59 basis points, and the cost of interest-bearing liabilities declined by 10 basis points.
• Average interest-earning assets totaled $28.9 billion and grew by $2.9 billion, or 11.0 percent.
• Average loans totaled $20.3 billion and grew by $1.8 billion, or 9.8 percent.
• Average deposits totaled $24.1 billion and grew by $1.5 billion, or 6.8 percent.
Quarterly provision for credit losses:
• The provision for credit losses, which was calculated under the Current Expected Credit Loss (CECL) accounting standard effective January 1, 2020, was $76.0 million, compared to $6.0 million in the prior quarter and $8.6 million a year ago. The increase compared to the prior periods is primarily due to the adoption of CECL and the impact of COVID-19.
• Net charge-offs were $7.8 million, compared to $6.1 million in the prior quarter and $9.6 million a year ago. The ratio of net charge-offs to average loans on an annualized basis was 0.15 percent, compared to 0.12 percent in the prior quarter and 0.21 percent a year ago.
• The allowance for credit losses on loans and leases represented 1.60 percent of total loans at March 31, 2020, compared to 1.04 percent at December 31, 2019 and 1.12 percent at March 31, 2019. The allowance for credit losses on loans and leases reflects a January 1, 2020 transition adjustment of $57.6 million related to the adoption of the CECL accounting standard and represented 206 percent of nonperforming loans at March 31, 2020 compared to 139 percent at December 31, 2019 and 133 percent at March 31, 2019.
Quarterly non-interest income compared to the first quarter of 2019:
• Total non-interest income was $73.4 million, compared to $68.6 million, an increase of $4.8 million. This reflects an increase of $2.8 million of other income primarily due to client hedging activity offset by losses on miscellaneous investments, an increase of $2.1 million in mortgage banking activities primarily due to a decline in mortgage interest rates driving higher origination volume and $1.1 million in wealth and investment services. These increases were offset by a decrease in loan related fees of $1.3 million primarily due to lower prepayment fees and higher mortgage servicing rights costs.

Quarterly non-interest expense compared to the first quarter of 2019:
• Total non-interest expense was $178.8 million, compared to $175.7 million, an increase of $3.2 million. The increase reflects increases of $4.1 million in compensation and benefits due to annual merit increases and temporary help partially offset by lower variable based compensation and $2.1 million in technology and equipment due to continued infrastructure investment. Offsetting these increases was a decrease of $3.4 million in other expenses primarily due to decreased pension costs, and a reduction in the reserve for unfunded commitments.
Quarterly income taxes compared to the first quarter of 2019:
• Income tax expense was $11.1 million compared to $26.1 million and the effective tax rate was 22.6 percent compared to 20.8 percent.
• The higher effective tax rate in the quarter reflects a net discrete tax benefit recognized during the period a year ago.
Investment securities:
• Total investment securities were $8.5 billion, compared to $8.2 billion at December 31, 2019 and $7.5 billion at March 31, 2019. The carrying value of the available-for-sale portfolio included $3.1 million of net unrealized gains, compared to $24.4 million at December 31, 2019 and $58.6 million of net unrealized losses at March 31, 2019. The carrying value of the held-to-maturity portfolio does not reflect $156.3 million of net unrealized gains, compared to $86.7 million at December 31, 2019 and $46.8 million of net unrealized losses at March 31, 2019.
Loans:
• Total loans were $20.9 billion, compared to $20.0 billion at December 31, 2019 and $18.8 billion at March 31, 2019. Compared to December 31, 2019, commercial loans increased by $685.1 million, commercial real estate loans increased by $173.1 million, and residential mortgages increased by $18.8 million, while consumer loans decreased by $22.5 million.
• Compared to a year ago, commercial real estate loans increased by $1.131 billion, commercial loans increased by $715.0 million, and residential mortgages increased by $359.7 million, while consumer loans decreased by $128.1 million.
• Loan originations for portfolio were $1.195 billion, compared to $1.919 billion in the prior quarter and $1.132 billion a year ago. In addition, $60 million of residential loans were originated for sale in the quarter, compared to $94 million in the prior quarter and $33 million a year ago.
Asset quality:
• Total nonperforming loans were $162.3 million, or 0.78 percent of total loans, compared to $150.9 million, or 0.75 percent of total loans, at December 31, 2019 and $158.9 million, or 0.84 percent of total loans, at March 31, 2019. Total paying nonperforming loans were $61.9 million, compared to $59.0 million at December 31, 2019 and $38.6 million at March 31, 2019.
• Past due loans were $37.0 million, compared to $42.6 million at December 31, 2019 and $50.5 million at March 31, 2019.
Deposits and borrowings:
• Total deposits were $24.5 billion, compared to $23.3 billion at December 31, 2019 and $22.8 billion at March 31, 2019. Core deposits to total deposits were 87.8 percent, compared to 86.7 percent at December 31, 2019 and 85.3 percent at March 31, 2019. The loan to deposit ratio was 85.2 percent, compared to 85.9 percent at December 31, 2019 and 82.7 percent at March 31, 2019.
• Total borrowings were $3.6 billion, compared to $3.5 billion at December 31, 2019 and $2.2 billion at March 31, 2019.
Capital:
• The return on average common shareholders’ equity and the return on average tangible common shareholders’ equity were 4.75 percent and 5.95 percent, respectively, compared to 14.01 percent and 17.70 percent, respectively, in the first quarter of 2019.
• The tangible equity and tangible common equity ratios were 8.14 percent and 7.67 percent, respectively, compared to 8.68 percent and 8.16 percent, respectively, at March 31, 2019. The common equity tier 1 risk-based capital ratio was 10.96 percent, compared to 11.46 percent at March 31, 2019.
• Book value and tangible book value per common share were $32.66 and $26.46, respectively, compared to $30.62 and $24.51, respectively, at March 31, 2019.

***
Webster Financial Corporation is the holding company for Webster Bank, National Association and its HSA Bank division. With $31.7 billion in assets, Webster provides business and consumer banking, mortgage, financial planning, trust, and investment services through 157 banking centers and 308 ATMs. Webster also provides mobile and Internet banking. Webster Bank owns the asset-based lending firm Webster Business Credit Corporation; the equipment finance firm Webster Capital Finance Corporation; and HSA Bank, a division of Webster Bank, which provides health savings account trustee and administrative services. Webster Bank is a member of the FDIC and an equal housing lender. For more information about Webster, including past press releases and the latest annual report, visit the Webster website at www.websterbank.com.
Conference Call
A conference call covering Webster’s first quarter 2020 earnings announcement will be held today, Tuesday, April 21, 2020 at 9:00 a.m. (Eastern) and may be heard through Webster’s Investor Relations website at www.wbst.com, or in listen-only mode by calling 877-407-8289 or 201-689-8341 internationally. The call will be archived on the website and available for future retrieval.
Forward-Looking Statements
This release contains “forward-looking statements” within the meaning of the Private Securities Litigation Reform Act of 1995 (the “Act”). Forward-looking statements can be identified by words such as “believes,” “anticipates,” “expects,” “intends,” “targeted,” “continue,” “remain,” “will,” “should,” “may,” “plans,” “estimates,” and similar references to future periods; however, such words are not the exclusive means of identifying such statements. Examples of forward-looking statements include, but are not limited to: (i) projections of revenues, expenses, income or loss, earnings or loss per share, and other financial items; (ii) statements of plans, objectives, and expectations of Webster or its management or Board of Directors; (iii) statements of future economic performance; and (iv) statements of assumptions underlying such statements. Forward-looking statements are based on Webster’s current expectations and assumptions regarding its business, the economy, and other future conditions. Because forward-looking statements relate to the future, they are subject to inherent uncertainties, risks, and changes in circumstances that are difficult to predict. Webster’s actual results may differ materially from those contemplated by the forward-looking statements, which are neither statements of historical fact nor guarantees or assurances of future performance. Factors that could cause actual results to differ from those discussed in the forward-looking statements include, but are not limited to: (1) our ability to successfully execute our business plan and manage our risks; (2) local, regional, national, and international economic conditions and the impact they may have on us and our customers; (3) volatility and disruption in national and international financial markets; (4) the potential adverse effects of the ongoing novel coronavirus (COVID-19) pandemic and any governmental or societal responses thereto, or other unusual and infrequently occurring events; (5) changes in the level of nonperforming assets and charge-offs; (6) changes in estimates of future reserve requirements based upon the periodic review thereof under relevant regulatory and accounting requirements; (7) adverse conditions in the securities markets that lead to impairment in the value of our investment securities; (8) inflation, changes in interest rate, and monetary fluctuations; (9) the timely development and acceptance of new products and services and the perceived value of those products and services by customers; (10) changes in deposit flows, consumer spending, borrowings, and savings habits; (11) our ability to implement new technologies and maintain secure and reliable technology systems; (12) performance by our counterparties and vendors; (13) our ability to increase market share and control expenses; (14) changes in the competitive environment among banks, financial holding companies, and other financial services providers; (15) changes in laws and regulations (including those concerning taxes, banking, securities, insurance, and healthcare) with which we and our subsidiaries must comply, including recent and potential legislative and regulatory changes in response to the COVID-19 pandemic such as the CARES Act and the rules and regulations that may be promulgated thereunder; (16) the effect of changes in accounting policies and practices applicable to us, including changes in our allowance for loan and lease losses and other impacts of recently adopted accounting guidance regarding the recognition of credit losses; (17) legal and regulatory developments including the resolution of legal proceedings or regulatory or other governmental inquiries and the results of regulatory examinations or reviews; and (18) the other factors that are described in the Company’s Annual Report on Form 10-K and Quarterly Reports on Form 10-Q under the headings “Risk Factors” and “Management Discussion and Analysis of Financial Condition and Results of Operation.” Any forward-looking statement made by the Company in this release speaks only as of the date on which it is made. Factors or events that could cause the Company’s actual results to differ may emerge from time to time, and it is not possible for the Company to predict all of them. The Company undertakes no obligation to publicly update any forward-looking statement, whether as a result of new information, future developments or otherwise, except as may be required by law.
Non-GAAP Financial Measures
In addition to results presented in accordance with GAAP, this press release contains certain non-GAAP financial measures. A reconciliation of net income and other performance ratios, as adjusted, is included in the accompanying selected financial highlights table.
We believe that providing certain non-GAAP financial measures provides investors with information useful in understanding our financial performance, our performance trends and financial position. We utilize these measures for internal planning and forecasting purposes. We, as well as securities analysts, investors, and other interested parties, also use these measures to compare peer company operating performance. We believe that our presentation and discussion, together with the accompanying reconciliations, provides a complete understanding of factors and trends affecting our business and allows investors to view performance in a manner similar to management. These non-GAAP measures should not be considered a substitute for GAAP basis measures and results, and we strongly encourage investors to review our consolidated financial statements in their entirety and not to rely on any single financial measure. Because non-GAAP financial measures are not standardized, it may not be possible to compare these financial measures with other companies’ non-GAAP financial measures having the same or similar names.

WEBSTER FINANCIAL CORPORATIONSelected Financial Highlights (unaudited) At or for the Three Months Ended
(In thousands, except per share data)March 31,
2020December 31,
2019September 30,
2019June 30,
2019March 31,
2019
Income and performance ratios:
Net income $ 38,199 $ 90,473 $ 93,865 $ 98,649 $ 99,736
Earnings applicable to common shareholders 36,021 88,066 91,442 96,193 97,549
Earnings per diluted common share 0.39 0.96 1.00 1.05 1.06
Return on average assets 0.50 % 1.19 % 1.27 % 1.38 % 1.44 %
Return on average tangible common shareholders' equity (non-GAAP) 5.95 14.34 15.37 16.88 17.70
Return on average common shareholders’ equity 4.75 11.60 12.36 13.47 14.01
Non-interest income as a percentage of total revenue 24.12 23.47 22.52 23.88 22.12
Asset quality:
Allowance for credit losses on loans and leases $ 334,931 $ 209,096 $ 209,152 $ 211,671 $ 211,389
Nonperforming assets 169,120 157,380 166,716 153,247 164,431
Allowance for credit losses on loans and leases/total loans and leases 1.60 % 1.04 % 1.07 % 1.10 % 1.12 %
Net charge-offs/average loans and leases (annualized) 0.15 0.12 0.28 0.24 0.21
Nonperforming loans and leases/total loans and leases 0.78 0.75 0.83 0.77 0.84
Nonperforming assets/total loans and leases plus OREO 0.81 0.79 0.85 0.80 0.87Allowance for credit losses on loans and leases/nonperforming loans and leases 206.37 138.56 128.55 142.97 133.01
Other ratios:
Tangible equity (non-GAAP) 8.14 % 8.88 % 8.83 % 8.82 % 8.68 %
Tangible common equity (non-GAAP) 7.67 8.39 8.34 8.31 8.16
Tier 1 risk-based capital (a) 11.60 12.22 12.32 12.09 12.17
Total risk-based capital (a) 13.11 13.55 13.68 13.48 13.60
Common equity tier 1 risk-based capital (a) 10.96 11.56 11.63 11.41 11.46
Shareholders’ equity/total assets 9.76 10.56 10.54 10.59 10.50
Net interest margin 3.23 3.27 3.49 3.63 3.74
Efficiency ratio (non-GAAP) 58.03 58.52 56.60 56.09 55.93
Equity and share related:
Common equity $2,945,205 $3,062,733 $3,007,357 $2,920,180 $2,821,218
Book value per common share 32.66 33.28 32.68 31.74 30.62
Tangible book value per common share (non-GAAP) 26.46 27.19 26.58 25.63 24.51
Common stock closing price 22.90 53.36 46.87 47.77 50.67
Dividends declared per common share 0.40 0.40 0.40 0.40 0.33
Common shares issued and outstanding 90,172 92,027 92,034 92,007 92,125
Weighted-average common shares outstanding - Basic 90,936 91,574 91,559 91,534 91,962
Weighted-average common shares outstanding - Diluted 91,206 91,916 91,874 91,855 92,225
(a) Presented as preliminary for March 31, 2020 and actual for the remaining periods. In accordance with regulatory capital rules, the Companyelected an option to delay the estimated impact of CECL on its regulatory capital over a five-year transition period ending December 31, 2024.As a result, capital ratios and amounts as of March 31, 2020 exclude the impact of the increased allowance for credit losses on loans, held-to-maturity debt securities and unfunded loan commitments attributed to the adoption of CECL.

WEBSTER FINANCIAL CORPORATIONConsolidated Balance Sheets (unaudited)
(In thousands)March 31,
2020December 31,
2019March 31,
2019Assets:Cash and due from banks $ 198,458 $ 185,341 $ 167,587Interest-bearing deposits 69,482 72,554 53,072Securities:
Available for sale 3,016,631 2,925,833 2,977,316Held to maturity 5,486,206 5,293,918 4,480,160Total securities 8,502,837 8,219,751 7,457,476
Allowance for credit losses on investment securities held-to-maturity (312) — —Securities, net 8,502,525 8,219,751 7,457,476
Loans held for sale 22,448 36,053 20,615Loans and Leases:
Commercial 7,565,947 6,880,838 6,850,942Commercial real estate 6,122,474 5,949,339 4,991,825Residential mortgages 4,991,512 4,972,685 4,631,787Consumer 2,211,591 2,234,124 2,339,736Total loans and leases 20,891,524 20,036,986 18,814,290
Allowance for credit losses on loans and leases (334,931) (209,096) (211,389)Loans and leases, net 20,556,593 19,827,890 18,602,901
Federal Home Loan Bank and Federal Reserve Bank stock 141,327 149,046 106,674Premises and equipment, net 268,420 270,413 279,580Goodwill and other intangible assets, net 559,328 560,290 563,176Cash surrender value of life insurance policies 554,231 550,651 546,094Deferred tax asset, net 80,318 61,975 76,576Accrued interest receivable and other assets 701,744 455,380 364,378Total Assets $ 31,654,874 $ 30,389,344 $ 28,238,129
Liabilities and Shareholders' Equity:Deposits:
Demand $ 4,883,436 $ 4,446,463 $ 4,224,144Health savings accounts 6,736,178 6,416,135 6,209,213Interest-bearing checking 3,007,069 2,689,734 2,560,975Money market 2,477,304 2,312,840 2,299,229Savings 4,418,689 4,354,809 4,102,740Certificates of deposit 2,891,161 3,104,765 3,273,120Brokered certificates of deposit 100,000 — 81,507Total deposits 24,513,837 23,324,746 22,750,928
Securities sold under agreements to repurchase and other borrowings 1,262,749 1,040,431 688,065Federal Home Loan Bank advances 1,773,399 1,948,476 951,730Long-term debt 571,212 540,364 524,303Accrued expenses and other liabilities 443,435 327,557 356,848
Total liabilities 28,564,632 27,181,574 25,271,874Preferred stock 145,037 145,037 145,037Common shareholders' equity 2,945,205 3,062,733 2,821,218
Total shareholders’ equity 3,090,242 3,207,770 2,966,255Total Liabilities and Shareholders' Equity $ 31,654,874 $ 30,389,344 $ 28,238,129
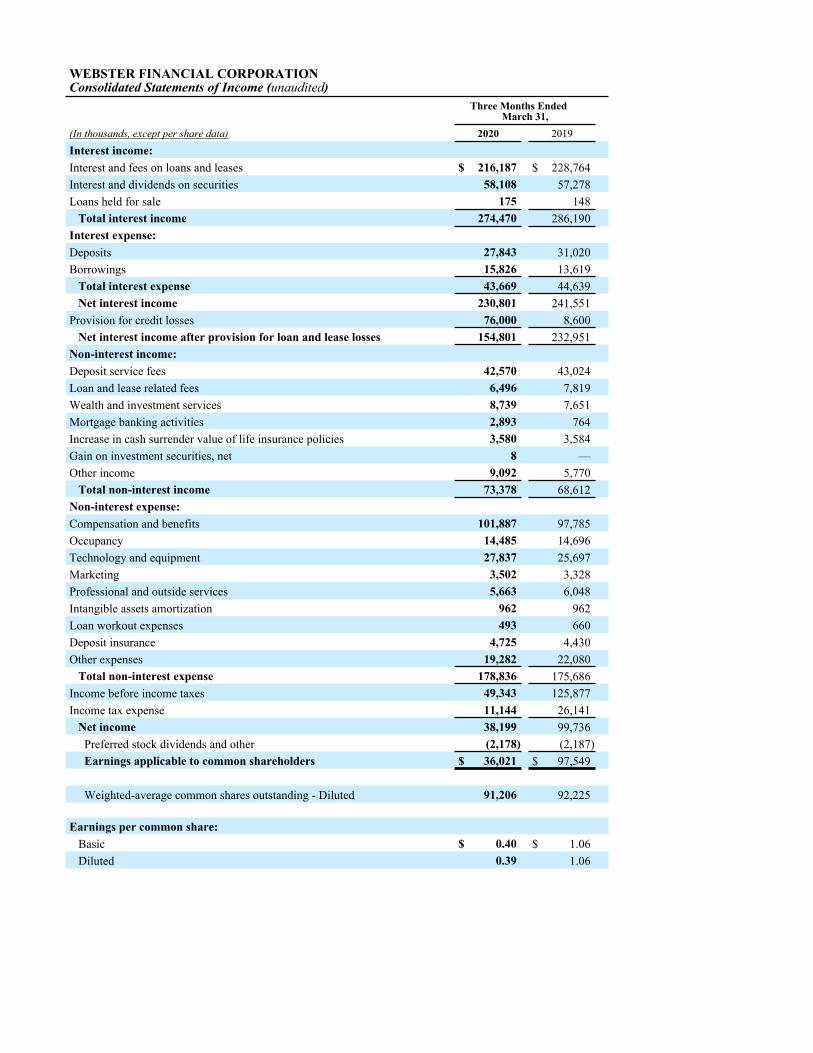
WEBSTER FINANCIAL CORPORATIONConsolidated Statements of Income (unaudited)
Three Months Ended March 31,
(In thousands, except per share data) 2020 2019Interest income:Interest and fees on loans and leases $ 216,187 $ 228,764Interest and dividends on securities 58,108 57,278Loans held for sale 175 148
Total interest income 274,470 286,190Interest expense:Deposits 27,843 31,020Borrowings 15,826 13,619
Total interest expense 43,669 44,639Net interest income 230,801 241,551
Provision for credit losses 76,000 8,600Net interest income after provision for loan and lease losses 154,801 232,951
Non-interest income:Deposit service fees 42,570 43,024Loan and lease related fees 6,496 7,819Wealth and investment services 8,739 7,651Mortgage banking activities 2,893 764Increase in cash surrender value of life insurance policies 3,580 3,584Gain on investment securities, net 8 —Other income 9,092 5,770
Total non-interest income 73,378 68,612Non-interest expense:Compensation and benefits 101,887 97,785Occupancy 14,485 14,696Technology and equipment 27,837 25,697Marketing 3,502 3,328Professional and outside services 5,663 6,048Intangible assets amortization 962 962Loan workout expenses 493 660Deposit insurance 4,725 4,430Other expenses 19,282 22,080
Total non-interest expense 178,836 175,686Income before income taxes 49,343 125,877Income tax expense 11,144 26,141
Net income 38,199 99,736Preferred stock dividends and other (2,178) (2,187)Earnings applicable to common shareholders $ 36,021 $ 97,549
Weighted-average common shares outstanding - Diluted 91,206 92,225
Earnings per common share:Basic $ 0.40 $ 1.06Diluted 0.39 1.06

WEBSTER FINANCIAL CORPORATIONFive Quarter Consolidated Statements of Income (unaudited) Three Months Ended
(In thousands, except per share data)March 31,
2020December 31,
2019September 30,
2019June 30,
2019March 31,
2019
Interest income:Interest and fees on loans and leases $ 216,187 $ 223,527 $ 236,453 $ 235,949 $ 228,764Interest and dividends on securities 58,108 58,205 57,517 56,163 57,278Loans held for sale 175 268 166 145 148
Total interest income 274,470 282,000 294,136 292,257 286,190Interest expense:Deposits 27,843 31,586 34,214 32,757 31,020Borrowings 15,826 19,164 19,383 17,713 13,619
Total interest expense 43,669 50,750 53,597 50,470 44,639Net interest income 230,801 231,250 240,539 241,787 241,551
Provision for credit losses 76,000 6,000 11,300 11,900 8,600Net interest income after provision for loan and lease losses 154,801 225,250 229,239 229,887 232,951
Non-interest income:Deposit service fees 42,570 40,470 41,410 43,118 43,024Loan and lease related fees 6,496 8,704 8,246 6,558 7,819Wealth and investment services 8,739 8,476 8,496 8,309 7,651Mortgage banking activities 2,893 2,286 2,133 932 764Increase in cash surrender value of life insurance policies 3,580 3,670 3,708 3,650 3,584Gain on investment securities, net 8 29 — — —Other income 9,092 7,284 5,938 13,286 5,770
Total non-interest income 73,378 70,919 69,931 75,853 68,612Non-interest expense:Compensation and benefits 101,887 100,467 98,623 98,527 97,785Occupancy 14,485 14,379 14,087 14,019 14,696Technology and equipment 27,837 27,639 26,180 25,767 25,697Marketing 3,502 3,957 4,758 4,243 3,328Professional and outside services 5,663 4,674 5,024 5,634 6,048Intangible assets amortization 962 962 961 962 962Loan workout expenses 493 474 986 832 660Deposit insurance 4,725 4,662 4,409 4,453 4,430Other expenses 19,282 22,516 24,866 26,203 22,080
Total non-interest expense 178,836 179,730 179,894 180,640 175,686Income before income taxes 49,343 116,439 119,276 125,100 125,877Income tax expense 11,144 25,966 25,411 26,451 26,141
Net income 38,199 90,473 93,865 98,649 99,736Preferred stock dividends and other (2,178) (2,407) (2,423) (2,456) (2,187)Earnings applicable to common shareholders $ 36,021 $ 88,066 $ 91,442 $ 96,193 $ 97,549
Weighted-average common shares outstanding - Diluted 91,206 91,916 91,874 91,855 92,225
Earnings per common share:Basic $ 0.40 $ 0.96 $ 1.00 $ 1.05 $ 1.06Diluted 0.39 0.96 1.00 1.05 1.06
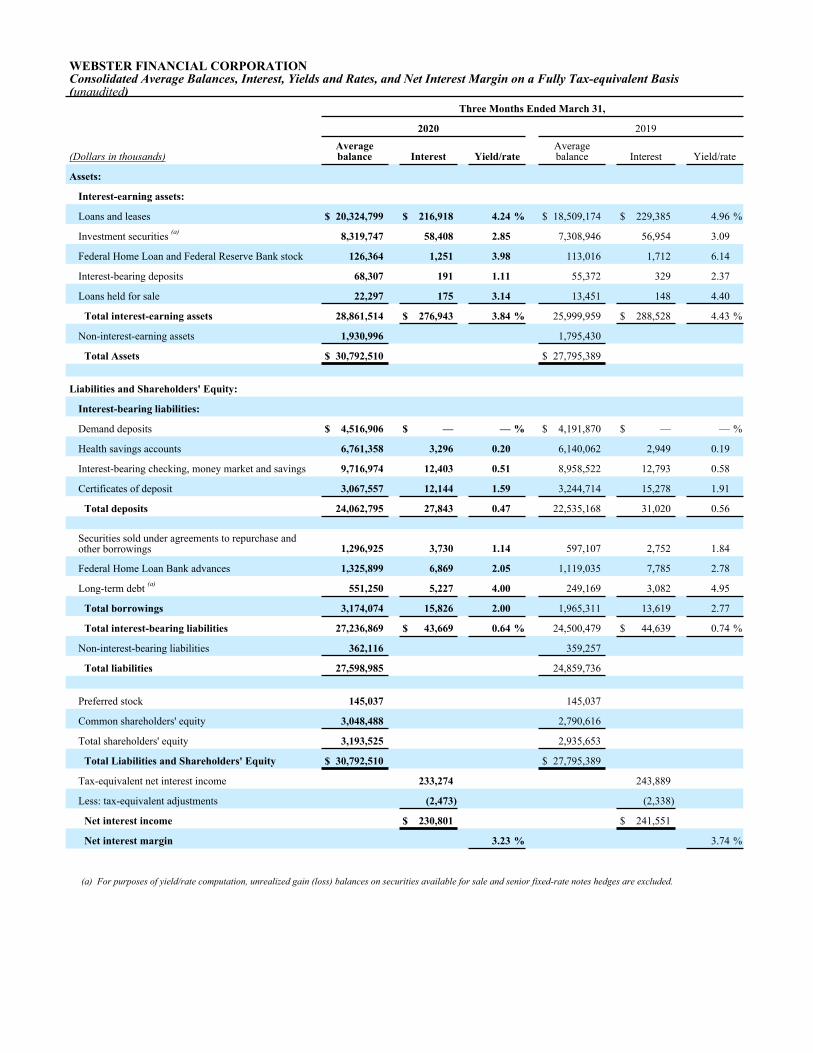
WEBSTER FINANCIAL CORPORATIONConsolidated Average Balances, Interest, Yields and Rates, and Net Interest Margin on a Fully Tax-equivalent Basis (unaudited)
Three Months Ended March 31,
2020 2019
(Dollars in thousands)Averagebalance Interest Yield/rate
Averagebalance Interest Yield/rate
Assets:
Interest-earning assets:
Loans and leases $ 20,324,799 $ 216,918 4.24 % $ 18,509,174 $ 229,385 4.96 %
Investment securities (a) 8,319,747 58,408 2.85 7,308,946 56,954 3.09
Federal Home Loan and Federal Reserve Bank stock 126,364 1,251 3.98 113,016 1,712 6.14
Interest-bearing deposits 68,307 191 1.11 55,372 329 2.37
Loans held for sale 22,297 175 3.14 13,451 148 4.40
Total interest-earning assets 28,861,514 $ 276,943 3.84 % 25,999,959 $ 288,528 4.43 %
Non-interest-earning assets 1,930,996 1,795,430
Total Assets $ 30,792,510 $ 27,795,389
Liabilities and Shareholders' Equity:
Interest-bearing liabilities:
Demand deposits $ 4,516,906 $ — — % $ 4,191,870 $ — — %
Health savings accounts 6,761,358 3,296 0.20 6,140,062 2,949 0.19
Interest-bearing checking, money market and savings 9,716,974 12,403 0.51 8,958,522 12,793 0.58
Certificates of deposit 3,067,557 12,144 1.59 3,244,714 15,278 1.91
Total deposits 24,062,795 27,843 0.47 22,535,168 31,020 0.56
Securities sold under agreements to repurchase and other borrowings 1,296,925 3,730 1.14 597,107 2,752 1.84
Federal Home Loan Bank advances 1,325,899 6,869 2.05 1,119,035 7,785 2.78
Long-term debt (a) 551,250 5,227 4.00 249,169 3,082 4.95
Total borrowings 3,174,074 15,826 2.00 1,965,311 13,619 2.77
Total interest-bearing liabilities 27,236,869 $ 43,669 0.64 % 24,500,479 $ 44,639 0.74 %
Non-interest-bearing liabilities 362,116 359,257
Total liabilities 27,598,985 24,859,736
Preferred stock 145,037 145,037
Common shareholders' equity 3,048,488 2,790,616
Total shareholders' equity 3,193,525 2,935,653
Total Liabilities and Shareholders' Equity $ 30,792,510 $ 27,795,389
Tax-equivalent net interest income 233,274 243,889
Less: tax-equivalent adjustments (2,473) (2,338)
Net interest income $ 230,801 $ 241,551
Net interest margin 3.23 % 3.74 %
(a) For purposes of yield/rate computation, unrealized gain (loss) balances on securities available for sale and senior fixed-rate notes hedges are excluded.

WEBSTER FINANCIAL CORPORATION Five Quarter Loan and Lease Balances (unaudited)
(Dollars in thousands)March 31,
2020December 31,
2019September 30,
2019June 30,
2019March 31,
2019
Loan and Lease Balances (actual):Commercial non-mortgage $ 6,385,619 $ 5,833,952 $ 5,887,119 $ 5,948,388 $ 5,811,309Asset-based lending 1,180,328 1,046,886 1,122,765 1,077,118 1,039,633Commercial real estate 6,122,474 5,949,339 5,398,084 5,224,382 4,991,825Residential mortgages 4,991,512 4,972,685 4,873,726 4,718,704 4,631,787Consumer 2,211,591 2,234,124 2,269,952 2,301,291 2,339,736
Total Loan and Lease Balances 20,891,524 20,036,986 19,551,646 19,269,883 18,814,290Allowance for credit losses on loans and leases (334,931) (209,096) (209,152) (211,671) (211,389)Loans and Leases, net $ 20,556,593 $ 19,827,890 $ 19,342,494 $ 19,058,212 $ 18,602,901
Loan and Lease Balances (average):Commercial non-mortgage $ 6,005,501 $ 5,879,600 $ 5,933,221 $ 5,914,710 $ 5,776,334Asset-based lending 1,085,624 1,087,537 1,138,189 1,049,403 1,016,069Commercial real estate 5,996,728 5,667,764 5,312,403 5,079,415 4,930,035Residential mortgages 5,013,888 4,917,365 4,802,497 4,662,033 4,415,434Consumer 2,223,058 2,256,255 2,286,983 2,324,717 2,371,302
Total Loan and Lease Balances 20,324,799 19,808,521 19,473,293 19,030,278 18,509,174Allowance for credit losses on loans and leases (269,273) (211,460) (213,130) (210,719) (214,966)Loans and Leases, net $ 20,055,526 $ 19,597,061 $ 19,260,163 $ 18,819,559 $ 18,294,208

WEBSTER FINANCIAL CORPORATIONFive Quarter Nonperforming Assets and Past Due Loans and Leases (unaudited)
(Dollars in thousands)March 31,
2020December 31,
2019September 30,
2019June 30,
2019March 31,
2019
Nonperforming loans and leases:Commercial non-mortgage $ 74,077 $ 64,793 $ 64,197 $ 56,340 $ 66,754Asset-based lending 137 139 9,165 184 218Commercial real estate 12,901 11,554 12,810 10,413 7,449Residential mortgages 42,393 43,100 43,733 48,104 49,267Consumer 32,785 31,320 32,794 33,015 35,245
Total nonperforming loans and leases $ 162,293 $ 150,906 $ 162,699 $ 148,056 $ 158,933
Other real estate owned and repossessed assets:Commercial non-mortgage $ 121 $ 271 $ 544 $ 1,307 $ 861Residential mortgages 4,480 4,247 1,912 2,012 2,769Consumer 2,226 1,956 1,561 1,872 1,868
Total other real estate owned and repossessed assets $ 6,827 $ 6,474 $ 4,017 $ 5,191 $ 5,498Total nonperforming assets $ 169,120 $ 157,380 $ 166,716 $ 153,247 $ 164,431
Past due 30-89 days:Commercial non-mortgage $ 8,200 $ 8,482 $ 5,384 $ 4,438 $ 19,152Asset-based lending — — — — —Commercial real estate 2,217 1,700 1,433 2,665 2,283Residential mortgages 11,814 13,598 13,445 10,844 12,865Consumer 14,666 18,835 15,217 13,949 16,174
Total past due 30-89 days 36,897 42,615 35,479 31,896 50,474Past due 90 days or more and accruing 75 — 92 410 —Total past due loans and leases $ 36,972 $ 42,615 $ 35,571 $ 32,306 $ 50,474
Five Quarter Changes in the Allowance for Credit Losses on Loans and Leases (unaudited)For the Three Months Ended
(Dollars in thousands)March 31,
2020December 31,
2019September 30,
2019June 30,
2019March 31,
2019
Beginning balance $ 209,096 $ 209,152 $ 211,671 $ 211,389 $ 212,353Adoption of ASU No. 2016-13 57,568 — — — —
Provision 76,085 6,000 11,300 11,900 8,600Charge-offs:Commercial non-mortgage 5,544 5,041 11,291 5,657 7,837Asset-based lending — — — — —Commercial real estate 30 23 32 2,473 973Residential mortgages 1,511 876 872 2,154 251Consumer 3,076 3,165 3,765 4,098 3,972
Total charge-offs 10,161 9,105 15,960 14,382 13,033Recoveries:Commercial non-mortgage 558 236 173 464 569Asset-based lending 3 33 — — 229Commercial real estate 3 3 3 33 6Residential mortgages 235 534 356 295 178Consumer 1,544 2,243 1,609 1,972 2,487
Total recoveries 2,343 3,049 2,141 2,764 3,469Total net charge-offs 7,818 6,056 13,819 11,618 9,564
Ending balance $ 334,931 $ 209,096 $ 209,152 $ 211,671 $ 211,389
WEBSTER FINANCIAL CORPORATIONReconciliations to GAAP Financial Measures
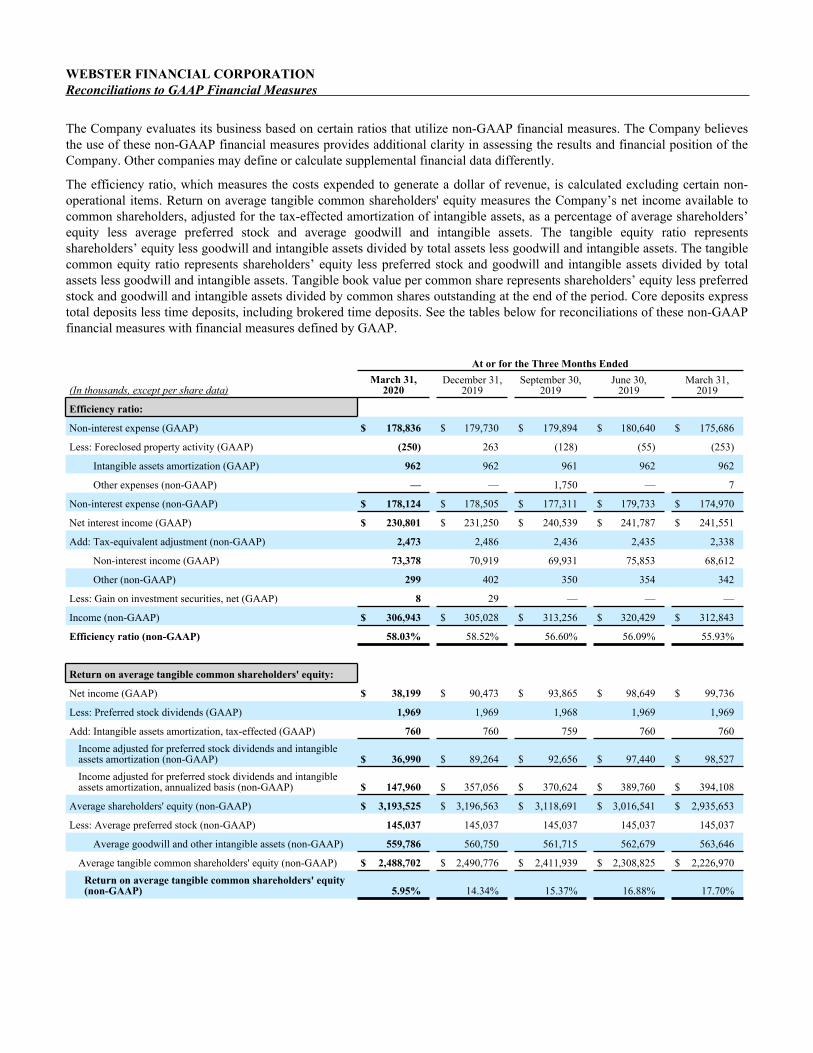
The Company evaluates its business based on certain ratios that utilize non-GAAP financial measures. The Company believesthe use of these non-GAAP financial measures provides additional clarity in assessing the results and financial position of theCompany. Other companies may define or calculate supplemental financial data differently.
The efficiency ratio, which measures the costs expended to generate a dollar of revenue, is calculated excluding certain non-operational items. Return on average tangible common shareholders' equity measures the Company’s net income available tocommon shareholders, adjusted for the tax-effected amortization of intangible assets, as a percentage of average shareholders’equity less average preferred stock and average goodwill and intangible assets. The tangible equity ratio representsshareholders’ equity less goodwill and intangible assets divided by total assets less goodwill and intangible assets. The tangiblecommon equity ratio represents shareholders’ equity less preferred stock and goodwill and intangible assets divided by totalassets less goodwill and intangible assets. Tangible book value per common share represents shareholders’ equity less preferredstock and goodwill and intangible assets divided by common shares outstanding at the end of the period. Core deposits expresstotal deposits less time deposits, including brokered time deposits. See the tables below for reconciliations of these non-GAAPfinancial measures with financial measures defined by GAAP.
At or for the Three Months Ended
(In thousands, except per share data)March 31,
2020December 31,
2019September 30,
2019June 30,
2019March 31,
2019
Efficiency ratio:
Non-interest expense (GAAP) $ 178,836 $ 179,730 $ 179,894 $ 180,640 $ 175,686
Less: Foreclosed property activity (GAAP) (250) 263 (128) (55) (253)
Intangible assets amortization (GAAP) 962 962 961 962 962
Other expenses (non-GAAP) — — 1,750 — 7
Non-interest expense (non-GAAP) $ 178,124 $ 178,505 $ 177,311 $ 179,733 $ 174,970
Net interest income (GAAP) $ 230,801 $ 231,250 $ 240,539 $ 241,787 $ 241,551
Add: Tax-equivalent adjustment (non-GAAP) 2,473 2,486 2,436 2,435 2,338
Non-interest income (GAAP) 73,378 70,919 69,931 75,853 68,612
Other (non-GAAP) 299 402 350 354 342
Less: Gain on investment securities, net (GAAP) 8 29 — — —
Income (non-GAAP) $ 306,943 $ 305,028 $ 313,256 $ 320,429 $ 312,843
Efficiency ratio (non-GAAP) 58.03% 58.52% 56.60% 56.09% 55.93%
Return on average tangible common shareholders' equity:
Net income (GAAP) $ 38,199 $ 90,473 $ 93,865 $ 98,649 $ 99,736
Less: Preferred stock dividends (GAAP) 1,969 1,969 1,968 1,969 1,969
Add: Intangible assets amortization, tax-effected (GAAP) 760 760 759 760 760Income adjusted for preferred stock dividends and intangible assets amortization (non-GAAP) $ 36,990 $ 89,264 $ 92,656 $ 97,440 $ 98,527Income adjusted for preferred stock dividends and intangible assets amortization, annualized basis (non-GAAP) $ 147,960 $ 357,056 $ 370,624 $ 389,760 $ 394,108
Average shareholders' equity (non-GAAP) $ 3,193,525 $ 3,196,563 $ 3,118,691 $ 3,016,541 $ 2,935,653
Less: Average preferred stock (non-GAAP) 145,037 145,037 145,037 145,037 145,037
Average goodwill and other intangible assets (non-GAAP) 559,786 560,750 561,715 562,679 563,646
Average tangible common shareholders' equity (non-GAAP) $ 2,488,702 $ 2,490,776 $ 2,411,939 $ 2,308,825 $ 2,226,970Return on average tangible common shareholders' equity (non-GAAP) 5.95% 14.34% 15.37% 16.88% 17.70%

WEBSTER FINANCIAL CORPORATIONReconciliations to GAAP Financial Measures (continued) ___ ___
At or for the Three Months Ended
(In thousands, except per share data)March 31,
2020December 31,
2019September 30,
2019June 30,
2019March 31,
2019
Tangible equity:
Shareholders' equity (GAAP) $ 3,090,242 $ 3,207,770 $ 3,152,394 $ 3,065,217 $ 2,966,255
Less: Goodwill and other intangible assets (GAAP) 559,328 560,290 561,252 562,214 563,176
Tangible shareholders' equity (non-GAAP) $ 2,530,914 $ 2,647,480 $ 2,591,142 $ 2,503,003 $ 2,403,079
Total assets (GAAP) $ 31,654,874 $ 30,389,344 $ 29,895,100 $ 28,942,043 $ 28,238,129
Less: Goodwill and other intangible assets (GAAP) 559,328 560,290 561,252 562,214 563,176
Tangible assets (non-GAAP) $ 31,095,546 $ 29,829,054 $ 29,333,848 $ 28,379,829 $ 27,674,953
Tangible equity (non-GAAP) 8.14% 8.88% 8.83% 8.82% 8.68%
Tangible common equity:
Tangible shareholders' equity (non-GAAP) $ 2,530,914 $ 2,647,480 $ 2,591,142 $ 2,503,003 $ 2,403,079
Less: Preferred stock (GAAP) 145,037 145,037 145,037 145,037 145,037
Tangible common shareholders' equity (non-GAAP) $ 2,385,877 $ 2,502,443 $ 2,446,105 $ 2,357,966 $ 2,258,042
Tangible assets (non-GAAP) $ 31,095,546 $ 29,829,054 $ 29,333,848 $ 28,379,829 $ 27,674,953
Tangible common equity (non-GAAP) 7.67% 8.39% 8.34% 8.31% 8.16%
Tangible book value per common share:
Tangible common shareholders' equity (non-GAAP) $ 2,385,877 $ 2,502,443 $ 2,446,105 $ 2,357,966 $ 2,258,042
Common shares outstanding 90,172 92,027 92,034 92,007 92,125
Tangible book value per common share (non-GAAP) $ 26.46 $ 27.19 $ 26.58 $ 25.63 $ 24.51
Core deposits:
Total deposits $ 24,513,837 $ 23,324,746 $ 23,280,665 $ 22,598,778 $ 22,750,928
Less: Certificates of deposit 2,891,161 3,104,765 3,249,860 3,291,617 3,273,120
Brokered certificates of deposit 100,000 — 5,705 41,376 81,507
Core deposits (non-GAAP) $ 21,522,676 $ 20,219,981 $ 20,025,100 $ 19,265,785 $ 19,396,301