Embed Size (px)
Citation preview

Website user experience: overall summary assessments and
momentary emotion
A thesis submitted to the University of Manchester for the degree of
Doctor of Philosophy
in the Faculty of Humanities
2011
Mahmood Saeed Alalawi
Manchester Business School

Table of contents
2
Table of Contents
Abstract ............................................................................................................................. 8
Declaration ........................................................................................................................ 9
Copyright statement ........................................................................................................ 10
Acknowledgement........................................................................................................... 11
Chapter 1 Introduction ............................................................................................... 12
Chapter 2 Literature review ....................................................................................... 20
2.1 User experience ................................................................................................ 20
2.1.1 Forlizzi and Battarbee user-centred model ............................................... 21
2.1.2 Emotion on the web .................................................................................. 25
2.1.3 Real-time assessments of enjoyment ........................................................ 30
2.2 Peak-end rule .................................................................................................... 35
2.3 Web usability evaluation .................................................................................. 53
Chapter 3 Experiment 1 ............................................................................................. 60
3.1 Introduction ...................................................................................................... 60
3.2 The task ............................................................................................................ 64
3.3 Design and materials ........................................................................................ 66
3.4 Procedure .......................................................................................................... 74
3.5 Results .............................................................................................................. 75
3.5.1 Characterizing the participants .................................................................. 76
3.5.2 Task completion times .............................................................................. 77
3.5.3 Retrospective assessments ........................................................................ 79
3.5.4 Real-time enjoyment ratings ..................................................................... 82
3.5.5 Regression tests of the peak-end rule ........................................................ 88

Table of contents
3
3.6 Discussion ........................................................................................................ 92
3.7 Summary of Experiment 1 ............................................................................... 95
Chapter 4 Experiment 2 ............................................................................................. 97
4.1 Introduction ...................................................................................................... 97
4.2 The task ............................................................................................................ 99
4.3 Design and materials ...................................................................................... 100
4.4 Procedure ........................................................................................................ 101
4.5 Participants ..................................................................................................... 101
4.6 Results ............................................................................................................ 102
4.6.1 Descriptive .............................................................................................. 103
4.6.2 Analytic ................................................................................................... 104
4.7 Discussion ...................................................................................................... 111
4.8 Summary of Experiment 2 ............................................................................. 112
Chapter 5 Experiment 3 ........................................................................................... 114
5.1 Introduction .................................................................................................... 114
5.2 The task .......................................................................................................... 116
5.3 Design and materials ...................................................................................... 117
5.4 Procedure ........................................................................................................ 118
5.5 Participants ..................................................................................................... 119
5.6 Results ............................................................................................................ 119
5.6.1 Descriptive .............................................................................................. 120
5.6.2 Analytical ................................................................................................ 123
5.7 Discussion ...................................................................................................... 127
5.8 Summary of Experiment 3 ............................................................................. 129
Chapter 6 Experiment 4 ........................................................................................... 132
6.1 Introduction .................................................................................................... 132
6.2 The task .......................................................................................................... 135
6.3 Design and materials ...................................................................................... 135

Table of contents
4
6.4 Procedure ........................................................................................................ 136
6.5 Participants ..................................................................................................... 137
6.6 Results ............................................................................................................ 137
6.6.1 Descriptive .............................................................................................. 137
6.6.2 Analytical ................................................................................................ 141
6.7 Discussion ...................................................................................................... 144
6.8 Summary of Experiment 4 ............................................................................. 146
6.9 Regression of all four experiments combined ................................................ 148
Chapter 7 General discussion .................................................................................. 152
7.1 Peak and end enjoyment predictions .............................................................. 161
7.2 Changing the order of events: effect on retrospective assessment ................. 164
7.2.1 Preference for improvement .................................................................... 167
7.2.2 The effect of end enjoyment moment on retrospective assessments ...... 169
7.3 Duration neglect ............................................................................................. 169
7.4 Research outcomes: ........................................................................................ 171
7.4.1 Peak-end rule: implication for web experience ....................................... 172
7.5 Web use and emotion ..................................................................................... 173
7.6 Future work .................................................................................................... 174
7.7 Summary ........................................................................................................ 180
Appendix A ................................................................................................................... 186
Experiment 1: first questionnaire: After the first block of tasks. .................................. 186
Experiment 1 second questionnaire: After the second block of tasks. .......................... 187
Experiment 2: questionnaire ........................................................................................ 188
Experiment 3: Phase 1 questionnaire ............................................................................ 189
Experiment 3: Phase2 questionnaire ............................................................................. 192
Experiment 4: questionnaire ......................................................................................... 193
References ..................................................................................................................... 194

Table of contents
5
List of Figures
Figure 3-1 Initial-, peak- and end enjoyment of website experience on scale of 0-100
throughout browsing session ........................................................................................... 67
Figure 3-2 Design retrospective assessment scale used in questionnaire ....................... 68
Figure 3-3 Enjoyment retrospective assessment scale used in questionnaire ................. 68
Figure 3-4 Experiment1 Current enjoyment tool used by participants to report real-time
ratings, including task presentation ................................................................................. 72
Figure 3-5 Experiment 1 Current enjoyment tool without the real-time ratings slide bar,
providing only task presentation ..................................................................................... 72
Figure 4-1 Experiment 2 current enjoyment tool used in the Brazil experiment .......... 100
Figure 5-1 Experiment 3 and 4 current enjoyment tool ............................................... 117

Table of contents
6
List of tables
Table 3-1 Characteristics of participants in the four experimental groups ..................... 76
Table 3-2 Experiment 1, the duration of easy and hard tasks, with standard deviation, for
the four groups ................................................................................................................ 77
Table 3-3Experiment1participants’meandesignandenjoymentretrospective
assessments for the four groups ...................................................................................... 79
Table 3-4 Pearson correlation (% predicted variance in brackets) between retrospective
assessments of design and enjoyment of easy- and hard block tasks (** = p<0.01; * =
p<0.05) ............................................................................................................................ 80
Table 3-5 Mean and standard deviation of several summary aspects of real time rating
in groups 1 and 3 ............................................................................................................. 82
Table 3-6 Correlation matrix showing the relationship between the various
characteristics of the moment-by-moment ratings of the easy task blocks of Groups 1
and 3 ................................................................................................................................ 84
Table 3-7 Correlation matrix showing the relationship between the various
characteristics of the moment-by-moment ratings of the hard task blocks of Groups 1
and 3. ............................................................................................................................... 85
Table 3-8 Regression from simple and comprehensive models- tasks retrospective
assessment of easy and hard tasks ................................................................................... 89
Table 3-9 Experiment 1: easy block tasks - standardized Beta coefficients of the two
models as predictors ........................................................................................................ 90
Table 3-10 Experiment 1: hard block tasks - standardized Beta coefficients of the two
models as predictors ........................................................................................................ 91
Table 4-1 Experiment 2: characteristics of participants, and real-time and retrospective
assessments ................................................................................................................... 104
Table 4-2 Experiment 2: correlation matrix between retrospective assessments and
initial-, peak- end- , average-, and total real-time enjoyment ratings; and duration of the
procedure ....................................................................................................................... 106
Table 4-3Experiment2predictingparticipants’memoriesfromcombinationofreal-
time measures ................................................................................................................ 107
Table 4-4 Experiment 2: standardized Beta coefficients of the two models as predictors
....................................................................................................................................... 108
Table 4-5Experiment2predictingparticipants’memoriesfromcombinationofreal-
time measures after adding the low peaks..................................................................... 109
Table of contents
7
Table 4-6 Experiment 2: standardized Beta coefficients of the two models as predictors
after adding the low peaks to both models .................................................................... 110
Table 4-7 Experiment 2 Spearman correlation of procedure duration with design and
enjoyment assessments.................................................................................................. 110
Table 5-1 Experiment 3 characteristics of participants and procedure ......................... 121
Table 5-2 Group 1 and Group 3 real-time enjoyment (mean and standard deviation) . 122
Table 5-3 Experiment 3: correlation matrix between retrospective assessments and real-
time measurements *= < 0.05, **= <0.01 ..................................................................... 123
Table 5-4Experiment3:predictingparticipants’memoriesfromcombinationofreal-
time measures ................................................................................................................ 125
Table 5-5 Experiment 3: standardized Beta coefficients of the two models as predictors
....................................................................................................................................... 126
Table 5-6 Experiment 3: Spearman correlation between overall procedure duration and
retrospective assessments of enjoyment........................................................................ 126
Table 6-1 Experiment 4 characteristics of participants and duration of procedure ...... 138
Table 6-2 peak-, initial-, end-, average- and total real-time enjoyment in addition to
retrospective assessment of enjoyment (mean and standard deviations of Groups 1, 2
and 3) ............................................................................................................................. 139
Table 6-3 Experiment 4 correlation matrix between retrospective assessments of
enjoyment and real-time enjoyment moments, and duration of the procedure ............. 140
Table 6-4Experiment4predictingparticipants’memoriesbyacombinationofreal-time
measures ........................................................................................................................ 142
Table 6-5 Experiment 4: standardized Beta coefficients of the two models as predictors
....................................................................................................................................... 143
Table 6-6 Experiment 4: Spearman correlation between overall procedure duration and
retrospective assessments of enjoyment........................................................................ 144
6-7predictingparticipants’memoriesusingacombinationofreal-time measures of all
four experiments............................................................................................................ 149
6-8 Standardized Beta coefficients of the two models as predictors for all four
experiments ................................................................................................................... 151
7-1 Summary of the results of the four experiments ..................................................... 159
New number of words 39,499

Abstract
8
Abstract
Four experiments were conducted to test whether peak-end rule replicates in the
web environment. The current enjoyment tool (CET) was developed to capture real-
time enjoyment ratings. Experiment 1 mainly tested the effect of the task order- and
the tool on retrospective assessments. The results showed that the tool did not
influence participants’ judgments. Using the number of links to determine task
difficulty was not found to be a very effective measure of enjoyment. Experiment 2
further tested the peak-end rule using a free-browsing style. The results showed that
peak and end enjoyment moments were relatively low predictors of retrospective
assessment, compared with the combination of a wider range of moments. The E2
results also demonstrated that duration did not correlate with either the real-time
enjoyment moments or retrospective assessment of enjoyment. Experiment 3
focused on the effect of manipulating the order of selected sections of a website on
retrospective assessments of enjoyment. This experiment was performed in two
phases, and succeeded in controlling the flow of enjoyment; at least end enjoyment.
The results indicated that increasing enjoyment towards the end would result in
correspondingly higher retrospective assessment ratings of enjoyment; the converse
being the case when decreasing enjoyment towards the end. Peak- and end real-
time enjoyment were found to be good predictors of the retrospective assessment of
enjoyment. The fourth experiment further investigated this end effect on
retrospective assessments. Its design succeeded in manipulating the creation of low,
medium and high end real-time enjoyment. The results showed that the high-end
group recorded higher enjoyment retrospective assessments than the low-end and
medium-end groups. Peak and end real-time enjoyment moments, as well as other
real-time enjoyment moments (initial-, average-, and total-) in addition to procedure
duration, resulted in a low prediction of retrospective assessment.

Declaration
9
Declaration
No portion of the work referred to in this thesis has been submitted in support of an
application for another degree or qualification of this or any other university or other
institute of learning.

Copyright statement
10
Copyright statement
The author of this thesisownsanycopyrightinit(the“Copyright”)andhehasgiven
The University of Manchester the right to use such Copyright for any administrative,
promotional, educational and/or teaching purposes.
Copies of this thesis, either in full or in extracts, may be made only in accordance
with the regulations of the John Rylands University Library of Manchester. Details of
these regulations may be obtained from the Librarian. This page must form part of
any such copies made.
The ownership of any patents, designs, trade marks and any and all other intellectual
propertyrightsexceptfortheCopyright(the“IntellectualPropertyRights”)andany
reproductionsofcopyrightworks,forexamplegraphsandtables(“Reproductions”),
which may be described in this thesis, may not be owned by the author and may be
owned by third parties. Such Intellectual Property Rights and Reproductions cannot
and must not be made available for use without the prior written permission of the
owner(s) of the relevant Intellectual Property Rights and /or Reproductions.
Further information on the conditions under which disclosure, publication and
exploitation of this thesis, the Copyright and any Intellectual Property Rights and/or
Reproductions described in it may take place is available from the Head of the
Manchester Business School (or the Vice-President).

Copyright statement
11
Acknowledgement
I would like to thank my parents, my beloved father and mother; for their generous
continuous support.
I would also like to thank Professor Stephen Payne for his guidance and supervision as
well as Dr. Oscar de Bruijn for his supervision and support.
I would like to thank all and sundry; those that made this work happen!
Special thanks to:
Saeed Mustafa Alalawi
My mother
Stephen Payne
Oscar de Bruijn
Stephen Kalaher
Layla Goharian
Aleksandra Bardon
Dermot Lynott

Introduction
12
Chapter 1 Introduction
Usability testing of interactive products, such as websites, is a crucial technique for
generating practical designs. When websites are evaluated, a typical procedure is to
assign a range of representative tasks to participant-users and to measure various aspects
of their performance. Increasingly, evaluatorsarealsointerestedintheusers’subjective
reactions to their design, for example, the feelings of satisfaction or frustration that the
design engenders.
In theearlydaysofwebsitedesign,webdevelopersdidnotconsider theuser’sneeds,
which resulted in the web being filled with websites that failed to meet basic user-
friendly standards. Some of these websites may leave the users very frustrated; for
example, an online shopping experience, in which the payment failure leaves the user
extremely dissatisfied.
Jesse James Garret told a joke in his speech in the Information Architect A1 Summit
2009 (Garrett 2009). He named the only two industries which refer to their customers as
‘users’, and they are, funnily enough, technology and drug dealing. Are technology
practitioners, Garret asked, causing their‘users’asmuchpainasdrugdealers?

Introduction
13
The web is full of websites that can leave their users frustrated or satisfied, upset or
happy, bored or entertained. A man won $10,000 while playing poker on-line; a woman
could not watch her favourite show on the Internet, because the video did not work.
What was their experience? Will the Internet user come back to the website that left him
incredibly happy or totally frustrated?
Many UX researchers, usability designers and information architects operating at
present, such as Don Norman, Jesse James Garret, Lazar, Hassenzahl, Tractinsky
(among others) have indicated the importance of considering human emotion in the
design process of any product or service; including websites. Don Norman, (Norman
2011) as well as Hassenzahl and Tractinsky (2006) have for instance suggested
designing for pleasure, rather than for the absence of pain, in order to improve the
quality of human life. Researchers in the past had focused on the negative emotions that
resulted from various experiences. The avoidance of frustration and dissatisfaction has
long been discussed in the field of user experience. The trend in human-computer
interaction these days is more focused on positive emotion. This thesis tries to
understand the momentary emotion of enjoyment in web experience. The creation of
emotional outcomes such as joy, fun and pride is getting more and more attention from
UX researchers (Hassenzahl and Tractinsky 2006).
This research follows the positive emotion trend by recording web-browsers real-time
enjoyment, and statistically tests the relationship between peak- and end enjoyment and
the average of all real-time enjoyment, with retrospective assessments of enjoyment. In

Introduction
14
an attempt to understand the influence of peak- and end enjoyment on people’s
retrospective assessments, this research specifically aims to determine whether these
twomomentswouldpredictpeople’sjudgmentsbetterthantheaverageofallreal-time
moments. Also, it tries to test whether increasing enjoyment towards the end of a
browsing experience would result in the experience being viewed more favourably
retrospectively than with deteriorating enjoyment. At the same time, it tries to test
whether the duration of a browsing experience would influence retrospective
assessment.
In a typical usability trial, subjective aspects such as satisfaction will be assessed
retrospectively, by means of a questionnaire administered after an episode of task
performance.
A recent and growing literature in psychology has shown that in many domains and for
many kinds of performance, such retrospective evaluations bear an interesting
relationship with the real-time experience during the episode of interest. For example
Redelmeier and Kahneman (1996) asked patients undergoing a colonoscopy to report
how much pain they were in every 60 seconds of the operation. Then, after the
operation, they asked each patient to make retrospective judgment of the experience
(Redelmeier and Kahneman 1996). They found that the retrospective evaluation could
be predicted by the peak pain experience combined with the end experience (i.e. the
reported pain at the end of the procedure).

Introduction
15
This so called peak-end rule has been shown to predict retrospective judgments in other
contexts too, such as watching series of movie footage, listening to aversive sounds and
medical procedure (Redelmeier and Kahneman 1996; Ariely and Carmon 2003).
Much of the literature on this topic was reviewed by Ariely and Carmon (2003). They
pointed out that one important implication is that the order of real-time experiences
during an episode greatly affects to the retrospective evaluation of that episode. If the
experiences improve during the episode, it will be judged much more favourably than if
they deteriorate, even if the overall sum of the experiences is the same (Ariely and
Carmon 2003).
This would appear to have important implications for usability testing. Imagine that the
series of tasks during an evaluation test were ordered in such a way as to be more and
more satisfying. According to the peak-end rule this would result in a relatively
favourable retrospective judgment. Therefore, a usability tester needs to pay close
attention to the order of tasks or experiences during any evaluation.
This thesis examines how website users evaluate website experiences; it demonstrates
the relationship between real-time enjoyment and retrospective assessments and looks at
the following points:
1. Whether retrospective assessments of enjoyment can be predicted more
accurately by peak- and end enjoyment, than by the mean of all real-time
ratings.

Introduction
16
2. Effect of task order on retrospective assessments of enjoyment.
3. Browsing duration in relation to retrospective assessment.
This thesis attempts to identify whether there are practical implications of peak-end rule
on website user experience. Addressing the above points could help usability testers and
website designers and evaluators to better understand how people evaluate website
experience; by identifying the important moments that affect people’s retrospective
assessments; which are predicted in this research as being the peak- and end enjoyment
moments, based on peak-end rule.
A substantial amount of research has examined summary evaluations of various
experiences, and by now peak-end theory is widely accepted, although some researchers
have criticised it. Although the peak-end rule has been tested in different environments
and surroundings, this thesis attempts to extend the peak-end rule to website
experiences. In particular, it aims to look into real-time ratings, within a pleasurable
experience. According to Ariely and Carmon (2003) the major tenet of peak-end rule is
that humans do not combine the individual components (i.e. real-time ratings in this
thesis), when they form their summary assessments of experiences. Much of the
research conducted on this matter demonstrates that neither the sum-, nor the average of
experience, relate closely to overall assessments. Therefore, Ariely and Carmon suggest
that the study of experience profiles must not focus just on their components, but also on
the rules that people follow, when incorporating profile components into overall
evaluations.

Introduction
17
Imagine if the peak-end rule applies to website experiences. What would be the
implications on usability evaluation methods? Who would benefit from them?
According to ISO 924-11(1998)“Usabilityistheextenttowhichaproductcanbeused
by specified users to achieve specified goals with effectiveness, efficiency and
satisfaction in a specified context of use”.Usability is considered to be an important
quality factor of any website (Avouris, Tselios et al. 2003).However, the term usability
means different things to different people. Some people perceive it as being the practice
of testing designs with representative users, while others look at it as adopting specific
developmentmethodology.Regardless of the approach, the core concept is the user’s
need for usable products. To better understand user need, it is necessary to know that the
field of user research is mainly dedicated to the identification of user need, in order to
provide a satisfying experience. Surveys, interviews and focus groups are all means of
gathering users’ general attitudes, in addition to their prediction. A more specific
approach to understanding user interaction with a certain website would be user testing
or field studies (Garret 2003).
This research focuses more on retrospective assessments reported in the questionnaire
methods of user tests; it aims to understand how people shape their retrospective
assessments in web experiences. According to the peak-end rule, when people judge
experiences they refer to the peak and end moments. Do web browsers follow the same
rule? Or do they simply integrate all browsing moments? The fact that it is difficult for
the human mind to recall every single moment of a browsing experience makes it

Introduction
18
possible to argue that he is more likely to refer to certain moments. Therefore, one can
suggest that these moments could be very valuable for designers and usability testers.
This research tries to identify the key moments, in order to facilitate the communication
between web designers, usability testers and their users; and create a more satisfying
web experience. It is hoped that the research will develop better usability tests.
Additionally, the task order, or the sequence of experimental events within the
procedure, is investigated. It is believed that understanding the effect of altering the
sequence of events in a web experience will help usability testers, web designers and
customer retention officers to craft better experiences, and facilitate communication
between these parties and web users.
The effect of the duration of the browsing experience is also monitored in this thesis. It
will test the relationship between the duration of the procedure, or browsing experience,
and retrospective assessments of enjoyment. The examination of this relationship is
likely to be of value to testers the web, and helping them to understand the impact of
timeonwebusers’judgments.
In order to carry out the research, it was necessary to identify a method of recording
real-time ratings of website users during a browsing task, and compare the ratings at
these moments with retrospective evaluation. There were established methods to follow,
such as eye-tracking and biometric recording of participants’ satisfaction level
throughout, a browsing task; however, such methods could influence participants’

Introduction
19
judgments and could be very distracting; and at this stage were considered to be neither
practical nor cost-effective. Therefore, it was decided to develop an application using a
visual studio1. The Current enjoyment tool (CET) was designed and modified according
to the requirements of each experiment. It consisted of a sliding bar marked with low,
medium and high. Participants were asked to use the bar to record their changing
enjoyment level while browsing a certain website.
The thesis is structured as follows:
Chapter 2 consists of a literature review which is divided into three parts. The first part
mainly discusses user experience, the second focuses on peak-end rule, and the final part
provides a proposal of an application of this theory to website user experience, and
discusses its possible implications.
Chapters 3, 4, 5 and 6 outline the experiments carried out using CET to capture
participants’ real-time ratings, and compare them with their retrospective judgment of
design and enjoyment.
Chapter 7 contains a general discussion. It attempts to sum up the results of the four
experiments, and form a response to the main research questions, using the findings.
1 Visual studio version 5.0 university version license was used to develop the current enjoyment tool.

Literature review
20
Chapter 2 Literature review
This chapter is divided into three main parts. Firstly, it discusses the term user
experience. It examines the issues involved in the evaluation of the emotional impact on
website users.
Secondly, it presents the peak-end rule as proposed by Daniel Kahneman and his
colleagues, who conducted a number of experiments in various environmental settings
in an attempt to substantiate the theory. There is a comparison made with work done by
other researchers who have attempted to replicate peak-end theory in their respective
fields.
Finally, there is a proposal for extending the peak-end rule to website user experience,
and an outlining of possible implications. There is a discussion on the questionnaire
method used in evaluating web experience, and the tools used to record real-time
emotion.
2.1 User experience
ISO 9241-210 defines user experience as "a person's perceptions and responses that
result from the use or anticipated use of a product, system or service". Therefore, user

Literature review
21
experience is subjective and focuses on the use (ISO 2009). The word `experience` in
the field of design refers to many things, for example, products, retail spaces and online
content; it can be anything and everything. According to Battarbee (2003) experiences
are private and subjective; therefore, `contexts for experience` need to be designed. In
other words, the design can allow for an experience that is specific to the individual
(Battarbee 2003). Relating this to the current research, the main challenge is the
subjective variation between participants, who would attempt to quantify their emotional
response, emotion, in particular their level off `enjoyment`, during their interaction with
a certain website. This matter will be further discussed in the review of emotion on the
web (Section 2.1.1).
Experiencing is described by Sanders and Dandavate (1999) as constructive activity.
The concept of user experience (UX) is elusive, and has been described differently by
diverse researchers, approaching it from varying viewpoints. The lack of a shared
definition of UX disturbs customers of certain products or services, and weakens the
effectiveness of the UX research process (Sanders and Dandavate 1999).
2.1.1 Forlizzi and Battarbee user-centred model
Forlizzi and Battarbee (2004) proposed a framework to explain experience in interacting
systems. At first they grouped existing approaches into three models: product-centred,
user-centred, and interaction-centred. Since this research is trying to understand user
Literature review
22
enjoyment on the web, as users interact with websites, the review of their framework
will focus (more) on the user-centred model.
The user-centred model proposed by Forlizzi and Battarbee in their framework (2004),
uses an approach that helps designers and developers to better understand people’s
actions while interacting with a product. This model relates to current research, and
would give an overall view of different web experience factors, especially those
subjective aspects that occur when web experiences take place.
Forlizzi and Battarbee mainly focused on an interaction-centred perspective within a
social context; examining the role the product plays in reducing the gap between its
designer and its user (Forlizzi and Battarbee 2004).They look at the interaction between
the individual and the product, and the outcome of this interaction. They suggested that
interactive experiences could be fluent, cognitive or expressive.
The fluent user-product interaction is described by Forlizzi and Battarbee as the most
automatic and the well-learned one; it helps us (people) to focus on the ongoing activity.
For instance, drinking coffee and reading at the same time, or riding a bicycle, are good
examples of fluent user product interaction. Web user experience could be said to be
fluent when a web user, for instance, checks regularly the latest world news on a
specific website. After frequently visiting a single website she would be able to reach
information as quickly as she could her coffee on the table. This example shows how it

Literature review
23
is possible to compare the fluent interactions proposed in the model, with web
experience interactions.
The cognitive user-product interactions focus (more) on the product itself. Good
examples of such experiences would be: encountering toilets, taps or kitchen devices
abroad. In the website world, this could be visiting a foreign website (for example, an
English person who browses Bahraini website shopping for a new car; only to find it a
totally different experience to using a car website from the UK).
Expressive user-product interactions were described in the model as interactions that
help users establish a relationship with a certain product. They enable users to modify or
even personalize their experience, aiming to create a better fit between people and
products. Such interactions are usually expressed in the form of stories about product
relationships. For instance, an old sofa or armchair in the living room, a customised
racing car, or a website that a user frequently visits to order parts for his car.
`Amazon.com` and `ebay.com` are both examples of how people and products fit,
especially when a web user sits on his old sofa browsing his favourite website!
As explained earlier, the focus of this research is to investigate the real-time enjoyment
that a web user experiences while interacting with a website; by monitoring and
studying participants’ real-time enjoyment, and comparing it to their retrospective
assessment of web enjoyment. The Forlizzi and Battarbee interaction-centred model
helped to understand web experiences as they occur and allow one to argue that those

Literature review
24
experiences could be fluent, cognitive or expressive when people and websites fit, snug
as an old sofa.
Understanding that web experiences could be fluent, helped with the realisation that
people who are familiar with a specific website might find information faster than those
who use it for the first time. Therefore, it is important to consider theparticipants’level
of familiarity or involvement with a certain website, during the process of experimental
design. The level of involvement will be further explained with regards to the web-
shopping and holiday-making experiences in section 2.2.2 Task/content order: effect on
retrospective assessment of enjoyment. That section discusses the issues faced in testing
the second research question of the current research, (concerning the change in intensity
for better or worse in web experience) and how the level of involvement relates to
enjoyment on the web.
The cognitive web experience, explained above, giving the example of an English
person attempting to buy a new car using a website from another country, helped to
realise that it is possible to use the fact that it is a totally new practice for him or her to
control the level of familiarity of the experience. This was used in the design process of
the first experiment, when all 40 participants were asked to perform a set of health-
information search tasks on the American National Institute of Health website
(www.nih.com) rather than the UK NHS website (www.nhs.co.uk) in order to reduce the
possibility of familiarity with the website, among participants.

Literature review
25
The framework proposed by Forlizzi and Battarbee (2004) looks at user experience in
general. It does not consider web user experience specifically; although this model helps
to develop a better understanding of the different types of web experiences.
Design research in the field of user experience mainly focuses on the relationship
between people and products, and the experience resulting from such an interaction.
Thisthesisresearchtriestounderstandtherelationshipbetweenpeople’sreactionduring
the website browsing experience and their retrospective assessments. Understanding
experience is a complex task; making the design of interactive systems equally so. Many
aspects need to be considered when designing a product or website, such as: physical,
sensual, cognitive, emotional and aesthetic (Forlizzi and Battarbee 2004). Understanding
the user is crucial to the design process; that is being aware of the cognitive and
emotional reactions resulting from the interaction with the product or website. Emotion
is at the heart of human experience, and considered as important part of user product
interaction and in the field of user experience (Forlizzi and Battarbee 2004).
2.1.2 Emotion on the web
Emotion plays a big role in our daily life. There is a plethora of websites containing
essays dealing with human emotion. In general, theories regarding emotion seek to
describe the way that human beings are disposed to act, react or interact; and to observe
the physical reactions associated with emotional arousal. Psychologists describe emotion
as having three basic functions: the first is to shape plans and intentions, the second,

Literature review
26
carry out procedures in accordance with the plans; and the third, to evaluate the
outcome (Carlson 1997). From a design point of view, emotion fills the gap between
people and products; in the current research, the people are web users, and the products
are websites. Emotion influences the way that people plan to interact with a certain
product; how they actually interact with it; and how they perceive the outcome of such
an interaction. Hence, the knowledge of emotional response is a valuable resource in the
field of user experience. It facilitates communication.
This research focuses on emotions, (enjoyment in particular), that are momentary events
in a website browsing experience. It tries to understand the web users' enjoyment and
the way they evaluate the experience.
The following looks at the assessment of emotion, in particular enjoyment. It focuses on
web experiences and discusses subjective factors that might exert an influence on user
enjoyment. Also, it discusses momentary emotions. It begins with Halvorson's (a web
content strategy expert) vision on emotion on the web (Wall-E) story.
Kristina Halvorson, in her book: Content Strategy for the Web, illustrates the mess in the
web industry, by using the science-fiction movie character; the robot `Wall-E`. The
humans left him along with other robots behind to clean up the waste they (i.e. humans)
had produced throughout the years. Among the machines, only Wall-E survives, and
spends his days going around in the pile of junk, and finding things to emotionally
interact with. Ironically,KristinaHalvorsoncomparesthewebusers’searchforvaluable

Literature review
27
information, to the robot’s hunt in the mess for valuable objects. Web users are
experiencing the similar problems in their daily search task (Halvorson 2010).
The story continues: the humans send another robot to check on his older ‘brothers’,
only to find them all dead. She meets Wall-E and the social interaction between them
begins. Wall-E starts showing her the beautiful things he has found in the pile of junk.
This movie footage was compared to the social computer interaction when a person
finds valuable information on the web. Moreover, website contents are compared to the
waste in the movie (Halvorson 2010).
Lazar et al. (2006) stated that `Frustration occurs when there is an inhibiting condition,
which interferes with or stops the realization of a goal`. The level of frustration varies,
depending on the conditions that produce the frustrating experience, and persons
involved (Lazar, Jones et al. 2006) . User frustration is aroused when the computer
operates in an unexpected way, causing annoyance to the user, and stopping him from
completing a specific task. There are a number of causes of frustration for users: for
example, the crash of the software application, an unclear error message, the appearance
of pop-up advertisements, or a confusing interface. In general, frustration with
technology occurs when users cannot achieve their task or goal (Lazar, Jones et al.
2006). Indisputably, frustration is the most reported complaint, by users who have a
negative computer experience. Almost every computer user has encountered at least one
situation that is frustrating, such as the ordeal of a program crash, resulting in the
wasting of the last hours of work, or maybe finding difficulty in downloading an email

Literature review
28
attachment. Human- computer interaction can predict that frustration will continue to be
a major reaction for users, when a computer or program fails to accomplish a specific
task (Bessière, Newhagen et al. 2006). This thesis did not look in detail at the literature
regarding frustration: it rather focused on the `positive` emotion of enjoyment.
Seligman and Csikszentmihalyi (2000) have argued for a positive approach in what they
callthe‘newmillenniumofpsychology’.Theyhavesuggestedpayingmoreattentionto
human strength, and the promotion of well being, rather than creating designs which are
geared to human weakness. (Seligman and Csikszentmihalyi 2000)
The concept of flow, as suggested by Mihaly Csikszentmihalyi (1975) could be defined
as being ` as psychological state in which an individual feels cognitively efficient,
motivated, and happy (Csíkszentmihályi 1975).
Chen and Wigand et al. (1999) conducted a study that investigated web user optimal
flow experiences. They employed the concept of flow to test whether some positive
aspects of web experiences could be linked to other media; thereby enhancing web
design, and improving user experience. They analysed the content of procedures, and
the responses to open-ended questionnaires by 304 web users, who perceived that they
had experienced flow on the web. Of their respondents 81 % reported that they had
experienced enjoyment. Information retrieval and news groups were found to be the two
main activities which generated the feelings of enjoyment. These two activities in
particular were found to rate highly in terms of interactivity and communication on the

Literature review
29
web. To illustrate, they found that in the activity of web information retrieval, the causes
of enjoyment were linked to ‘Information found’, ‘Discovering new things’ and
‘Tracking information’. Additionally, 9.8% of respondents referred to the source of
enjoyment ontheweb:“astheactivityitselfofutilizingtheweborbrowsingtheweb”
(Chen, Wigand et al. 1999). These finding give weights to the fundamental assumption
of my thesis: that web experience engenders varying levels of enjoyment.
The above examples are enough to prove that emotions and specifically enjoyment
occurs in the website world, and that web-designers have to pay more attention to the
emotional state of each user, especially at the time that the website browsing activity
takes place. It is necessary to keep track of these emotional states, and record them, in
order to gain a better understanding of user experience, and create a more satisfying
experience. Nowadays, neuron marketing technology uses mind-scan devices, to scan
the brain of potential users, for any indication of a signal; which will be acted on. Have
any web designers considered the usefulness of such techniques? This was the principle
question posed by Garret in his seminar (Garrett 2009).

Literature review
30
2.1.3 Real-time assessments of enjoyment
Early writing in the field of user experience suggested that productivity and the extent to
which a thing is learnable are not the primary factors in the creation of usability. What is
primary is peoples’experienceatthemoment experienced. (Whiteside and Wixon 1987)
Does this mean that web users follow the same rule? If so, then web user experience at
the moment experienced is of crucial importance.
The first impression of a website has been measured by many researchers. Most studies
suggest that the initial impact on users will happen in twenty to ten seconds. One of the
first group of researchers that investigated the aesthetics judgments looked into how
quickly people formed a visual judgment about a web page. They found that people
would form their visual judgment of a website in 500 milliseconds. (Lindgaard,
Fernandes et al. 2006)
This very limited amount of time needed to gain a first impression demonstrates the
necessity for very careful design of the first page of a website, to attain user satisfaction;
otherwise users will seek their information somewhere else (Hodge 2006). The research
connected with this thesis did not investigate the importance of the first impression,
although initial moments of enjoyment, along with peak and end enjoyment moments,
as well as the average- and total enjoyment of all real-time moments, were recorded.
This current thesis focuses (more) on the peak and end enjoyment moments in
comparison with the average of all real-time moments; but the initial moment of

Literature review
31
enjoyment will be monitored, being recognised as significant, and perhaps laying the
foundation for future research within the field of web enjoyment, and as opposed to that
of the first impression, as conducted by Hodge (2006).
Barrett (1997) investigated the relationship between momentary emotional experiences,
personality descriptions, and retrospective ratings of emotion. The study aimed to test
whether memory-based ratings were more greatly influenced by participants’
description of their own emotionality, than the summary of their momentary emotion
ratings. Self report measures of neuroticism and extraversion were completed by
participants, along with the momentary ratings of their emotions, over a period of 90
days. Towards the end of their study, participants were asked to recall the emotion they
experienced during the course of the study. The findings showed that retrospective
ratings of emotion contained accurate information about the participants’ momentary
emotion reports: also, that retrospective ratings were influenced by each participant’s
description of their own personality. This means that people who considered themselves
to be neurotic remembered experiencing more negative emotion than they had reported
at the time; whereas those who described themselves as being extravert recalled more
positive emotions than they had reported on the momentary basis (Barrett 1997). This
result is crucial for the current thesis, as it strongly suggests that subjective factors might
wellinfluencewebusers’judgments.Therefore,itwasnecessarytolookatthesefactors
that had the potential to influence on the interactions and judgments of web users.

Literature review
32
Wang, Hawk et al. (2000) designed a study with the aim of observing the way that users
search for factual information on the Web. The study looked at the difference in the
individual which might affect interactions. They proposed a model which consisted of
three components: user, interface and World Wide Web. They used a process-tracing
technique of their own design, to capture the user interaction. Participants reported their
web experience as well as measuring affective states. Participants were asked to find the
answers to two factual questions on the web. They recorded participants in video-audio,
synchronized with their concurrent verbalization of thoughts. The research team stated
that their findings provided rich information in terms of user behaviour in relation to
interfaces and the web. These three elements form the components of the
multidimensional model they proposed (Wang, Hawk et al. 2000).
The following passage focuses more on the term user, especially the subjective aspects
of the web user.
There are a number of dynamic situational factors that influence the user dimension, for
example, the particular task, the information needed and the knowledge held by the user.
There are a number of things that must be considered when designing a website, such as
user profile, the interaction with the website, information accuracy and entertainment
level (Palmer and Griffith 1998). Itisimportanttorealizecustomers’expectationsand
how they feel about the website interaction (Ping, Dran et al. 2001). Additionally, there
are specific individual affective states before and during interaction, although, in a
series of three experiments, Ariely and Loewenstein et al. (2006) found that people do

Literature review
33
not have a pre-existing sense of the quality of an experience, even after they have
encountered a sample of it (Ariely, Loewenstein et al. 2006).
Wang, Hawk et al. (2000) proposed that the user experience includes all domains of
human behaviour; thoughts, search strategies, problem solving, decisions, and mental
models; the element of all cognitive functioning. They are suggesting that all aspects of
behaviour may be relevant to understanding user experience. This could mean that all
aspects of behaviour maybe relevant to understanding user experience. Age can also be
a factor. Chadwick-Dias and McNulty et al. (2003) found that older subjects
experienced significantly more difficulty using websites than younger users (Chadwick-
Dias, McNulty et al. 2003).
The affective state of an individual is likely to change because of the interaction. The
findings of the research of Wang, Hawk et al. (2000) suggest that web designers need to
understand mental models, that an effective interface must provide great affordance and
facilitate correct mental models development, by providing appropriate message and
being context sensitive, according to user behaviour. They suggest that while browsing
the web it is difficult to develop appropriate mental models because of the diversity of
web organization (Wang, Hawk et al. 2000). Looking at this from a positive standpoint
it is already known from the emotion review (above) that people experience enjoyment
on the web. What about the subjective aspects? What did this study do to control them?
It isdifficult topredict andcontrolpeople’s thoughts inawebenvironment.Thebest
possible solution at this stage was to standardise the experimental procedure, and control

Literature review
34
the conditions of the experiment. Using (student in this study) would help reduce the
gap between the hidden mental factors; it is, however, still not guaranteed that all
participants would think the same. Subjective aspects of participants are an ongoing
issue in the field of emotion. The pros and cons of having a controlled experiment will
be further explained towards the end of this literature; within the laboratory experiments
review.
The experience of pleasure, and its influence on product design, was discussed by
Jordan (1999). User self image, social grouping, personal ideology and senses can
influence the way that a product is experienced (Jordan 1999)). The current research
attempted to test the peak-, end- and average enjoyment relationship with retrospective
assessments of enjoyment. The social grouping influence will be controlled by asking
participants to perform the experimental procedure individually. This research did not
test for user self image, personal ideology and senses; it rather tried to understand the
connection between momentary enjoyment and retrospective assessment.
Regardless of the increasing number of models or theories regarding information
systems that focus on the cognitive and behavioural aspects of human decision-making
processes, and individual-level reactions in various contexts, still the influence of affect
(mood, emotion, and feeling) is often neglected (Hwang and Kim 2007). Affect is
defined as: the feeling of joy, elation, pleasure, depression, disgust, displeasure, or hate
associated by an individual with a particular act (Triandis 1980).

Literature review
35
2.2 Peak-end rule
Researchers have sought an understanding of summary evaluations of different
experiences, for a number of reasons. Firstly, overall evaluations of pain and pleasure
are associated with a diversity of experiences, and constitute important input of
information for future decision-making. Secondly, the way in which a person recalls an
experience is a key determinant as to whether they will choose to repeat it in the future,
and whether or not they will choose to recommend it to others. Thirdly, retrospective
summary assessments can help determine the way that people recall memories of a
certain experience, in the future. For example, a short holiday can induce fond
memories, which a person could enjoy long after that experience is over (Ariely and
Carmon 2003).
On the other hand, prospective evaluations are also considered to be important. For
instance, they can evoke feelings such as anticipation and dread, before the experience
even takes place, which could influence the decision as to whether or not to pursue an
experience (Ariely and Carmon 2003). Taking the lottery ticket as an example, Ariely
and Carmon (2003) suggest that often tickets are bought, not so much because people
expect to win a prize, but because they offer the buyer a chance to fantasize for several
days on how it might feel to win the money.
Some researchers argue that peak (the most intense) real-time emotion determines
recall-based ratings (Hodges, Jandorf et al. 1968) Other findings suggest that the
average of real-time emotion experiences are more important (Parkinson, Briner et al.

Literature review
36
1995). Still other findings suggest that the end (final) moment has a small but significant
relationship with the retrospective assessment of emotion (Holmberg and Holmes 1994;
Parkinson, Briner et al. 1995).
This research focuses more on the peak-end rule in the web environment, and tries to
demonstrate whether it is possible to replicate, and benefit from the theory.
The field of psychology is diverse, and considerably older and more profoundly rooted
than that of computing (Green, Payne et al. 1983). The following section presents the
peak-end rule from a psychology perspective, as proposed by Daniel Kahneman. Giving
an overview of the theory, it discusses various experiments, and looks at the conclusions
drawn from them.
Peak-end rule was proposed by Kahneman, Fredrickson et al. (1993) on retrospective
evaluation. The theory is an example of the rule of weighted averaging. It assumes a
zero (or near-zero) effect of all moments, except the most extreme and final moments
(Fredrickson and Kahneman 1993).
Kahneman and his colleagues performed several experiments to test the peak-end rule:
on the medical procedures of colonoscopy and lithotripsy (Redelmeier and Kahneman
1996); cold pressure (cold-water endurance study) (Kahneman, Fredrickson et al. 1993);
on aversive sounds (Schreiber and Kahneman 2000); and on pleasant and unpleasant
film clips (Fredrickson and Kahneman 1993). These experiments will be outlined in the
following section.

Literature review
37
In their work on patients’ memories of painful medical treatments, Redelmeier and
Kahneman (1996) recorded real-time and retrospective evaluations. They recorded in
real-time the pain intensity experienced by 154 patients undergoing colonoscopy, and
133 having lithotripsy. They also recorded the patients’ retrospective ratings of total
painattheendofeachprocedure.Thefindingsshowedthatapatient’sjudgmentoftotal
pain correlated strongly with the peak pain intensity, and the ratings in the last 3 minutes
(end ratings).Theysuggestedthatapatient’smemoryofapainfulprocedurereflectsthe
intensity of pain at the worst part and the final part of the experience (Redelmeier and
Kahneman 1996).
Ariely and Carmon (2003) mentioned that for reasons of practicality, research tended to
investigate brief unpleasant experiences, rather than pleasant-, or a mixture of pleasant-
and unpleasant experiences. Certainly, it is not obvious as to how peak-end rule could
be applied to a mixture of experiences. The aim of the current research is to test peak-
end rule in a pleasant web experience. The literature review of emotion on the web,
however, has shown that people reported moments of enjoyment on the web, but would
the peak- and end enjoyment be reflected in retrospective assessment, or would the
average of all real-time enjoyment hold better ground? There are still other possibilities:
that either the peak (highest reported enjoyment) itself, or the end (enjoyment reported
at the end of experience) would be replicated in the web user’sretrospectivejudgment.
This current research aims to elucidate which of these rules applies, and whether the
peak-end rule would be replicated on the web.

Literature review
38
Intheirworkon‘determinantsoftherememberedutilityofaversivesounds’Schreiber
and Kahneman (2000) asked 36 students from the University of California, for their
instant ratings, and overall ratings, of sets of aversive sound clips. Results found by
Schreiber and Kahneman (2000) show a strong correlation between peak and end
ratings, and the overall level of (un) pleasantness. But would the peak end rule be
replicated in web experience... or would the average of all real-time ratings be a better
way of predicting retrospective assessment? This is the main question of the current
research.
The studies of Kahneman and his colleagues show that broad evaluations of the effect
on a single sense in a number of different types of episode were reasonably predicted by
peak intensity moments and end moments. However, it is quite certain that the peak-end
rule does not eliminate other factors that determine a general evaluation. Other variables
could be important in influencing retrospective evaluation; for example: the velocity of
change for the better or -worse, or the presence of anticipatory emotions such as hope or
fear. The work on retrospective evaluation had barely begun. Understanding the process
of retrospective assessments is important, because what people think of the past, often
determines what they do in the future (Fredrickson and Kahneman 1993).
The methods used by Daniel Kahneman and his colleagues in their investigation of peak
and end moments, varied. Those used in three of the studies are outlined as follows:

Literature review
39
In the water pressure study, participants were asked to immerse both of their hands (on
two occasions) in cold water. The participants were provided with what was called a
``discomfort meter``, to report their real-time discomfort ratings. The meter consisted of
a potentiometer and a linear array of 15 light-emitting diodes (LEDs). A single green
LED remained lit at one end of the display at all times. Participants were asked to adjust
the potentiometer, the value of which was recorded The computer kept a record of the
water temperature as well as the discomfort values reported by each of the subjects,
which could range between 0 and 14 (Kahneman, Fredrickson et al. 1993).
In the study that was conducted on aversive sounds, participants were asked to use
computerised software to report their real-time experience of pleasantness or
unpleasantness, while listening to various noises. Three sets of experiments were
conducted. The participants provided their real-time ratings while listening to each
stimulus, by using the mouse to adjust the length and direction of a horizontal bar on a
computer screen. The bar was inside a box which was labelled ``extremely unpleasant``
on the left, and ``neutral`` at the centre, and ``extremely pleasant`` on the right. The
computer kept a record of the time rated in seconds, as well as the real-time pain of each
user. The horizontal bar ranged from: -250 (extremely pleasant) to 250 (extremely
unpleasant) (Schreiber and Kahneman 2000).
Patients’ real-time experiences during the painful medical treatments were recorded
using the Gottman Levenson method for measuring emotional response. A computer
screen had a marker that was controlled by a hand-held device. The screen had a 19-cm

Literature review
40
visual analogue scale, with ``no pain`` at one end, and ``extreme pain`` at the other. The
patients were requested to rate every 60 seconds. The computer kept a record of the real-
time ratings on a scale that ranged between 0 and 10; the lower the number, the less the
pain. In this experiment, the 53 colonoscopy patients were not required to record their
own ratings: this was done by a research assistant (Redelmeier and Kahneman 1996).
As has been suggested, the methods used to gather real-time responses from subjects
varied due to the nature of the each experiment, but they all made use of a tool to keep
track of the real-time experiences. In the water pressure study, the subjects were
provided with the LED lights. The study of the painful medical treatment procedure
made use of a hand-held device. In the study of aversive sounds, participants were able
to rate their experience using the sliding bar which appeared on a screen. It is fair to say
that the series of experiments is very well thought out , in that it had used the different
senses of hearing and feeling (touch): incidentally, in the case of the film-clips... sight
During the course of the PhD study, the writer attended a seminar, in May 2009, given
by his core supervisor, Stephen Payne. At this seminar, Payne asked participants to
browse the web, with the intention of planning a holiday to Brazil. The initial idea was
to provide each user with the Current Enjoyment Tool (CET) developed at that time, but
due to some technical difficulties related to compatibility of the developed CET at that
time, and because of the software and security version used by the University; the
participants were not able to use the tool. Therefore, Payne asked them to keep track of
their real-time enjoyment level, on paper. The fact that participants were able to report

Literature review
41
their enjoyment on a scale of 1 to 10 (with 1 representing the least enjoyment and 10 the
highest enjoyment) led to the conclusion that it might be possible for people to rate their
hidden emotion; such as enjoyment in this case.
Earlier, in the experiment conducted in his MSc, the writer asked people to report their
real-time enjoyment on a sheet of paper. That study involved several tasks, which were
also printed and presented to each user (Alalawi 2006).
The current research developed over the years, and made use of an automated tool; as
detailed in each of the experiments. The use of the current enjoyment tool (CET)
ensured the involvement of the participant, and their assessment of the nature of the web
experience in the four experiments. The work done in the current research could be
compared with the procedures of the three experiments conducted on aversive sounds,
water pressure and painful medical treatments. However, the CET enabled participants
to keep track of their own progress, without having to constantly report to a third party.
In the work done for this research, the experimenter observed the participants, and made
sure that they followed the right procedure, whilst being vigilant in not influencing their
real-time assessments. The experimenter was in a position to prompt the subjects to
assess, in the instances where there was the risk of the neglect of the real-time ratings
(after 2 or 3 minutes had passed) but he did not apply any pressure on the user to rate.
Naturally, an appealing way to summarise experience would be to integrate or total the
intensities of the subjective states contained within that experience. Up till now, it is

Literature review
42
clear from hedonic integration research findings, that when people summarise
experiences, they do not integrate or summarise the transient states experienced as the
events unfold.
A number of researchers have conducted experiments testing peak-end rule in other
domains. The next section presents and discusses some of this work.
2.2.1 Peak-end rule in other domains
One study that demonstrated peak-end rule in another field was conducted by Kemp and
Burt et al. (2008) Forty-nine students, who went on vacation for an average of seven
days, were asked to report their daily (over the previous 24 hours) happiness level,
through text messages. Subsequently, they were asked to report their overall happiness.
Additionally, they were asked to recall the daily record of their happiness. Results
showed that the duration of the vacation had no effect on overall evaluations and that the
participants were not able to recall the details of the daily fluctuations in their level of
happiness (Kemp, Burt et al. 2008). Their findings concluded that peak-end rule was not
an outstandingly good predictor of retrospective assessments.
Another study that tested the theory in another area was conducted by Talya Shatz
(2009) investigating the way that people evaluate their days. The research, based on
peak-endrule,lookedatwhetherpeople’sevaluationswereanaggregationoffeelings,
or based on peaks and feelings towards the end of the day. Results indicated that the
retrospective evaluation of a complex series of events (which in this case was daily a life

Literature review
43
routine) depends on the averaging of emotion ratings. The feelings at the end did not
have such a dominant role, nor did the presence of low peaks affect the evaluation.
Shatz (2009) encourages further extending peak-end rule to other elaborate scenarios,
looking at content goals and emotionality (Shatz 2009).
HassenzahlandSandweg(2004)conductedastudythatexplored:“howtheintensityof
experiencerelates tosummaryassessmentsofsoftwareproductquality”.Thisstudy is
very close to this thesis research in terms of the nature of the experiences. Their
experiment was performed using a software application. The current research focuses on
web experience. Both experiences share a similar level of involvement, and are related
to computers. This makes their findings very valuable for this research (Hassenzahl and
Sandweg 2004).
They found that the end of the previous experience seems to determine how people
construct their summary assessment of a product. They related their findings to memory
effect, or what they called recency effect. They added that people’ssummaryassessment
tends to be based on what they remember from an event they just experienced. It means
that it is easier for an individual to recall the more recent detail than to remember an
incident that happened in the distant past. Therefore, powerful intellectual effort towards
the end of an experience, seems to be very significant in terms of a subsequent summary
assessment (Hassenzahl and Sandweg 2004).

Literature review
44
These findings raise the question of the usefulness of the common practice of gathering
retrospective assessments based on experiential episodes; especially the questionnaires
that are geared to gathering a subjective assessment of emotion (such as enjoyment) in
web evaluation. This matter will be further examined in the section on usability
evaluation.
The experiments presented (above) show that the peak-end rule is not always replicated
in various spheres of human experience. This could be due to the difference in the nature
of the experiences. The study conducted on people’s evaluation of days showed that
sometimes retrospective ratings can be more related to the averaging of the ratings
emotion rather than concentrating on peak and end emotion (Shatz 2009). The study
conducted on the software application, which might be considered to be very close to
the current research in terms of the nature of experience, has shown that the end moment
strongly influenced retrospective assessment (Hassenzahl and Sandweg 2004). In the
vacation study, the peak-end rule was not found to be a good predictor of retrospective
assessment; although it is worth noting that duration had littleornoeffectonpeople’s
retrospective assessments (Kemp, Burt et al. 2008).
2.2.2 Task / content order: effect on retrospective assessment of enjoyment
Ariely (1998) conducted two experiments in which moderate levels of pain were
inflicted on individuals, one using a heat probe, and the other, squeezing their fingers in

Literature review
45
a vice. The experiences varied in terms of the duration and pain intensity over time (pain
intensity increased then decreased, or vice versa). Towards the end of the experiment,
participants gave their assessments of the overall pain they experienced. The results
indicated that participants showed considerable sensitivity in the way that they
experienced changes in intensity. The scenario of increasing pain intensity was
perceived as being more painful than that of decreasing pain intensity, even though the
sum momentary pain was equivalent. Furthermore, the participants preferred the
improvement to take place later rather than earlier, in the sequence.
Watching a movie or listening to sound clips is not comparable to using an interactive
system. The context of the browsing experience is more complex, and involves more
factors. For instance, the level of physical interaction in a web-browsing experience is
far greater than that when watching a film. A person that browses a website has to
perform certain actions to maintain the flow of his web navigation. Along the way, the
browser’s emotionwould change forbetterorworse,dependingon the situation.The
complexity of the browsing experience makes it difficult to test for the perceived change
in intensity for better or worse.
In the virtual world itis impossibletoheatorsqueezewebusers’fingers.Thismakes
the testing of the task order effect on retrospective assessments difficult; and not as
straightforward as in the two experiments conducted by Ariely. But it is known from the
review of emotion (above) that people have reported moments of enjoyment on the web.
The difficulty at this stage was in finding a way to test the effect of change in intensity

Literature review
46
(for better or worse) on retrospective assessments of a web experience; precisely, how to
manipulate the intensity of enjoyment and which web experience to use.
Unlike in the real-world it is not possible to physically reverse web experiences. For
instance, it is irrational to ask somebody to reverse his email- or online payment
experience. Using tasks or web contents seemed to be a more realistic approach.
According to De-Marsico and Leviald (2005) usability evaluation methodologies are as
follows : ``The first generally consider task-oriented (high-level) characteristics, the
second exploit results from behavioural research, the last are mostly based on style and
context-free features`` (De-Marsico and Leviald 2005).
Web closed tasks are characterized by the use of specific information that results in a
single outcome (Pilgrim, Leung et al. 2005). A fixed- or closed task could be used to
test the change of intensity for better or worse; although there was a necessity to identify
a way of increasing and decreasing the flow of enjoyment of a browsing experience. An
idea came to light which involves using the number of links required to complete a
specific task as a way of manipulating task difficulty. It would then be possible to test
the effect of reversing the same fixed tasks, on retrospective assessments of enjoyment
on the web. It was not guaranteed that the use of the number of links would succeed in
testingAriely’spropositionregardingthechangeinintensityforbetter or worse. Due to
the lack of resources, and the presence of technical issues (with regards to the variation
between experiments conducted in the testing of the peak-end rule, within a web
experience); using the number of links seemed to be the right thing to try at that time.

Literature review
47
Subsequently, in late 2009 the Gwizdka paper was published. It suggested that task
difficulty within a web search is related to cognitive loads, and needs to be used with
caution, especially in a dual-task approach (Gwizdka 2009).
An idea that was considered in the design process of the experiment was to alter the
content order; using web sections, rather than closed web tasks. An open task has a low
level of goal-specificity (Pilgrim, Leung et al. 2005).Oneoftheweb’sadvantagesisthe
users’ freedom of choice and the flexibility of his movement (Benyon and Wilmes
2003). Free-, but bordered tasks give people more freedom. Allowing people to browse
freely the various contents of a website, the broad browse pattern is connected to the
interest of each browser.
Ping et al. (2001) defined the way that users think about the objects of the website as
satisfiers or dissatisfiers according to the impact they have on the user (Ping, Dran et al.
2001). This led to thinking of using website content or sections, rather than the setting of
tasks, to note the effect of increasing and decreasing the intensity of enjoyment, on the
browsers retrospective assessments of a website. The fact that users think about the
objects of websites as satisfiers or dissatisfiers makes it possible to argue that they might
enjoy one section more than another.
What experience do people enjoy on the web that can be used to test the effect of
content order on retrospective assessment?

Literature review
48
In order for something to be personally relevant within their sphere of involvement,
there must be an environment that accounts for personal motivation and need. Online
shopping is capable of providing such involvement, as well as a high degree of pleasure
(Jobber 1995). Website usability plays an important role in business image, and can
influence customer shopping behaviour. Good usability is important to achieve customer
satisfaction (Flavián, Guinalíu et al. 2006). The choice of which restaurant to dine at
when on holiday can be highly involving; making the right or wrong choice might
severely affect the degree of enjoyment of the dining experience. In the context of the
web,inorderto increaseabrowser’spleasure, it isnecessarytokeepthempersonally
involved and motivated. Imagine two participants involved in a web-usability test. The
first was asked to perform a fixed set of tasks (as in Experiment 1) that are related to
holiday making; while the second participant was given more freedom to browse the
same website, she was allowed to plan her own holiday according to her desires, within
the same website. The level of involvement of the second participant is higher than of
the first, because she has the freedom to become personally involved, and is not forced
to perform specific tasks; therefore it is assumed that her level of enjoyment would be
higher.
According to Ariely (2003) there are two types of experiences. The first, he called goal-
directed, such as waiting for some kind of service, or sports event. These experiences
mostly derive their meanings from their outcome. The second type of experience, which
Ariely called experience based, mainly derives its meaning from the event itself, and not

Literature review
49
the outcome. Examples of such experiences include: receiving a message, watching a
movie, or dining. Ariely (2003) added that various real life experiences fall somewhere
in between these two types. For instance, driving a car to work, or playing a game of
squash or football, are goal-directed. Simultaneously, the ongoing experience itself adds
to- or contributes to the overall evaluation, in terms of the nature of the game or the
driving experience.
The experience of online shopping or planning a holiday is initially in the experienced
based category, but when the web browser buys something or books a holiday, it
changes to become goal-directed. In this study, participants will not be asked to buy a
product or book a holiday. The research aims to understand the relationship between the
events of the experience and retrospective assessment. As mentioned before,
experienced based processes derive their meaning from events themselves. This means
that it is better to ask people to browse for a holiday and not book one; and shop for
items and not buy any. Additionally, asking each participant to book a holiday or buy
something is very costly, and considered to be unrealistic. The second experiment used
the free-browsing task of planning a holiday to Brazil. The third and fourth experiment
used online shopping experiences, and employed the content order method to test the
effect of the change in the intensity of enjoyment on the retrospective assessment of
enjoyment.

Literature review
50
2.2.3 Duration neglect
The duration of an experience does not always have a significant impact on its summary
evaluation (Kahneman, Wakker et al. 1997). The first workers to draw attention to this
phenomenon were Varey and Kahneman (1991). They conducted an experiment in
which participants provided a summary evaluation of a number of hypothetical
experiences, which varied both in their duration and in their intensity over time. Varey
and Kahneman (1991) as well as Fredrickson and Kahneman (1993) found that
summary evaluations were influenced by the maximum- and the final intensities of
experiences. They also found that duration had almost no effect on the overall
evaluation (or what we refer to in this thesis as the retrospective assessment of
enjoyment). Fredrickson and Kahneman (1993) named this phenomenon duration
neglect.
According to Fredrickson and Kahneman (1993) duration neglect is part of the peak-
end rule: that time has little- or no effect on a participant’s retrospective assessments
(Fredrickson and Kahneman 1993). In their work on sound clips, Schreiber and
Kahneman (2000) further tested this notion, by comparing long- and short film clips, in
terms of time and retrospective assessments. The phenomenon of duration neglect was
also found to hold in their experiment on the medical procedure of colonoscopy, where
global retrospective evaluation did not correlate with the duration of the medical
procedure (Redelmeier and Kahneman 1996; Schreiber and Kahneman 2000).

Literature review
51
Earlier, Fredrickson and Kahneman (1993) performed two experiments on aversive- and
pleasant film clips. In the first experiment, 32 participants viewed aversive- and pleasant
film clips, which varied in duration and intensity. The real-time ratings of participants
were recorded, along with the overall evaluation of each clip. In the second experiment,
96 participants viewed the same clips, and later evaluated the clips, in terms of the
perceived levels of pleasantness or unpleasantness of each fragment of film. The
findings based on the weighted snapshots, showed that the duration of a film clip had
little effect on its retrospective evaluation (Fredrickson and Kahneman 1993)
Kahneman and Fredrickson et al. (1993) performed an experiment on 32 male students
from the University of California. Participants were required to place their hand in a tub
of cold water. In the first trial, the one hand was inserted for 60 seconds, in water at
14°C. In the second trial, the other hand was immersed for a further 30 seconds (90
seconds in all) during which time the temperature of the water was slowly raised to
15°C. They used one hand in the first trial (immersed for 60 seconds) and the other hand
in the second trial (immersed for 90 seconds) (Kahneman, Fredrickson et al. 1993). The
experimenters found that the participants preferred to put their hand in water for a longer
time period, when the latter part of the time involved an improvement in the experience
[(60 seconds at 14°C versus 90 seconds- during the last 30 seconds of which the
temperature was being raised to 15°C)] (Kahneman, Fredrickson et al. 1993).
This phenomenon is described as violation of monotonicity: adding a period of
diminished discomfort to unpleasant episodes will cause a better overall evaluation,

Literature review
52
because the average peak-end is reduced. The experiments presented above, with
regards to duration neglect, raised the third research question of this thesis: Would the
duration of the web-browsingaffectusers’retrospectiveassessments?
Bearing in mind the limited resources and time, this research tends to monitor duration
neglect by testing for the relationship between web-browsing duration and participants’
retrospective assessments, using Spearman correlation tests. More details on Spearman
correlation test are included in the following chapter which is assigned to research
methods.
Watching a movie at a cinema, or visiting a theme park, is not comparable to using an
interactive product. Therefore, designers may focus on creating the context for an
emotion instead of the emotion itself. What are the consequences of identifying affect
and creating affective responses, on people’s judgments? (Hassenzahl and Tractinsky,
2006). For instance, is it possible to understand the way beauty creates emotion? In
other words, can human beings come to understand the way their emotions influence
their judgment and decision making both in the instant and reflectively?
Usually, when there is a positive user experience, it is expected that users will return to a
website, and will benefit a business, in terms of exposure and revenue. In contrast, a
negative user experience will raise the overheads, reduce customer loyalty, lose the
`word of mouth` in advertising, and destroy the brand identity (Haynes 2002).

Literature review
53
The questions now are: How do people judge web experiences? What rules would they
follow in forming their retrospective assessments? Which moment would dominate or
relate to their retrospective assessments? Would the order of the task or procedure have
an effect on retrospective assessments? The answers to these questions would be
beneficial to usability testers, as well as web designers. Also, such information might
help web customer retention specialists, to encourage users to visit a website, targeting
those moments that might increase the web users overall enjoyment.
The next section looks at the possible implications of the peak–end rule on standard
web-evaluation methods. It focuses on retrospective assessments of web experiences,
based on questionnaire evaluation. Also, it discusses the tools used in recording real-
time emotion, and their possible use in the current research.
2.3 Web usability evaluation
According to Kantner and Rosenbaum (1997) “Heuristic evaluations are an expert
evaluation of a productorsystem’’.Theseevaluationsinclude information systems and
documentation. They are carried out by usability specialists, or domain experts, or
preferably what are known as “double experts’’, who consider both domain and
usability experience. This research did not investigate heuristic evaluations; it examined
a questionnaire method, within laboratory experiments.
Laboratory experiments have been used by human-computer-interaction (HCI)
psychologists to test the user-computer interface, evaluate computer usability, and

Literature review
54
improve the level of understanding of usability. The laboratory experiment is one of the
methods of gathering usability behavioural data; others used in the HCI field can be
summarized as follows (Landauer, John et al. 1989):
Observational task analyses
Involvement of users in redesign
Prototype and "beta" testing – including participant observer style studies
Field trials
User surveys
Like any other method, the laboratory experiment has its advantages and disadvantages.
Because of the high level of complexity of the HCI experiment, studies in the real
environment are difficult- , and in some cases impossible to implement, therefore the
main advantages of this method are the high degree of convenience and control. At the
same time, lab studies are not able to capture all the factors that will influence the
usability test in the real world (Landauer, John et al. 1989).
Usability evaluation of a web application is a hard task, (Danuta and Franklin 1999).
Usability testing is an invaluable tool for evaluating websites, and becomes an integral
partofawebsite’sdevelopmentprocess, andevolution (Battleson, Booth et al. 2001).
To deliver an efficient product, and increase the productivity, designers must consider
user requirement during the usability test. Current approaches to web usability

Literature review
55
evaluation are: questionnaires, behavioural observation and automatic evaluation tools
(De-Marsico and Leviald 2005).
User questionnaires are one of the most common methods used to evaluate interfaces
and web experiences. They aim to assess user perception and provide the user point of
view. From a quantitative stance, it is important that questions are well formulated for
the evaluation. Results based on Likert scales may be well managed and summarized,
while answers entailing open responses could be more detailed, but harder to analyse.
This research used the Likert scale for participants to report their retrospective
assessments of enjoyment: a scale of -5 to 5 (De-Marsico and Leviald 2005).
Behavioural assessment techniques are being used for testing usability, based on
psychological considerations. Subjective satisfaction (`enjoyment` in this research)
expressed in questionnaires, could differ from that suggested by actual behaviour. The
aim of this research is to better understand the variation between assessments reported in
questionnaires using Likert scales, and the actual online browsing behaviour.
Automatic evaluation tools provide an evaluator with software support for evaluation.
As discussed in the section concerned with emotion on the web, human aspects could be
anything from thoughts, to perception (Wang, Hawk et al. 2000). Not all tools touch on
all the possible aspects of real-time or retrospective evaluation. Simple tools are used to
capture and record data. There are some other tools that can even perform an analysis.
These tools can provide solutions to usability problems. Would a tool help in attempting

Literature review
56
to determine whether or not there is a replication of the peak-end rule in web
experience? Is it possible to record people’s emotion, using a simple automatic tool?
Zhang and Dran (2000) proposed a two-factor model of website design and evaluation,
based on the Herzberg two-factor model on job satisfaction. According to their model,
Zhang and Dran suggested that there are two types of website design factors, which they
called hygiene and motivator. The presence of `hygiene` factors results in a functional
and serviceable website; but their absence causes user dissatisfaction. `Motivator`
factors are those that add value to the website by contributing to user satisfaction. Their
experimental findings suggested that enjoyment, cognitive outcome and credibility were
clearly identified as motivators. These factors are aligned with ``individual interaction
with a website, rather than the website itself ``. This supports the findings of Chen,
Wigand et al. (1999) in that 81% of their respondents reported that they had experienced
enjoyment. This is promising in terms of the direction of the current research; attempting
to capture web user enjoyment.
Usability testing involves studying a website or interface in real life situations, while
evaluators are gathering data on problems that arise during a test. Within these
experiments, users were sometimes asked to perform a certain set of tasks, and at other
times given an open task. Users were asked to use a simple automatic tool that had been
specially designed for this research; to self-assess their level of enjoyment during the
browsing experience. The tool was customised according to the design of each
experiment, and was called the current enjoyment tool (CET).

Literature review
57
2.3.1 Possible implication of peak-end rule
Most web evaluators ask their participants to report their web experiences. When
website researchers and practitioners measure emotion, they ask their participants to
assess their emotional experience using an open task, or set of tasks that vary according
to the experimental set up. The reports are assumed to be built on an accurate recall of
the experience; but are these retrospective assessments accurate?
A growing number of researchers believe that participants completing questionnaires
that require global responses result in biased reports of their actual experiences. This
process requires participants to remember, summarize, and integrate their past
experiences. The process of recalling information is reconstructive. There is plenty of
evidence within the literature, looking at cognitive structures, implicit theories and
motivations related to recollection; that there is ample opportunity for imprecision
(Nisbett and Ross 1980; Ross 1989; Fiske and Taylor 1991; Greenwald and Banaji
1995).
The opinion of researchers is divided, in that some believe that recall-based
information is reconstructed, while others believe it is retrieved from memory. Many
researchers agree on a moderate reconstructive view, that respondents depend on both
processes to produce recall-based ratings (Barrett 1997). As discussed earlier, this
research tests whether the peak- and end enjoyment moments would predict
retrospective assessments better than the average of all real-time ratings. The answer of

Literature review
58
the main research question of this study would help better understand the nature of web
user emotion. It is believed that it would give usability evaluators a better understanding
of the important momentary emotions, in particular enjoyment, which may have an
influence on the retrospective assessments required in a standard questionnaire
evaluation. Understanding the rules that web browsers follow when they judge their web
experience is crucial for usability testers, user experience analysts and web designers.
2.3.2 Possible implication of task/content order
The effect of altering the order of the tasks/ content on retrospective assessment is the
second research question of this study. It was assumed that reversing set of tasks or
content (to be less andmore pleasurable)would alter the participants’ assessments of
enjoyment. It was predicted that increasing enjoyment towards the end of a web
browsing experience would be perceived as being more enjoyable overall, than
decreasing enjoyment, when the experiences were equally weighted. If this process to be
the case, then usability testers will need to pay more attention to the order of their
experimental tasks or procedure. Furthermore, user-experience practitioners and web
retention officers could use this information to increase the level of enjoyment of their
participants, by simply changing the order of things; thereby increasing the chances of a
browser revisiting the website.

Literature review
59
2.3.3 Possible implication of altering the duration of a browsing
experience
The nature of the relationship between the duration of a procedure and its retrospective
assessment is the third research question of this study. Kahneman and his colleagues
have dedicated a number of experiments the testing of duration neglect and validation of
dominance. Due to the lack of resources and time, this research did not investigate
violation of dominance (adding a period of pleasure to the end) and did not investigate
duration in detail; rather it monitored the relationship between procedure (browsing)
duration and retrospective assessment. This will help prepare the ground for future
studies. Itwill indicate the importanceofproceduredurationonpeople’s assessments
within web experiences and laboratory experiments. It assumes that if time has a
significant impact on assessments, then usability testers and user-experience
practitioners will have to be more careful regarding the length of a procedure, within the
experiential design process.

Experiment1
60
Chapter 3 Experiment 1
3.1 Introduction
The main objective of Experiment 1 was to test for any effects of the presence of the
current enjoyment tool (CET) and task order on participants’ overall assessment of
design and enjoyment. The experiment was also designed to test the validity of the peak-
end rule.
The experiment involved four groups. Group 1 and Group 2 participants performed the
same easy-to-hard (E-H) task order; Group 1 provided real-time enjoyment ratings, but
Group 2 participants did not. Group 3 and Group 4 performed the tasks in the reverse
order hard-to-easy (H-E); Group 3 providing real-time ratings, and Group 4 providing
only retrospective assessments of web site design quality and enjoyment. This was so
designed in order to test for any influence of the CET and the task orderonparticipants’
retrospective assessments.
Simple and comprehensive tools are used in the Human Computer Interaction field to
help designers and usability testers better understand the interaction while it takes place.

Experiment1
61
In the design process of this experiment a simple tool was developed (see Chapter 3,
Design and material section for more details on the current enjoyment tool (CET)) to
obtainparticipants’real-time enjoyment ratings. It is hard for a simple tool like the one
developed here to touch on all cognitive aspects. The CET of this experiment was
developed to capture the enjoyment that results from browsing experiences. At this point
it was not known whether people would be able to express their emotion, and whether
using the CET would alter their judgments; therefore the design of this experiment
involved four groups, two of which used the tool and the other two did not, later
ANOVAs testswere conductedbetween the fourgroups’ retrospective assessments to
test for any tool effect.
Participants in Group 1 and in Group 3 were asked to provide real-time enjoyment
ratings during the assigned web tasks. After completion of the first four tasks, which
were considered to be easy for Group 1 (E-H) and hard for Group 3 (H-E), participants
of both groups were asked to provide their retrospective assessment of design and
enjoyment. Afterwards, the participants of each of these groups were asked to carry on
with the last four tasks, and were then requested to provide their retrospective
assessments of the last four tasks. This meant that each participant provided
retrospective assessments of design and enjoyment twice; after the first four tasks and
after the last four tasks.
For clarification, we named the first four tasks for Group 1 (E-H) and the last four tasks
in Group 3 (H-E) the easy block tasks. Likewise, the last four tasks of Group 1 (E-H)
Experiment1
62
and the first four tasks of Group 3(H-E) were named hard block tasks. The easy block
and hard block tasks were used to compare the real-time rating of the two groups: the
correlation and regressions of real-time ratings are shown in the results section. The
same easy- and hard block method was applied for Group 2 and Group 4. The only
difference was that participants of these groups did not provide any real-time ratings in
ordertotesttheoftheeffecttoolonparticipants’judgmentsandtimecompletion.
This experiment used closed tasks (a set of eight tasks) that used the number of links to
reach a task answer, so as to manipulate the increasing and decreasing of enjoyment in
order to test if there was any significant difference in retrospective assessments of
enjoyment;usingANOVAtests.ThiswasinspiredbyAriely’sreviewonthepeak-end
rule discussed in the literature review in which he proposed that decreasing pain towards
the end of experiences would result in higher overall judgments than increasing pain
towards the end; when both experiences are weighted the same. This study investigated
pleasure experiences on the web; it tested the effect of increasing and decreasing
enjoyment on retrospective assessment.
Duration neglect is an aspect of peak-end rule that suggests that duration has little or no
effect on people’s judgments. In this experiment, the relation between the set of easy
tasks (less links to reach the answer) and duration is assumed to be less than for the set
of hard tasks (more links to reach a task answer). This is because people might perceive
easy tasks as being more enjoyable than hard tasks. It is still not clear whether the

Experiment1
63
number of links or clicks required to reach a task answer would work, but at this stage
and due to the lack of resources this seemed to be the right thing to do.
The main hypotheses of this study are as follows:
H1: The current enjoyment tool would not alter participants’judgments.Theremightbe
a time difference between those who would use the tool and others who would not.
H2: The difference between easy and hard tasks might be greater in the second block,
when they are defined by a contrast with a harder or easier set of tasks.
H3: The retrospective assessments of enjoyment would be higher for Group 3 and
Group 4 that perform the tasks in (H-E) task order than for Group 1 and Group 2 (E-H).
H4: Duration of experimental procedure might affect judgments; time matters more in
hard tasks than easy tasks; assuming people would enjoy easy tasks more.
The experiment was task-oriented and participants had to perform the tasks assigned to
them. The order of the tasks and CET use was manipulated, as explained earlier, to
better understand the effect of task order, as well as that of CET presence or absence on
participants’retrospectiveassessmentsofwebsiteenjoyment.
This experiment tested whether enjoyment could be controlled by manipulation of the
order of task difficulty. The method used to manipulate task difficulty was based on the
number of links required to reach a task answer. This method enabled the testing of the
correlation between the number of links, and task difficulty. If the task answer required

Experiment1
64
one or two links, it was considered to be an easy task. If the answer required three or
four links, it was considered to be a medium difficulty task; and if the answer required
five or more links, it was considered to be a hard task.
Task difficulty was related to task completion time; and it was assumed that tasks which
took time were more difficult than those that were conducted in less time.
This chapter is organised as follows:
introduction of the eight tasks of this experiment
presentation of the design and materials, in term of the groups and statistical tests
performed
outline of the procedure of the experiment
discussion of the finding
summary of the experiment
3.2 The task
The study used a set of eight information-seeking tasks, each consisting of a question:
the answer to which could be found on the Website of the American National Institute
of Health (NIH: http://www.nih.gov/). The site was considered to be similar to the
Website of the UK National Health Service, and was chosen in order that there should
be a high likelihood of the participants sharing the same level of prior experience with

Experiment1
65
the specific site; in other words, working on the assumption that participants had not
used this website before.
During the process of designing the tasks of this experiment, the challenge was to find a
way to define the level of difficulty of each task. The method used was based on the
number of links which the participant had to go through, in order to reach each task
answer. That is, the fewer the links; the easier the task.
The tasks were:
1. Find the NIH mission
http://www.nih.gov/about/index.html#mission
2. Find the NIH contact link
http://www.nih.gov/about/contact.htm
3. Find the NIH events calendar
http://calendar.nih.gov/app/MCalWelcome.aspx
4. Find the NIH budget statement
http://officeofbudget.od.nih.gov/ui/HomePage.htm
5. Find the NIH virtual career centre
http://www.training.nih.gov/careers/careercenter/
6. Find the NIH online journals.

Experiment1
66
http://nihlibrary.nih.gov/ResearchTools/default.htm?srchType=OnlineJournals
7. Find the calendar of all upcoming SIG meetings
http://tango01.cit.nih.gov/sig/schedule.taf
8. Find Smith Jonathan (contractor) email address.
http://ned.nih.gov/search/search.aspx
According to the definition outlined earlier, the first four tasks were classified as easy
(E), while the last four tasks were classified as hard (H).
3.3 Design and materials
The participants in each of the four experiments used the CET to monitor the level of
real-time enjoyment experienced on the websites. In Experiments 1, 2, 3 and 4, there
were respectively 20-, 40-, 20- and 30 participants, providing real-time enjoyment
ratings. All of the participants in Experiment 1 provided retrospective assessments of
design and enjoyment, but not real-time ratings. The Tool was programmed to record
participants’enjoymentratingsin text file in the university P drive directory2. The file
was named `values.txt`, and included participant enjoyment value, and the system time
in which it occurred.
`Excel` was used to identify initial-, peak-, end-, average- and total enjoyment moments
and record the duration of the procedure for each of the participants of the four
2 P drive is the university of Manchester virtual hard desk allocated to students. This was used to store
real-time enjoyment ratings.

Experiment1
67
experiments. As illustrated in Figure 3-1, initial enjoyment was considered to be the first
enjoyment rating; peak enjoyment was identified using the ` MAX` formula in Excel;
and the last enjoyment rating was set to be end enjoyment: therefore it was not included
in the peak formula moment. Further, average enjoyment moments were identified
using the average formula command in Excel, while total enjoyment moments were
simply identified using the sum formula command in
Excel of all real-time ratings provided by each participant.
Figure 3-1 Initial-, peak- and end enjoyment of website experience on scale of 0-100 throughout
browsing session
The overall experiment procedure duration was calculated, using Excel. It was assumed
that:
Overall procedure duration= End system time- Start system time
[Equation 1]
Furthermore, it was assumed that:
Enjoyment rating time = enjoyment value-system time – system start time
[Equation 2]
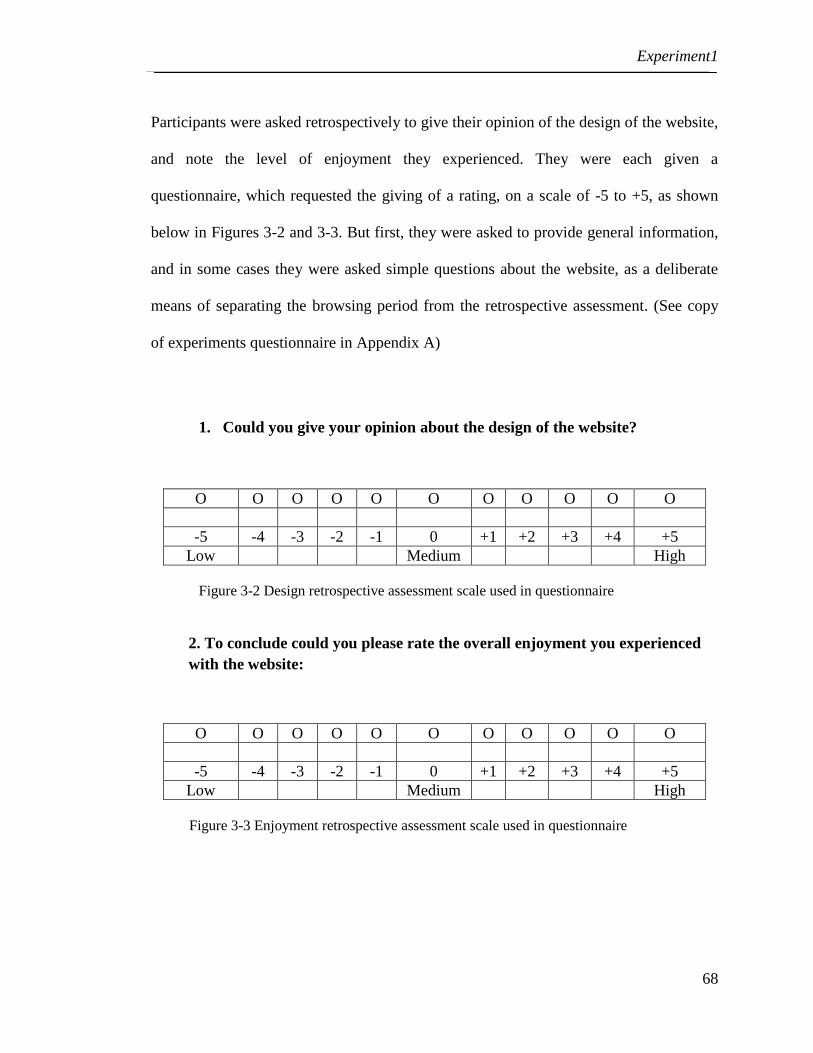
Experiment1
68
Participants were asked retrospectively to give their opinion of the design of the website,
and note the level of enjoyment they experienced. They were each given a
questionnaire, which requested the giving of a rating, on a scale of -5 to +5, as shown
below in Figures 3-2 and 3-3. But first, they were asked to provide general information,
and in some cases they were asked simple questions about the website, as a deliberate
means of separating the browsing period from the retrospective assessment. (See copy
of experiments questionnaire in Appendix A)
1. Could you give your opinion about the design of the website?
O O O O O O O O O O O
-5 -4 -3 -2 -1 0 +1 +2 +3 +4 +5
Low Medium High
Figure 3-2 Design retrospective assessment scale used in questionnaire
2. To conclude could you please rate the overall enjoyment you experienced
with the website:
O O O O O O O O O O O
-5 -4 -3 -2 -1 0 +1 +2 +3 +4 +5
Low Medium High
Figure 3-3 Enjoyment retrospective assessment scale used in questionnaire

Experiment1
69
Spearman correlation coefficient tests were performed, to test the relationship between
real-time enjoyment moments, and retrospective assessment. It was assumed that the
data was non-parametric. Furthermore, two-way tests between subjects, `ANOVA`, were
conducted, to test the difference between the groups in experiments 1, 2 and 4. A t-test
was performed, to assess the difference between the groups in experiment 3.
Multi-linear regressions were performed, to test peak-end rule adequacy for all 4
experiments. Two models were used; simple and comprehensive. The simple model
included only peak- and end enjoyment, as predictors of retrospective assessments. On
the other hand, comprehensive models included 4 additional predictors; initial-, average-
and total enjoyment; in addition to duration. Adjusted R2 of each model was reported as
model success and the significant difference between the two models was reported, in
the cases where it occurred. This method was performed by Daniel Kahneman and his
colleagues in their study on medical procedures. This research tried to replicate the
method, in terms of website user experience.
This research investigates the relationship between a real-time web browsing experience
and its overall assessment. In theory the way that such an experience is perceived could
be strongly influenced by any single moment. The browsing experience is dynamic,
which makes this a complex field of study. In order to avoid the disruption of an
experimental procedure, the number of times that a person should be required to make a
real-time rating needs to be reduced to a workable minimum. With this in mind, for the

Experiment1
70
purposes of this research, the assessment was divided into six factors: initial-, average-,
peak-, end-, and total enjoyment; as well as the duration of the procedure.
Looking at the influence of the initial moment on the overall assessment of an
experience is not new. This phenomenon has been studied and discussed extensively, so
it was felt important to include this factor, in order to test its effect in the web
environment. The continuous debate between summary evaluation researchers as to
whether the average of every single moment of a certain experience is a better predictor
than the peak and end moments was the main motive for including the average of all
real-time enjoyment moments in the comprehensive model. The measures of peak and
end enjoyment were included in the comprehensive model, due to the increasing amount
of research highlighting their efficacy as predictors of retrospective assessment. The
total or sum of all real-time moments was the fifth factor. This factor was of benefit in
comparing the whole and varied experiences of the participants; within an homogeneous
environment.Theeffectofdurationonpeople’sassessmentsofthewebprocedurewas
considered to be important, in order to see whether or not the notion of duration neglect
would hold within a web experience; and to form a better understanding of time and
flow in this environment. These factors are widely recognized in the field of psychology
and have been much used in the measure of experience, following the seminal work of
Redelmeier and Kahneman (1996).

Experiment1
71
At first it was necessary to test whether providing real-time ratings would alter
participants’experience; in other words the null hypothesis. Therefore, another version
of the tool was developed; however, it did not include the real-time rating slide-bar (see
Figure 3-4 and Figure 3-5). In this experiment, Group 1 and Group 3 reported real-time
ratings, while Groups 2 and 4 performed the same procedure, without providing real-
time ratings. Groups were selected by the experimenter at the beginning of the
experiment.
The tool also included tasks to be performed by participants according to the task order
(easy-to-hard or hard-to-easy (E-H or H-E)) and real-time rating availability (with the
tool or without the tool). For instance, if a participant was conducting the easy-to-hard
(E-H) order with the tool (which was a Group 1 condition) the participant was instructed
to press the start button, to begin the task search. Once the task was completed, she was
monitored and instructed to proceed to the next task, by pressing on the next button.
After the first 4 tasks, she was asked to fill in the first questionnaire, to provide
retrospective assessment of the design and level of enjoyment of the completed series.
On completion of the series the participant was required to press the finish button’ to
terminate the use of the enjoyment tool, and proceed to the second questionnaire, in
order to provide retrospective assessment of the design and enjoyment; again,
considering the second series of four tasks performed3.
3 Note that this is an example of experiment procedure performed by a participant on the nih.com experiment. Please
refer to Chapter 4 Experiment 1 Procedure section (below) for more details.

Experiment1
72
Figure 3-4 Experiment1 Current enjoyment tool used by participants to report real-time ratings,
including task presentation
Figure 3-5 Experiment 1 Current enjoyment tool without the real-time ratings slide bar,
providing only task presentation
A 22 between-subjects design was used, with tool use and task order as between-
subjects variables.
Group1 and Group 2 performed tasks in the easy-to-hard (E-H) order, but only group 1
used the current enjoyment tool (CET) to record their real-time enjoyment ratings.
Group 3 and Group 4 performed the tasks in the hard-to-easy (H-E) order, but only
Group 3 used the CET to record their real-time enjoyment ratings. In this way, the

Experiment1
73
effects of the task order and the use of the CET, on the retrospective assessments of both
the hard and easy tasks, could be tested.
The retrospective assessments of enjoyment and website design quality of the `easy`
tasks were obtained after the first block of tasks for Group 1and Group 2 (E-H), but after
the second batch of tasks for Group 3 and Group 4 (H-E); the same was the case for the
assessment following the `hard` tasks, but in reverse order for the respective group pairs.
In addition, initial, peak, end, total and average enjoyment ratings were obtained from
the real-time ratings, provided by the participants who used the CET (in Groups 1 and 3)
during their information-seeking tasks. The fact that participants provided their
retrospective assessment of enjoyment and design after each block of tasks, necessitated
the identification of real-time ratings in each instance; as each participant had
experienced two peak enjoyment moments; within the easy-, and the hard task block.
Similarly, each participant would have two real-time end-, initial-, total and average
moment ratings. (In addition, a note was made of the completion times for the hard and
easy tasks).
The easy and hard real-time ratings would later be used in the results section, to
compare real-time ratings and retrospective assessments; and to assess the validation of
the peak-end rule using regression analysis.
Participants were assigned to one of 4 experimental groups, according to their order of
arrival at the laboratory. A note was made of individual participant’s web usage, in

Experiment1
74
terms of hours per week, and number of years’ experience. The experiment was
performed in a lab environment, and was monitored by the experimenter at all times, as
an observer, to ensure that participants followed the right procedure.
3.4 Procedure
Participants were asked to find the answers to the 8 questions on the Website of the
National Institute of Health (NIH). Participants in Groups 1 and 3 were asked to report
their real-time enjoyment level using the CET. The maximum time allowed for each task
was 15 minutes; however, each task search started from the home page of the NIH
website. Each participant’s progress was monitored by the experimenter, and they were
asked to continue the search if they gave an incorrect answer.
After completing the first four tasks, participants were asked to fill in the first
questionnaire, which was concerned with rating the website design and level of
enjoyment. This was the retrospective assessment of the easy task series for Group 1
and Group 2 who were working on the easy to hard task order; and the hard task series
for Groups 3 and 4, who performed the tasks in a hard to easy order.
After completing the final four tasks, participants were asked to fill in a second
questionnaire, which contained general questions about themselves, and the request for
ratings of the quality of the website design, and overall enjoyment of the website,

Experiment1
75
considering the last four tasks. This was the hard task retrospective assessment of Group
1 and Group 2, and the easy task retrospective assessment for group 3 and Group 4.
3.5 Results
This section begins with the identification of the characteristics of the set of participants.
It then looks at taskcompletion time, and tests the effect of theCETonparticipants’
retrospective assessments of the website design, and level of enjoyment. It also
examines the influence of task order on retrospective assessment. Afterwards, it presents
the relationship between easy- and hard task design and enjoyment assessments, and
subsequently the relationship between the ratings of selected easy- and hard real-time
enjoyment moments, for Groups 1 and 3. It goes on to examine the relationship between
retrospective assessments of enjoyment and easy- and hard real-time enjoyment
moments, using two Spearman correlation matrices for Group 1 and Group 3 together.
Further, the section examines the adequacy of the peak-end rule, using multi-linear
regressions. Regression tests were performed for the blocks of easy tasks and the block
of hard tasks.

Experiment1
76
3.5.1 Characterizing the participants
40 students from the University of Manchester agreed to perform the experiment, each
being paid £5 for their participation.
G1 (E-H) G2 (E-H) G3 (H-E) G4 (H-E)
Number of participants 10 10 10 10
Mean age 22 ± 1.944 22.3 ± 1.56 21.8± 2.09 20.4 ± 6.44
% Female 30 40 30 30
Web experience (years) 6.9± 2.33 9.4 ± 1.07 9.3 ± 2.3 9.7 ± 1.56
Weekly web usage (hours) 32.1± 12.33 28 ± 28.27 20 ± 11.26 20.7 ± 12.65
Duration of the procedure 10:28± 2:14 6:05± 1:18 9:14± 3:26 6:41 ± 1:33
Table 3-1 Characteristics of participants in the four experimental groups
Table 3-1 (above) displays the characteristics of participants in the four experimental
groups. Theparticipants’ages ranged between 18 and 40 years (mean = 22.5, sd =3.5).
Of the 40 participants who agreed to perform the experiment, 32.5% were female.
Group 1, Group 2 and Group 4 each included 3 female participants out of 10, while the
4 Values are mean ± standard deviation

Experiment1
77
third group contained 4. The reported web experience of the participants ranged from 3
to 13 years (mean = 8.8, sd =2.1). Interestingly, the maximum web usage per week was
100 hours, reported by the third participant of Group 2 (E-H), who did not provide real-
time enjoyment ratings. The fact that there are only 168 hours in a week makes it hard to
believe that a participant actually spends 100 of them browsing the web. Participants
might have overestimated their weekly hour usage; this topic is interesting enough to
warrant further investigation. The minimum reported weekly web experience was 5
hours. Overall, the 40participants’weeklyusageequatedto: (mean = 25.2, sd =17.6).
3.5.2 Task completion times
Table 3-2 shows the mean task completion times for the two blocks (easy and hard) by
each of the four groups.
Group Easy (min: sec) Hard (min: sec)
G1 (E-H, tool)
3:52 ± 1:23
6:35 ± 2:05
G2 (E-H no-tool) 2:33 ± 0:54 3:32 ± 0:40
G3 (H-E, tool) 3:09 ± 0:59 6: 05 ± 3:22
G4 (H-E no-tool) 2:21 ± 0:56 4:20 ± 1:25
Table 3-2 Experiment 1, the duration of easy and hard tasks, with standard deviation, for the
four groups

Experiment1
78
Inspecting these performance times it is clear that there was the desired manipulation of
difficulty. In each of the four groups the `hard` tasks took longer to complete than the
`easy` tasks.
A three-way (2 x 2 x 2) mixed ANOVA was conducted, with task order and CET
presence as between-subjects factors, and task difficulty as a within subjects factor.
There was a significant main effect of task difficulty (F (1, 36) =30.23, p<0.001, partial
η2=0.456). Although, there was neither significant main effect for the two-way
interaction: (Fs= 0.618 (task order), 2.92 (tool effect); p>0.05), nor there was for the
three-way interactions (order*tool*difficulty) (F= 0.254; p> 0.05). This means that all
four groups completed the easy tasks in less time than the hard tasks.
There was no significant main effect of task order on completion time (F =0.191,
p>0.05). Although there was significant tool effect (F (1, 36) =22.89, p<0.001, partial
η2=0.389) while, there was no interaction effect between the tool and task order (F
=1.58, p>0.05).

Experiment1
79
3.5.3 Retrospective assessments
Table 3-3(below)showstheparticipants’meanretrospectiveassessmentsaccording to
experimental group and task block.
Groups Retrospective
assessments
Easy task block
Mean/standard
deviation
Hard task block
Mean/standard deviation
Group 1 (E-H - tool)
Enjoyment 2.4 ± 1.8 2.1 ±2.7
Design 2.2 ± 1.6 2.1 ± 2.3
Group 2 (E-H- no tool)
Enjoyment 1.7 ± 2.4 2.3 ± 1.0
Design 2.4 ± 1.7 2.1 ± 2.7
Group 3 (H-E – tool)
Enjoyment 2.8 ± 1.3 2.1 ± 1.8
Design 2.8 ± 1.4 2.2 ± 1.1
Group 4 (H-E – no tool)
Enjoyment 1.6 ± 2.0 1.6 ± 1.9
Design 2.2 ± 2.0 2 ± 2.1
Table 3-3 Experiment1 participants’meandesignandenjoymentretrospectiveassessmentsforthefour
groups

Experiment1
80
Design and enjoyment retrospective assessments
The Pearson correlation test shown in Table 3-4 (below) suggests that the retrospective
assessments of design and enjoyment following the easy-and hard block tasks were
strongly correlated for three of the four groups; suggesting that participants perceived
design and enjoyment as being connected. The retrospective assessments of Group 2
hard block were not, however, significantly correlated.
Groups Easy block
Design/Enjoyment
Hard block
Design/Enjoyment
1 0.818** (66.9) 0 .726* (52.7)
2 0.741* (54.9) 0.568 (32.2)
3 0.921** (84.8) 0.905** (81.9)
4 0.888** (78.8) 0.791** (62.5)
Table 3-4 Pearson correlation (% predicted variance in brackets) between retrospective
assessments of design and enjoyment of easy- and hard block tasks (** = p<0.01; * = p<0.05)
Because this relationship has been clearly demonstrated, all subsequent analyses
consider solely the enjoyment ratings. As for performance times, a three-way (2 x 2 x 2)
mixed ANOVA was conducted on the retrospective ratings of enjoyment; with task order
and tool presence as between-subjects factors, and task difficulty as a within-subjects
factor.

Experiment1
81
There was no significant effect of the task difficulty (F = 0.204, p > 0.001) on
retrospective assessments of enjoyment. Furthermore, there was a significant effect for
neither for the two-way interaction (Fs = 1.275 (task order), 3.263 (tool effect), p >
0.05), nor for the three-way interaction (F = 0.051, p > 0.05).
There was no task order, tool effect or interaction between subjects (Fs= 0.029, 0.887
and 0.26, respectively, all p > 0.05).
This means the participants of all groups reported similar retrospective assessments of
enjoyment. There was no significant difference between Group 1 (E-H) and Group 3 (H-
E): both of which performed the tasks using the tool.
Even though the hard tasks took longer than the easy tasks (as shown in the previous
section) this did not affect the retrospective assessment of enjoyment. There was an
effect of the presence of the tool on task duration. The additional time required was
approximately 3 minutes.

Experiment1
82
3.5.4 Real-time enjoyment ratings
Only Group 1 and Group 3 reported real-time ratings. In order to investigate the
relationship between peak- and end enjoyment ratings, and all other real-time moments
and retrospective assessments, Spearman correlation tests were conducted; as it was
assumed that ordinal level data was collected.
Real –time enjoyment mean/ standard deviation
Group G1( E-H) G3 (H-E)
Peak Enjoyment 77.8 ±20.67 87.2 ± 17.98
Initial Enjoyment 50.6 ±13.91 64.6 ± 23.18
End Enjoyment 56.9 ±33.37 79.8 ± 31.44
Average Enjoyment 52.32 ±14.81 62.15±16.17
Total Enjoyment 435.7 ±130.65 503.7 ±147.98
Table 3-5 Mean and standard deviation of several summary aspects of real time rating in groups 1 and 3
Table 3-5 (above) shows the mean and standard deviation of peak-, initial-, end-,
average of all ratings- and total enjoyment for groups 1 and 3.
The mean values of real-time enjoyment were identified from all eight tasks. The two
sets of tasks (easy and hard) were not separated in table 4-5, because, as has been

Experiment1
83
demonstrated in the previous section, there was no discrepancy between the
retrospective assessments of the easy and hard tasks.
Of the Group 1 participants, 80% reported peak enjoyment during the first four tasks,
which were designed to be easy. From Group 3, 70% of the participants reported peak
enjoyment during the last four tasks, which were identical to the first four tasks of
Group 1; however, in Group 3, they were presented at the end.
These ratings showed that users experienced moments of considerable enjoyment during
the experimental procedure (see Table 3-5). Overall 20% of Group 1 participants (E-H
with tool) and 50% of Groups 3 participants (H-E with tool) reported an enjoyment
score of 100, which was the maximum score, at least once.
Two correlation matrices were constructed. The first matrix presents the Spearman
correlation coefficient between the easy block real-time ratings and retrospective
assessments of enjoyment for Groups 1 and 3 combined, since there was no difference
foundbetweenthetwogroups’retrospectiveassessments,despitealteringthetask order.
The second matrix presents the correlations of the same groups, but between the hard
block real-time ratings and retrospective assessments of enjoyment.
Easy block real-time ratings:
Table 3-6 (below) demonstrates the analysis of data for the real-time and retrospective
ratings of the easy block tasks. Most of the real-time ratings seemed to be correlated
with each other. Average- and total real-time ratings were found to be correlated with

Experiment1
84
retrospective assessment (p < 0.01). Also, peak- and end real-time ratings significantly
correlated with retrospective assessment of enjoyment.
Easy-
peak
Easy-
end
Easy-
average Easy-
total
Easy-
initial
Easy
Retrospective
Enjoyment
Easy-
duration
Easy-peak 1 0.846** 0.725** 0.725** 0.616** 0.488* 0.452*
Easy-end 0.846** 1 0.810** 0.810** 0.679** 0.529* 0.331
Easy-
average 0.725** 0.810** 1 1.00** 0.840** 0.572** 0.160
Easy-total 0.725** 0.810** 1.00** 1 0.840** 0.572** 0.160
Easy-
initial 0.616** 0.679** 0.840** 0.840** 1 0.437 0.346
Easy
Retro-
enjoyment
0.488* 0.529* 0.572** 0.572** 0.437 1 0.172
Easy-
duration 0.452* 0.331 0.160 0.160 0.346 0.172 1
Table 3-6 Correlation matrix showing the relationship between the various characteristics of the moment-
by-moment ratings of the easy task blocks of Groups 1 and 3
The correlation of the average and total values of the easy task block with the
retrospective assessments of enjoyment is similar. This is due to the fact that each of the
participants has rated four times (once per task). This is not the case for the block of
hard tasks due to the variation in the number of real-time ratings of each task. Some
participants rated a single task more than once. The number of ratings varied between a
minimum of four- and a maximum of six times for the block of hard tasks.

Experiment1
85
Hard block real-time ratings:
Table 3-7 (below) shows that the peak and end did not statistically significantly
correlate. However, both moments strongly correlated with retrospective assessment of
enjoyment; with the peak being slightly more so, at the p<0.01 level.
Peak and end moments were found to be correlated with retrospective assessments in
both matrices. The average real-time ratings for the easy tasks significantly correlated
with retrospective assessment of enjoyment, while for the hard tasks it did not.
Hard-
peak
Hard-
end
Hard-
average
Hard-
total
Hard-
initial
Hard-
Retrospective
-enjoyment
Hard-
duration
Hard-peak 1 .438 .669** .733** .393 .719** -.212
Hard-end .438 1 .489* .524* .067 .512* .052
Hard-
average .669** .489* 1 .859** .551* .361 -.517*
Hard-total .733** .524* .859** 1 .549* .528* -.424
Hard-initial .393 .067 .551* .549* 1 .324 -.370
Hard-
Retrospective
-enjoyment
.719** .512* .361 .528* .324 1 .186
Hard-
duration -.212 .052 -.517* -.424 -.370 .186 1
Table 3-7 Correlation matrix showing the relationship between the various characteristics of the moment-
by-moment ratings of the hard task blocks of Groups 1 and 3.

Experiment1
86
In the easy task block the peak moment significantly correlated with the duration of the
procedure. In the hard task block only the average of all real-time ratings significantly
correlated with the duration of the procedure. No other real-time moments of either
matrix statistically correlated with the duration of the procedure. This result might be
linked to the duration neglect proposed by Kahneman. There is still not much evidence
of duration neglect in relation to web experience, but these results might be an
indication of such. More research needs to be conducted with regard to this matter.
A (2 x 2) ANOVA was conducted, with task order and task difficulty as ‘between
subjects’ factors for the peak, the average of all real-time ratings and end enjoyment
moments of Groups 1 and 3.
There was a significant effect neither of task order nor task difficulty on peak real-time
enjoyment (Fs = 1.36 (task order), 1.82 (task difficulty); p > 0.05). Neither was there a
significant interaction between these two factors (F = 0.002; p > 0.05).
Also, there was no significant effect on the average of all real-time ratings by either of
these factors (Fs = 2.061 (task order) p > 0.05, and 4.01 for (task difficulty) p = 0.053
(the p value is almost significant) although there was no significant interaction (F = 0.92
p > 0.05).
There was no significant effect of the task order on end enjoyment moments (F = 0.004,
p > 0.05). On the other hand, there was a significant effect of the task difficulty (F (1,
36)=5.079;p<0.05;partialη2=0.124). Additionally, there was a significant interaction

Experiment1
87
between the task difficulty and task order on the end enjoyment moment (F (1, 36) =
4.238;p<0.05;partialη2=0.105). The p value = 0.047 which is considered to be small
but significant.
The (2 x 2) ANOVA was conducted on real-time ratings, to give a better understanding
of the effect of task order and task difficulty on particular real-time moments (peak,
average of all ratings and end enjoyment moments). There was no significant difference
found between the easy and hard blocks for the peak and the average of all real-time
enjoyment ratings.
On the other hand, the difference between easy and hard blocks was greater for Group 3
than for Group 1 with regards to end real-time enjoyment. The easy block end
enjoyment mean value = 58.7 and the hard block mean value = 56.9 for Group 1 (E-H);
while the easy block end enjoyment mean value = 77.1, and hard block end enjoyment
mean value = 37.3 for Group 3(H-E). This could be attributed to the sense of relief in
going from the more difficult- to the less demanding tasks, or perhaps due to the fact
that the participant becomes more adept at the procedure, due to the experience gained
in undertaking the more difficult tasks.

Experiment1
88
3.5.5 Regression tests of the peak-end rule
In order to test the main research question, and further investigate whether peak and end
enjoyment moments were equally adequate predictors as the average of all enjoyment
ratings and other moments put together; multi-linear regressions were conducted. Two
models were compared, following the method applied by Donald Redelmeier and Daniel
Kahneman when working on their paper on colonoscopy (Redelmeier and Kahneman
1996).
The first linear model was named the simple model, which comprised peak enjoyment-
and end enjoyment rating, as recorded by the twenty participants in Group 1 and Group
3. The second linear model, called the comprehensive model, was composed of the
following predictors: peak-, end- and initial enjoyment, average enjoyment of all ratings,
total enjoyment and duration of procedure. (Table 4-8 (below) shows R2 of the two
models).
Two regression tests were performed; one for the hard set of tasks, the other for the easy
set. The first row of the table below compares the simple- and comprehensive model
prediction of the retrospective assessment of enjoyment of the easy tasks. Likewise, the
second row compares the predictions for the hard tasks.

Experiment1
89
Participants’assessments 5
( Easy/Hard block)
Simple
(Peak-End)
Comprehensive
(Initial-Peak-End-Total-
Average-Duration)
Easy retrospective
assessments of enjoyment
0.464
0.478
Hard retrospective
assessments of enjoyment
0.695 0.775
Table 3-8 Regression from simple and comprehensive models- tasks retrospective assessment of easy
and hard tasks
Easy block regression:
Table 3-8 (above) confirms that for the easy set of tasks, there was no significant
difference between the predictions of the two models: the F change value = 0.123, p =
0.945 > 0.05. This result suggests that peak and end moments could predict
retrospective assessments of enjoyment as adequately as all moments integrated,
including peak and end moments.
5 Values are R
2 of prediction success of each model.

Experiment1
90
Hard block regression:
Again, for the hard set of tasks there was no significant difference between the simple
and comprehensive model predictions of retrospective assessment of enjoyment: the F
change value = 1.155; p = 0.375 (> 0.05). This result supports that found in the easy
block regression; that peak and end real-time enjoyment moments were able to
adequately predict retrospective assessment of enjoyment.
Model
Standardized
Beta Coefficients
Simple model
Easy_Peak
0.581
Easy_End 0.112
Comprehensive model
Easy_Peak 0.291
Easy_End 0.062
Easy_Total 0.504
Easy_Initial -0.263
Easy_Duration 0.128
Table 3-9 Experiment 1: easy block tasks - standardized Beta coefficients of the two models as
predictors

Experiment1
91
Model
Standardized
Beta Coefficients
Simple model
Hard_Peak
0.747
Hard_End 0.156
Comprehensive model
Hard_Peak 0.774
Hard_End 0.092
Hard_Average -0.581
Hard_Total 0.642
Hard_Initial -0.033
Hard_Duration 0.202
Table 3-10 Experiment 1: hard block tasks - standardized Beta coefficients of the two models as
predictors
Table 3-9 and Table 3-10 show the standardized Beta coefficient of the easy and hard
task blocks. The values in the tables illustrate the contribution of the calculated moments
of enjoyment in predicting the overall enjoyment; in both models.

Experiment1
92
3.6 Discussion
This experiment attempted to investigate the relationship between real-time ratings and
retrospective assessments, by monitoring and recording participants’ real-time
enjoyment while performing specific information-seeking tasks. At the same time it
tried to understand the effect of changing the task order, and the current enjoyment tool
(CET).
The results have shown that the CET used by half of the participants did not influence
their judgment. This was encouraging in terms of the planned future use of the tool. The
results also indicated that neither task difficulty nor task order affected retrospective
assessments of design and enjoyment.
In order to test the task order effect on retrospective assessments, it was necessary to
establish a method to control task order. This experiment tried to connect task difficulty
with task performance, and the task completion time was used as an indicator of task
difficulty. The findings of this experiment have shown that there was a significant
difference in the level of difficulty of tasks; people completed the block of easy tasks in
less time than they did the hard tasks. However, the three-way ANOVA that was
conducted between retrospective assessments of enjoyment of the hard and easy tasks
has shown that there was no significant difference. This means that both sets of tasks
were retrospectively similarly rated. This result was unexpected as it was assumed that
the task order would have an effect on retrospective assessments. Perhaps the findings

Experiment1
93
were due to a somewhat `leaky` controlling of task difficulty which was based on the
number of links required to reach a certain task answer. On the other hand this could
also be linked to duration neglect, which is the part of the peak end rule that suggests
that time has little or no effect on people’s judgments. The fact that there was no
significant difference found between the retrospective assessments of enjoyment, but
there was a significant time difference between the easy and hard tasks completion time;
suggests duration neglect.
The number of links required to reach a certain task answer was not a successful method
of determining the flow of enjoyment within the website experience. Gwizdka (2009)
suggested that one of the difficulties that web-searchers encounter, within the
information search process, is related to the cognitive or mental state of the user being
affected by the search system or task itself. He added that understanding the factors
which add to the user’s cognitive load while on a search task is vital in identifying
search system features, and devising search tasks.(Gwizdka 2009)
Khan and Locatis (1999) found that there was no significant difference between novices
and expert users, in terms of the number of links needed to reach a task answer (Khan
and Locatis 1999). This suggests that it is crucial to understand the cognitive factors that
influenceawebuser’sjudgment. There are several techniques available today to capture
the web user emotional state, such as: search observation, search report (questionnaires,
think-aloud recordings and post-search interviews) and dual task techniques. There are
also external devices that can provide additional information regarding a web user; for

Experiment1
94
instance, eye tracking, a pressure-sensitive mouse and a variety of physiological sensors.
This experiment attempted to capture real-time enjoyment using the current enjoyment
tool as described earlier. It was clear that determining the number of links required for
each task was not an accurate method of controlling enjoyment on the web. There was
no consideration given to the cognitive factors that might have an influence on user
enjoyment. Task difficulty was defined by the time required for its completion, and the
performance of the user; not by user opinion. User-opinion of website enjoyment was
taken into account in the design process for Experiment 3.
The analysis of real-time ratings revealed some interesting findings. As demonstrated by
the correlation matrices, the peak- and end real-time enjoyment were significantly more
closely correlated with retrospective enjoyment, than were the average of all ratings; for
the hard block tasks. However, the easy block correlation matrix shows that the average
of all real-time ratings was slightly better correlated than peak and end ratings, with
retrospective assessment of enjoyment.
The regressions of both the easy- and hard block tasks were confirmatory of the effect of
peak and end real-time moments. The results of each block of tasks have shown
evidence in support of the peak end rule, as proposed by Daniel Kahneman and Donald
Redelmeier, in that peak and end moments were able to predict participants’
retrospective assessments as well as all the rated moments integrated.

Experiment1
95
3.7 Summary of Experiment 1
The experiment results have shown that the current enjoyment tool (CET) did not
influence the participants’ judgment. This was encouraging in terms of the proposed
future use of the tool. The results also indicated that neither task difficulty nor task order
influenced the retrospective assessment of design and enjoyment.
There was a significant correlation between real-time ratings and retrospective
assessments of enjoyment for both sets of tasks. For the `hard` tasks, the peak and end
correlations with retrospective assessment were statistically (p<0.05) stronger than those
of the average of all real-time enjoyment ratings (which did not statistically correlate
with retrospective assessment). For the `easy` tasks, the average rating was slightly
better correlated with the retrospective assessment of enjoyment (p<0.01) although peak
and end moments were still found to be significantly correlated (p< 0.05) with the
duration of the procedure in the easy task block. There was no significant correlation
found between the duration of the procedure and retrospective assessment of enjoyment
for either block of tasks. This result supports duration neglect found by Daniel
Kahneman.
The attempt to manipulate the flow of enjoyment (task order) by controlling the level of
difficulty of the tasks was not successful. It was hoped that the number of links required
to complete each task would have an effect, but it appeared not to do so. One reason
might be the preference of hidden cognitive factors; in other words, what one participant

Experiment1
96
considered to be easy, another did not. Participants were not involved in the design
process of this method, which might be another reason for its failure. In Experiment 3
and 4, we have tried to implement this concept.
To briefly recap:
Tooldidnotinfluenceparticipants’assessments.
There was a tool effect on overall duration; estimated time cost was 3 minutes.
Peak-end enjoyment predicted retrospective assessments as well as all other
moments combined, including average of all real-time enjoyment ratings
Variation of task difficulty, demonstrated by differing completion time, had no
significant effect on retrospective assessment.
Duration of both easy and hard tasks was affected by use of the tool and
changing task order.
Duration of the easy tasks of the 4 groups was less than that of the hard tasks.
Number of links required for each task did not directly correlate with the level of
enjoyment or ease, so this is not a foolproof method of controlling overall
enjoyment.

Experiment 2
97
Chapter 4 Experiment 2
4.1 Introduction
Experiment 2 (E2) further examined the strength of the peak-end rule for predicting
retrospective assessments of the design and enjoyment of a website. Also, it attempted
to further test the relationship between the duration of the experimental procedure, and
theparticipants’assessments.
It is already known from the previous experiment that peak and end real-time enjoyment
moments managed to predict retrospective assessments, when participants were asked to
a perform fixed number of tasks. The idea of this experiment was to be less prescriptive
in terms of tasks, allowing the participants to have more freedom while browsing for
information. The goal that was set was for participants to plan a holiday to Brazil. The
people were asked to freely browse a holiday-destination website that contained
information regarding Brazil enabling individuals to devise a holiday according to their
own liking. The holiday information-seeking task was chosen, in an attempt to provide a
more enjoyable web-browsing experience; given that people seek pleasure and joy
during their holiday.

Experiment 2
98
The participants were instructed to browse the website, looking for information that they
might consider important for their holiday. The main challenge of the experimental
design was to allow for the variation of experience due to freedom of browsing. The
number of participants was increased to 40, to allow for a more even spread of
experience. The experiment gave people more freedom while navigating through the
website; and the nature of the task was such as to encourage enjoyment and interaction
with the website.
The design of this experiment did not allow for the testing of a task order effect on
retrospective assessments of enjoyment. It was geared to further test the validity of the
peak-end rule within a goal-oriented web-browsing task.
The results of the first experiment demonstrated that the current enjoyment tool (CET)
did not influence participants’ retrospective assessments. The CET was modified by
removing the embedded tasks of the previous experiment, and was used in this
experimenttoobtainparticipants’real-time enjoyment moments, during their browsing
session. Participants were encouraged at the beginning of the procedure to reflect on
their level of enjoyment and to record any changes as and when they occurred
throughout their browsing. Unlike the first experiment, this experiment did not involve
any groups. The 40 participants were assigned the task of organising a holiday to Brazil,
and to report their retrospective assessment of website design quality, enjoyment. Later,
the real-time enjoyment moments such as peak-, end-, average-, total- and initial real-
time enjoyment moments, in addition to the duration of the procedure; were to be

Experiment 2
99
compared with retrospective assessments of design and enjoyment; in an attempt to
better understand peak-end rule in goal-oriented web experiences.
The duration of the procedure was monitored, to be later tested for correlation with the
retrospective assessments of the 40 participants; in order to understand the duration
neglect notion in the web environment. The Spearman correlation test between duration
of the procedure and retrospective assessment of enjoyment would help understand the
nature of the relationship between experimental procedure time and people’s
assessments. This information is valuable to usability testers as well as web designers
and customer retention management officers of the web (CRM); especially for the
retention department.
4.2 The task
The experimental procedure involved a free-browsing activity on the brazil.com
website. To be more specific, participants were asked to browse this website, with the
objective of planning an imaginary holiday to Brazil. In an attempt to ensure the same
level of experience all participants were asked to approach the task in the same way, as
follows:
Imagine that you are going on holiday to Brazil, please browse this website (brazil.com)
for information that you might think is valuable to you for your stay in Brazil.

Experiment 2
100
4.3 Design and materials
The tool used for the `Brazil` experiment was similar to the tool used in the first study;
however, since this experiment involved a free-browsing task, there was no task
included in the tool. A slide-bar, with the values from 0-100, and tagged with low,
medium and high, was developed using visual studio 2005. (See Figure 4-1 below):
Figure 4-1 Experiment 2 current enjoyment tool used in the Brazil experiment
The experiment was designed mainly to further test the usefulness of applying the peak-
end rule to website experience. Spearman correlation tests were conducted, to test the
relationship between real-time enjoyment ratings and retrospective assessments of the
quality of the web design, and level of enjoyment. Additionally, linear regressions were
performed to assess the validity of the peak end rule on the web (using simple and
comprehensive models) as explained in the Chapter3‘Designandmaterials’ section. At
the same time the experiment procedure duration was monitored, to investigate the
concept of duration neglect within web experience.

Experiment 2
101
4.4 Procedure
Participants were asked to freely browse www.brazil.com for not more than 12 minutes
(and not less than 4 minutes) seeking the information needed to plan a holiday trip to
Brazil. During their browsing, participants were asked to give their real-time ratings
using the current enjoyment tool (CET), whenever they felt their enjoyment level had
changed. The design of this experiment gave more freedom to the participants, in terms
of the enjoyment rating process, without the attempted manipulation of the control of
enjoyment.
After completing the web browsing, participants were asked to fill in a short
questionnaire, which included general information about themselves, as well as their
retrospective assessments of the quality of the design, and their level of enjoyment of
the website. (See Appendix A: Experiment 2 questionnaire).
4.5 Participants
The experiment was carried out in a lab environment at the University of Manchester
computer labs. Forty students were asked to take part in the experiment, and were each
rewarded with a £5 gift voucher. The study was not gender-specific.

Experiment 2
102
4.6 Results
This section presents a description of the experiment, and an analysis of the findings:
Key information about participants, and an outline of the procedure.
Spearman correlation between real-time enjoyment ratings, and retrospective
assessments of design and level of enjoyment.
Relationship between real-time enjoyment and retrospective assessments.
Multiple-linear regressions following simple and comprehensive models, as
predictors to assess the adequacy of peak end rule, when applied to website
experiences.
Unlike Experiment 1, this experiment was not designed to control the flow of the web
experience, but followed a free-browsing style, which gave more freedom to the
participants’navigation within the brazil.com website.

Experiment 2
103
4.6.1 Descriptive
The duration of the procedure for E2 varied from 4 minutes 0 seconds, to 11 minutes 29
seconds. The mean duration time was 9 minutes 20 seconds. Retrospective assessments
of design and enjoyment were on the Likert scale: 2.17 and 2.35, respectively. The
participants’ age ranged between 18 and 29, and themean age was 22.1 years. (See
Table 4-1 below)
Interestingly, the second participant reported 150 hours weekly internet use. Given that
there are only 168 hours in a week, this does not allow much time for other pursuits,
such as rest! This possible error of judgment was referred to as the `human memory
limitation` by Ariely (2001) - as discussed in the chapter devoted to the literature
review. The lowest reported figure was 6 hours web use per week. The mean use in
hours per week was 34.45, which appears to be within realistic and acceptable limits.
6 Values are mean ± standard deviation, or percentage of each participant
Participants
Number 40
Mean age6 22.07± 2.21
% Female 42.5
Web Experience (years) 9.95± 2.38
Weekly web usage (hours) 34.45± 26.71
-Duration (min) 09:12 ± 01:39
Real-time enjoyment
-Peak Enjoyment 86.37±16.2
-Initial Enjoyment 47.05±22.14

Experiment 2
104
Table 4-1 Experiment 2: characteristics of participants, and real-time and retrospective
assessments
4.6.2 Analytic
Relationship between real-time enjoyment ratings
Peak and end enjoyment moments were not significantly correlated (r = 0.182).
However, peak and end moments were found to be significantly correlated with average
enjoyment (r = 0.654** and r = 0.553**)8. Peak and end enjoyment moments were
included in the average, which explains the strong correlation. Peak and initial
enjoyment moments were also found to be correlated (r = 0.379*). Initial enjoyment was
relatively low (initial enjoyment: mean= 47.05, sd = 22.14) in contrast to peak
enjoyment. (Peak-enjoyment: mean = 86.37, sd =16.2). The correlation test could not
explain the nature of such a relationship; although this might provide evidence of the
importance of initial moments in website use, which has been noted by other researchers
(as explained previously in the ‘Literature Review’ chapter). The end enjoyment
moment did not statistically correlate with the initial enjoyment moment (r = - 0.274).
Total enjoyment was found to be statistically correlated with peak, end and average
7 Note that Total enjoyment is the sum of all real-time enjoyment ratings
8 * p< 0.05, ** p< 0.01
-End Enjoyment 64.37±21.76
-Average Enjoyment 62.15± 15.06
-Total Enjoyment7 792.82± 313.5
Retrospective assessments
Participants’ design rating 2.17± 1.89
Participants’ enjoyment rating 2.35± 1.71

Experiment 2
105
enjoyment moments (r = 0.647**, r = 0.419** and r = 0.500**, respectively). This again
could be due to the fact that total enjoyment was the sum of all real-time enjoyment
moments, including peak, end and the average of all ratings of enjoyment.
Relationship between design and enjoyment retrospective assessments
The Spearman correlation coefficient test results showed that retrospective assessments
of website design and level of enjoyment were strongly statistically correlated (r =
0.772**). This pattern supports the finding of the first experiment, that is, that the
participants’senseofenjoyment was strongly correlated to the quality of the design of
the website.
Relationship between real-time enjoyment and retrospective assessments
The end- and average enjoyment moments were significantly correlated with
retrospective assessments of design (r = 0.314* and r = 0.500**), and enjoyment (r =
0.338* and r = 0.508**). High peak ratings were not significantly correlated with
retrospectiveassessments.Thecorrelationofthe‘lowpeak’withenjoymentassessment
was higher than that of the high peak (0.343* and 0.155 respectively) (See Table 4-2).
The matrix below shows the Spearman correlations between all real-time moments of
enjoyment; including the low peak of enjoyment:

Experiment 2
106
Initial Peak Low-
peak End Average Total Duration Design-
Retro.
Enjoyment-
Retro.
Initial 1 0.379* 0.357* -0.274 0.118 0.162 -0.229 0.036 -0.032
Peak 0.379* 1 0.226 0.182 0.654** 0.647** -0.010 0.196 0.155
Low-peak 0.357 0.226 1 0.086 0.537 0.142 -0.031 0.401 0.343*
End -0.274 0.182 0.086 1 0.553** 0.419** -0.028 0.314* 0.338*
Average 0.118 0.654** 0.537** 0.553** 1 0 .548** -0.025 0.500** 0.508**
Total 0.162 0.647** 0.142 0.419** 0.548** 1 0.257 0.121 0.069
Duration -0.229 -.010 -0.031 -0.028 -0.025 0.257 1 -0.176 -0.198
Table 4-2 Experiment 2: correlation matrix between retrospective assessments and initial-, peak-
end- , average-, and total real-time enjoyment ratings; and duration of the procedure
Multi-linear regression (simple & comprehensive model)
The results below indicate that the comprehensive model was a better predictor of
retrospective assessment than the simple model. The Significant F change value between
the simple and the comprehensive model for the retrospective assessment of design was
4.55; and for the retrospective assessment of enjoyment: 6.09.

Experiment 2
107
Table 4-3 Experiment 2 predicting participants’ memories from combination of real-time
measures
Table 4-4 (below) shows the standardized Beta coefficients of the two models moments
of enjoyment and duration, as predictors of the overall assessments of enjoyment.
9 Values are R
2.
10 *Values which are statistically different between the two models
Retrospective Assessments
Simple model
( Peak-end)
Comprehensive model
(Initial-Peak-End-Average-
Total-Duration)
Design assessments 0.2509 0.516 *
10
Enjoyment assessments 0.263 0.576**

Experiment 2
108
Model
Standardized
Beta Coefficients
Simple model
Peak 0.377
End 0.271
Comprehensive model
Peak -0.070
End 0.102
Average 0.858
Total -0.304
Duration -0.208
Initial -0.003
Table 4-4 Experiment 2: standardized Beta coefficients of the two models as predictors
The‘lowpeaks’(ortroughs)oftheenjoymentofthefortyparticipants,wereidentified.
Later, they were included in the regression analysis; the same method of simple and
comprehensive models, used in the first experiment, being applied. This was done to
investigate the low peak in this experiment. The low and high peaks were used, along
with the end moments, in the simple model. The low and high peaks of enjoyment were
also included in the comprehensive model; along with the end-, initial-, total- and
average enjoyment, and duration of the procedure.
Table 4-5 (below) shows the regression of the data from the simple and comprehensive
models, with the addition of the low peak moments:
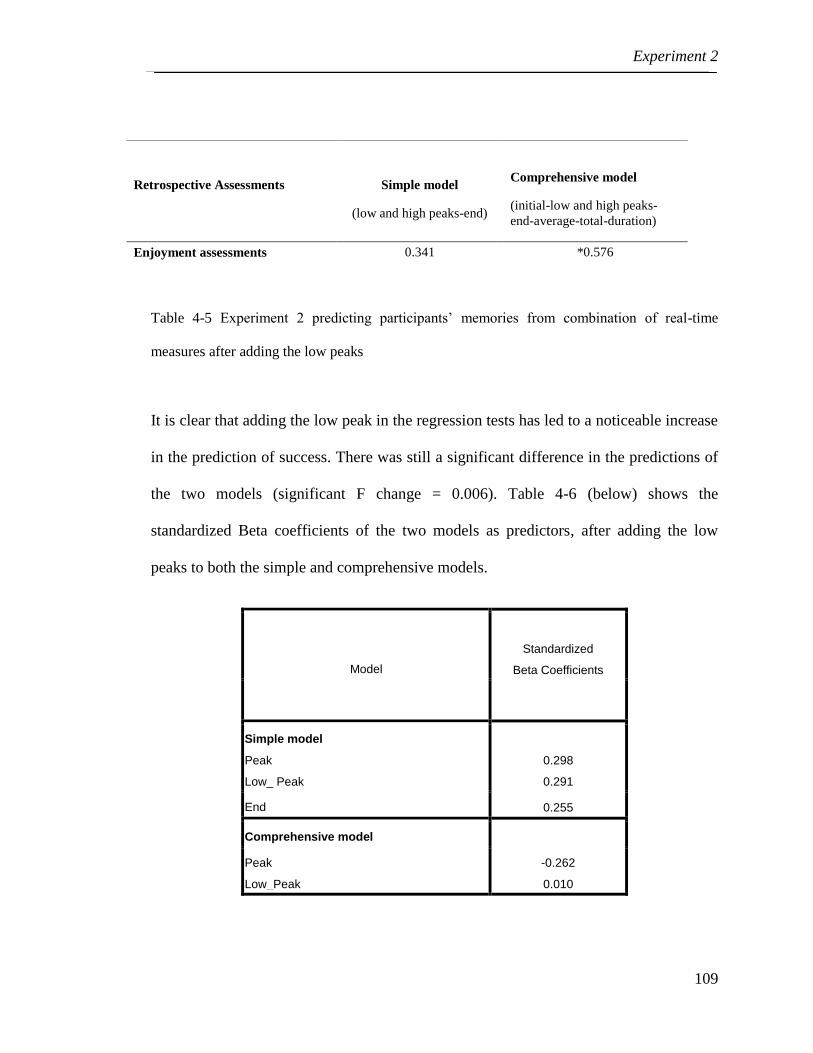
Experiment 2
109
Table 4-5 Experiment 2 predicting participants’ memories from combination of real-time
measures after adding the low peaks
It is clear that adding the low peak in the regression tests has led to a noticeable increase
in the prediction of success. There was still a significant difference in the predictions of
the two models (significant F change = 0.006). Table 4-6 (below) shows the
standardized Beta coefficients of the two models as predictors, after adding the low
peaks to both the simple and comprehensive models.
Model
Standardized
Beta Coefficients
Simple model
Peak
Low_ Peak
0.298
0.291
End 0.255
Comprehensive model
Peak
Low_Peak
-0.262
0.010
Retrospective Assessments
Simple model
(low and high peaks-end)
Comprehensive model
(initial-low and high peaks-
end-average-total-duration)
Enjoyment assessments 0.341 *0.576

Experiment 2
110
End 0.103
Average 0.848
Total -0.303
Duration -0.209
Initial -0.008
Table 4-6 Experiment 2: standardized Beta coefficients of the two models as predictors after
adding the low peaks to both models
Relationship between procedure duration and retrospective assessments
There was no significant correlation found between design- or enjoyment retrospective
assessments, and the duration of the procedure. This result appears to concur with the
phenomenon of duration neglect. (See Table 4-7)
Retrospective assessments Duration
Participant’sdesignrating -0.176
Participant’senjoymentrating -0.198
Table 4-7 Experiment 2 Spearman correlation of procedure duration with design and enjoyment
assessments

Experiment 2
111
4.7 Discussion
As explained in the introduction, the focus of this experiment was the free-browsing
method used, and its influence on the web experience of the 40 participants. The low
correlation between the real-time peak moment and the retrospective assessments of
web design and enjoyment showed that the peak-end rule did not apply in this set of
circumstances; that is, free-browsing for holiday information. Within this experiment,
the experiences on the website were so disparate, as to make it virtually impossible to
determine or to compare peak values. The large variance in peak value (24571.5)
confirms the futility of using it to attempt to predict retrospective assessment.
However, because each person had chosen their own route, it does make sense to use the
end moment as a predictor of retrospective assessment. There was a clear demonstration,
through this experiment, that peak values are only of use when there are adequate
constraints built in to the model.
It was shown earlier, in the first experiment, that by restricting the possibilities for
browsing, the peak moment could be identified and used as a predictor. The average of
all real-time ratings, however, which included peak and end moments, was always likely
to be a good predictor of retrospective assessment.
In the free-floating experience of Experiment 2, there was no communal peak to
measure, so the peak-end rule did not hold in this instance. The low correlation between
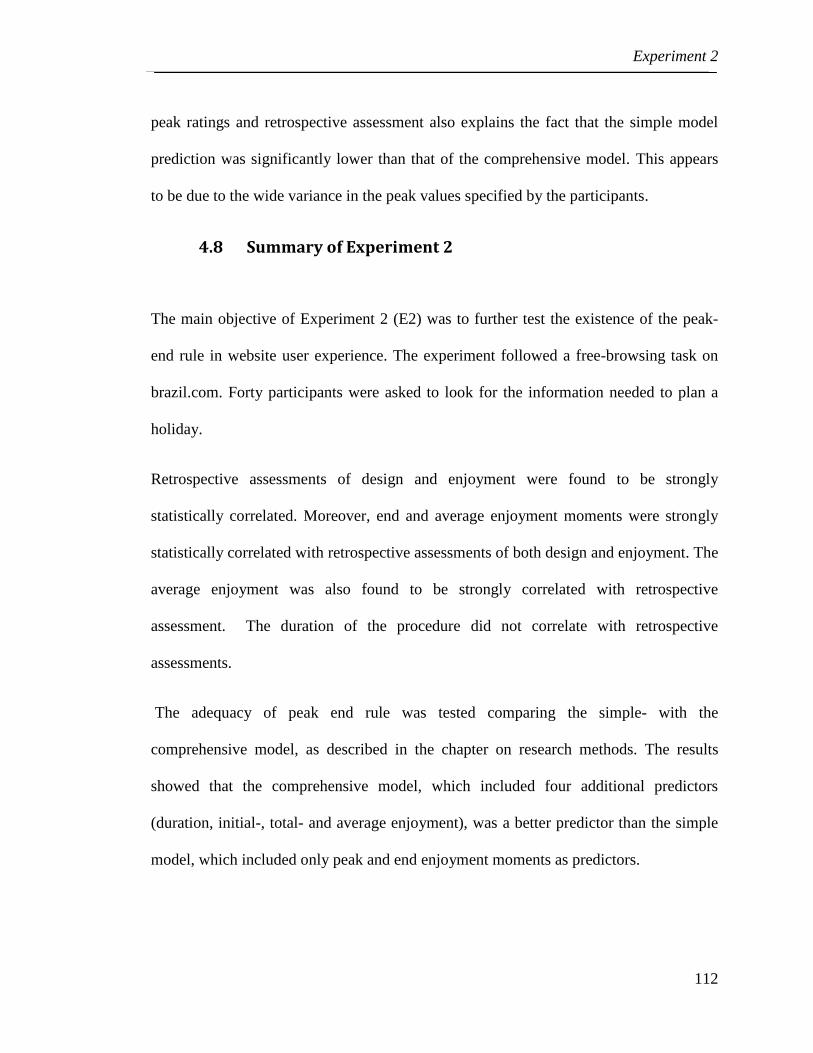
Experiment 2
112
peak ratings and retrospective assessment also explains the fact that the simple model
prediction was significantly lower than that of the comprehensive model. This appears
to be due to the wide variance in the peak values specified by the participants.
4.8 Summary of Experiment 2
The main objective of Experiment 2 (E2) was to further test the existence of the peak-
end rule in website user experience. The experiment followed a free-browsing task on
brazil.com. Forty participants were asked to look for the information needed to plan a
holiday.
Retrospective assessments of design and enjoyment were found to be strongly
statistically correlated. Moreover, end and average enjoyment moments were strongly
statistically correlated with retrospective assessments of both design and enjoyment. The
average enjoyment was also found to be strongly correlated with retrospective
assessment. The duration of the procedure did not correlate with retrospective
assessments.
The adequacy of peak end rule was tested comparing the simple- with the
comprehensive model, as described in the chapter on research methods. The results
showed that the comprehensive model, which included four additional predictors
(duration, initial-, total- and average enjoyment), was a better predictor than the simple
model, which included only peak and end enjoyment moments as predictors.

Experiment 2
113
Average and end enjoyment moments were found to be correlated with retrospective
assessments, while duration and peak were not. The comprehensive model was found to
be a better predictor than the simple model. There was a significant difference between
the predictions of the two models.
There was a strong correlation between the retrospective assessments of design and
enjoyment in both E1 and E2. (In E1, the correlation was found between easy- and hard
task design and enjoyment assessments). Therefore, it was not deemed necessary to
continue to request design assessments in the experiments that followed.
To briefly recap:
Level of enjoyment was directly related to the quality of the design.
End enjoyments, as well as the average enjoyment of all ratings, were correlated
with retrospective assessment of design and overall enjoyment. The average
enjoyment correlation was higher.
Peak enjoyment did not correlate with retrospective assessment.
Comprehensive model was a better predictor than the simple model.
Overall duration did not correlate with design or enjoyment assessments.
Perhaps the fact that the participants had been able to browse freely, caused the
phenomenon of duration neglect.

Experiment 3
114
Chapter 5 Experiment 3
5.1 Introduction
The third experiment investigated the effect of altering the order of the tasks on
retrospective assessments of enjoyment of a website experience. It also tested the
adequacy of the peak-end rule in predicting retrospective assessments.
Restricting participants to specific tasks had shown promising results in terms of the
predictive ability of the peak and end enjoyment moments; as demonstrated in the first
experiment of this research. The free-floating task of the second experiment showed the
peak enjoyment moment to be a poor predictor of retrospective assessment.
The number of online shoppers is increasing every day. According to the Interactive
Media in Retail Group (IMRG) of November 2002, UK online customers had spent $
1.58bn; and that was almost 9 years ago. A shopping website was chosen for this
experiment,toenhanceparticipants’levelofengagementwiththewebsite.
This experiment involved restricting the participants to certain contents of a certain
contents of a website, but allowing them to navigate or browse freely within these
constraints. In what was called Phase1of the experiment, 10 participants had given their
Experiment 3
115
opinion about three different websites in an attempt to identify the most and least
enjoyable. The website of choice was shoplocal.com, and the most and least popular
sections were, respectively, `electronics` (E) and `home & garden` (H).
In Phase2, the remaining participants were split into two groups. The first group
performed the experiment in decreasing order of enjoyment; starting with electronics,
and ending with home and garden. Each section was to be browsed for approximately 5
minutes. The second group performed the procedure in reverse order in an attempt to
create an increase in enjoyment towards the end of the web experience. Reversing the
website content order of the two groups was used to test the order effect on retrospective
assessments of enjoyment.
Cosmetic design changes were performed on the current enjoyment tool (CET) for this
experiment,toeasetheparticipants’real-time rating process. (See ‘Design and material’
section of this chapter)
Real-time enjoyment moments were obtained, along with retrospective assessments and
general information regarding each participant, at the end of the browsing experience.
The real-time moments were to be analysed, and compared with the retrospective
assessment of enjoyment, to further understand peak-end rule in a task that allowed free-
browsing within a restricted environment.
As in the two previous experiments, the duration of the experimental procedure was
recorded. The correlation between procedure duration and retrospective assessment was

Experiment 3
116
analysed, following this experiment, in an attempt to understand the phenomenon of
duration neglect. Duration was not, however, the central focus of this experiment. There
is extensive research required, in order to investigate the phenomenon of duration
neglect in the web environment.
5.2 The task
A minimum 4-minute and maximum 12-minute free-browsing task was set. One group
of participants was asked to begin with the `electronics` section and end with the `home
and garden` section. Each section was to be browsed for 5 minutes. The other group
performed the same tasks but in reverse order.

Experiment 3
117
5.3 Design and materials
Minor cosmetic changes to the Experiment 3 tool were introduced, aiming to ease the
participants rating experience. The tool included a text box on the left side, to give a
better indication of current enjoyment rating. Furthermore, the low, medium and high
terms used in the previous experiment’s tool, were changed to very negative, neutral and
very positive. A command button on the right-hand side tagged with next website, was
included for participants to click on, when they changed to the next section of the
website. Moreover, the slide bar was extended, and the node colour was set to be red.
(See Figure 5-1):
Figure 5-1 Experiment 3 and 4 current enjoyment tool
In addition to testing the effect of task order, and adequacy of the peak-end rule, the
experiment was designed to look at the relationship between the duration of a procedure
and its retrospective assessment.
The experiment was conducted in two phases. In Phase1, ten students from the
University of Manchester were asked to rate three different websites (play.com,

Experiment 3
118
shoplocal.com and shopping.com) with the intention of a) choosing a favoured site, and
b) determining the low- and high enjoyment sections within it.
In Phase 2, twenty students were divided into two groups. Group 1 began with the high
enjoyment section (electronics) and ended with low enjoyment section (home &
garden). Group 2 followed the same procedure, but in reverse order.
5.4 Procedure
For Phase 1 of the experiment ten participants were asked to browse the three shopping
websites (shoplocal.com, play.com and shopping.com) for a maximum period of ten
minutes, and not less than five minutes. Participants were asked to indicate the section
that they enjoyed the most and the least of each website; and provide ratings on a scale
of 1 to 5 for each of the chosen sections.
Out of the three websites, shoplocal.com was chosen to be tested in Phase 2 of this
experiment. The electronics section was clearly the most enjoyed on shoplocal.com.
Home & garden was chosen because four users considered it as the least enjoyable
section within the shoplocal.com and shoppoing.com websites. Of the three websites,
the participants expressed a preference for shoplocal.com. (See Appendix A - Phase1
questionnaire)
Afterwards, twenty additional participants were divided into two groups. Group1
participants started the free-browsing task with electronics (E) and ended with home and

Experiment 3
119
garden (H). Each section was browsed for five minutes. The participants provided real-
time ratings using the CET. The second group followed the same procedure, but in the
reverse order.
An Independent sample test was conducted, to test the difference between the two
groups’ retrospective assessment scores. As in the previous experiments, simple- and
comprehensive model multi-linear regressions were compared, to assess the adequacy of
the peak end rule.
5.5 Participants
In total, thirty students from the University of Manchester volunteered to take part in
this experiment. Ten students performed Phase 1, in order to determine the preferred
website, as well as the sections that they enjoyed least and most; twenty students then
performed Phase 2.
5.6 Results
This section contains a description of the relevant data characterising the participants,
and an analysis of the results of the experiment. The analytical section presents
Spearman correlation test results, regarding selected real-time enjoyment moments and
retrospective assessment. It also shows the effect of altering the order of the content on
retrospective assessment. There is a comparison made between the simple model and the

Experiment 3
120
comprehensive model multi-linear regressions, as a means of checking the adequacy of
the peak end rule. The analysis culminates with an examination of the correlation
between the retrospective assessment of enjoyment, and the duration of the procedure.
Results indicated that participants most enjoyed the `electronics `section and least
enjoyed the `home and garden` section.
On shoplocal.com five users rated electronics to be the most enjoyable section; the
overall rating of the five users was 19 on scale of 1 to 5. Two users chose the electronics
section on play.com to be the most enjoyable content of the website. Both users gave the
rating of 4 on scale of 1 to 5. On shopping.com only one user rated electronics as the
most enjoyable, and gave it the maximum score of 5. The electronics section was
considered to contain the most enjoyable content across the three websites, although
there was not unanimous approval for it.
Home & garden was chosen by two of the users (3 and 2 on the 1 to 5 scale) to be the
least enjoyed section on shoplocal.com. Play.com did not include a home & garden
section. On shopping.com two more users chose home & garden to be the least enjoyed
section;bothusers’ratingswere2outofscaleof1to5.
5.6.1 Descriptive
The web usage of the twenty participants in Phase 2 varied from 6 hours- to 70 hours
per week (mean = 20.9, sd=14.5). The number of years of web experience varied from 3
to 15 (mean = 8.7, sd= 2.4). The reported web experience and weekly usage of the 20

Experiment 3
121
participants of phase 2 appeared more realistic than that reported in either the first or
second experiment.
The minimum peak real-time enjoyment rate (on a scale of 0 to 100) reported by the
twenty participants was 33, and the maximum was 100 (Mean = 75.6, SD = 14.3), while
the minimum end real-time enjoyment rate reported was 12, and the maximum was 100
(Mean = 57.9, SD= 22.6)
Table 5-1 (below) illustrates the mean and standard deviation of each of the descriptive
statistics for Group 1 (G1 (E-H)) and Group 2 (G2 (H-E)); as well as those of
retrospective ratings.
G1 (E-H) G2 (H-E)
Number of participants 10 10
Mean age11 21.2± 1.22 21.1±1.79
% Female 40 40
Web Experience (years) 8.1±2.42 9.3±2.26
Weekly web usage (hours) 22.2±18.29 19.6±10.13
Duration (minutes) 10:50 ± 01:01 10:46± 00:54
Retrospective assessments
Participants’enjoyment rating 0.30± 2.11 2.10±1.79
Table 5-1 Experiment 3 characteristics of participants and procedure
11
Values are mean+- Standard deviation, or percentage of each participant

Experiment 3
122
An Interdependent sample test was conducted between Group 1 and Group 2, in terms
of initial-, peak-, end-, average- and total real-time enjoyment rating, along with
experiment procedure duration. There was no significant difference between the two
groups. These results suggest that the participants of each group experienced similar
experimental conditions, which validated the design of the experiment. On the other
hand, there was a significant difference between the retrospective assessments of Group
1 and Group 2. This will be examined in the section: Content order: - effect on
retrospective assessment.
Real –time enjoyment G1 G3
Peak Enjoyment
70.90±18.21
80.30±7.18
Initial Enjoyment 46.00±16.08 48.10±16.08
End Enjoyment 49.40±25.00 66.50±16.91
Average Enjoyment 50.47±13.56 59.71±5.88
Total Enjoyment 670.20±268.86 895.90±337.18
Table 5-2 Group 1 and Group 3 real-time enjoyment (mean and standard deviation)

Experiment 3
123
5.6.2 Analytical
Relationship between real-time and retrospective assessments of enjoyment
Table 5-3 (below) presents a Spearman correlation matrix between peak-, end-, total-,
initial enjoyment moments, and the average of all enjoyment ratings along with the
duration of the procedure. It is clear that there was a strong statistical correlation
between the peak-, end- and average real-time enjoyment moment with the retrospective
assessment of enjoyment, for the 20 participants of the two groups, as shown in the table
below:
Initial Peak End Average Total Duration Enjoyment
Initial 1 0.271 -0.003 0.438 0.149 -0.056 0.198 Peak 0.271 1 0.538* 0.662** 0.477* -0.563 0.755** End -0.003 0.538* 1 0.595** 0.278 -0.287 0.709**
Average 0.438 0.662** 0.595** 1 0.230 -0.122 0.724** Total 0.149 0.477* 0.278 0.230 1 -0.337 0.340
Duration -0.056 -0.563** -0.287 -0.122 -0.337 1 -0.257 Enjoyment 0.198 0.755** 0.709** 0.724** 0.340 -0.257 1
Table 5-3 Experiment 3: correlation matrix between retrospective assessments and real-time
measurements *= < 0.05, **= <0.01
Content order: - effect on retrospective assessment
An Independent samples test was conducted between the retrospective assessments of
Group 1 and Group 2: (E-H) and (H-E). There was greater enjoyment reported in the H-
E condition (mean = 2.11) than in the E-H condition (mean = 0.3). The mean difference
between conditions was -1.8, and the 95% confidence interval for the estimated
population mean difference is between -0.339 and -0.203. Mean standard deviation (2.1

Experiment 3
124
+ 0.3)/ 2 = 1.2. The effect size d = 2.1 - 0.3 = 1.8, which is considerable. An
independent t-test showed that the difference between conditions was significant (t = -
2.439, adjusted df = 12.807, p = 0.030, two-tailed).
Multi-linear regression (simple & comprehensive)
This experiment followed the same analytical method used in previous experiments to
test the validity of the peak-end rule. Multiple-linear regressions were performed; the
first was called the simple model, and included peak and end real-time moments of
enjoyment as predictors of the retrospective assessments of enjoyment. The second
model, which was called the comprehensive model included peak-, end-, initial-,
average of all real-time ratings-, and total enjoyment as well as the duration of the
procedure, as predictors of the retrospective assessment of enjoyment. This method was
inspired by Daniel Kahneman and his colleagues.
It is clear from the table below that the predictive ability of the comprehensive model
was slightly better than that of the simple model. In this instance, there was no
significant difference found between the predictions of the two models. This result
suggests that peak- and end enjoyment moments could predict the retrospective
assessment of enjoyment as well as the sum of the initial-, peak-, end-, average-, total
ratings (See Table 5-4 below):

Experiment 3
125
Retrospective assessments Simple model
(Peak-End)
Comprehensive model
(Initial , Peak, End, Average,
Total, Duration)
Enjoyment Retrospective assessments
0.683
12 0.713
Table 5-4 Experiment 3: predicting participants’ memories from combination of real-time
measures
Table 5-5 (below) shows the standardized Beta coefficients of the two models as
predictors. This table helps to provide a better insight of the contribution of each of the
predictors in the retrospective models.
Model
Standardized
Beta Coefficients
Simple model
Peak
0.564
End 0.371
12
Values are R2.

Experiment 3
126
Comprehensive model
Peak 0.743
End 0.337
Initial -0.076
Average 0.003
Duration 0.179
Total -0.076
Table 5-5 Experiment 3: standardized Beta coefficients of the two models as predictors
Effect of duration on retrospective assessments
There was no significant correlation found between procedure duration and retrospective
assessments of enjoyment. This result supports the findings of Experiment 2, and further
suggests that duration does not significantly affect retrospective assessment. This result
gives further confirmation that the phenomenon of duration neglect can be applied to
website experiences. (See Table 5-6 below):
Retrospective assessments
Procedure duration
Retrospective assessments of enjoyment -.257
Table 5-6 Experiment 3: Spearman correlation between overall procedure duration and
retrospective assessments of enjoyment

Experiment 3
127
5.7 Discussion
The peak issue which arose in the second experiment, in which the peak was ill-defined,
was overcome by using bounded content for free-browsing in this experiment. The peak
enjoyment moment, which was clearly defined, was found to be strongly correlated with
the retrospective assessment of enjoyment (r = 0.75, p<0.01). The standard deviation
across the peak times (sd= 14.313) was lower than that of the second experiment (sd=
16.2). The difference between the standard deviation of the peak times could explain the
strong relationship between peak enjoyment and retrospective assessment of enjoyment
in the third experiment, but it does not fully explain why the peak did not correlate with
the assessments of enjoyment in the second experiment.
The end real-time time enjoyment moment strongly correlated with the retrospective
assessment of enjoyment. The strong correlation of peak and end moments reflected
positively in terms of the prediction of retrospective assessment of enjoyment. The peak
and end moments could predict retrospective assessment as well as all other moments;
including the average of all real-time ratings.
The strong correlation is a promising result in terms of peak-end rule replication in the
web environment. It shows that peak and end moments were strongly related to the
assessment of enjoyment of the website. The average of all real-time ratings also seemed
to be strongly correlated. This indicates that the combination of free-floating browsing
and restricted environment of this task had somehow worked to overcome the peak issue

Experiment 3
128
that arose in the second experiment, where the peak had no definition. In this
experiment, the peak had become clearly defined.
The independent sample test results suggest that the participants of Group 2 (H-E)
reported greater enjoyment than the Group 1 (E-H) participants. Hence, the term
preference of improvement used by Ariely (2001) could be replicated in website user
experiences.
For the first time in this research, there was a task- or content order effect on
retrospective assessment. The results of this experiment have shown that those people
who experienced increasing enjoyment towards the end of the browsing period reported
a greater retrospective assessment of enjoyment than those who experienced decreasing
enjoyment. The findings of Phase 2 confirmed the grading of the elements determined
by Phase 1. This demonstrated the value of keeping users involved in the design of an
experiment.
The duration of the procedure did not correlate with retrospective assessment. This
result supports what had been found in the two previous experiments; that the duration
of the procedure did not influence the retrospective assessment of a website. This was a
further example of duration neglect in the web environment.

Experiment 3
129
5.8 Summary of Experiment 3
Experiment 3 (E3) further tested peak-end rule in a website shopping experience. It also
attempted to examine the effect of changing the order of tasks on retrospective
assessment (what we shall call content order). The effect of duration on retrospective
assessments was again monitored.
In a preparatory study, ten participants browsed three shopping websites and indicated
both their favoured site, and the most and least enjoyable sections. The results showed
that the electronics section was considered to be the most enjoyable, while home and
garden, the least enjoyable.
Afterwards, twenty students from the University of Manchester were employed to
browse the chosen shopping site: shoplocal.com. The students were divided into two
groups. Group 1 started browsing the `electronics` section and ended with ‘home and
garden’; each for a period of 5 minutes .The second group performed the same
procedure, but in reverse content order. This procedure attempted to create increasing
enjoyment towards the end, in order to control the enjoyment flow of the shopping
experience.
Independent sample test results indicated that the retrospective assessment of enjoyment
was affected by content order. The participants of Group 2 (home and garden-
electronics), reported greater enjoyment than those of Group 1 (electronics-home and

Experiment 3
130
garden). The overall duration of the procedure did not significantly affect the
retrospective assessment of enjoyment of either group.
The comprehensive model appeared to be a slightly better predictor than the simple
model, although there was no significant difference between the predictions of the two
models. It was clearly demonstrated that peak enjoyment and end enjoyment moments
could predict retrospective assessment as reliably as a combination of all of the
moments. This result suggests that the peak end rule can be applied to website
experience
To briefly recap:
Eliciting participants’ opinions in terms of the most and the least enjoyable
sections of a website was a crucial element in the design process of the
experiment.
Participants that ended with the `electronics`- and started with `home & garden`
section reported greater enjoyment than those who started with the `electronics`-
and ended with the `home & garden` section.
Peak and end enjoyment moments could predict retrospective assessment as well
as all other moments together (initial-, peak-, end-, average-, total enjoyment and
duration of the procedure).

Experiment 3
131
Reversing the order of contents in order to increase enjoyment towards the end
of the website experience, resulted in a greater sense of enjoyment of the
process.
Duration of the procedure did not significantly correlate with retrospective
assessment.

Experiment 4
132
Chapter 6 Experiment 4
6.1 Introduction
Experiment 4 (E4) examined the end effect on the retrospective assessment of
enjoyment of a website. It also looked at the adequacy of peak-end rule with respect to
web site user experience. At the same time this experiment attempted to assess the
relationship between the duration of the procedure and retrospective assessment.
The results of the third experiment that used online shopping experience were promising
in terms of testing the content order effect on retrospective assessments of enjoyment
for that reason it was decided to use online shopping experience again in the fourth
experiment. There was a need for a website that would provide participants with a
fluctuating enjoyment experience in that it would contain a variety of sections with
could cause the user enjoyment to increase or decrease rapidly. After studying a number
of shopping websites, waitrose.com was chosen for this experiment. The waitrose.com
includes a wide a diversity of contents that range from grocery, electronics, clothes and
many others.

Experiment 4
133
In the previous experiments, end moments were found to be highly correlated with
retrospective assessments of enjoyment. The current experiment focused more on the
effect of the end real-time enjoyment moment on the retrospective assessment of the
participant. The experiment tried to control the real-time end moments, in an attempt to
test whether high enjoyment at this particular moment would result in greater perceived
enjoyment of the process than when a participant ends their web browsing experience
when feeling less satisfied. The fact that the end moment always occurs at the end of the
experience for each participant has increased the temptation to test whether low- and
high end-enjoyment would cause a significant difference in the participants’
retrospective assessments.
Participants were asked to free-browse waitrose.com, replicating a web shopping
experience. A shopping experience was used in this experiment to increase the
participants’ interaction with a website, to keep them involved. It was assumed that
people would be likely to experience moments of pleasure during on-line shopping
experiences.
Participants were given more freedom than in the previous experiment in terms of
content browsing. They were advised to cover as much as possible of the waitrose.com
website content, without any specific task restriction. Participants had no clue that the
tool would start monitoring their real-time ratings after 8 minutes had passed. This
method was used to increase the chances of a participant ending with low-, medium-, or
high real-time enjoyment.

Experiment 4
134
The current enjoyment tool (CET) was modified so as to manipulate low-, medium- and
high end enjoyment. This was done by creating a conditional statement after 8 minutes
web browsing had passed: if the end real-time moment rating was less than 25, it was
considered to be low end, while if it was above 75 then it was considered to be high end.
In either of these instances, the tool would then terminate the browsing experience, and
ask the participant to proceed to fill in the questionnaire; giving their retrospective
assessment of enjoyment; as well as general information about themselves. The
participants that recorded their real-time enjoyment as being between 25 and 75 would
continue browsing until 12 minutes had passed; at which point the tool would stop and
direct them to the final questionnaire. This will be further explained in the Design and
materials section (below).
Participants were instructed to use the tool to provide real-time enjoyment ratings while
they browsed the contents of waitrose.com. Later on, this was used to identify initial-,
peak-, end-, total- and average of all real-time enjoyment ratings. Afterwards, these
moments were compared using Spearman correlation tests, as well as multi-linear
regression, similarly to the previous experiments.
The duration of the procedure for each of the 28 participants was obtained through the
CET. The duration was to be compared with the retrospective assessments of enjoyment
again, using the Spearman correlation test. It was thought that this might be helpful in
understanding the nature of the relationship between duration and assessment.

Experiment 4
135
6.2 The task
Participants were asked to free-browse the waitrose.com web site, in order to cover as
much as possible of the content.
6.3 Design and materials
The tool design used for the fourth experiment was similar to that of the third
experiment (Figure 5-1) in previous chapter, but without a `next website` command
button. The enjoyment level tool was modified for this experiment, by adding a timer to
the code, which would run an ‘if’ statement after 8 minutes of the experiment. If the
enjoyment level was < 25, the system would stop, and ask the participant to proceed to
the questionnaire, to report their final ratings. This group were considered to be the low-
end enjoyment group; if the enjoyment level was >75, the message box would appear,
and ask the participant to carry on to the questionnaire. This group, in turn, will be
considered as being high-end enjoyment group. If the enjoyment level was between 26
and 74, the system would let them carry on until they hit the time limit; which was 12
minutes. This group were classified as the moderate enjoyment group. The design of the
tool was intended to test the end effect on retrospective assessments of enjoyment.
A computer was equipped with Internet explorer, and a modified current enjoyment tool
(CET) was used to measure each participant’s real-time enjoyment. The CET was
modified for this experiment by adding a timer to the code, which ran an `if` statement

Experiment 4
136
query after 8 minutes of the experiment: if the enjoyment level was =< 25 or => 75, the
system would stop and ask the participant to proceed to the questionnaire, to report their
final ratings. The two groups thus formed would be classified as low- and high end
enjoyment groups. If the enjoyment level was between 26 and 74, the system would let
them carry on until they hit the time limit, which was 12 minutes. This group would be
classified as the moderate end enjoyment group.
6.4 Procedure
Waitrose.com was used as a `playground` web site, replicating an online shopping
experience to further test peak-end rule. The nature of the web site was such that it
would provide a fluctuating enjoyment experience.
A demonstration of the working of the CET was provided to each participant, prior to
their browsing session. Participants were asked to freely browse the web site, starting
from the home page, for a maximum period of 12 minutes, depending on their ratings
after 8 minutes (See chapter 5 (E2), figure 5-1). Participants were observed during their
browsing experience, and were encouraged to use the CET whenever their enjoyment
level changed, or as much as they chose. Towards the end of the experiment,
participants were asked to fill in a short questionnaire, providing general information, as
well as their final enjoyment ratings of the whole experience; using the Likert scale
system: from -5 to +5 (See appendix A).

Experiment 4
137
The experiment was designed to facilitate the testing of the relationship between real-
time ratings and final ratings; and in particular, the effect of the end moments on
retrospective assessments. The tool was designed to identify three groups: low-,
medium- and high end enjoyment.
6.5 Participants
Thirty Students from the University of Manchester were asked to take part in this
experiment. The male and female participants were selected randomly upon entering the
George Kenyon computer cluster at the University of Manchester campus.
6.6 Results
The following section is divided into a descriptive element and an analytical element, as
in Chapters 3 to 5. The descriptive section comprises the groups’ summary statistics.
Using multi-linear regressions, the analytical section examines end effect and its
influence on retrospective assessment; as well as peak- end rule adequacy.
6.6.1 Descriptive
Thirty participants were categorized according to their end rating. End ratings of 0-25
were considered to be low end. Thirteen participants were in this grouping (Group 1, or
G1). Those people whose end ratings were 26-75 were considered to be medium end and

Experiment 4
138
classified as Group 2 (G2); which consisted of seven participants. The third group (G3)
end ratings, between 76 and 100, were considered to be high end; and constituted ten
participants.
Participants were given the choice to stop the experiment at any time, according to the
ethics of research criteria; this explains why the average duration of the procedure for
the medium-end group is not exactly 12 minutes.
Two of the users that performed the experiment were excluded from the data analysis, as
they exceeded the 12 minute time limit. One user reached 16 minutes and the other
performed the task for 20 minutes! These expectations occurred due to the user missing
the message box that appeared towards the end of the experiment, and continuing to
browse the task.
Table 6-1 (below) shows mean values and standard deviations of both the characteristics
and the procedure ratings of the three groups:
G1 (low-end) G2 (medium-end) G3 (high-end)
Number of participants 12 7 9
Mean age13 21.08± 2.1 22.4±2.6 23.1±3.3
% Female 38.46 57.14 60
Web Experience (years) 8.5±2.7 10.8±2.7 9.1±2.6
Weekly web usage (hours) 40.1±27.8 42.8±28.8 32.8±15.3
Duration (min) 08:40 ± 01:24 11:20± 01:15 08:46± 01:25
Table 6-1 Experiment 4 characteristics of participants and duration of procedure
13
Values are mean+- standard deviation; or percentage of each participant

Experiment 4
139
Relationship between real-time enjoyment moments
Table 6-2 (below) shows the mean and standard deviation of the real-time ratings of
enjoyment of the three groups:
Real –time enjoyment G1 G2 G3
Peak Enjoyment 80.4 ± 11.6 69.86 ± 11.44 91.5 ±8.3
Initial Enjoyment 55.3 ± 13.4 47.85 ±7.38 52.6 ±16.6
End Enjoyment 18.7 ± 7.6 53.57 ±17.41 85.2 ± 5.4
Average Enjoyment 49.4 ± 8.2 55.4 ± 5.1 69.8 ±13.4
Total Enjoyment 787.9 ±347.4 632.8 ± 290.75 1157 ± 602.3
Retrospective enjoyment 0.66 ± 2.3 0.43 ±1.40 4.0 ± 0.088
Table 6-2 peak-, initial-, end-, average- and total real-time enjoyment in addition to retrospective
assessment of enjoyment (mean and standard deviations of Groups 1, 2 and 3)
The mean rating of the real-time end enjoyment was 18.7 for G1, 53.57 for G2 and 85.2
for G3. These figures support the design of the experiment, creating low-, medium- and
high real-time end enjoyment moments.
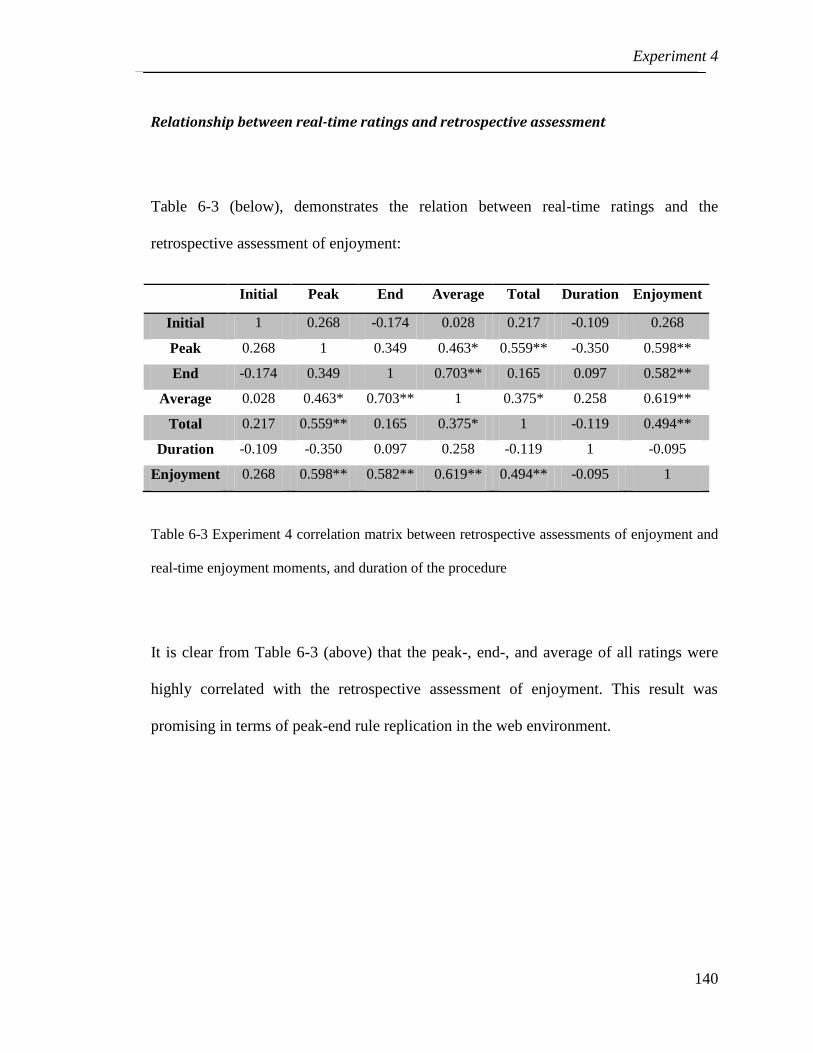
Experiment 4
140
Relationship between real-time ratings and retrospective assessment
Table 6-3 (below), demonstrates the relation between real-time ratings and the
retrospective assessment of enjoyment:
Initial Peak End Average Total Duration Enjoyment
Initial 1 0.268 -0.174 0.028 0.217 -0.109 0.268
Peak 0.268 1 0.349 0.463* 0.559** -0.350 0.598**
End -0.174 0.349 1 0.703** 0.165 0.097 0.582**
Average 0.028 0.463* 0.703** 1 0.375* 0.258 0.619**
Total 0.217 0.559** 0.165 0.375* 1 -0.119 0.494**
Duration -0.109 -0.350 0.097 0.258 -0.119 1 -0.095
Enjoyment 0.268 0.598** 0.582** 0.619** 0.494** -0.095 1
Table 6-3 Experiment 4 correlation matrix between retrospective assessments of enjoyment and
real-time enjoyment moments, and duration of the procedure
It is clear from Table 6-3 (above) that the peak-, end-, and average of all ratings were
highly correlated with the retrospective assessment of enjoyment. This result was
promising in terms of peak-end rule replication in the web environment.

Experiment 4
141
6.6.2 Analytical
This section of results further examines the real-time end enjoyment effect on
retrospective assessment. It also investigates peak-end rule adequacy by comparing
simple and comprehensive linear regression models; as explained in this work.
Retrospective assessments of enjoyment
A One-way ANOVA test was performed between the retrospective assessments of
enjoyment of the three groups. There was a statistically significant effect of the end
ratings condition (F (2, 27) = 11.15, p<.001). A Bonferroni post-hoc was conducted, to
identify which of the groups’ retrospective assessments significantly differed. The
results showed that there was significant variation between the three groups.
Multi-linear regression (simple & comprehensive)
Table 6-4 (below) demonstrates the comparative predictability of retrospective
assessment by the two models investigated in this thesis:

Experiment 4
142
Retrospective
assessments
Simple model
(Peak-End)
Comprehensive model
(Initial , Peak, End,
Average, Total, Duration)
Retrospective assessment
of enjoyment
0.48814
0.567
Table 6-4 Experiment 4 predicting participants’ memories by a combination of real-time
measures
There was no significant difference found between the two models. Each model
managed to predict the retrospective assessment of enjoyment with some degree of
accuracy. This result was a confirmation of the application of the peak-end rule to
website experience; supporting the findings of the previous experiment. The Significant
F change value between simple and comprehensive model was 0.95.
14
Values are adjusted R2

Experiment 4
143
Model
Standardized
Beta Coefficients
Simple model
Peak
0.416
End 0.455
Comprehensive model
Peak 0.200
End 0.409
Initial 0.191
Average 0.120
Duration -0.003
Total 0.171
Table 6-5 Experiment 4: standardized Beta coefficients of the two models as predictors
Table 6-5 (above) shows the standardized beta coefficient of individual moments of
enjoyment, in addition to the duration of the procedure.
Overall procedure duration and retrospective assessments of enjoyment
A Spearman test showed that there was no significant correlation found between the
overall procedure duration and the retrospective assessment of enjoyment (Table 6-6,
below):

Experiment 4
144
Retrospective assessments Overall procedure duration
Retrospective assessments of enjoyment
-0.092
Table 6-6 Experiment 4: Spearman correlation between overall procedure duration and
retrospective assessments of enjoyment
This gives further confirmation of the existence of duration neglect, as proposed by
Kahneman and his colleagues, and its replication in web experience.
6.7 Discussion
The free-floating shopping task of this experiment, using the waitrose.com website,
aimed to test for the relationship between real-time enjoyment experience, and
retrospective assessment. The particular emphasis was on the retrospective assessment
of enjoyment in a web environment.
The current enjoyment tool (CET) was modified as to manipulate the creation of the
three groups, experiencing low-, medium- and high real-time end enjoyment. This was
doneby settingupa timer,whichafter8minutesmonitoredand interruptedpeople’s
browsing session, as has been explained earlier. The method of monitoring and stopping

Experiment 4
145
the process was successful in producing three distinct groups, with low-, medium-, and
high real-time end moment ratings.
The minimum peak enjoyment reported was 48, and the maximum was 100, based on
the current enjoyment tool scale which was from 0-100. The variance between the 28
participants’peakenjoymentvalueswas174.1.Thisvariance was lower than that found
in the second experiment, conducted on Brazil.com. This suggests that peak values were
more communal in the current experiment than in the Brazil experiment. The online
shopping experience produced better results than the online holiday experience, with
respect to peak-end rule.
The difference between the retrospective assessments of the three groups was later
tested using a one-way ANOVA test. The results have shown that the participants that
ended their browsing with low- and medium real-time end enjoyment, recorded lower
retrospective assessments, than those who reported a greater level of enjoyment towards
the end of their browsing experience.
This result further confirms the importance of the end browsing moment and its
influence on retrospective assessments. This finding seems to be in line with what
Ariely (2001) suggested: that an experience that deteriorates towards the end results in a
lower retrospective assessment than an experience which improves with time; when
both experiences are equally weighted.

Experiment 4
146
The experiment used a free-browsing task. The nature of the web-browsing experience,
and the participants’ subjectivity, made it impossible to replicate the exact series of
events for each participant. This experiment tried to provide participants with a similar
level of experience by giving them the freedom to browse the content of a single
website, then manipulating the end of their browsing experience, in an attempt to
capture a pronounced end effect, and inspect its bias on retrospective assessment.
Both the simple and comprehensive models managed to predict the retrospective
assessment of enjoyment with a fair degree of accuracy. There was no significant
difference between the predictions of the two models. This result was again promising in
terms of the application of the peak-end rule to website experience.
As in previous experiments duration of the procedure did not influence retrospective
assessments of enjoyment. This further suggests that duration dose not play a big role in
web experiences.
6.8 Summary of Experiment 4
Experiment 4 (E 4) further examines the end effect on retrospective assessment. The
effect of duration was also tested. Following on from the previous three experiments, it
further investigated the existence of peak-end rule within a web site shopping
experience (waitrose.com).

Experiment 4
147
Thirty participants from the University of Manchester volunteered to take part in the
experiment. Participants were categorized according to end enjoyment ratings. End
ratings between 0 and 25 were considered to be low end. Twelve participants were
included in this Group1 condition. End ratings between 26 and 75 were considered to be
medium end (Group 2); constituting seven participants. End ratings between 76 and 100
were considered to be high end (Group 3); nine people were in this group.
The retrospective assessment of enjoyment did not statistically significantly correlate
with the duration of the experimental procedure.
There was found to be a significant end effect on retrospective assessments. A One-way
ANOVA test was performed between the retrospective assessments of the three groups.
There was a statistically significant effect on the assessments of enjoyment by the end
ratings condition (F (2, 27) = 11.15, p<.001). A Bonferroni post-hoc was conducted to
identify which of the groups’ retrospective assessments of enjoyment differed
significantly. The results showed that the assessments for Groups 1, 2 and 3 varied
significantly. The simple and comprehensive models for prediction did not significantly
differ. Each model predicted retrospective assessments with a fair degree of accuracy.
To briefly recap:
End moments of the experience seemed to have a significant effect on
retrospective assessments of enjoyment.
Greater enjoyment towards the end resulted in higher retrospective assessments.

Experiment 4
148
Experimental design enabled easier control and identification of end enjoyment
moments, than peak moments.
Peak and end enjoyment moments could predict retrospective assessment as well
as all other moments integrated, including the average of all real-time enjoyment
moments.
Duration of the procedure did not significantly correlate with the retrospective
assessment of enjoyment.
6.9 Regression of all four experiments combined
Each experiment was designed with its own particular emphasis to investigate different
aspects of peak-end rule; in the case of E1 the examination of the effect of the CET,
altering the order of tasks with the idea of studying the flow of enjoyment; in E2
analysing the design and enjoyment of a website; E3 returning to the content order and
exploring the phenomenon of duration neglect; and E4 focusing again of duration and
looking closely at the end effect. Despite the difference in emphasis within this research,
the one factor that was common to all experimentation was the testing of the peak-end
rule in a web environment, with specific reference to perceived enjoyment.
As all the work share this common element, it was thought to be of interest to combine
the results of all four experiments, thus creating a considerably larger sample size,

Experiment 4
149
The peak-, end-, average-, total- and initial enjoyment moments; as well as the duration
of the procedure of all four experiments; were included in one file. Simple and
comprehensive regression models were used, as discussed earlier in the first experiment.
In total, there were 128 users. In the case of the first experiment, the easy- and hard
moments were included as separate values; and of course synchronised with their
reported enjoyment moments; enjoyment being the dependent variable in all four
experiments. The regression analysis comes out as follows:
Participants’assessments 15
( all 128 users )
Simple
(peak-end)
Comprehensive
(initial-peak-end-total-average-
duration)
Retrospective assessment of
enjoyment
0.438
0.463
6-7 predicting participants’ memories using a combination of real-time measures of all four
experiments
Table 6-7 (above) shows the regressions for the simple- and comprehensive models for
the whole set of 128 users. Easy- and hard block tasks of the first experiment were
15 Values are R
2 of the prediction success of each model.

Experiment 4
150
included as individual moments, which is why the total number of users was 128, rather
than 108.
There was no significant difference found between the two models (significant F change
= 0.231). R2 (where R
2 is the prediction success of each model), was 43.8% for the
simple model, and 46.3% for the comprehensive model.
The results are very interesting, in that the combination of the peak and end were
equally good at predicting the perceived retrospective enjoyment as all moments
combined. This was a startling result, given that none of the experiments individually
came up with such a close match. This shows the benefit of using the larger sample size.
In addition, analysis was done of the standardized Beta coefficient values for each
moment, as shown in Table 6-8 (below):
Model
Standardized
Beta Coefficients
Simple model
Peak
0.454
End 0.311
Comprehensive model

Experiment 4
151
Peak
End
Initial
Average
Total
Duration
0.386
0.256
-0.011
0.155
-0.061
-0.091
6-8 Standardized Beta coefficients of the two models as predictors for all four experiments
As can be seen from the above table, the peak and end far and away exceed any of the
other moments in their predictive ability, in terms of the retrospective enjoyment
perceived by the individual.
This drawing together of the four experiments gives considerable weight to the
hypothesis that the peak-end rule can hold for web experience.

General discussion
152
Chapter 7 General discussion
This chapter summarises the results of the four experiments carried out in this thesis,
and their implications in terms of user experience. It attempts to answer the main
research questions by comparing and offering explanations of the analyses. It also
relates theauthor’s findings to the work done by other researchers on the replication of
peak-end rule in fields other than that of website experience. Additionally, this chapter
discusses the emotional impact of web experience. Towards the end it provides
recommendations for designers and practitioners, and suggests possibilities for future
research on the assessment of the emotional impact of website use.
Website design can have a marked effect on a user’s experience. Consequently, the
empirical evaluation of websites plays an important part in their design. Increasingly,
such evaluations include subjective aspects of user experience, such as satisfaction.
Standard evaluation methodology would allow users to interact with a website (perhaps
using a fixed set of tasks) and subsequently to report their degree of satisfaction, or
monitor other areas of impact.

General discussion
153
Recent work in experimental psychology has, however, shown that retrospective
summary evaluations are biased in a number of ways, when compared with real-time
experiences.
In particular, retrospective evaluations are influenced by the order of moment-by-
moment experiences, as well as their total or average intensity. Thus, when exposed to a
sequence of aversive sounds, people will prefer an experience that gets progressively
less unpleasant, to the reverse; even if the sum total of unpleasantness is equal. This
study investigated whether or not the order of experiences affects the retrospective
assessment of enjoyment for websites. It was assumed that if so, then evaluators would
need to pay attention to the order of tasks used in evaluation studies.
Motive:
The phenomenon of user need is crucial in any design process. Emotions and
perceptions are interrelated. The part of the human brain that is responsible for detecting
a bad smell, for example, borders that which is affected when a person is frustrated.
Many researchers have emphasised the importance of design in generating pleasure. The
real-time emotional response of the web user was considered as something of
importance. The central theme of this research was to come to some understanding of
the relationship between real-time and retrospective assessments of enjoyment.

General discussion
154
Method:
Many researchers have discussed the importance of emotional response to the web.
Most work has focused on the theoretical aspects relating to this, but this thesis used an
analytical approach. Web users’ emotions were recorded and monitored in an
experimental setting. Later, the peak and end enjoyment ratings of each participant were
identified. These two moments were then compared to others, in predicting the
retrospective assessments of enjoyment.
This thesis also attempted to test the preference for improvement. Two methods to
control enjoyment flow were implemented in order to test for this phenomenon.
Additionally, the effect of browsing duration on web user assessments was observed.
Summary of experiments:
The four experiments attempted to answer the three main research questions. The first
experiment, with the use of 40 participants, tested the influence of the current enjoyment
tool onparticipants’judgments.Thesecondexperimentmainlyfocusedontheefficacy
of using peak- and end enjoyment ratings, as against the average of all ratings and other
moments; as predictors of retrospective assessment. Again, 40 participants were
involved. The third and fourth experiments mostly tested for the phenomenon of
preference for improvement.

General discussion
155
In an attempt to control the flow of enjoyment, Experiment 1 used a method involving
variable task-difficulty; whereas a content order method was used in Experiment 4. The
former was unsuccessful; however, the latter was successful in controlling enjoyment.
The second experiment involved a free-browsing search to create about a possible
holiday. The extent to which peak and end enjoyment predicted retrospective enjoyment
ratings was low compared to the average of all moment-by-moment ratings. This
perhaps was due to the difference in the challenges set by each of the participants;
referred to the concept of flow by Csíkszentmihályi (1975) as where flow is defined as a
``situation where the perceived challenges of an activity are matched by the person's
perceived skills`` (Csíkszentmihályi 1975).
The third experiment, on the other hand, focused more on testing the effect of
manipulating the level of enjoyment towards the end of a web experience (following the
rating by participants in a preparatory study). The results showed that the more
enjoyment towards the end the better the retrospective assessment.
The third experiment made use of 30 participants, and was conducted in two phases. The
purpose of the first phase, performed by 10 participants, was to identify the most and
least enjoyable sections of three different websites, and to determine their favoured
website. The electronics-,and home & garden sections were later used in the design of
the second phase of the experiment.

General discussion
156
The fourth experiment controlled the real-time end moment, to further test for
preference for improvement. This last experiment used 30 participants. Three distinct
groups were separated by their low-, medium-, and high ratings of end enjoyment. Table
7.1 summarises the main results of each experiment.
This chapter is organised as follows:
Use of current enjoyment tool (CET)
Peak-end rule
Effect of task order on retrospective assessment
Effect of procedure duration on retrospective assessment
Web use and emotion
Future work

General discussion
157
Experiment 1: www.nih.com (Chapter 3)
(Fixed set of 8 health information-seeking tasks)
Experiment 2: www.brazil.com (Chapter 4)
(Free-browsing holiday information-seeking task)
There was a task-difficulty effect (hard tasks took
longer)
There was no task-order effect
There was a tool effect—users of the tool
completed tasks more slowly
The estimated time lost was 3 minutes out of
average of 10 minutes for the groups that used the
tool, i.e. 30%. Those groups that did not provide
real-time ratings used the tool to perform the tasks
only and the average duration of the procedure
was about 6 minutes
Time
There was no significant correlation with
retrospective e assessments of enjoyment (r = -
0.198)
There were no tool-, task-difficulty or order
effects
Retrospective
assessment
Retrospective assessments of design- and
enjoyment were highly correlated
Peak and end enjoyment moments correlated with
the retrospective assessments of enjoyment for
both easy- and hard task blocks
Average of all real-time enjoyment moments
correlated for the easy task block but not for the
hard task block
There was a contrast effect of end enjoyment
Real-time
Peak enjoyment did not correlate with
retrospective assessment of enjoyment ( this was
due to the considerable variation in peak time)
Average of all real-time and end- enjoyment
moments were correlated with retrospective
assessments of enjoyment

General discussion
158
moment (starting with the hard tasks and ending
with the easy tasks made the hard tasks harder,
and the easy tasks easier, than when the tasks
were in reverse order)
Peak and end enjoyment moments could predict
retrospective assessments of enjoyment as well as
all other moments combined together, including
peak-, end-, average-, total- and initial enjoyment
moment as well as duration of the procedure for
both easy- and hard task block
Multiple-
regression
There was a significant difference between the
predictions of the simple (peak and end) and
comprehensive (peak, end, average, total, initial
and duration) models
Experiment 3: www.shoplopcal.com (Chapter 5)
(Free-browsing but controlled shopping task,
`electronics` and `home& garden` were used to test order
effect on assessments)
Experiment 4: www.waitrose.com (Chapter 6)
(Free-browsing online-shopping task; CET was
modified to manipulate end- moment )
There was no significant correlation with
retrospective assessment of enjoyment (r = -
0.257)
Time
There was no significant correlation with
retrospective e assessments of enjoyment (r = -
0.042)

General discussion
159
Group 2 reported more enjoyment than Group
(Group 2 ended with `electronics` and started with
`home & garden` - that is, the reverse order to
Group 1)
Retrospective
Assessments
The method used to manipulate rating at end-
enjoyment moment ( low, medium or high)
confirmed what had been found in the third
experiment; that is, ending web experience with
high enjoyment would have a positive effect on
the retrospective assessments of enjoyment
Peak-, end- and average of all real-time
enjoyment were highly correlated with
retrospective assessment of enjoyment
Real-time
Peak-, end- and average of all real-time
enjoyment were highly correlated with
retrospective assessment of enjoyment
Multiple-regression
(Experiment 3 and Experiment 4)
Peak and end enjoyment moments could predict retrospective assessments of enjoyment as well as all other moments combined; including
peak-, end-, average-, total- and initial enjoyment moments, as well as duration of the procedure
7-1 Summary of the results of the four experiments

General discussion
160
This thesis has followed an analytical approach to better understandpeople’swebsite
evaluation. Real-time enjoyment ratings were monitored using what is called a current
enjoyment tool (CET) (see Chapters 3, 4, 5 and 6, ‘Design and material’ sections). All
four experiments were conducted to test the relationship between real-time enjoyment
moments and the retrospective assessment of enjoyment, in a website environment.
Experiment1 was constructed to examine the effect of the CET on retrospective
assessments of design and enjoyment. Participants who used the tool to rate real-time
enjoyment during a browsing session took longer to finish the experiment, so there was
an effect on overall duration. The estimated time lost was 3 minutes out of 10, or 30%.
Given the importance of monitoring emotion in web use, the minimal additional time
involved would appear to be worthwhile. It is important to note that the tool did not
tamper with the judgment of the participants; there was no `tool effect` found on
retrospective assessment. This result was encouraging in terms of the tool design.
One prospective use of the tool in future experiments is to embed it within a website as a
component; to give web designers and developers a better understanding of the moments
that influence awebuser’sjudgment.Itcouldworkasanindicatorofusers’emotional
responses. The emotional response of the web user could be more efficiently monitored
using the tool, than by the almost standard method of the questionnaire. Questionnaires
are more time consuming, and for this reason are often avoided.

General discussion
161
7.1 Peak and end enjoyment predictions
Using multi-linear regressions on the results from Experiment 1, it was demonstrated
that the simple model (using peak and end ratings) was as good a predictor of
retrospective assessment as the comprehensive model (which also included initial-, total-
, and average enjoyment, as well as duration of procedure, as factors). There was no
significant difference between the predictions of the respective models. The
comprehensive model predicted 64.4% of the variance in retrospective assessments,
whereas the simple model predicted 62.3% of the same variance.
In Experiment 2, there was a significant difference between the retrospective predictions
of the two models. These findings were not in support of the peak-end rule. The
comprehensive model, and indeed just the average of all ratings, was a better predictor
than peak and end enjoyment moments. The peak-end rule seems more likely to apply
when the peak and the end appear (despite their special status) to be somehow
representative of the whole episode that is judged retrospectively. This seems more
likely when the episode is constrained in terms of experience, and perhaps only varies,
or varies most saliently, in terms of the single parameter that is being judged (pain
during an operation, enjoyment during browsing). And perhaps it is this factor of
constraint that is compromised in the instance of free browsing. People may set very
different goals moment to moment, and explore different parts of the website. The low
correlation between peak times supports this view. The comprehensive model prediction

General discussion
162
of retrospective assessment was 57.6 %; whereas the simple model prediction was 26.3
%.
In Experiment 3, the prediction of retrospective assessment using peak and end
enjoyment ratings was relatively good, when compared to that of all ratings. There was
no significant difference between the two models. Simple and comprehensive model
predictions of retrospective assessments of enjoyment were: 68.3 % and 71.3 %
respectively. This result supported that of the first experiment; and further suggested
that peak- and end enjoyment could predict retrospective assessments within a
constrained environment; as accurately as all moments combined (average of all real-
time enjoyment ratings).
In Experiment 4, the predictions of retrospective assessment of enjoyment of both the
simple and comprehensive models were 48.8 % and 56.6% respectively. There was no
significant difference found between the predictions of the two models. This result
further supported what had been found in E1 and E3, that the peak and end could predict
retrospective assessment of enjoyment as well as all moments combined.
The regression analysis of a combination of the results of all four experiments has
shown very promising results. The peak and end moments were found to predict the
overall assessment of enjoyment as well as all other factors combined.

General discussion
163
Experiment 2 and 4 involved free-browsing tasks. Each individual taking part in such a
`high-end` task will end up finding their own route, devising their own challenges, in
order to remain stimulated (as suggested by Csíkszentmihályi (1975)).
The likelihood of two people taking an identical path, when there are so many options,
is very small indeed. The individuals in the set do not, therfore, have a shared
experience, and it follows that there will not be a clearly-defined peak.
However, the ending of an experience can be manipulated, as in Experiments 3 , and by
this means it was demonstrated that the retrospective assessment of enjoyment could be
predicted.
The findings regarding the use of the combination of peak and end enjoyment ratings, as
a predictor of retrospective assessment, could be summarised as follows:
Identifying peak enjoyment was found to be very difficult.
Experiment 2 results suggested that the average of all ratings was a more
accurate predictor of retrospective assessment; than peak and end enjoyment
ratings.
Peak and end enjoyment ratings of E1, E3 and E4 were found to be as accurate
as the combination of all ratings in predicting retrospective assessment of
enjoyment.
Peak and end enjoyment ratings were not always successful in predicting
retrospective assessment.

General discussion
164
Human emotion being so complex, it is very hard to predict the response to a
website.
7.2 Changing the order of events: effect on retrospective
assessment
This thesis tries to understand the emotional impact of website experience. More
precisely, it attempts to investigate perceived enjoyment on websites, by recording
people’s real-time enjoyment ratings, and comparing them to their overall enjoyment
ratings. The concept of pleasure being a result of an interaction with a product or a
website is not new in the field of design. Pleasure that results from the interaction with a
product can influence the overall judgment of that experience. However, is it possible to
turn a negative emotional experience into a more pleasurable one? Why not apply, or
further test what has been found in the field of psychology, to web use experience?
Ariely (2001) highlighted the fact that reversing the order of experience changed the
overall evaluation. If the experience was less satisfying towards the end, the overall
rating would be reduced: the reverse situation would result, conversely, in a higher
overall rating; when both experiences were weighted the same. Experiments 1 and 3 of
this work have investigated this matter, in an attempt to test whether or not such a rule
applies within website experience.

General discussion
165
The challenge was to find a way to recreate, within a web experience, equally weighted
events, of differing enjoyment rating. The number of links needed to complete a certain
task (the method used in E1) was not successful as a means of increasing and decreasing
task difficulty and its attending potential enjoyment. In that experiment, the task order
did not affect the retrospective assessment of either design or enjoyment.
The design of the first experiment failed to test for preference for improvement
(Loewenstein and Prelec 1993; Ariely 2001). The number of links required to reach a
task answer proved not to be a successful method of controlling enjoyment flow. Due to
the complexity of creating enjoyment flow on the web, there was a need for a different
approach. Preference for improvement was to be further tested in Experiment 3.
The second experiment was not designed to test for preference for improvement.
Instead, it looked for answers to the first and third research questions: - Which are the
better predictors of the retrospective assessment of enjoyment: peak- and end
enjoyment; or the average of all ratings? Is there a relationship between duration and
retrospective assessment?
E3, on the other hand, used a different approach to test order effect. It attempted to
examine what we can term website content order (See Chapter 5). In the first phase of
this experiment, 10 students were asked to identify a preferred website (of 3 options)
and its least- and most enjoyable sections. The shoplocal.com website was chosen; on
which the `electronics` section was deemed to be the most enjoyable, and `home and

General discussion
166
garden` the least enjoyable. In the second phase, two groups consisting each of ten
participants were tested. The Group 1 participants performed the procedure and
provided real-time enjoyment ratings, starting with `electronics` and ending with the
`home and garden` section; whereas Group 2 performed the same procedure, but in
reverse order. There was a significant content order effect on retrospective assessments,
since the Group 2 participants gave a higher enjoyment rating than Group 1. T-test
results showed that there was a significant difference between the two groups’
assessments of enjoyment.
A usability test based on laboratory experiments focuses on the audience of a specific
site, requiring them to perform a sequence of tasks. A participants’ screening
questionnaire and recruiting script would be provided. Usually, the participants perform
the tasks under the controlled conditions of an experimental procedure. People are
generally tested individually. The usability testing of websites seeks measurable answers
to questions, which confirm or challenge the assumptions of the developers. It provides
help in the creation of alternative designs. Ordinarily, there is a test plan, or test design
document, which will include the issues and questions to be answered by a certain group
of participants. Based on that test plan, the usability team develops scripts for the test
administrator, to ensure that all the participants receive the precise instructions, and that
there is an avoidance of errors. Afterwards, the participants would be asked to complete
a questionnaire, or to take part in a brief interview, regarding their experience (Kantner
and Rosenbaum 1997).

General discussion
167
There are concerns regarding the use of such a method. One, is that it requires more
resources and time than heuristic evaluations; and two, the process of recruiting
participants in laboratory testing can be an issue, given that their profile needs to match
certain criteria; based on the aim of the test and target audience (Kantner and
Rosenbaum 1997).
According to the results obtained from E3, the order of the content of a website affects
people’s retrospective assessment of enjoyment. Practitioners and usability conductors
are to be encouraged to give more attention to the task order effectonpeople’sglobal
evaluation. This thesis recommends randomizing for each participant, or deliberately
manipulating order (as done in this thesis) to look at how much differences it makes.
7.2.1 Preference for improvement
The findings of the third experiment were interesting. For the first time, it seemed that
what was called the content order method, had managed to control enjoyment flow; and
showed that participants who ended with a higher enjoyment rating, retrospectively
reported greater enjoyment, than those who ended with a lower enjoyment rating. In
other words, the experience was perceived as being more enjoyable overall, when there
was an increase in the intensity of enjoyment; even though the sum of the intensity of
enjoyment was the same: participants who ended with `electronics`, recorded a higher
retrospective assessment of enjoyment, than those who ended with `home & garden`.

General discussion
168
The recognition that students enjoyed `electronics` more than `home & garden` (from
the previous questionnaire) led to a means of controlling enjoyment.
The fourth experiment further tested preference for improvement. The experimental
design attempted to control enjoyment flow by controlling the end enjoyment (see
Chapter 6 `Design and material` section). The results confirmed the preference for
improvement effect on retrospective assessment. They demonstrated that people who
ended with a high enjoyment experience gave a correspondingly elevated assessment.
This phenomenon, suggested by Ariely, occurred in the third and fourth experiments,
which replicated online shopping experience. The results confirmed the existence of
order effect or preference for improvement in the retrospective assessments of
enjoyment of web users.
Here is what we have learned about preference for improvement in the web
environment:
It was very difficult to control the enjoyment of the user on the web by
manipulating a simple proxy for task difficulty.
The number of links required to complete a task did not equate with task
difficulty. This was not, therefore, a method to control enjoyment.
Enjoyment flow can be manipulated, when there is prior knowledge of the
user. In this instance, the set was pre-tested, to confirm a preference for
`electronics` over `home & garden`.

General discussion
169
Preference for improvement occurred in Experiments 3 and 4:
Increasing the intensity of enjoyment towards the end caused an elevated retrospective
assessment of enjoyment; demonstrated by an online shopping experience.
7.2.2 The effect of end enjoyment moment on retrospective assessments
E4 was designed to further investigate the end effect on the retrospective assessment of
enjoyment of a website. The tool was modified to match the experimental design; to
manipulate the creation of low-, medium-, and high end- enjoyment (see Chapter 5
Figure 5.1). Participants who ended their web browsing at a high enjoyment level
recorded a higher retrospective assessment than those who ended with low or even
medium enjoyment. This result indicates the influence of end moments on the
retrospective assessment of websites.
7.3 Duration neglect
The relationship between the duration of a procedure and its retrospective assessment
was investigated. The study did not focus on duration neglect but attempted to monitor
its presence/ absence.
In Experiment 1, the duration of the procedure was not significantly correlated with the
retrospective assessment of enjoyment, for the four groups. The results also showed that

General discussion
170
there was a significant effect of the tool on overall duration, as explained earlier; but
changing the task order (E-H and H-E) did not have an effect on overall duration, and
there was no significant interaction between the factors. The easy- and hard tasks each
took longer to complete with the tool: (mean with tool = 4 min 20 sec; mean without
tool = 3 min 9 sec). The task order had no effect on the duration of the easy tasks, but
the hard tasks took longer to complete when participants started with them, compared
with when they finished with them; and this effect was greater with the tool than without
the tool.
In Experiment 2, the procedure duration did not statistically correlate with retrospective
assessments of design or enjoyment. This suggested that the duration did not affect the
participants’ judgments.
The effect of the duration of a procedure on retrospective assessment was monitored
throughout the four experiments. The procedure duration was not statistically correlated
with retrospective assessments of enjoyment in any of them. It was assumed that
duration had played a relatively insignificant role, and that the participants in some way
seemed to greatly ignore it. This was a clear example of duration neglect.
Therefore, it was found that:
Duration did not influence retrospective assessment of enjoyment when
participants performed free-browsing, or a fixed set of tasks.

General discussion
171
There was a time cost involved in using the tool, but this did not affect the
overall ratings
The correlation of duration with overall enjoyment rating for the free-browsing
task was negative, while the same correlation for the fixed set of tasks was
positive: both correlations were very low and not statistically significant
Free web-browsing method might have reduced the intensity of the experience.
7.4 Research outcomes:
The current enjoyment tool succeeded in capturing the real-time enjoyment of the web-
user. The assessment of the real-time emotions experienced on the web is not
straightforward. Much work remains to be done in this area.
Website real-time evaluation provided more understanding about how people come to
form their retrospective judgments. The research has met the seven objectives outlined
earlier. Peak and end predictions of retrospective assessments were good in some
elements of the work, and poor in others. Experiments 3 and 4 provided strong evidence
of preference for improvement on the web. Duration neglect occurred in the free-
browsing task, and duration was found not to be correlated with assessment when
participants were required to do a set of tasks or free-browsing task.
The peak-end rule is of considerable importance to web practitioners, in particular, the
preference for improvement implications on retrospective assessment. Peak-, and

General discussion
172
especially end real-time enjoyment moments are unique, and found in some cases to be
related to retrospective assessment; while in others not. It is not recommended to depend
entirely on peak and end enjoyment moments at this stage; rather it is highly advisable
to consider all other real-time enjoyment moments, and to identify the moments and
factors that influence retrospective assessment by the web user.
Preference for improvement occurred in the third and fourth experiments of this thesis.
This result is invaluable for usability testers and web evaluators. The results of this
research clearly demonstrate that providing the user with the most enjoyable section
towards the end of a procedure has the greatest effect on retrospective assessment. It
increases web user enjoyment, and the chances of him/her returning to the website. It is
crucial to give close attention to task-order in web usability testing. Randomizing task-
order is not recommended.
7.4.1 Peak-end rule: implication for web experience
Regardless of the explosion in information technology, and increasing dependency on
computers in all aspects of social life, it is only recently that user need has been taken
seriously; in the design process of products, and in particular, websites. Usability
engineering is all about studying and designing an easy-to-use product. Human
computer interaction (HCI) is considered to be a major component of usability
engineering. HCI focuses on how people interact with computer technology, and how to
improve the efficiency of such interaction. It provides a theoretical foundation for

General discussion
173
applying usability concepts to software applications and computer interfaces; including
websites.
The following section includes recommendations to user-experience practitioners and
web-designers; as well as to web-evaluators.
Peak-, and more importantly end enjoyment moments of web experience were
found to be relatively good predictors of retrospective assessment. User-
experience designers and practitioners are highly recommended to consider these
moments in the design process; since it easier than integrating the rating of all
moments. Although the average ratings of all enjoyment moments were better
correlated with retrospective assessment in some cases, peak and end moment
ratings are still considered to be beneficial.
The effect of duration on the assessment of a web experience, tested by the
Spearman correlation, seemed to be very low.
Usability testers are highly recommended to pay more attention to the ordering
of tasks, and on the presentation of website contents through a usability test
procedure. The aim is to end the web experience at a high enjoyment level.
7.5 Web use and emotion
It was found to be difficult to manipulate the flow of enjoyment within a website
experience. This could be due to the nature of website experience. For instance, it is

General discussion
174
almost impossible to alter the order of the links required to set up an email account,
whereas a dentist, for example, has more control over the sequence of a procedure. In a
web experience, users are more involved in an interaction. This noticeable difference
between website experience and other experiences, which influenced the course of the
research, is named in this thesis level of involvement.
In the earlier part of the work, an effort was made to control enjoyment flow, by varying
the number of links required to complete a task. This proved to be unsuccessful. On the
other hand, what we refer to as website content order demonstrated that increasing the
enjoyment level towards the end of a web experience resulted in a higher retrospective
assessment of enjoyment.
Predicting the emotional response to a website experience is very difficult. The
interaction of an individual with a website can vary dramatically. There are many factors
whichcomeintoplay,toaffectpeople’sjudgment:attitude,levelofinterest,or response
towards certain visual cues within the website (for instance, the logo). This thesis
focused on people’s enjoyment within a website experience, and worked on the
assumption that the participants were in a relatively calm, emotionally stable state.
7.6 Future work
The primary focus of this study was to test the efficacy of peak-end rule in website
experience. The real-time enjoyment of a web experience was assessed using the

General discussion
175
perspective of individual participants. Future research may focus on different techniques
for identifying peak and end enjoyment moments; perhaps using a magnetic resonance
imaging (MRI) to keep track of a participant’s emotional state during a browsing
session; to come to a better understanding of emotions that are aroused during
interaction with a website. Another interesting topic to investigate might be the use of
the peak-end rule in a social interaction environment; to see how one person’s peak
could influence the judgment of one or more others; to determine what implications
there may be.
The work in the field of real-time emotions on the web has barely begun. There are
many factors and a range of emotions that remain to be tested in the web environment.
Further study of the duration neglect effect on retrospective assessment is required.
Identifying the factors responsible for generating certain emotions would aid the control
of the flow of the web user experience. Modifications to the current enjoyment tool
could help to `fine-tune` the monitoring of hedonic emotions, and give greater
clarification to researchers and designers, in order to facilitate the connection with the
user.
Theaimis tounderstandpeople’swebassessments; to learn from the web user about
emotional response on the web.
Couldoneperson’speakaffectanother’s?Whatfactorscouldbeidentified?

General discussion
176
An experimental setting was considered to test the peak-end rule in a collaborative
environment. Two groups of 20 participants would perform the procedure. The first
group would comprise ten participants browsing a shopping website; each participant
would browse using the Current Enjoyment Tool (CET) assigned to them for five
minutes in turn; so each could report his real-time emotion throughout the browsing
session. The second group would perform the same procedure as the first group, but
each participant would browse and report his real-time rating of the browsing session
alone, without any collaboration. This design would allow the testing of the influence of
people’speakemotiononeachotherduringaweb browsing experience; and at the same
time, this design would further investigate the emotional peak, and its relationship with
retrospective assessment, as each group would be asked for their emotional assessment
following their browsing. The comparison of the assessments of the two groups through
the use of the Spearman correlation tests and ANOVAs as well as multi-linear
regression analysis, similar to the models used in this thesis; this might enable the
identification of the collaboration and individual factors- or the understanding of the
nature of the peak-end rule in a collaborative web setting.
The details regarding the above proposed experimental work would take time to fine
tune. The emotional impact of the peak moment in web browsing, on the self and
potential other(s), needs more investigation. The consideration of age as an additional
factor, looking at within- and cross-generation influence is something of considerable
interest and importance. The research on emotional response on the web has barely

General discussion
177
begun. There are many seeds of ideas that are in need of further investigation. The
future work connected with this study could be summarised as the in-depth analysis of
the emotion generated at the peak and end moments on the web; in order to identify the
factors that influence such moments. (The end moment was found to be of particular
importance from the findings of the current research.)
The phenomenon of duration neglect, which is part of the peak-end rule, would need to
be considered in any future work. The effect of the duration of the experimental
procedure would be monitored throughout the proposed studies above.
There is a need for new ideas and methods to keep a better track of the experiment
procedure timings, such as start time and end time. One of the challenges faced in the
current research was the complexity of the design of the tool, in recording time variables
ofeachparticipant’sexperience.Linkingthistothepreviousproposedexperiments,itis
important to consider devising an easy and efficient method for recording the ratings of
individuals and paired participants (as proposed above) in order to maximise the benefit
of the data gathered, and ease the statistical analysis. This could be done by working
with experienced web application developers, in order to simplify the tool functionality,
in an attempt to gather data that best serves the research objectives, and that is tailored
to the data analysis process.
As has been said, the end moment of enjoyment seemed to be very influential on
retrospective assessments of enjoyment, in the current research. The result of the current

General discussion
178
research has shown the importance of the end moment, at least regarding the enjoyment
level on the web. This research directs to further testing the relation of the end moment
on retrospective assessments on various positive emotions, such as happiness,
excitement and fun.
The experiments conducted in the current research could be replicated by shifting the
investigated emotion from enjoyment to happiness or fun perhaps since of triumph or
relief or amazement and even excitement. This would help us understand the nature of
different positive emotions on the web (separately).
An idea that came to light is related to multiple recording of emotions at the same time;
to include more than one sliding bar to gather more emotions. For instance, imagine the
CET with three emotional slides joy, fun and excitement; would the user of the web be
able to express such emotions at once? Would he or she (the user) be able to distinguish
between those emotions? Is it technically possible or practical to gather such emotions
on the web? Because of the complexity of such mixed emotion it has been decided to
delay the implementation of this method and try to apply a more realistic way by
focusing on single emotion that promotes positive web experience as discussed in
previous paragraph.
One of the challenges encountered during the analysis of the data of the current
research, was the link between the web page and the value of the enjoyment reported.
There was neither enough time nor resources to gather such information. Now that the

General discussion
179
understanding of the whole process has developed, along with a knowledge of the
potential pitfalls, it has been possible to think of a simple idea that could be developed
over time; that of keeping track of each web page, and linking it with the emotional
value reported by the web user. To put it simply, a print screen command could be
programmed for every time the participant gives a real-time emotional response. This
snapshot of the web page would be linked, and kept in a database in accordance with the
user group and reported real-time emotions, for further statistical analysis.
Identifying new means of testing the preference for improvement on the web, following
the review of the peak-end rule theory, as proposed by Ariely 2001, could be done by
expanding the method defined in this thesis as content-by-content. The method, which
used ‘electronics’ and ‘home and garden’ sections, to replicate decreasing and
increasing enjoyment on the web, assumed that the electronics section was perceived as
the more enjoyable; based on a preparatory study. This could be replicated in other
preparatory studies, to better understand the user group in relation to such positive
emotions as those proposed above. After identifying the sections, and relating them to
the emotion, it would be possible to come up with three sections that replicated
increasing fun, excitement... and then to examine whether or not there is any significant
difference in reversing the sequence.

General discussion
180
7.7 Summary
This thesis followed an analytical approach, seeking to understand the ways that people
evaluate their enjoyment of website experiences. All four experiments were conducted
to test the replication of peak-end rule (proposed by Daniel Kahneman and his
colleagues) for website experience.
Peak moments were difficult to identify, and did not correlate with retrospective
assessment as well as end moments. Due to the fact that people are operating at different
levels, they end up devising their own strategies to remain stimulated (Csíkszentmihályi
1975).
The peak for one will not equate with the peak for another in an open task, such as free-
browsing. This disparity of interest, ability and emotional nature is perhaps the reason
why the peak-end rule will not hold for a group, in these circumstances; even though it
may well hold for an individual. The content order had an effect on people’s overall
judgments. It was concluded that duration plays little or no role in retrospective
assessment.
When designing a website, it is crucial to have a client-group in mind, in order to be
able to accommodate as far as possible the need of the people in it. Referring to
Lindgaard’swork it is important to create an image that is sufficiently imaginative to
draw the user in almost instantly. Once the user is `caught`, as it were, then what is

General discussion
181
required of them must be stimulating in order to hold their interest (Lindgaard,
Fernandes et al. 2006). As Csíkszentmihályi (1975) suggests, if it is too demanding, the
user is likely to lose heart; if too easy, they will be likely to move on elsewhere
(Csíkszentmihályi 1975).
The current enjoyment tool (CET) has been developed and amended throughout the four
experiments of the current research. At first, the CET was designed to keep records of
the participants’ real-time enjoyment ratings; using a sliding bar that ranged from 0 to
100. Informal pilot studies were conducted, asking users to use the CET while browsing
different websites. Following this, the CET had to be modified to fit the design of the
first experiment, which involved using a set of eight tasks; in order to ease participants’
browsing, and eliminate the use of paper in this experiment. The set of eight tasks were
included in the CET itself; according to the conditions of the experimental design, that
made use of four groups (as explained in Experiment 1).
Modifications were also made to the second experiment CET. This time, the enjoyment
tool was stripped of all the tasks, and simply left with the sliding bar that ranged
between 0 and 100; marked with low-, medium- and high enjoyment. The disappointing
results of the first experiment, which attempted to test for the preference for
improvement on the web; relying on the number of links required to reach a task
answer, to determine task difficulty; led to this decision. There were neither tasks, nor
the testing of preference for improvement in the second experiment. At this point in the
research, it was decided to focus on the assessment of peak-end rule replication on the

General discussion
182
web, to adjudge whether or not it is possible in such a hectic setting given the
comparatively unconstrained nature of the experimental environment, when compared
with that of the experiments conducted by Kahneman and his fellow workers, in proving
the peak-end rule.
The third experiment, on the other hand, returned to testing for the preference for
improvement in the web environment. However, unlike the method used in the first
experiment, that in the third made use of two sections of a single website; based on the
opinions of a sample of 10 students, who decided which of the sections were the most
and least enjoyable. The experiment gave promising results: controlling the web
experience to allow greater enjoyment towards the end may well be beneficial; the
design of sites to this end needs very careful planning, with a good knowledge of the
target user. Ending an experience in an enjoyable way appears to have a positive
influence on the way that the individual perceives their experience. The more
pleasurable the overall impression, the more likely is a return to the same site. There are
many factors and challenges; it has not been easy to test for the preference of
improvement on the web in a laboratory setting: clearly the real world environment is
considerably more complex.
All four experiments attempted to test the peak-end rule. Overall, the current research
stresses the importance of the peak and end enjoyment moments, with the end
enjoyment being more predictive of the overall assessments of enjoyment of people on
the web. There was an issue with the predictive power of the peak enjoyment moment,

General discussion
183
at least in the second experiment. The free-browsing task of the second experiment
resulted in the peak being ill-defined; presumably due to individual meanderings. This is
a demonstration of the limitations of the peak-end rule, which does not appear to hold in
an unconstrained environment. As the work progressed, it became clear that what was
needed was the creation of a constrained environment, in order to test the adequacy of
the peak-end rule. This was to determine the nature of the design of the later
experiments, which despite constraints allowed a degree of freedom to the participants;
given that this thesis was geared to the assessment of the validity of the peak-end rule,
using the factor of enjoyment rather than pain or discomfort.
Further statistical testing with the inclusion of the low peak showed an improvement in
the peak prediction, but there was still a significant difference when compared to the
comprehensive model. The prediction of the overall assessment of enjoyment by the
average of all real-time moments was greater than that of the peak and end moments:
although it is the case that the peak and end moments were included in the average of all
real-time moments.
This research indicates the importance of the real-time moments: without their
identification, it would be very difficult to understand how people make their judgments.
Collecting real-time ratings is a difficult task, time consuming, and could be very
complicated in real-life. Therefore, focusing on the peak and end moments could save

General discussion
184
time and resources, and help to provide people with better web experiences. Before
pronouncing the importance of these two moments, there is a need for more testing.
In creating a large sample size by the use of the experiment cluster, the results were very
promising indeed: the fact that future work would benefit from this, is clear to see.
The duration of the procedure of the four experiments was recorded, and tested using
Spearman’s correlation, for its significance on retrospective assessments of enjoyment
within laboratory experiments on the web. The correlations were very low and in most
cases in the negative. Because of this, it was concluded that time has little or no effect
onparticipants’retrospectiveassessmentsofenjoyment.Thissuggests that participants
appear not to pay much attention to the duration of their browsing when reporting
overall assessments. Considerable thought and effort was put into the research to
encourage a sense of flow to the participants’web browsing. It would appear that as
participants become deeply involved in rating and browsing they naturally disregard the
duration of a procedure. The individual has agency. Further experimentation would help
to give a better understanding of the relationship between the duration of a procedure,
and its assessment.
The key is to do the groundwork, in order to have as great an understanding of the user
group as possible. Then the material can be pitched at an appropriate level.
UX designers, and usability testers and practitioners, are advised to pay attention to
content order in usability studies, and the web-design process. Emotion plays a big role

General discussion
185
in web experience. The ending of a web experience with increasing enjoyment, results
in the perception of an overall more pleasurable experience. Therefore, it is highly
recommended that the design is such, that it creates a pleasant ending to the experience.

Appendix A
186
Appendix A
Experiment 1: first questionnaire: After the first block of tasks.
Considering the four tasks you have just completed:
1. Could you give your opinion about the design of the website?
O O O O O O O O O O O
-5 -4 -3 -2 -1 0 +1 +2 +3 +4 +5
Low Medium High
2. To conclude could you please rate the overall enjoyment you experienced with
the website:
O O O O O O O O O O O
-5 -4 -3 -2 -1 0 +1 +2 +3 +4 +5
Low Medium High

Appendix A
187
Experiment 1 second questionnaire: After the second block of
tasks.
Considering the four tasks you have just completed please complete the following
1. Age _________________
2. Gender Male / Female
3. What is your occupation/subject? __________________
4. For how long (in months) have you used the web? __________________
5. How many hours do you use the internet per week? _________________
6. Could you give your opinion about the design of the website?
O O O O O O O O O O O
-5 -4 -3 -2 -1 0 +1 +2 +3 +4 +5
Very bad
design Neutral
Very
good
design
7. To conclude could you please rate the overall enjoyment you experienced with
website:
O O O O O O O O O O O
-5 -4 -3 -2 -1 0 +1 +2 +3 +4 +5
Low Medium High

Appendix A
188
Experiment 2: questionnaire
1. Age ___________
2. Gender Male / Female
3. What is your occupation/subject? _________________
4. For how long in years have you used the web? _________________
5. How many hours do you use the internet per week? _________________
6. Make a list of few places you would like to visit in Brazil? _________________
7. Could you give your opinion about the design of the website?
O O O O O O O O O O O
-5 -4 -3 -2 -1 0 +1 +2 +3 +4 +5
Very bad
design Neutral
Very
good
design
8. To conclude could you please rate the overall enjoyment you experienced with
website:
O O O O O O O O O O O
-5 -4 -3 -2 -1 0 +1 +2 +3 +4 +5
Low Medium High

Appendix A
189
Experiment 3: Phase 1 questionnaire
1. Have you used this website before? Yes /No
2. Which section did you enjoy the most?
3. How much did you enjoy it? (Please select one only)
4. Which section did you enjoy the least?
5. How much did you enjoy it? (Please select one only)
O O O O O
1 2 3 4 5
Low Medium High
O O O O O
1 2 3 4 5
Low Medium High

Appendix A
190
Play.com
1. Have you used this website before? Yes /No
2. Which section did you enjoy the most?
3. How much did you enjoy it? (Please select one only)
4. Which section did you enjoy the least?
5. How much did you enjoy it? (Please select one only)
O O O O O
1 2 3 4 5
Low Medium High
O O O O O
1 2 3 4 5
Low Medium High

Appendix A
191
Shopping.com
1. Have you used this website before? Yes /No
2. Which section did you enjoy the most?
3. How much did you enjoy it? (Please select one only)
4. Which section did you enjoy the least?
5. How much did you enjoy it? (Please select one only)
General information:
1. Age ____________
2. Gender Male / Female
3. What is your occupation/subject? ______
4. For how long in years have you used the web? _______
5. How many hours do you use the internet per week? __________
O O O O O
1 2 3 4 5
Low Medium High
O O O O O
1 2 3 4 5
Low Medium High

Appendix A
192
Experiment 3: Phase2 questionnaire
Please fill in the following:
1. Age ____________
2. Gender Male / Female
3. What is your occupation/subject? ______
4. For how long in years have you used the web? _______
5. How many hours do you use the internet per week? __________
6. Please rate the overall enjoyment you experienced with website:
O O O O O O O O O O O
-5 -4 -3 -2 -1 0 +1 +2 +3 +4 +5
Low Medium High

Appendix A
193
Experiment 4: questionnaire
Please fill in the following:
1. Age ________________
2. Gender Male / Female
3. What is your occupation/subject? _________________
4. For how long in years have you used the web? _________________
5. How many hours do you use the internet per week? ________________
6. Did you use the website Yes/ NO
7. Please rate the overall enjoyment you experienced with website:
O O O O O O O O O O O
-5 -4 -3 -2 -1 0 +1 +2 +3 +4 +5
Low Medium High

References
194
References
Alalawi, M. (2006). User Experience: summary judgments and momentary emotions. School of informatics. Manchester, The university of manchester. Msc. Ariely, D. (2001). "Seeing Sets: Representation by Statistical Properties." psychological science 12(2). Ariely, D. and Z. Carmon (2003). "Summary assessment of experiences : The Whole is different from the Sum of its parts." Time and decisions. Ariely, D., G. Loewenstein, et al. (2006). "Tom Sawyer and the construction of value." Journal of Economic Behavior & Organization 60(1): 1-10. Avouris, N., N. Tselios, et al. (2003). Website Evaluation: A Usability-Based Perspective. Advances in Informatics: 165-183. Barrett, L. F. (1997). "The Relationship among Momentary Emotion Experiences, Personality Descriptions, and Retrospective ratings of emotion." Personality and Social Psychology Bulletin 23(10): 1100-1110. Battarbee, K. (2003). Defining Co-experience. DPPI'03. Pittsburgh, Pennysylvania, ACM: 109-113. Battleson, B., A. Booth, et al. (2001). "Usability Testing of an Academic Library Web Site: A Case Study." Journal of Academic Librarianship 27(3): 188. Benyon, D. and B. Wilmes (2003). The Application of Urban Design Principles to Navigational of Informational Spaces. People and Computers XVIII — Designing for society. E. O'neill, P. Palanque and P. Johnson. Bath, Springer London: 105-125. Bessière, K., J. Newhagen, et al. (2006). "A model for computer frustration: the role of instrumental and dispositional factors on incident, session, and post-session frustration and mood." Computers in Human Behavior 22(6): 941-961 Carlson, R. A. (1997). Experienced cognition. New York, Lawrence Erlbaum Associates.

References
195
Chadwick-Dias, A., M. McNulty, et al. (2003). Web usability and age: how design changes can improve performance. Proceedings of the 2003 conference on Universal usability. Vancouver, British Columbia, Canada, ACM. Chen, H., R. T. Wigand, et al. (1999). "Optimal experience of Web activities." Computers in Human Behavior 15: 585-608. Csíkszentmihályi, M. (1975). Beyond boredom and anxiety. San Francisco CA, Jossey-Bass. Danuta, A. and B. Franklin (1999). "New measures for research libraries: New measures for research libraries." The Journal of Academic Librarianship 25(6): 484-487 De-Marsico, M. and S. Leviald (2005). "Evaluating web sites: exploiting user's expectations." International Journal of Human-Computer Studies 60(3): 381-416 Fiske, S. T. and S. E. Taylor (1991). Social cognition Rading, MA, Addison-Wesley. Flavián, C., M. Guinalíu, et al. (2006). "The role played by perceived usability, satisfaction and consumer trust on website loyalty." Information & Management 43(1): 1-14. Forlizzi, J. and K. Battarbee (2004). Understanding experience in interactive systems. Proceedings of the 5th conference on Designing interactive systems: processes, practices, methods, and techniques. Cambridge, MA, USA, ACM. Fredrickson, B. L. and D. Kahneman (1993). "Duration neglect in retrospective evaluations of affective episodes." Journal of personality and social psychology 65(1): 45. Garrett, J. J. (2009). Boxes and Arrows Podcast. The Memphis Plenary. Memphis, NT,USA. Green, T. R. G., S. J. Payne, et al. (1983). The Psychology of Computer Use. Orlando,Florida, Academic Press INC. Greenwald, A. G. and M. R. Banaji (1995). "Implicit social cognition: Attitudes, self-esteem, and stereotypes." Psychological Review 102(1): 4-27.

References
196
Gwizdka, J. (2009). "Assessing Cognitive Load On Web Search Tasks." The Erogonimics Open Journal 2: 114-123. Halvorson, K. (2010). Content Strategy for the Web. Berkeley, New Riders. Hassenzahl, M. and N. Sandweg (2004). From mental effort to perceived usability: transforming experiences into summary assessments. CHI '04 extended abstracts on Human factors in computing systems. Vienna, Austria, ACM: Vienna, Austria. Hassenzahl, M. and N. Tractinsky (2006). "User experience : a research agenda." Behaviour & Information Technology 25(2): 91-97. Haynes, M. (2002). User Experience As Corporate Imperative Raleigh, hesketh.com/inc. Hodge, K. (2006). Create sites with impact. .net: 32-38. Hodges, S. M., L. Jandorf, et al. (1968). "Meaning of daily emotion measurements." Journal of Perdonality and Social Sspychology 48: 428-434. Holmberg, D. and J. G. Holmes (1994). Reconstruction of relationship memories: A mental models approach. Autobiggraphical memory and the validity of retrospective reports. N. Schwarz and S. Sudman. New York, Springer-Verlag: 267-288. Hwang, Y. and D. J. Kim (2007). "Customer self-service systems: The effects of preceived Web quality with service content on enjoyment, anxiety, and e-trust." Decision Support Systems 43: 746-760 ISO, F. (2009). Ergonomics of human system interaction - Part 210: Human-centred design for interactive systems (formerly known as 13407). Switzerland, International Organization for Standardization (ISO). Jobber, D. (1995). Principles and practice of marketing London, McGraw-Hill International (UK) Limited. Jordan, P. W. (1999). Designing Pleasurable Products: An Introduction to the New Human Factors, Taylor & Francis Kahneman, D., B. L. Fredrickson, et al. (1993). "When more pain is preferred to less: Adding a better end." Psychological science 4(6): 401.

References
197
Kahneman, D., P. P. Wakker, et al. (1997). "BACK TO BENTHAM? EXPLORATIONS OF EXPERIENCED UTILITY." The Quarterly Journal of Economics 112: 375-405. Kantner, L. and S. Rosenbaum (1997). Usability studies of WWW sites: heuristic evaluation vs. laboratory testing. Proceedings of the 15th annual international conference on Computer documentation. Salt Lake City, Utah, United States, ACM. Kemp, S., C. D. B. Burt, et al. (2008). "A test of the peak-end rule with extended autobigrophical events." memory and cognition 36(1): 132-138. Khan, K. and C. Locatis (1999). "Searching through Cyperspace: The effects of Links Display and Link Density on Information Retrieval from Hypertext on the World Wide Web." Journal of American Society for Information Science 49(2): 176-182. Landauer, T. K., B. E. John, et al. (1989). THE ROLE OF LABORATORY EXPERIMENTS IN HCI: HELP, HINDRANCE, OR HO-HUM? (PANEL). CH1'89, Yorktown Heights, NY 10598, IBM Watson Research Center. Lazar, L., A. Jones, et al. (2006). "Severity and impact of computer user frustration: A comparison of student and workplace users " Interacting with Computers 18(2): 187-207 Lindgaard, G., G. Fernandes, et al. (2006). "Attention web desingers: You have 50 milliseconds to make a good first impression!" Behaviour & Information Technology 25(2): 115-126. Loewenstein, G. F. and D. Prelec (1993). "Preferences for Sequences of Outcomes." Psychological Review 100(1): 91-108. Nisbett, R. and L. Ross (1980). Human inference: Strategies and shortcomings of social judgment. Englewood Cliffs, NJ, Prentice Hall. Norman, D. A. (2011). "jnd.org." 2010. Palmer, J. and D. Griffith (1998). "An emerging model of Web site design for marketing." Communications of the ACM 41(3): 44 - 51 Parkinson, B., R. B. Briner, et al. (1995). "Time frames for emotion: Relations between momentary and generalized ratings of affect." Personality and Social Psychology Bulletin 21: 331-339.

References
198
Pilgrim, C., Y. Leung, et al. (2005). Supplemental Navigation Tools for Website Navigation — A Comparison of User Expectations and Current Practice. People and Computers XVIII — Design for Life. S. Fincher, P. Markopoulos, D. Moore and R. Ruddle, Springer London: 263-275. Ping, Z., G. Dran, et al. (2001). "Important Design Features in Different Web Site Domains an Empirical Study of User Perceptions." e-Service Journal 1(1): 77-91. Redelmeier, D. A. and D. Kahneman (1996). "Patients' memories of painful medical treatments: real-time and retrospective evaluations of two minimally invasive procedures." Pain 66(1): 3-8. Ross, M. (1989). "Relation of Implicit Theories to the Construction of Personal Histories." American Psychological Association 96(2): 341-357. Sanders, E. B.-N. and U. Dandavate (1999). Design for Experienceing: New Tools. Proceedings of the First International Conference on Desing and Emotion Delft Schreiber, C. A. and D. Kahneman (2000). "Determinants of the Remembered Utility of Aversive Sounds." Journal of Experimental Psychology: General 129(1): 27-42. Shatz, T. M. (2009). "Evaluating Multiepisodes Events: Boundry Conditions for the Peak-End Rule." Emotion 9(2): 206-213. Triandis, H. C. (1980). Values, attitudes, and interpersonal behavior, . Lincolin, NE, University of Nebraska Wang, P., W. B. Hawk, et al. (2000). "Users' interaction with World Wide Web resources: an exploratory study using a holistic approach." Information Processing and Managment 36(School od Information Science): 229-251. Whiteside, J. and D. Wixon (1987). The dialectic of usability engineering. INTERACT 87 2nd IFIP International Conference on Human Computer Interaction, Stuttgart, Germany.