Embed Size (px)
Citation preview
Review ofInternationalAssessments ofIreland’sCompetitiveness
3
Inte
rnat
iona
l Rev
iew
Nat
iona
l Com
peti
tive
ness
Cou
ncil
3
Inte
rnat
iona
l Rev
iew
20
07
Nat
iona
l Com
peti
tive
ness
Cou
ncil
National C
ompetitiveness C
ouncilInternational R
eview 2
00
7
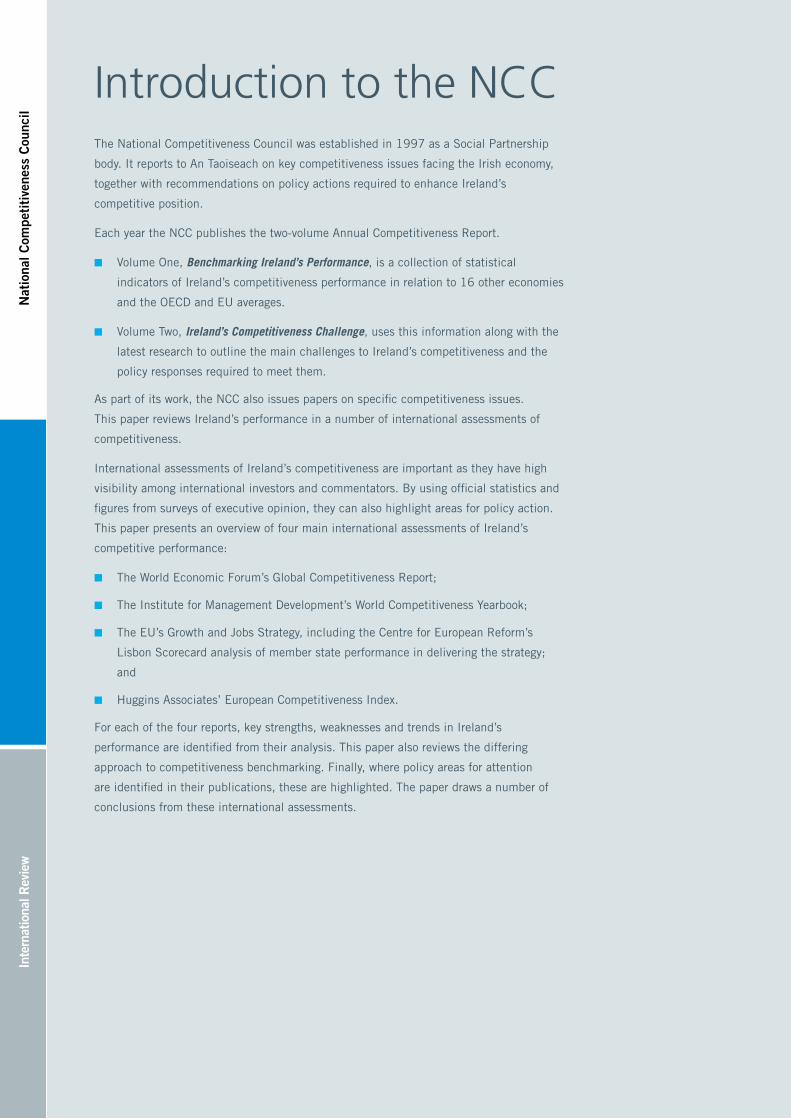
Introduction to the NCCThe National Competitiveness Council was established in 1997 as a Social Partnership
body. It reports to An Taoiseach on key competitiveness issues facing the Irish economy,
together with recommendations on policy actions required to enhance Ireland’s
competitive position.
Each year the NCC publishes the two-volume Annual Competitiveness Report.
■ Volume One, Benchmarking Ireland’s Performance, is a collection of statistical
indicators of Ireland’s competitiveness performance in relation to 16 other economies
and the OECD and EU averages.
■ Volume Two, Ireland’s Competitiveness Challenge, uses this information along with the
latest research to outline the main challenges to Ireland’s competitiveness and the
policy responses required to meet them.
As part of its work, the NCC also issues papers on specific competitiveness issues.
This paper reviews Ireland’s performance in a number of international assessments of
competitiveness.
International assessments of Ireland’s competitiveness are important as they have high
visibility among international investors and commentators. By using official statistics and
figures from surveys of executive opinion, they can also highlight areas for policy action.
This paper presents an overview of four main international assessments of Ireland’s
competitive performance:
■ The World Economic Forum’s Global Competitiveness Report;
■ The Institute for Management Development’s World Competitiveness Yearbook;
■ The EU’s Growth and Jobs Strategy, including the Centre for European Reform’s
Lisbon Scorecard analysis of member state performance in delivering the strategy;
and
■ Huggins Associates’ European Competitiveness Index.
For each of the four reports, key strengths, weaknesses and trends in Ireland’s
performance are identified from their analysis. This paper also reviews the differing
approach to competitiveness benchmarking. Finally, where policy areas for attention
are identified in their publications, these are highlighted. The paper draws a number of
conclusions from these international assessments.
Inte
rnat
iona
l Rev
iew
20
07
Nat
iona
l Com
peti
tive
ness
Cou
ncil
National C
ompetitiveness C
ouncilInternational R
eview 2
00
7
Review ofInternationalAssessments ofIreland’sCompetitiveness
ii
Inte
rnat
iona
l Rev
iew
Nat
iona
l Com
peti
tive
ness
Cou
ncil
ii
Council Members
Dr Don Thornhill Chairman
Mr Rory Ardagh Director, Telecom Property Holdings Limited
Mr Brendan Butler Director of Strategy, Trade, EU and International Affairs, IBEC
Mr Donal Byrne Chairman, Cadbury Ireland Limited
Mr Shay Cody Deputy General Secretary, IMPACT
Mr Martin Cronin Chief Executive Officer, Forfás
Mr Pat Delaney Director of Sectors and Regions, IBEC
Ms Thia Hennessy Economist, Teagasc
Ms Annette Hughes Economist, DKM Economic Consultants
Mr Seamus O’Morain Assistant Secretary, Department of Enterprise, Trade and Employment
Mr William Prasifka Chairperson, Competition Authority
Mr William Slattery Chief Executive Officer, State Street International (Ireland)
Mr Paul Sweeney Economic Adviser, Irish Congress of Trade Unions
Mr John Travers Consultant and Former Chief Executive Officer, Forfás
Prof Ferdinand von Prondzynski President, Dublin City University
Council Advisers
Mr Paul Bates Assistant Secretary, Department of Arts, Sports and Tourism
Ms Ruth Carmody Assistant Secretary, Department of Education and Science
Ms Mary Doyle Assistant Secretary, Department of An Taoiseach
Mr Eamonn Molloy Assistant Secretary, Department of Communications,
Energy and Natural Resources
Ms Mary Moylan Assistant Secretary, Department of Environment, Heritage, and Local Government
Mr John Murphy Assistant Secretary, Department of Transport
Mr Liam Nellis Chief Executive, InterTrade Ireland
Ms Ann Nolan / Mr John O’ Connell Assistant Secretary, Department of Finance
Research & Secretariat
Mr Jason Cleary
Mr Adrian Devitt
Mr Declan Hughes
Forfás
Wilton Park House
Wilton Place
Dublin 2
Tel: 01 607 3000
Fax 01 607 3030
Email: [email protected]
Web: www.competitiveness.ie
iii
International Review
National C
ompetitiveness C
ouncil
iii
ForewordA range of international bodies undertake assessments of Ireland’s competitiveness and many of these have high visibility among international investors and commentators. This paper complements the NCC’s existing work as it reviews these international assessments of Ireland’s competitiveness, and draws together their key findings in relation to Ireland’s competitiveness. It is hoped that this will stimulate discussion and debate on Ireland’s competitiveness.
Overall, global reports on competitiveness indicate that Ireland still ranks among the more competitive
economies. There is clear evidence that Ireland’s competitiveness has fallen since 2000, particularly
from the latest IMD survey. Of the 55 countries benchmarked in 2007 by IMD, Ireland ranked 14th
overall, a fall of 7 places since 2001. Across the four reports reviewed in this paper, Ireland’s average
ranking is 9th of the EU-15 countries.
Ireland has strengths and it is important that we are aware of these. They include our macroeconomy,
fiscal policy, the labour market, the market and regulatory framework and attitudes and values in
Irish society to globalisation and competitiveness. Weaknesses do exist. In areas such as prices,
infrastructure, innovation and R&D and environmental sustainability, Ireland’s rankings are below
average. Continued weaknesses in terms of infrastructure and price competitiveness, combined with
the relatively poor performance of our exporters in recent years accounts for a large share of the fall in
Ireland’s international competitiveness rankings.
There are also some aspects of our performance that are of note. Generally, Ireland’s rankings are
boosted by a strong performance in measures of current competitiveness, such as productivity levels and
employment indicators, rather than likely drivers of future competitiveness, such as infrastructure or a
culture of innovation. Of the drivers of future competitiveness, Ireland’s weaknesses are in areas that
require long-term attention, rather than those that can be changed more readily.
International assessments of Ireland’s performance are useful exercises that stimulate debate
on Ireland’s progress towards sustaining success into the future but some limitations do exist. In
this context it is important that the NCC’s own Benchmarking Ireland’s Performance and Ireland’s
Competitiveness Challenge reports continue to contribute to the discussion on competitiveness and the
policy challenges that face Ireland.
I would like to thank NCC members and advisors for their contributions to producing this report and the
Forfás secretariat for preparing the material for the Council’s deliberation.
Don Thornhill
Chairman National Competitiveness Council

iv
Inte
rnat
iona
l Rev
iew
Nat
iona
l Com
peti
tive
ness
Cou
ncil
iv
Contents
Foreword iii
Overview 1
Methodology and the Benefits and Risks of Competitiveness Benchmarking 4
1. WEF Global Competitiveness Report 71.1 Methodology 7
1.2 How does Ireland perform? 8
1.3 How does Ireland perform relative to the leading countries? 10
1.4 What factors explain Ireland’s weakening performance? 11
1.5 Key Findings from the Global Competitiveness Report 11
2. IMD World Competitiveness Yearbook 122.1 Methodology 12
2.2 How does Ireland perform? 13
2.3 How does Ireland perform relative to the leading countries? 15
2.4 What factors explain Ireland’s weakening performance? 15
2.5 Key Findings from the World Competitiveness Yearbook 17
3. EU Lisbon Growth and Jobs Strategy 183.1 Methodology 18
3.2 How does Ireland perform? 19
3.3 How does Ireland perform relative to the leading countries? 20
3.4 Key Findings from the Growth and Jobs Strategy 22
4. Huggins Associates European Competitiveness Index 234.1 Methodology 23
4.2 How does Ireland perform? 23
4.3 How does Ireland perform relative to the leading countries? 25
4.4 Key Findings from the European Competitiveness Index 25
5. Appendix: Previous NCC Publications 26
1
International Review
National C
ompetitiveness C
ouncil
1
OverviewOne of the key tasks of the National Competitiveness Council is to assess Ireland’s competitiveness.
In addition to using data from official bodies such as the CSO, Eurostat and the OECD, the National
Competitiveness Council (NCC) also uses information from a number of specialist international
competitiveness bodies, such as the World Economic Forum (WEF), the Institute for Management
Development (IMD) and Huggins Associates, all of which undertake cross-country assessments of
competitiveness. The European Commission and other bodies, such as the Centre for European Reform,
also review progress on the Lisbon Growth and Jobs Strategy. In general, the NCC utilises individual
indicators from all of the sources above to develop an overall assessment of Ireland’s competitive
position, as part of its annual Benchmarking Ireland’s Performance report.
International assessments of Ireland’s competitiveness are important as they have high visibility
among international investors and commentators. By using official statistics and figures from surveys
of executive opinion, they can highlight areas for policy action. This paper presents an overview of four
international assessments of Ireland’s competitive performance:
■ The World Economic Forum’s Global Competitiveness Report (typically referred to hereafter as the
WEF report);
■ The Institute for Management Development’s World Competitiveness Yearbook (referred to hereafter
as the IMD report);
■ The EU’s Growth and Jobs Strategy, including the Centre for European Reform’s Lisbon Scorecard
analysis of member states’ performance in delivering the strategy (referred to hereafter as the EU
Growth and Jobs Strategy and the CER report); and,
■ Huggins Associates’ European Competitiveness Index (referred to hereafter as the Huggins report).
For each of the four reports, key strengths, weaknesses and trends in Ireland’s performance are
identified from their analysis. This paper also reviews the differing approaches to competitiveness
benchmarking, as it is important that their methodologies and outputs are understood. Finally, where
policy areas for attention are identified in their publications, these are highlighted. The NCC draws the
following seven conclusions from these four reports:
1. Ireland ranks within the top quartile of the WEF report and just outside of this in the IMD report.
Ireland’s overall rank is below average in the CER and Huggins reports.
■ The four reports in this review can be divided on the basis of geographical coverage into global
reports (the WEF and IMD reports) and European reports (EU Growth and Jobs Strategy/CER and
Huggins reports). In the WEF global report, Ireland ranked in the top quartile (22nd of 131) in
2007 while Ireland lies just outside the top quartile (14th of 55) in the IMD report 2007.
■ In the European reports, Ireland fares less well: 8th of 15, according to the CER Scorecard and
13th of 17 in the Huggins European Competitiveness Index. The Huggins report also provides
regional rankings. Of 120 European regions, Ireland’s South and East region ranks 29th, the Border,
Midlands and West region ranks 74th, while Northern Ireland ranks 64th.
2
Inte
rnat
iona
l Rev
iew
Nat
iona
l Com
peti
tive
ness
Cou
ncil
2
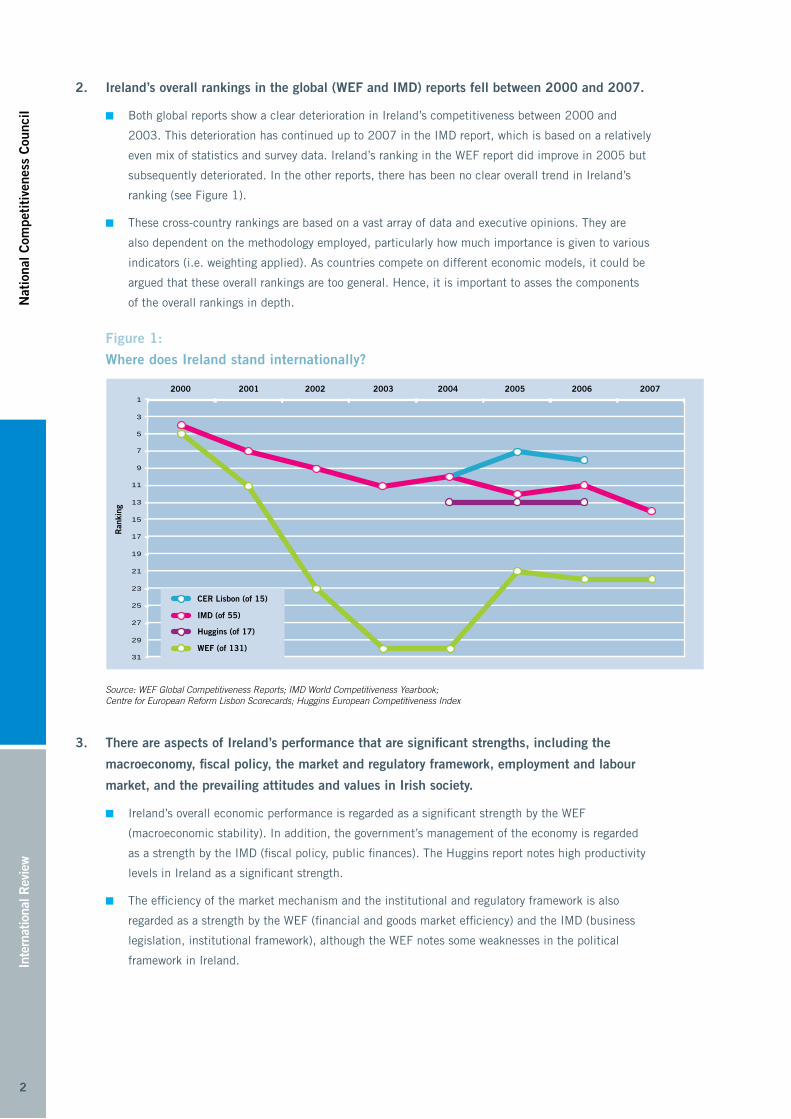
2. Ireland’s overall rankings in the global (WEF and IMD) reports fell between 2000 and 2007.
■ Both global reports show a clear deterioration in Ireland’s competitiveness between 2000 and
2003. This deterioration has continued up to 2007 in the IMD report, which is based on a relatively
even mix of statistics and survey data. Ireland’s ranking in the WEF report did improve in 2005 but
subsequently deteriorated. In the other reports, there has been no clear overall trend in Ireland’s
ranking (see Figure 1).
■ These cross-country rankings are based on a vast array of data and executive opinions. They are
also dependent on the methodology employed, particularly how much importance is given to various
indicators (i.e. weighting applied). As countries compete on different economic models, it could be
argued that these overall rankings are too general. Hence, it is important to asses the components
of the overall rankings in depth.
Figure 1:
Where does Ireland stand internationally?
2000 2001 2002 2003 2004 2005 2006 20071
3
5
7
9
11
13
15
17
19
21
23
25
27
29
31
Ran
king
Huggins (of 17)
WEF (of 131)
CER Lisbon (of 15)
IMD (of 55)
Source: WEF Global Competitiveness Reports; IMD World Competitiveness Yearbook; Centre for European Reform Lisbon Scorecards; Huggins European Competitiveness Index
3. There are aspects of Ireland’s performance that are significant strengths, including the
macroeconomy, fiscal policy, the market and regulatory framework, employment and labour
market, and the prevailing attitudes and values in Irish society.
■ Ireland’s overall economic performance is regarded as a significant strength by the WEF
(macroeconomic stability). In addition, the government’s management of the economy is regarded
as a strength by the IMD (fiscal policy, public finances). The Huggins report notes high productivity
levels in Ireland as a significant strength.
■ The efficiency of the market mechanism and the institutional and regulatory framework is also
regarded as a strength by the WEF (financial and goods market efficiency) and the IMD (business
legislation, institutional framework), although the WEF notes some weaknesses in the political
framework in Ireland.
3
International Review
National C
ompetitiveness C
ouncil
3
■ Ireland’s labour market performance, both in terms of creating jobs and tackling long-term
unemployment, are regarded as a strength by the IMD (employment, labour market), the EU Growth
and Jobs indicators and the Huggins report (employment and unemployment indicators).
■ Lastly, the prevailing attitudes and values of Irish society, in terms of openness to new ideas and
awareness of the importance of national competitiveness, are regarded as a significant strength by
the IMD.
4. Ireland has areas of significant weakness that are undermining international competitiveness,
in particular prices and costs, domestic competition, infrastructure, innovation and R&D, and
sustainability and the environment.
■ Ireland’s high and rising price levels are damaging Ireland’s performance across all reports. They
weaken Ireland’s ranking in the WEF’s macroeconomic indicators. In the IMD report, Ireland’s
ranking has deteriorated considerably, while price factors are also highlighted as weaknesses in
the EU Growth and Jobs indicators. Related to this, these indicators also point to weak levels of
competition in domestic sectors.
■ Infrastructure, across a range of headings, is identified as a key weakness in relation to the drivers
of Ireland’s future competitiveness. This is clear across a range of reports, including the WEF
(transport and communications), the IMD (basic, scientific and technological) and the Huggins
report. Ireland’s relative lack of technological readiness is also identified as a weakness (WEF).
■ Related to this, aspects of Ireland’s innovation infrastructure are cited as a weakness, by the WEF,
the EU Growth and Jobs indicators and by the Huggins report.
■ Lastly, the EU Growth and Jobs indicators highlight concerns about the sustainability of Ireland’s
growth, with many of Ireland’s environmental indicators scoring below the EU average.
5. Of the two global reports (WEF and IMD), six countries appear in the top ten of both.
Nonetheless, due to differences in definitions of competitiveness and the choice of indicators,
countries’ rankings differ across the reports.
■ Of the two global reports, the United States, Singapore, Denmark, the Netherlands, Switzerland
and Sweden are in the top ten in both. Hong Kong, Iceland, Canada, and Luxembourg also feature
in the IMD’s top ten. Japan, Germany, Finland and the United Kingdom also feature in the WEF’s
top ten. The difference between the two is because the IMD report places a greater focus on official
figures and short term issues (such as current growth rates), while the WEF places a greater focus
on executive opinions, long term institutional factors and (technological) infrastructure.
■ In relation to competitiveness challenges from new locations, particularly in Asia, it is notable that
China lags leading countries in the WEF, (WEF: 34th, IMD: 15th) and India (WEF: 48th, IMD:
27th) performs relatively poorly in both reports. While economic growth is very strong in China, its
rankings are lowered by poor ICT infrastructure, weak second and third level education enrolment
rates, high levels of regulation and weak property rights. India’s rankings are enhanced by very
high levels of innovation and business sophistication, availability of high quality research and high
numbers of researchers. Its rankings are lowered due to low income levels, its institutions and high
levels of poverty. Given the size of these countries and regional variations, these national rankings
certainly understate the competitiveness of key regions (e.g. Beijing, Shanghai or Bangalore).
4
Inte
rnat
iona
l Rev
iew
Nat
iona
l Com
peti
tive
ness
Cou
ncil
4
6. Across all reports, Ireland’s average ranking is 9th of the EU-15 countries.
■ When compared with the other EU-15 member states, Ireland’s performance is typically below
average across the reports.
■ Compared to other EU-15 member states, Ireland’s performance is strongest in the IMD report,
where Ireland ranks sixth of the EU-15, and the CER Lisbon Scorecard, where Ireland ranks
seventh. In the WEF report, and in particular the Huggins report, which excludes factors such as
regulatory regime and business environment, Ireland ranks poorly, due to weak scores across a range
of headings including infrastructure, innovation and environmental performance.
7. Dividing factors between current and future drivers of competitiveness, Ireland’s ranking is
boosted by a strong current performance. Of future drivers, Ireland’s relative strengths are in
factors that could be easier to replicate speedily.
■ The four reports reviewed combine current economic performance metrics (e.g. productivity levels,
employment indicators) with measures of potential future success (e.g. investment in education,
innovation, competition).
■ Ireland’s performance on current economic metrics generally improves Ireland’s overall score. If
current performance indicators were removed from these reports, Ireland’s overall rankings would
fall. This may suggest that our current performance is greater than our potential, and that Ireland
needs to do more to prepare adequately to sustain growth into the future.
■ Of the future drivers, factors can be divided between those that are relatively easier to replicate
speedily if agreement exists (e.g. taxation, regulation) and those that are not (e.g. innovation, world
class transport infrastructure). Ireland’s relative strengths are predominantly in those that are easier
to replicate speedily.
Methodology and the Benefits and Risks of Competitiveness Benchmarking
International benchmarking is a useful exercise that stimulates debate on Ireland’s progress across
a range of competitiveness indicators and on the challenges that the economy faces in sustaining
this success into the future. However, it is important to draw attention to some limitations of
competitiveness benchmarking.
There are many statistical challenges to benchmarking competitiveness.
■ Firstly, in addition to the challenges of securing timely and internationally comparable data for
those dimensions of competitiveness which are quantifiable (e.g. output growth, taxation rates),
there is the added challenge that certain competitiveness issues can be difficult to quantify (e.g.
the quality of education and national levels of creativity and innovation). A range of technical points
should also be considered:
Much of the data collected measure actual performance. It may take some time for the effects
of recent public policy decisions to impact on performance. Also, particularly in smaller
economies such as Ireland, data may be skewed by individual firm decisions (e.g. investment
data in the 2007 IMD report).
Survey data of executive opinions, while timelier, may be unrepresentative and biased.
Countries which have more overt confident leaders may be more positive when completing
questionnaires.
5
International Review
National C
ompetitiveness C
ouncil
5
Simple rankings hide differences between countries. For example, in the WEF index, there is
a gap in scores of 0.01 between Ireland (22nd) and Iceland (23rd) but there is a gap of 0.04
between 23rd and 24th place.
Producing overall competitive rankings, while media friendly, are simplistic. It may also create
a ‘black box’ where readers are unclear of what is driving performance or how the statistics are
aggregated. Our review of these processes has revealed some weaknesses.
■ Secondly, given different historical contexts and different economic, political and social goals
of various countries, as well as varying physical geographies and resource endowments, it is not
realistic or even desirable for any country to seek to outperform other countries on all measures.
Different countries choose different models for driving their competitiveness, and their success
may not be captured by necessarily general international overviews of the factors that can boost
competitiveness.
■ Finally, it is important to note that trade and investment between countries is not a zero-sum game;
economic advances by other countries can, in aggregate terms, lead to improvements in living
standards for the Irish population.
There are no perfect measures of international competitiveness.
Despite the value of these international assessments, it remains important that the NCC continue to
undertake its own benchmarking analysis, given the range of countries covered in these assessments
and their reliance on high level data rather than in-depth knowledge of the countries.
■ The WEF’s Global Competitiveness Report is perhaps the best-known index. A substantial part of
their index (69%) is based on a survey of executives views. This enables the report to be timelier,
given the time lag for producing comparable official international statistics. However, sample sizes
can be small.
■ The IMD’s World Competitiveness Yearbook uses data from statistical offices and opinion-based
metrics to produce its index. Given its focus on relatively developed countries, its metrics may be
more relevant for Ireland. There are some assumptions underpinning their methodology that may
affect overall competitiveness rankings.
■ The EU’s Growth and Jobs Agenda has 14 key structural indicators, which are collected by Eurostat.
Many of the priority indicators are focused on employment, given that this is the key economic
challenge in many larger member states, and other policy areas where the EU has a role (e.g. R&D).
■ Huggins Associates’ European Competitiveness Index is perhaps the least well known of the four
reports. While it covers a wide number of topics, some of the indicators are somewhat simplistic.
However, its broad findings are in line with the other reports. It was included for assessment, as it is
the only report that reviews competitiveness at a sub-national level.
It is notable that there are inconsistencies between the reports. For example, the WEF’s assessment of
Ireland’s health and primary education performance is much stronger than that of the IMD. Also, the
WEF assessment of Ireland’s institutional framework is much weaker than the IMD’s assessment. This in
part is a reflection of differing approaches and methodologies in each report.
6
Inte
rnat
iona
l Rev
iew
Nat
iona
l Com
peti
tive
ness
Cou
ncil
6
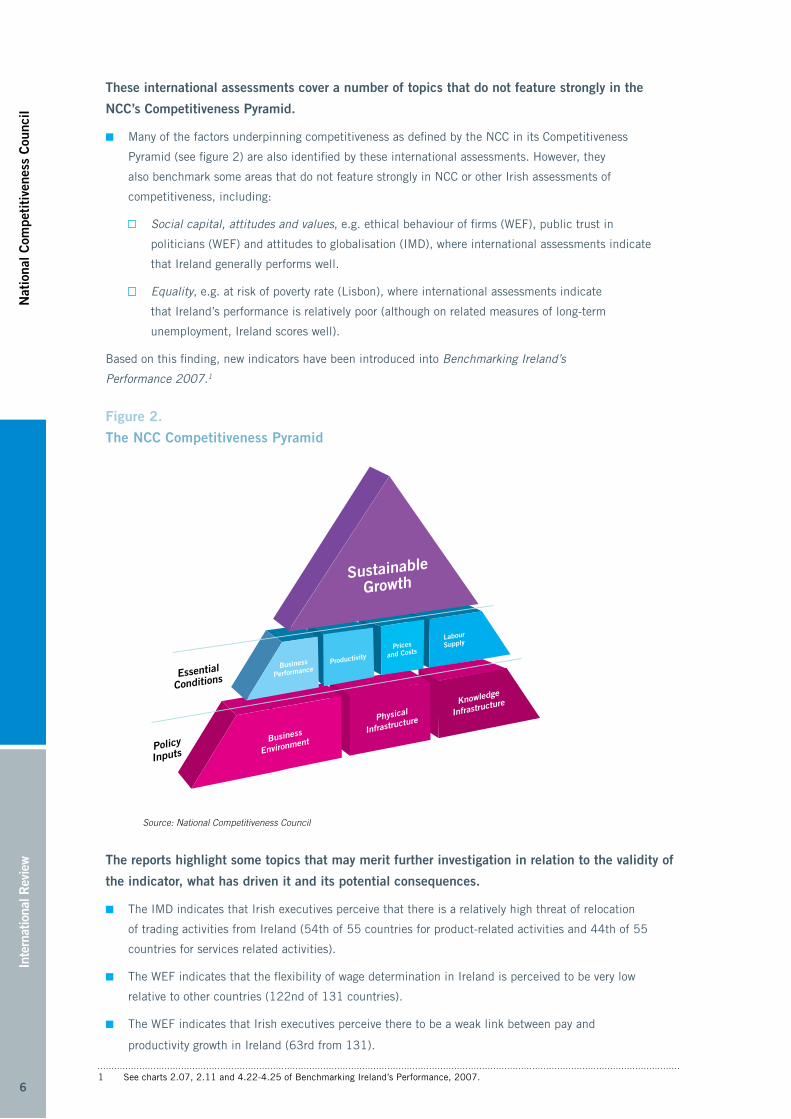
These international assessments cover a number of topics that do not feature strongly in the
NCC’s Competitiveness Pyramid.
■ Many of the factors underpinning competitiveness as defined by the NCC in its Competitiveness
Pyramid (see figure 2) are also identified by these international assessments. However, they
also benchmark some areas that do not feature strongly in NCC or other Irish assessments of
competitiveness, including:
Social capital, attitudes and values, e.g. ethical behaviour of firms (WEF), public trust in
politicians (WEF) and attitudes to globalisation (IMD), where international assessments indicate
that Ireland generally performs well.
Equality, e.g. at risk of poverty rate (Lisbon), where international assessments indicate
that Ireland’s performance is relatively poor (although on related measures of long-term
unemployment, Ireland scores well).
Based on this finding, new indicators have been introduced into Benchmarking Ireland’s
Performance 2007.1
Figure 2.
The NCC Competitiveness Pyramid
Sustainable
Growth
Essential
Conditions
Policy
InputsBusiness
Environment
Physical
Infrastructure
Knowledge
Infrastructure
Source: National Competitiveness Council
The reports highlight some topics that may merit further investigation in relation to the validity of
the indicator, what has driven it and its potential consequences.
■ The IMD indicates that Irish executives perceive that there is a relatively high threat of relocation
of trading activities from Ireland (54th of 55 countries for product-related activities and 44th of 55
countries for services related activities).
■ The WEF indicates that the flexibility of wage determination in Ireland is perceived to be very low
relative to other countries (122nd of 131 countries).
■ The WEF indicates that Irish executives perceive there to be a weak link between pay and
productivity growth in Ireland (63rd from 131).
1 See charts 2.07, 2.11 and 4.22-4.25 of Benchmarking Ireland’s Performance, 2007.
7
International Review
National C
ompetitiveness C
ouncil
7
1. WEF Global Competitiveness Report
The Global Competitiveness Report is the main annual publication of the World Economic Forum (WEF).
The WEF is a non-profit organisation whose aim is to engage leaders to shape global, regional and
industry agendas. Contributors to the report include Xavier Sala-i-Martin and Michael Porter.
The two aims of the WEF’s Global Competitiveness Report are: firstly, to provide countries with a tool
from which they can identify priority areas for improving their competitiveness; and secondly, to provide
a platform for dialogue among government, business and civil society on areas for attention.
Their report defines national competitiveness as ‘The set of factors, policies and institutions that
determine the level of productivity of a country. The level of productivity, in turn, sets the sustainable
level of prosperity that can be earned by an economy.’ By this definition, competitiveness is linked
closely to productivity and living standards, rather than solely exporting sectors.
1.1 Methodology
The WEF’s Global Competitiveness Report is comprehensive in its approach to measuring
competitiveness. 126 indicators are used in total, the majority (69%) of which are based on the
surveyed opinions of executives; for the 2007-08 report, over 11,000 business leaders were polled
in 131 economies, 42 of which were from Ireland.2 Thirty-nine indicators, predominantly in the areas
of macro-economic stability, market efficiency, and health and education are based on hard data. The
main advantage of an approach based on executive opinions is that they are ultimately what business
decisions are based on. They are also timelier than internationally comparable official statistical data.
However, sample sizes for individual countries can be small.
The Global Competitiveness Report provides two indices, the Global Competitiveness Index (GCI) and
the Business Competitiveness Index (BCI). The GCI aims to give an overview of a country’s performance
in relation to the economy-wide factors that enhance productivity and competitiveness, while the BCI
examines business-level microeconomic foundations of competitiveness.3 This paper focuses on the GCI,
as it is more closely related to the factors that NCC monitors through its Competitiveness Pyramid. The
GCI assesses competitiveness in twelve areas, grouped under three pillars:4
2 The WEF collects responses from each country through a system of partner institutes. The Department of Economics at University College , Cork, is the WEF’s Irish partner. The NCC Secretariat has assisted on this project in recent years, to ensure a representative sample size.
3 Ireland ranked 24th overall in the BCI in the 2007-08 report.
4 Since 2001, the WEF has used the GCI to assess international competitiveness, though the methodology has changed since their 2005-06 report.
8
Inte
rnat
iona
l Rev
iew
Nat
iona
l Com
peti
tive
ness
Cou
ncil
8
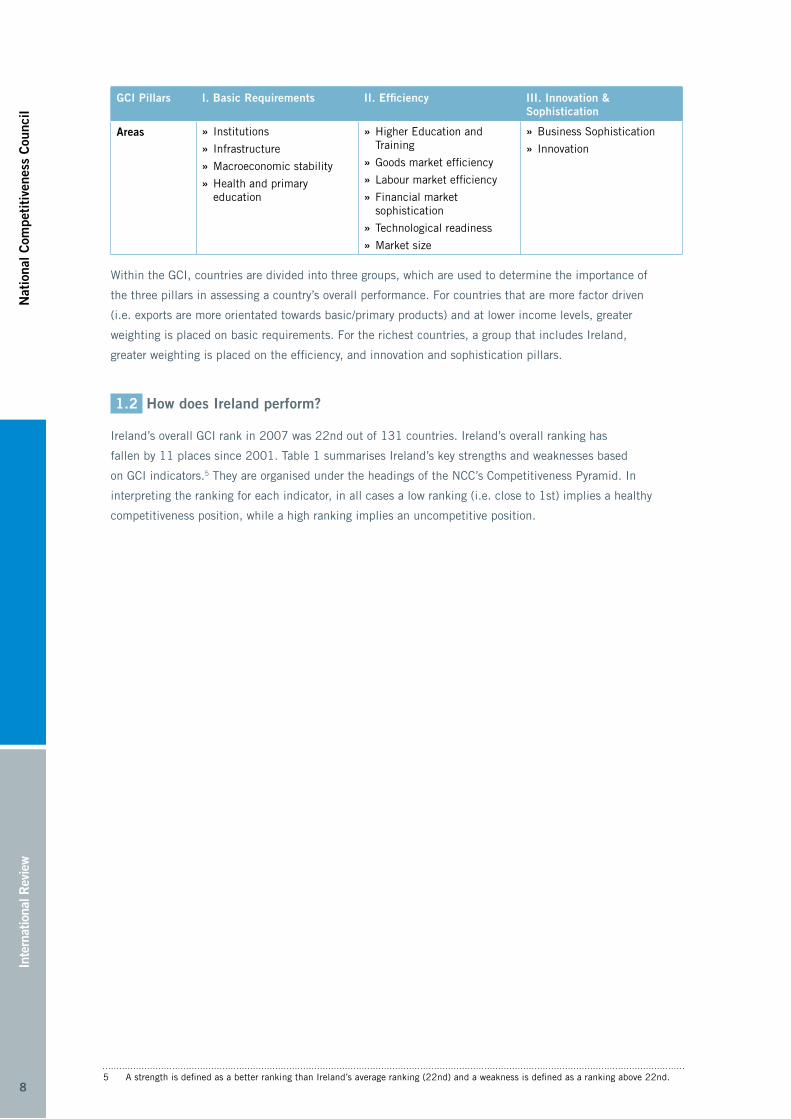
GCI Pillars I. Basic Requirements II. Efficiency III. Innovation & Sophistication
Areas Institutions »
Infrastructure »
Macroeconomic stability »
Health and primary »education
Higher Education and »Training
Goods market efficiency »
Labour market efficiency »
Financial market »sophistication
Technological readiness »
Market size »
Business Sophistication »
Innovation »
Within the GCI, countries are divided into three groups, which are used to determine the importance of
the three pillars in assessing a country’s overall performance. For countries that are more factor driven
(i.e. exports are more orientated towards basic/primary products) and at lower income levels, greater
weighting is placed on basic requirements. For the richest countries, a group that includes Ireland,
greater weighting is placed on the efficiency, and innovation and sophistication pillars.
1.2 How does Ireland perform?
Ireland’s overall GCI rank in 2007 was 22nd out of 131 countries. Ireland’s overall ranking has
fallen by 11 places since 2001. Table 1 summarises Ireland’s key strengths and weaknesses based
on GCI indicators.5 They are organised under the headings of the NCC’s Competitiveness Pyramid. In
interpreting the ranking for each indicator, in all cases a low ranking (i.e. close to 1st) implies a healthy
competitiveness position, while a high ranking implies an uncompetitive position.
5 A strength is defined as a better ranking than Ireland’s average ranking (22nd) and a weakness is defined as a ranking above 22nd.
9
International Review
National C
ompetitiveness C
ouncil
9
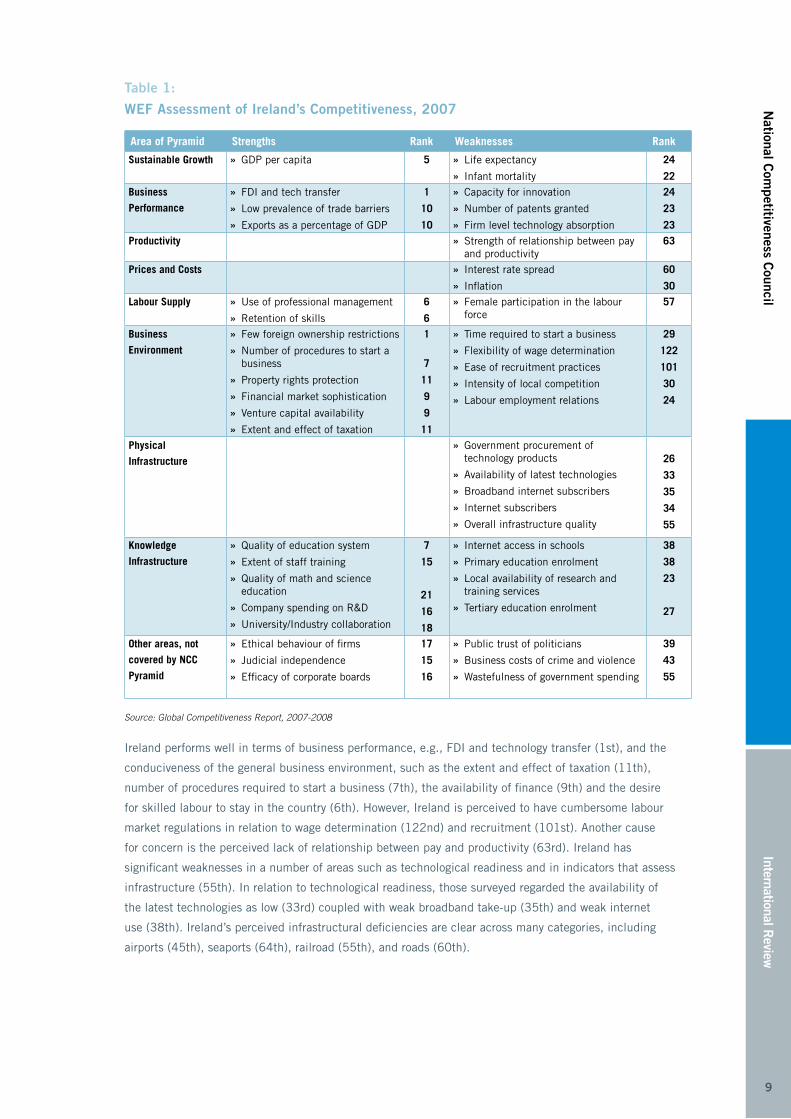
Table 1:
WEF Assessment of Ireland’s Competitiveness, 2007
Area of Pyramid Strengths Rank Weaknesses Rank
Sustainable Growth GDP per capita » 5 Life expectancy »
Infant mortality »
24
22Business
PerformanceFDI and tech transfer »
Low prevalence of trade barriers »
Exports as a percentage of GDP »
1
10
10
Capacity for innovation »
Number of patents granted »
Firm level technology absorption »
24
23
23Productivity Strength of relationship between pay »
and productivity63
Prices and Costs Interest rate spread »
Inflation »
60
30Labour Supply Use of professional management »
Retention of skills »
6
6
Female participation in the labour »force
57
Business
EnvironmentFew foreign ownership restrictions »
Number of procedures to start a »business
Property rights protection »
Financial market sophistication »
Venture capital availability »
Extent and effect of taxation »
1
7
11
9
9
11
Time required to start a business »
Flexibility of wage determination »
Ease of recruitment practices »
Intensity of local competition »
Labour employment relations »
29
122
101
30
24
Physical
InfrastructureGovernment procurement of »technology products
Availability of latest technologies »
Broadband internet subscribers »
Internet subscribers »
Overall infrastructure quality »
26
33
35
34
55
Knowledge
Infrastructure Quality of education system »
Extent of staff training »
Quality of math and science »education
Company spending on R&D »
University/Industry collaboration »
7
15
21
16
18
Internet access in schools »
Primary education enrolment »
Local availability of research and »training services
Tertiary education enrolment »
38
38
23
27
Other areas, not
covered by NCC
Pyramid
Ethical behaviour of firms »
Judicial independence »
Efficacy of corporate boards »
17
15
16
Public trust of politicians »
Business costs of crime and violence »
Wastefulness of government spending »
39
43
55
Source: Global Competitiveness Report, 2007-2008
Ireland performs well in terms of business performance, e.g., FDI and technology transfer (1st), and the
conduciveness of the general business environment, such as the extent and effect of taxation (11th),
number of procedures required to start a business (7th), the availability of finance (9th) and the desire
for skilled labour to stay in the country (6th). However, Ireland is perceived to have cumbersome labour
market regulations in relation to wage determination (122nd) and recruitment (101st). Another cause
for concern is the perceived lack of relationship between pay and productivity (63rd). Ireland has
significant weaknesses in a number of areas such as technological readiness and in indicators that assess
infrastructure (55th). In relation to technological readiness, those surveyed regarded the availability of
the latest technologies as low (33rd) coupled with weak broadband take-up (35th) and weak internet
use (38th). Ireland’s perceived infrastructural deficiencies are clear across many categories, including
airports (45th), seaports (64th), railroad (55th), and roads (60th).
10
Inte
rnat
iona
l Rev
iew
Nat
iona
l Com
peti
tive
ness
Cou
ncil
10
The WEF gives a greater weighting to institutional indicators than the NCC’s Competitiveness Pyramid.
Ireland’s score on these indicators is mixed. While Ireland scores well in relation to security of property
rights (11th), judicial independence (15th) and corporate governance (16th), many scores are below
Ireland’s peer group. The costs of crime including organised crime (43rd) and public trust in politicians
(39th) rank poorly. Ireland ranks 55th in terms of the perception that government spending is wasteful.
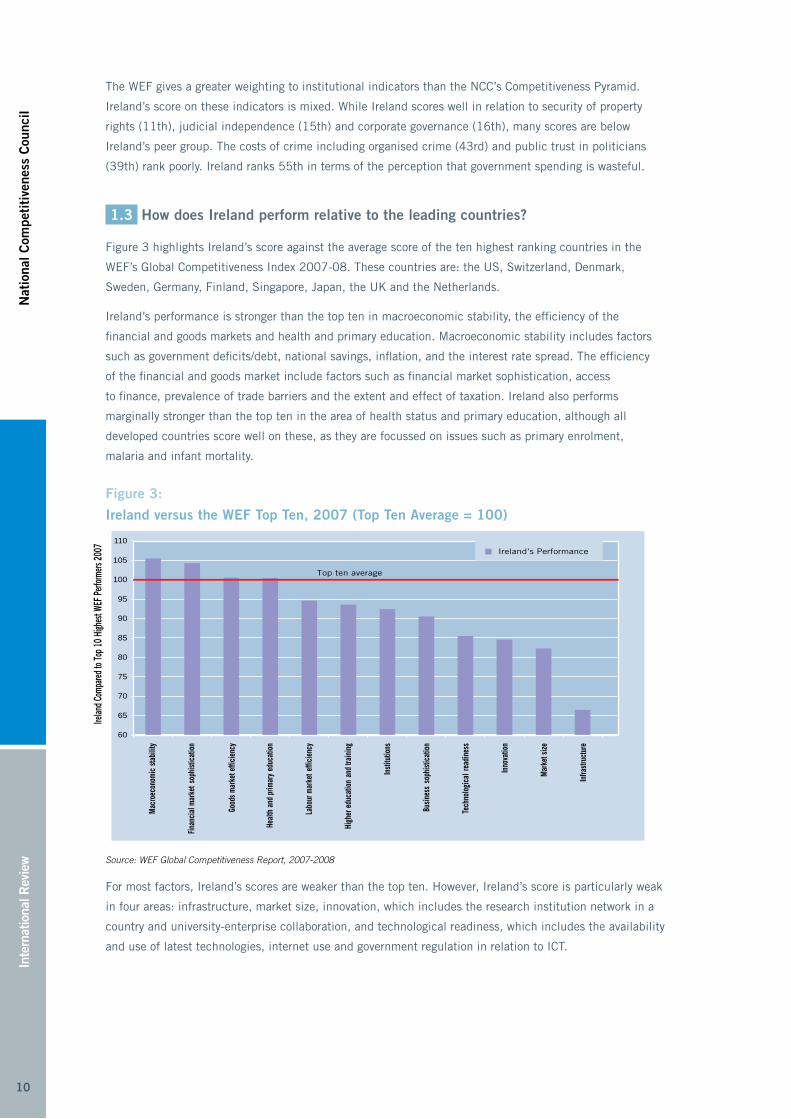
1.3 How does Ireland perform relative to the leading countries?
Figure 3 highlights Ireland’s score against the average score of the ten highest ranking countries in the
WEF’s Global Competitiveness Index 2007-08. These countries are: the US, Switzerland, Denmark,
Sweden, Germany, Finland, Singapore, Japan, the UK and the Netherlands.
Ireland’s performance is stronger than the top ten in macroeconomic stability, the efficiency of the
financial and goods markets and health and primary education. Macroeconomic stability includes factors
such as government deficits/debt, national savings, inflation, and the interest rate spread. The efficiency
of the financial and goods market include factors such as financial market sophistication, access
to finance, prevalence of trade barriers and the extent and effect of taxation. Ireland also performs
marginally stronger than the top ten in the area of health status and primary education, although all
developed countries score well on these, as they are focussed on issues such as primary enrolment,
malaria and infant mortality.
Figure 3:
Ireland versus the WEF Top Ten, 2007 (Top Ten Average = 100)
Top ten average
60
65
70
75
80
85
90
95
100
105
110
Mac
roec
onom
icsta
bilit
y
Finan
cial
mar
kets
ophi
stica
tion
Goo
ds m
arke
t effi
cien
cy
Heal
th a
nd p
rimar
yed
ucat
ion
Labo
ur m
arke
teffi
cien
cy
High
er e
duca
tion
and
train
ing
Insti
tutio
ns
Busin
ess
soph
istic
atio
n
Tech
nolo
gica
lrea
dine
ss
Inno
vatio
n
Mar
ket s
ize
Infra
struc
ture
Irelan
d Com
pared
to To
p 10 H
ighes
t WEF
Perfo
rmers
2007 Ireland’s Performance
Source: WEF Global Competitiveness Report, 2007-2008
For most factors, Ireland’s scores are weaker than the top ten. However, Ireland’s score is particularly weak
in four areas: infrastructure, market size, innovation, which includes the research institution network in a
country and university-enterprise collaboration, and technological readiness, which includes the availability
and use of latest technologies, internet use and government regulation in relation to ICT.
11
International Review
National C
ompetitiveness C
ouncil
11
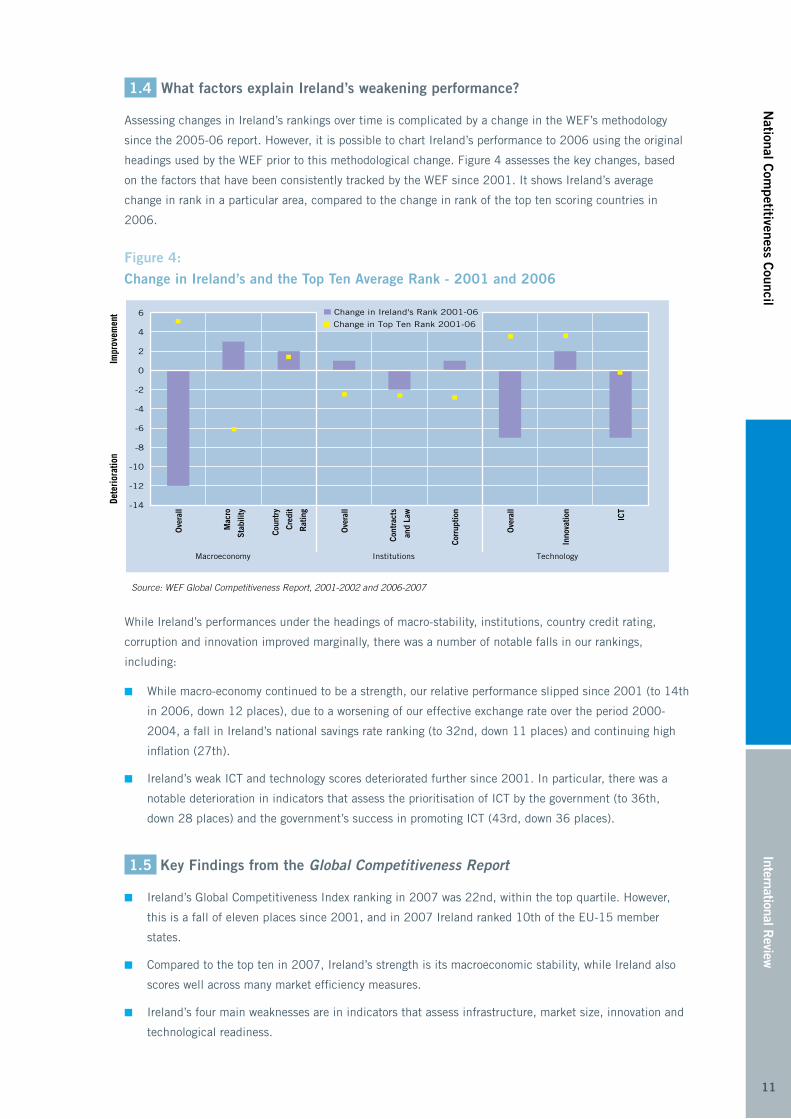
1.4 What factors explain Ireland’s weakening performance?
Assessing changes in Ireland’s rankings over time is complicated by a change in the WEF’s methodology
since the 2005-06 report. However, it is possible to chart Ireland’s performance to 2006 using the original
headings used by the WEF prior to this methodological change. Figure 4 assesses the key changes, based
on the factors that have been consistently tracked by the WEF since 2001. It shows Ireland’s average
change in rank in a particular area, compared to the change in rank of the top ten scoring countries in
2006.
Figure 4:
Change in Ireland’s and the Top Ten Average Rank - 2001 and 2006
-14
-12
-10
-8
-6
-4
-2
0
2
4
6
Ove
rall
Mac
ro
Stab
ility
Coun
try
Cred
it
Rat
ing
Ove
rall
Cont
ract
s
and
Law
Corr
uptio
n
Ove
rall
Inno
vatio
n
ICT
Macroeconomy Institutions Technology
Dete
riora
tion
Impr
ovem
ent Change in Ireland's Rank 2001-06
Change in Top Ten Rank 2001-06
Source: WEF Global Competitiveness Report, 2001-2002 and 2006-2007
While Ireland’s performances under the headings of macro-stability, institutions, country credit rating,
corruption and innovation improved marginally, there was a number of notable falls in our rankings,
including:
■ While macro-economy continued to be a strength, our relative performance slipped since 2001 (to 14th
in 2006, down 12 places), due to a worsening of our effective exchange rate over the period 2000-
2004, a fall in Ireland’s national savings rate ranking (to 32nd, down 11 places) and continuing high
inflation (27th).
■ Ireland’s weak ICT and technology scores deteriorated further since 2001. In particular, there was a
notable deterioration in indicators that assess the prioritisation of ICT by the government (to 36th,
down 28 places) and the government’s success in promoting ICT (43rd, down 36 places).
1.5 Key Findings from the Global Competitiveness Report
■ Ireland’s Global Competitiveness Index ranking in 2007 was 22nd, within the top quartile. However,
this is a fall of eleven places since 2001, and in 2007 Ireland ranked 10th of the EU-15 member
states.
■ Compared to the top ten in 2007, Ireland’s strength is its macroeconomic stability, while Ireland also
scores well across many market efficiency measures.
■ Ireland’s four main weaknesses are in indicators that assess infrastructure, market size, innovation and
technological readiness.
12
Inte
rnat
iona
l Rev
iew
Nat
iona
l Com
peti
tive
ness
Cou
ncil
12
2. IMD World Competitiveness Yearbook
The Institute for Management Development (IMD), based in Switzerland, is regarded as one of the
world’s leading business schools. Its World Competitiveness Centre, established in 1989, publishes the
annual IMD World Competitiveness Yearbook.
The World Competitiveness Yearbook aims to measure ‘the ability of nations to create and maintain an
environment that sustains more value creation for its enterprises and more prosperity for its people’.
The 2007 report assessed 55 countries, using 323 competitiveness indicators.
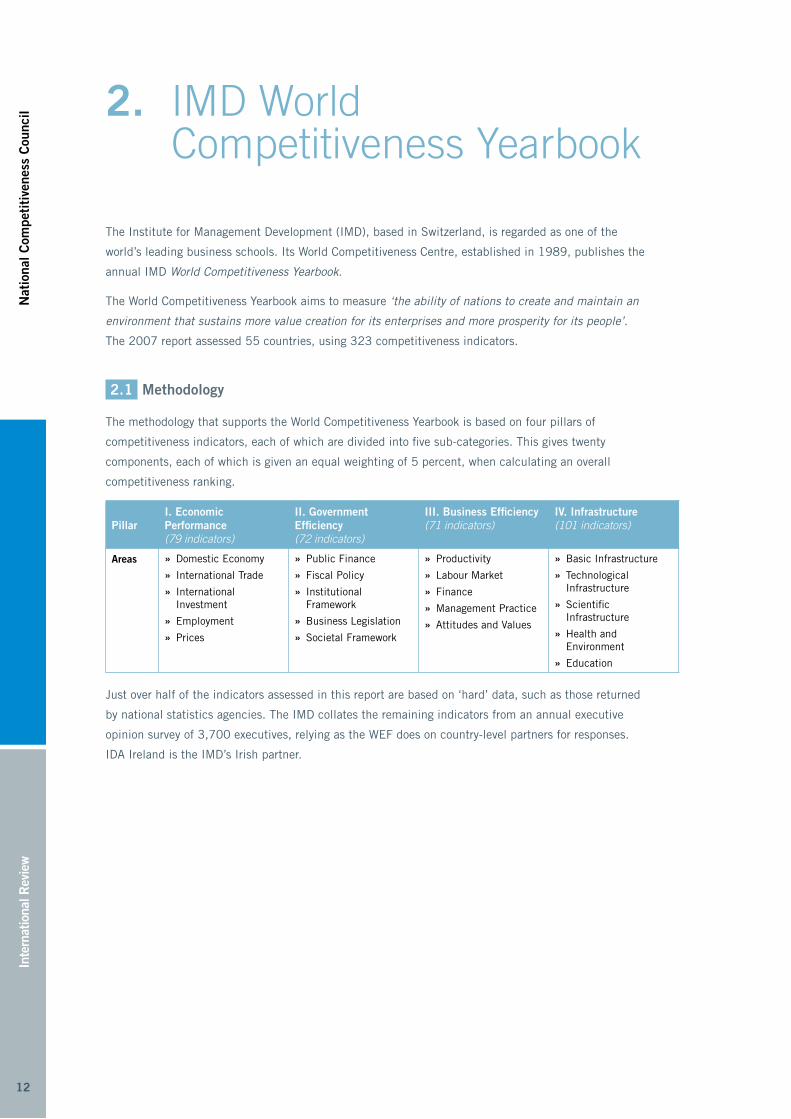
2.1 Methodology
The methodology that supports the World Competitiveness Yearbook is based on four pillars of
competitiveness indicators, each of which are divided into five sub-categories. This gives twenty
components, each of which is given an equal weighting of 5 percent, when calculating an overall
competitiveness ranking.
PillarI. Economic Performance (79 indicators)
II. Government Efficiency (72 indicators)
III. Business Efficiency (71 indicators)
IV. Infrastructure (101 indicators)
Areas Domestic Economy »
International Trade »
International »Investment
Employment »
Prices »
Public Finance »
Fiscal Policy »
Institutional »Framework
Business Legislation »
Societal Framework »
Productivity »
Labour Market »
Finance »
Management Practice »
Attitudes and Values »
Basic Infrastructure »
Technological »Infrastructure
Scientific »Infrastructure
Health and »Environment
Education »
Just over half of the indicators assessed in this report are based on ‘hard’ data, such as those returned
by national statistics agencies. The IMD collates the remaining indicators from an annual executive
opinion survey of 3,700 executives, relying as the WEF does on country-level partners for responses.
IDA Ireland is the IMD’s Irish partner.
13
International Review
National C
ompetitiveness C
ouncil
13
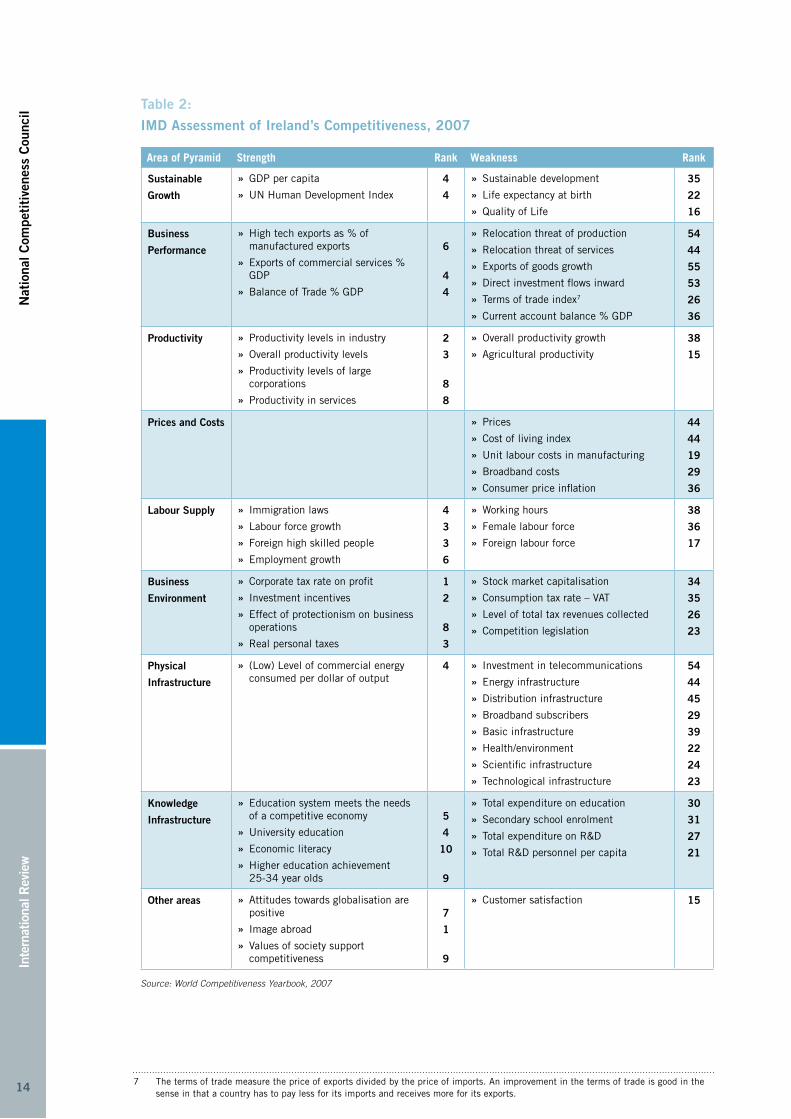
2.2 How does Ireland perform?
Of the 55 countries benchmarked in 2007, Ireland ranked 14th overall, a fall of 7 places since
2001. Table 2 summarises Ireland’s key strengths and weaknesses based on IMD’s assessment of
our performance.6 The indicators are organised under the headings of the NCC’s Competitiveness
Pyramid. A low ranking (i.e. close to 1st) implies a healthy competitiveness position.
As the table indicates, Ireland has a range of strengths. Particular areas of strength include Ireland’s
corporate tax rate on profits (1st), the flexibility of immigration laws (4th), labour market growth
(3rd), overall and industrial productivity levels (3rd and 2nd), our image abroad (1st), the degree to
which our education system is perceived to meet the needs of a competitive economy (5th) and our
positive attitudes towards globalisation (7th).
However, significant weaknesses also emerge. These include high prices and costs (44th), low
levels of expenditure on education (30th) and R&D (27th), the relatively high threat of relocation of
manufacturing (54th) and services operations (44th) from Ireland, weak productivity growth rates
(38th), and a range of weak infrastructure indicators, including technological (23rd) and scientific
(22nd) but in particular basic infrastructure (39th), energy infrastructure (44th) and investment in
telecommunications (54th).
6 A strength is defined as a better ranking than Ireland’s average ranking (14th) and a weakness is defined as a ranking above 14th.
14
Inte
rnat
iona
l Rev
iew
Nat
iona
l Com
peti
tive
ness
Cou
ncil
14
Table 2:
IMD Assessment of Ireland’s Competitiveness, 2007
Area of Pyramid Strength Rank Weakness Rank
Sustainable
Growth
GDP per capita »
UN Human Development Index »
4
4
Sustainable development »
Life expectancy at birth »
Quality of Life »
35
22
16
Business
Performance
High tech exports as % of »manufactured exports
Exports of commercial services % »GDP
Balance of Trade % GDP »
6
4
4
Relocation threat of production »
Relocation threat of services »
Exports of goods growth »
Direct investment flows inward »
Terms of trade index » 7
Current account balance % GDP »
54
44
55
53
26
36
Productivity Productivity levels in industry »
Overall productivity levels »
Productivity levels of large »corporations
Productivity in services »
2
3
8
8
Overall productivity growth »
Agricultural productivity »
38
15
Prices and Costs Prices »
Cost of living index »
Unit labour costs in manufacturing »
Broadband costs »
Consumer price inflation »
44
44
19
29
36
Labour Supply Immigration laws »
Labour force growth »
Foreign high skilled people »
Employment growth »
4
3
3
6
Working hours »
Female labour force »
Foreign labour force »
38
36
17
Business
Environment
Corporate tax rate on profit »
Investment incentives »
Effect of protectionism on business »operations
Real personal taxes »
1
2
8
3
Stock market capitalisation »
Consumption tax rate – VAT »
Level of total tax revenues collected »
Competition legislation »
34
35
26
23
Physical
Infrastructure
(Low) Level of commercial energy »consumed per dollar of output
4 Investment in telecommunications »
Energy infrastructure »
Distribution infrastructure »
Broadband subscribers »
Basic infrastructure »
Health/environment »
Scientific infrastructure »
Technological infrastructure »
54
44
45
29
39
22
24
23
Knowledge
Infrastructure
Education system meets the needs »of a competitive economy
University education »
Economic literacy »
Higher education achievement »25-34 year olds
5
4
10
9
Total expenditure on education »
Secondary school enrolment »
Total expenditure on R&D »
Total R&D personnel per capita »
30
31
27
21
Other areas Attitudes towards globalisation are »positive
Image abroad »
Values of society support »competitiveness
7
1
9
Customer satisfaction » 15
Source: World Competitiveness Yearbook, 20077
7 The terms of trade measure the price of exports divided by the price of imports. An improvement in the terms of trade is good in the sense in that a country has to pay less for its imports and receives more for its exports.

15
International Review
National C
ompetitiveness C
ouncil
15
2.3 How does Ireland perform relative to the leading countries?
Figure 5 assesses Ireland’s score against the average score of the ten leading countries in the World
Competitiveness Yearbook, 2007. The leading countries are: the USA, Singapore, Hong Kong,
Luxembourg, Denmark, Switzerland, Iceland, the Netherlands, Sweden and Canada.
Figure 5:
Ireland versus the IMD Top Ten, 2007 (Top Ten Average = 100)
0
20
40
60
80
100
120
Irel
and
Com
pare
d to
Top
10
hig
hest
WC
Y pe
rfor
mer
s 2
00
7
Top ten average
Fisc
al p
olic
y
Attit
udes
and
val
ues
Publ
ic fi
nanc
e
Inst
itutio
nal f
ram
ewor
k
Busi
ness
legi
slat
ion
Prod
uctiv
ity a
nd e
ffici
ency
Labo
ur m
arke
t
Empl
oym
ent
Man
agem
ent p
ract
ices
Dom
estic
eco
nom
y
Educ
atio
n
Hea
lth a
nd e
nvir
onm
ent
Pric
es
Inte
rnat
iona
l tra
de
Soci
etal
fram
ewor
k
Fina
nce
Scie
ntifi
c in
fras
truc
ture
Tech
nolo
gica
l inf
rast
ruct
ure
Basi
c in
fras
truc
ture
Inte
rnat
iona
l inv
estm
ent
Irela
nd C
ompa
red
to T
op 1
0 Hi
ghes
t WCY
Per
form
ers 2
007
Ireland’s Performance
Source: IMD World Competitiveness Yearbook [online]
Ireland’s performance exceeds the average performance of the top ten countries in a number of areas
including the stability of fiscal policy, attitudes and values in society, public finances, institutional
frameworks (e.g. legal and regulatory), pro-enterprise business legislation, productivity, the success of
the labour market and Ireland’s employment generation performance. Ireland lags the top performers
particularly in areas of infrastructure (basic, scientific and technological), high prices and a weak
societal framework (e.g. justice, income distribution). Ireland’s investment performance lags the
average performance of the top ten countries due to deterioration in FDI inflows, while Ireland’s trade
performance is weakened due to higher fears in Ireland that our trading sectors are more likely to
relocate overseas, and a deterioration in our current account balance.
2.4 What factors explain Ireland’s weakening performance?
Of the 55 countries benchmarked in 2007, Ireland ranked 14th overall, a fall of 7 places since 2001.
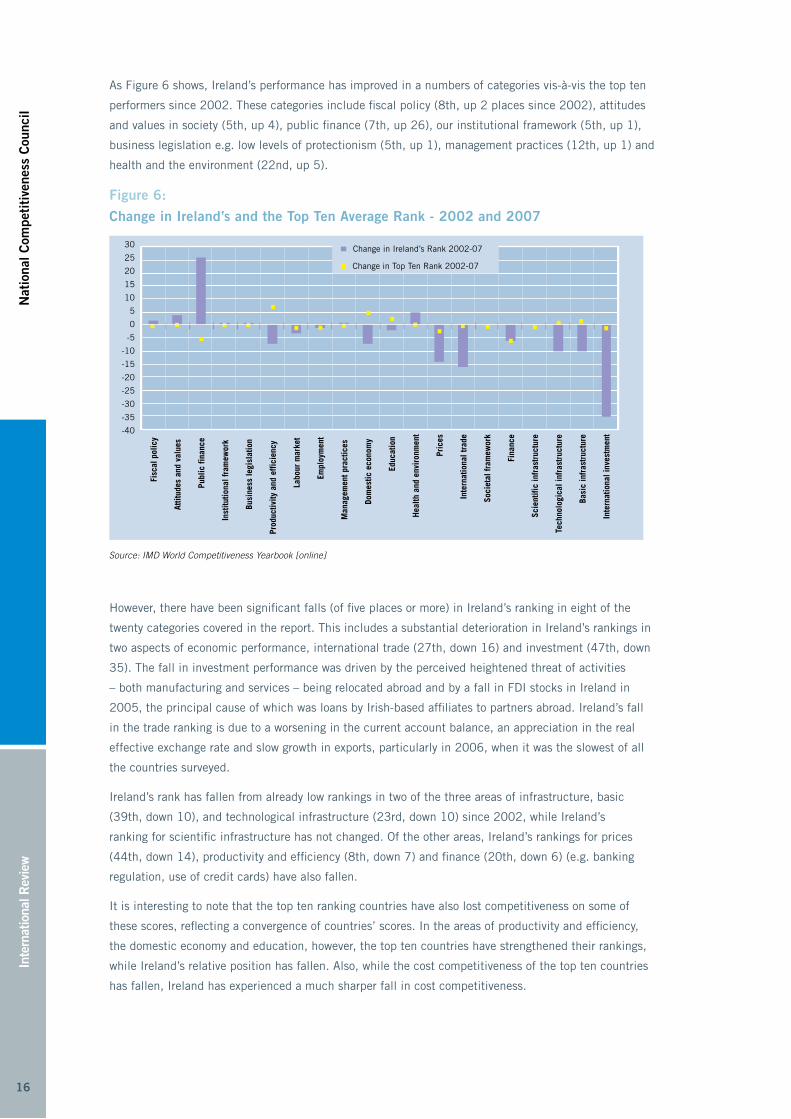
Figure 6 assesses the changes in Ireland’s performance over the period 2002 to 2007. The categories
are ordered from left to right, by Ireland’s score in 2007, i.e. Ireland’s strengths are on the left, while
Ireland’s weaknesses as identified in the 2007 report are on the right-hand side (as in figure 5).
16
Inte
rnat
iona
l Rev
iew
Nat
iona
l Com
peti
tive
ness
Cou
ncil
16
As Figure 6 shows, Ireland’s performance has improved in a numbers of categories vis-à-vis the top ten
performers since 2002. These categories include fiscal policy (8th, up 2 places since 2002), attitudes
and values in society (5th, up 4), public finance (7th, up 26), our institutional framework (5th, up 1),
business legislation e.g. low levels of protectionism (5th, up 1), management practices (12th, up 1) and
health and the environment (22nd, up 5).
Figure 6:
Change in Ireland’s and the Top Ten Average Rank - 2002 and 2007
Fisc
al p
olic
y
Attit
udes
and
val
ues
Publ
ic fi
nanc
e
Inst
itutio
nal f
ram
ewor
k
Busi
ness
legi
slat
ion
Prod
uctiv
ity a
nd e
ffici
ency
Labo
ur m
arke
t
Empl
oym
ent
Man
agem
ent p
ract
ices
Dom
estic
eco
nom
y
Educ
atio
n
Hea
lth a
nd e
nvir
onm
ent
Pric
es
Inte
rnat
iona
l tra
de
Soci
etal
fram
ewor
k
Fina
nce
Scie
ntifi
c in
fras
truc
ture
Tech
nolo
gica
l inf
rast
ruct
ure
Basi
c in
fras
truc
ture
Inte
rnat
iona
l inv
estm
ent
30
25
20
15
10
5
0
-5
-10
-15
-20
-25
-30
-35
-40
Change in Ireland’s Rank 2002-07
Change in Top Ten Rank 2002-07
Source: IMD World Competitiveness Yearbook [online]
However, there have been significant falls (of five places or more) in Ireland’s ranking in eight of the
twenty categories covered in the report. This includes a substantial deterioration in Ireland’s rankings in
two aspects of economic performance, international trade (27th, down 16) and investment (47th, down
35). The fall in investment performance was driven by the perceived heightened threat of activities
– both manufacturing and services – being relocated abroad and by a fall in FDI stocks in Ireland in
2005, the principal cause of which was loans by Irish-based affiliates to partners abroad. Ireland’s fall
in the trade ranking is due to a worsening in the current account balance, an appreciation in the real
effective exchange rate and slow growth in exports, particularly in 2006, when it was the slowest of all
the countries surveyed.
Ireland’s rank has fallen from already low rankings in two of the three areas of infrastructure, basic
(39th, down 10), and technological infrastructure (23rd, down 10) since 2002, while Ireland’s
ranking for scientific infrastructure has not changed. Of the other areas, Ireland’s rankings for prices
(44th, down 14), productivity and efficiency (8th, down 7) and finance (20th, down 6) (e.g. banking
regulation, use of credit cards) have also fallen.
It is interesting to note that the top ten ranking countries have also lost competitiveness on some of
these scores, reflecting a convergence of countries’ scores. In the areas of productivity and efficiency,
the domestic economy and education, however, the top ten countries have strengthened their rankings,
while Ireland’s relative position has fallen. Also, while the cost competitiveness of the top ten countries
has fallen, Ireland has experienced a much sharper fall in cost competitiveness.
17
International Review
National C
ompetitiveness C
ouncil
17
2.5 Key Findings from the World Competitiveness Yearbook
■ Ireland’s World Competitiveness Yearbook ranking in 2007 was 14th, just outside the top quartile.
Ireland’s global ranking has fallen seven places since 2001. In 2007, Ireland ranked sixth of the
EU-15 member states.
■ Compared to the top ten in 2007, Ireland’s strengths lie in fiscal policy, business legislation and
the institutional framework, employment/labour market indicators and the prevailing attitudes and
values in society. Ireland’s public finances have also improved considerably since 2002.
■ Ireland’s main weaknesses are in indicators that assess infrastructure (basic, scientific and
technological), finance, the societal framework, and prices.
18
Inte
rnat
iona
l Rev
iew
Nat
iona
l Com
peti
tive
ness
Cou
ncil
18
3.. EU Lisbon Growth and Jobs Strategy
The Lisbon Agenda was approved in 2000 by the European Council, which consists of the heads of
state of the European Union and the European Commission President. It is a ten-year plan, with its aim
to make the EU by 2010 “the most dynamic and competitive knowledge-based economy capable of
sustainable economic growth, with more and better jobs and greater social cohesion and respect for the
environment”.
In 2004, the European Council and Commission prepared a mid-term review of the plan. This review
found that little progress had been made over the first five years of the plan. In March 2005, the
European Council re-launched the Lisbon Agenda as the Growth and Jobs Strategy. This revised strategy
has a greater focus on economic growth and employment. It also placed greater emphasis on member
states to meet the targets set. Guidelines covering macro-economic and micro-economic policies
were agreed by the European Council for each member state to be addressed through their respective
National Reform Programmes (NRPs). The Commission also prepares an annual progress report, based
on the NRPs and the agreed structural indicators, for the European Council. Lastly, the London-based
Centre for European Reform also produces an overall ranking based on the Lisbon targets. Despite a
recent upturn in EU economic growth and the introduction of the euro and various market reforms, the
strategy is unlikely to meet its overall objective.
3.1 Methodology
The European Commission’s 2006 report to the European Council was underpinned by 127 indicators.
Eurostat collects the figures from each member state’s national statistical agency. These indicators
are grouped under six headings: general economic background, employment, innovation and research,
economic reform, social cohesion and the environment. A shortlist of 14 main indicators (six of which
are further disaggregated by gender) provides an overview of progress across the six headings.
It is worth noting that the Lisbon indicators are focused on comparing the EU to the US, rather than
emerging Asian economies. Many of the key Lisbon indicators are also focused on employment (given
that this is the key economic challenge in many of the larger member states) and policy areas where the
EU has a role (e.g. R&D).
19
International Review
National C
ompetitiveness C
ouncil
19
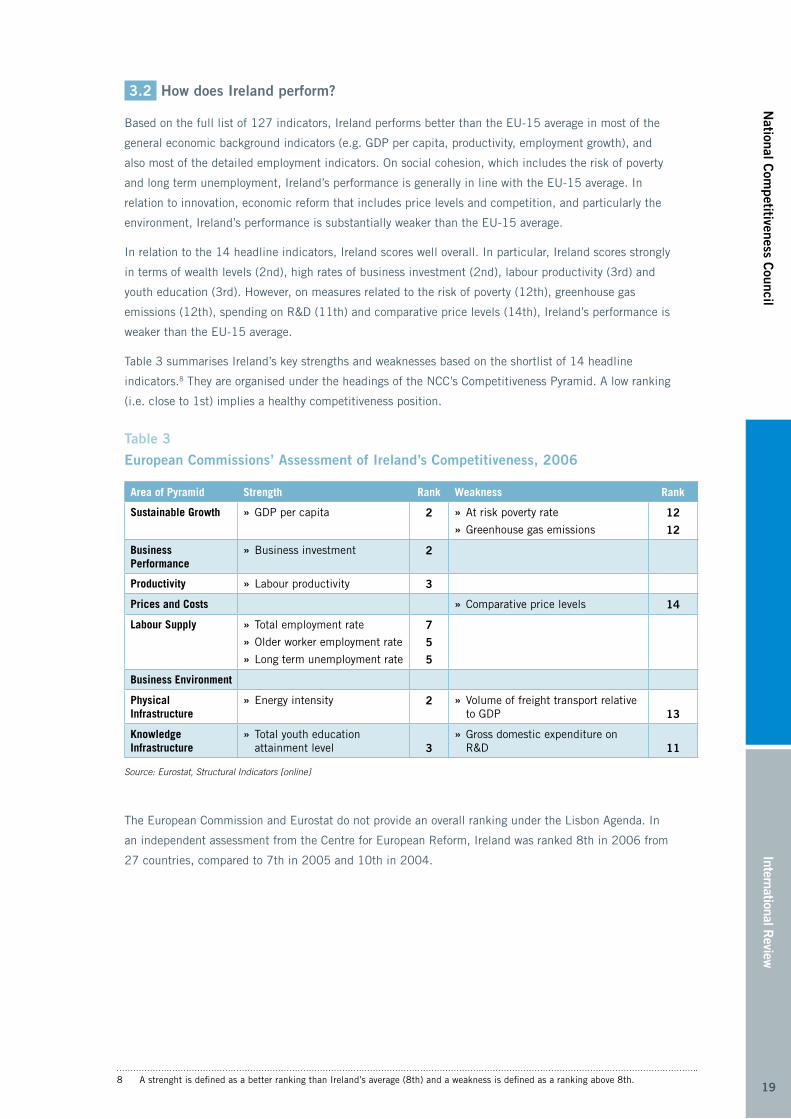
3.2 How does Ireland perform?
Based on the full list of 127 indicators, Ireland performs better than the EU-15 average in most of the
general economic background indicators (e.g. GDP per capita, productivity, employment growth), and
also most of the detailed employment indicators. On social cohesion, which includes the risk of poverty
and long term unemployment, Ireland’s performance is generally in line with the EU-15 average. In
relation to innovation, economic reform that includes price levels and competition, and particularly the
environment, Ireland’s performance is substantially weaker than the EU-15 average.
In relation to the 14 headline indicators, Ireland scores well overall. In particular, Ireland scores strongly
in terms of wealth levels (2nd), high rates of business investment (2nd), labour productivity (3rd) and
youth education (3rd). However, on measures related to the risk of poverty (12th), greenhouse gas
emissions (12th), spending on R&D (11th) and comparative price levels (14th), Ireland’s performance is
weaker than the EU-15 average.
Table 3 summarises Ireland’s key strengths and weaknesses based on the shortlist of 14 headline
indicators.8 They are organised under the headings of the NCC’s Competitiveness Pyramid. A low ranking
(i.e. close to 1st) implies a healthy competitiveness position.
Table 3
European Commissions’ Assessment of Ireland’s Competitiveness, 2006
Area of Pyramid Strength Rank Weakness Rank
Sustainable Growth GDP per capita » 2 At risk poverty rate »
Greenhouse gas emissions »
12
12
Business Performance
Business investment » 2
Productivity Labour productivity » 3
Prices and Costs Comparative price levels » 14
Labour Supply Total employment rate »
Older worker employment rate »
Long term unemployment rate »
7
5
5
Business Environment
Physical Infrastructure
Energy intensity » 2 Volume of freight transport relative »to GDP
13
Knowledge Infrastructure
Total youth education »attainment level
3
Gross domestic expenditure on »R&D
11
Source: Eurostat, Structural Indicators [online]
The European Commission and Eurostat do not provide an overall ranking under the Lisbon Agenda. In
an independent assessment from the Centre for European Reform, Ireland was ranked 8th in 2006 from
27 countries, compared to 7th in 2005 and 10th in 2004.
8 A strenght is defined as a better ranking than Ireland’s average (8th) and a weakness is defined as a ranking above 8th.
20
Inte
rnat
iona
l Rev
iew
Nat
iona
l Com
peti
tive
ness
Cou
ncil
20
Box 1. European Commission’s Assessment of Ireland’s National Reform Programme
Each country is required to prepare a National Reform Programme (NRP) paper, which outlines a member
state’s strategy for achieving the goals of the Lisbon Agenda. The European Commission also publishes
a brief assessment of each member state’s NRP. While the Commission acknowledges the progress that
will be made through government investment and expenditures they also highlight areas for further
improvement. The table below provides an overview of the Commission’s assessment of Ireland’s NRP.
Area Progress madeMore progress
needed
Strategy for Science, Technology and Innovation 4
Measures to address early school leavers and enhance skills 4
Pensions policy 4
Intermediate target for R&D investment should be set 4
Further development of immigration policy and emphasis on supporting older and lower skilled workers (recent development here)
4
Further emissions reductions 4
Accelerate labour market participation 4
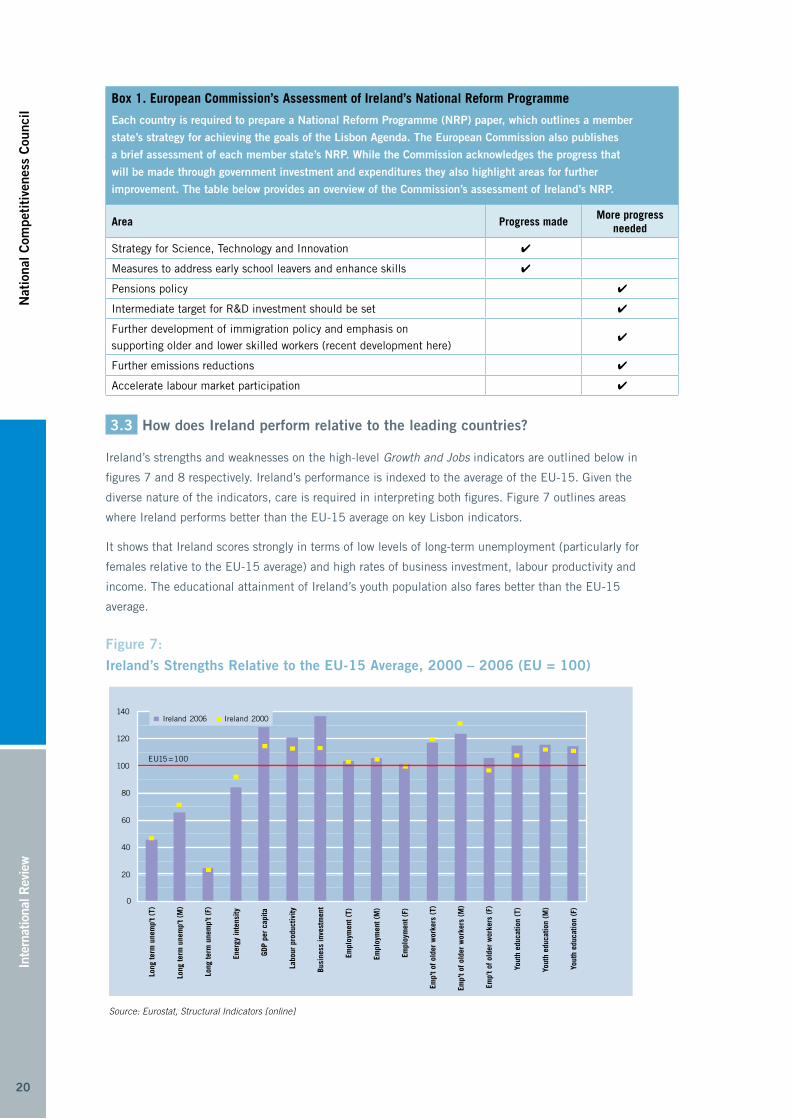
3.3 How does Ireland perform relative to the leading countries?
Ireland’s strengths and weaknesses on the high-level Growth and Jobs indicators are outlined below in
figures 7 and 8 respectively. Ireland’s performance is indexed to the average of the EU-15. Given the
diverse nature of the indicators, care is required in interpreting both figures. Figure 7 outlines areas
where Ireland performs better than the EU-15 average on key Lisbon indicators.
It shows that Ireland scores strongly in terms of low levels of long-term unemployment (particularly for
females relative to the EU-15 average) and high rates of business investment, labour productivity and
income. The educational attainment of Ireland’s youth population also fares better than the EU-15
average.
Figure 7:
Ireland’s Strengths Relative to the EU-15 Average, 2000 – 2006 (EU = 100)
0
20
40
60
80
100
120
140
Long
term
une
mp'
t (T)
Long
term
une
mp'
t (M
)
Long
term
une
mp'
t (F)
Ener
gy in
tens
ity
GDP
per
capi
ta
Labo
ur p
rodu
ctiv
ity
Busi
ness
inve
stm
ent
Empl
oym
ent (
T)
Empl
oym
ent (
M)
Empl
oym
ent (
F)
Emp'
t of o
lder
wor
kers
(T)
Emp'
t of o
lder
wor
kers
(M
)
Emp'
t of o
lder
wor
kers
(F)
Yout
h ed
ucat
ion
(T)
Yout
h ed
ucat
ion
(M)
Yout
h ed
ucat
ion
(F)
EU15 =
2006 2000
100
Ireland Ireland
Source: Eurostat, Structural Indicators [online]
21
International Review
National C
ompetitiveness C
ouncil
21
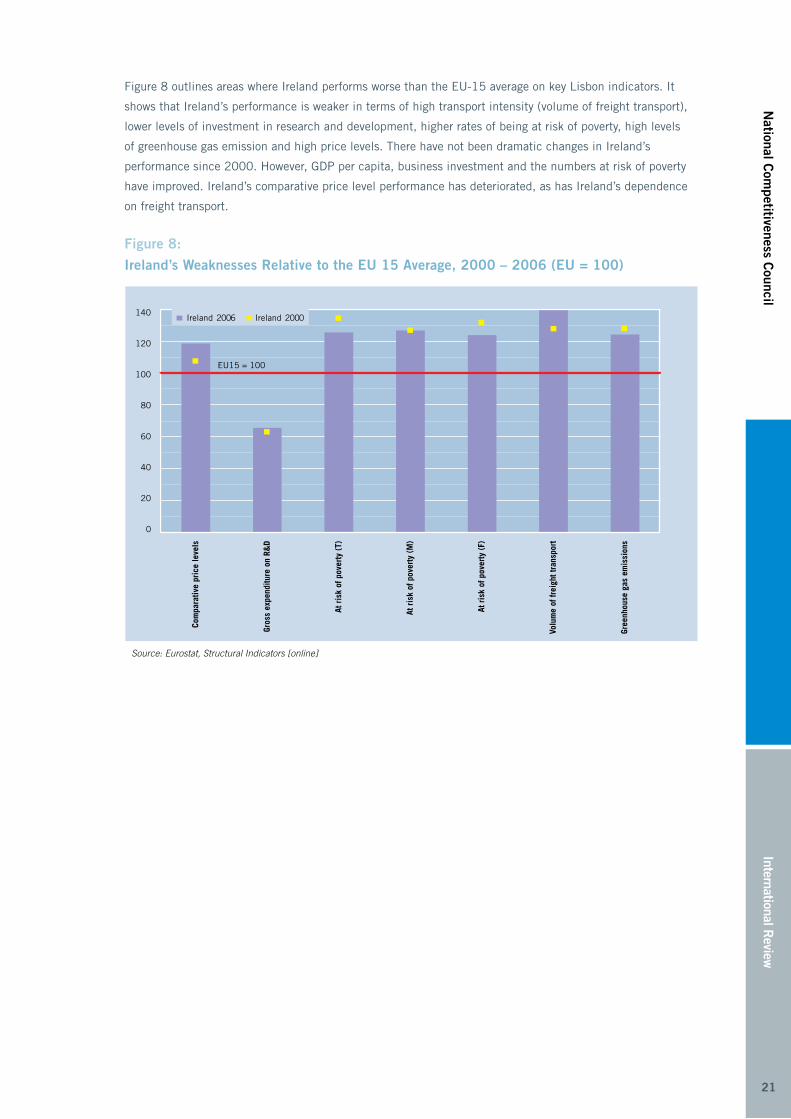
Figure 8 outlines areas where Ireland performs worse than the EU-15 average on key Lisbon indicators. It
shows that Ireland’s performance is weaker in terms of high transport intensity (volume of freight transport),
lower levels of investment in research and development, higher rates of being at risk of poverty, high levels
of greenhouse gas emission and high price levels. There have not been dramatic changes in Ireland’s
performance since 2000. However, GDP per capita, business investment and the numbers at risk of poverty
have improved. Ireland’s comparative price level performance has deteriorated, as has Ireland’s dependence
on freight transport.
Figure 8:
Ireland’s Weaknesses Relative to the EU 15 Average, 2000 – 2006 (EU = 100)
0
20
40
60
80
100
120
140
Com
para
tive
pric
e le
vels
Gros
s ex
pend
iture
on
R&D
At r
isk
of p
over
ty (
T)
At r
isk
of p
over
ty (
M)
At r
isk
of p
over
ty (
F)
Volu
me
of fr
eigh
t tra
nspo
rt
Gree
nhou
se g
as e
mis
sion
s
EU15 = 100
2006 2000Ireland Ireland
Source: Eurostat, Structural Indicators [online]

22
Inte
rnat
iona
l Rev
iew
Nat
iona
l Com
peti
tive
ness
Cou
ncil
22
Box 2. Centre for European Reform’s Lisbon Scorecard
The Centre for European Reform is a policy think-tank based in the UK, whose aim is to improve the quality
of the debate on the European Union. It produces an annual scorecard, which ranks the performance of EU-
27 countries in relation to the EU’s structural indicators. Ireland ranked 8th in 2006, down one place from
2005. The report discusses some of the policy reforms needed to achieve the goals of the Lisbon Agenda.
The table below presents its suggestions in relation to Ireland.
Area Progress madeMore progress
needed
Competition in air travel 4
Ease of doing business 4
Reducing state aid 4
Retirement age 4
Production of renewable electricity 4
Energy market liberalisation 4
Railway market opening 4
Household broadband access 4
E-government 4
As the table shows, for Ireland, the CER has highlighted a number of priority policy areas, including
addressing energy market liberalisation and sustainability, rail competition, Ireland’s ICT infrastructure and
eGovernment performance.
3.4 Key Findings from the Growth and Jobs Strategy
■ Ireland performs well on the EU’s headline indicators for its Growth and Jobs Strategy. Ireland’s CER
Lisbon Scorecard ranking based on those indicators was 8th in 2006, compared to 10th in 2004.
■ The full list of structural indicators reveals that Ireland’s performance exceeds the EU-15 average in
general economic indicators and the employment indicators. On social cohesion, Ireland’s performance
is generally in line with the EU-15 average.
■ According to the full list of Growth and Jobs indicators, Ireland’s main weaknesses relative to the EU-
15 average are in relation to innovation, economic reform, including price levels and competition, and
particularly the environment.

23
International Review
National C
ompetitiveness C
ouncil
23
4. Huggins Associates European Competitiveness Index
Huggins Associates is a private economic consultancy firm that produces the European Competitiveness
Index (ECI) on a biennial basis. The ECI was launched in 2004. In addition to benchmarking the
performance of Europe’s countries, it also benchmarks Europe’s regions across a range of indicators.
Competitiveness is defined in the report as the ‘capability of an economy to maintain increasing
standards of living for those who participate in it, by attracting and maintaining firms with stable or
rising market shares in an activity’. The report notes that competitiveness increasingly refers to the
ability to anticipate and adapt to new challenges and provide new opportunities.
4.1 Methodology
The Huggins European Competitiveness Index uses Eurostat data at a regional level to compare the
performance of Europe’s regions across a number of headings. It comprises 36 indicators under five
main headings:
■ Economic Performance (6 indicators)
■ Creativity (8 indicators)
■ Infrastructure and Accessibility (8 indicators)
■ Knowledge Employment (8 indicators)
■ Education (6 indicators)
The metrics chosen mean that there are aspects of the NCC competitiveness pyramid that are
not included, such as business environment and business performance indicators. Other metrics,
particularly in relation to infrastructure, such as number of vehicles, may not be fully compatible with
sustainable growth. Others, such as in the area of education, may exaggerate regional disparities due to
the clustering of third level institutions in cities.
To create the European Competitiveness Index for regions, the scores are standardised and indices for
each of the components are aggregated to obtain a single composite index. National scores are based on
population-weighted aggregates of a nation’s regional scores.
4.2 How does Ireland perform?
In the national index, Ireland ranks 13th out of 17 countries for overall competitiveness (the EU-15 plus
Norway and Switzerland). Ireland also ranked 13th in the only previous edition of the report in 2004.
At a regional level, Ireland’s two constituent regions, the South and East region ranks 29th, while the
Border, Midlands and West (BMW) region ranks 74th of 120 European regions. Northern Ireland ranks
64th in the index.

24
Inte
rnat
iona
l Rev
iew
Nat
iona
l Com
peti
tive
ness
Cou
ncil
24
Table 4 summarises Ireland’s strengths and weaknesses according to the areas of the NCC’s
competitiveness pyramid.9 Ireland has strengths in many aspects of the competitiveness pyramid,
especially in terms of the productivity levels of internationally trading sectors, including manufacturing
(1st), and the business and property sector (2nd), and labour supply (e.g. number of people employed in
high-tech sectors).
Ireland’s key weaknesses lie in the R&D and infrastructure indicators. Business employment in R&D
ranks 12th, while Ireland’s government and higher education employment levels in R&D are among the
lowest of the 17 countries (15th and 16th respectively). In R&D expenditure terms, Ireland is in the
bottom five of the 17 countries in all three categories, business, government and higher education. In
infrastructure, the length of railway and motorway relative to the size of the country and the number
of vehicles place Ireland among the bottom three weakest performers. Ireland’s employment statistics
reflect Ireland’s specialisation in certain sectors, with high rankings in some sectors (e.g. biotechnology,
chemicals) and low rankings in others (e.g. machinery, equipment manufacturing).
Table 4:
Huggins Associates Assessment of Ireland’s Competitiveness, 2006
Area of Pyramid Strength Rank Weakness Rank
Sustainable Growth GDP per capita » 3
Business Performance
Productivity Levels Overall labour productivity »Manufacturing sector »Business and property sector »
3
1
2
Utility sector »Financial sector »Transport sector »
14
14
16
Prices and Costs
Labour Supply Unemployment »Employment in biotech/ chemical »per 1000 inhabitantsEmployment: electrical »engineering per 1000 inhabitantsEmployment: IT and computer »manufacturing per 1000 inhabitants
6
3
2
2
Employment in R&D per »1000 inhabitants
15
Business Environment
Physical Infrastructure Air passengers embarked »and disembarked per 1000 inhabitants
2
Length of motorway »(per square km and per vehicle)Length of railway per »square kmAir freight »(embarked and disembarked)
14/15
17
16/15
Knowledge Infrastructure Vocational education students per »1000 employeesNumber of students in vocational »tertiary education per 1000 employees
1
3
Upper secondary »students per 1000 employeesR&D employment: »businessR&D employment: »GovernmentR&D employment: »educationR&D expenditure: »businessR&D expenditure: »GovernmentR&D expenditure: »educationPatents »
12
12
15
16
13
14
13
14
Source: European Competitiveness Index, 2006-2007
9 Given the small size, a top six performance is taken as a strength and a bottom six performance in the 17 countries included is taken as a weakness.
25
International Review
National C
ompetitiveness C
ouncil
25
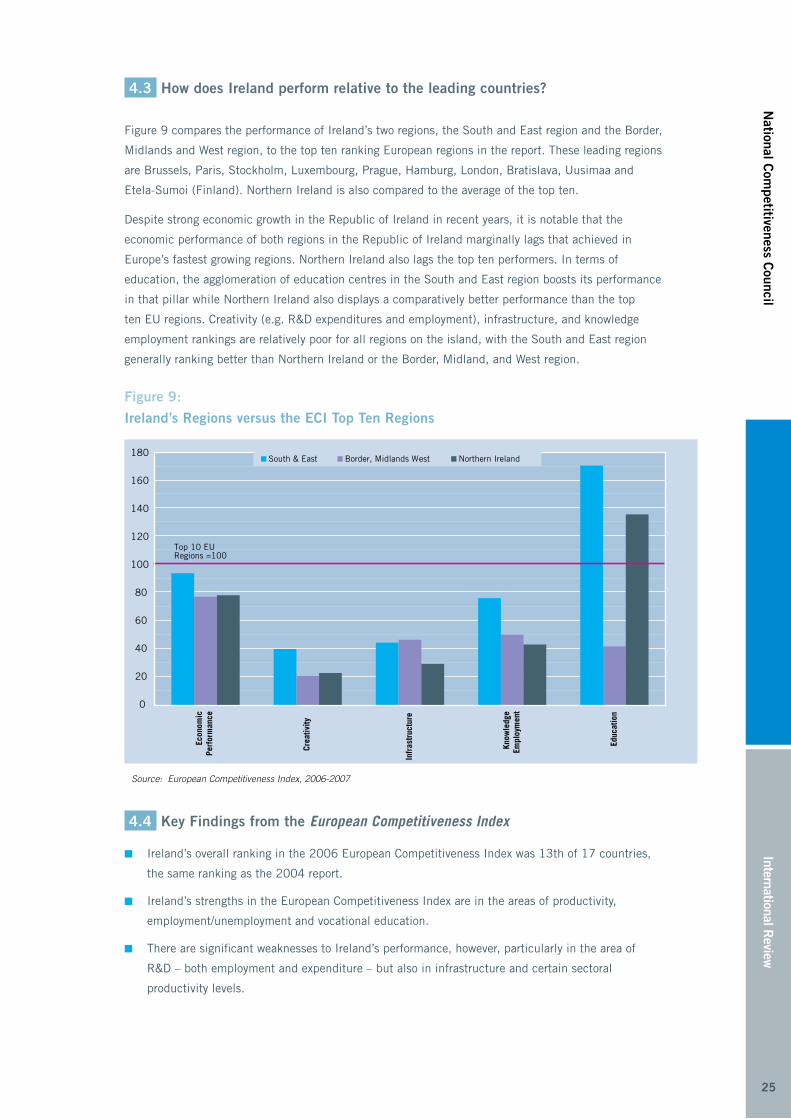
4.3 How does Ireland perform relative to the leading countries?
Figure 9 compares the performance of Ireland’s two regions, the South and East region and the Border,
Midlands and West region, to the top ten ranking European regions in the report. These leading regions
are Brussels, Paris, Stockholm, Luxembourg, Prague, Hamburg, London, Bratislava, Uusimaa and
Etela-Sumoi (Finland). Northern Ireland is also compared to the average of the top ten.
Despite strong economic growth in the Republic of Ireland in recent years, it is notable that the
economic performance of both regions in the Republic of Ireland marginally lags that achieved in
Europe’s fastest growing regions. Northern Ireland also lags the top ten performers. In terms of
education, the agglomeration of education centres in the South and East region boosts its performance
in that pillar while Northern Ireland also displays a comparatively better performance than the top
ten EU regions. Creativity (e.g. R&D expenditures and employment), infrastructure, and knowledge
employment rankings are relatively poor for all regions on the island, with the South and East region
generally ranking better than Northern Ireland or the Border, Midland, and West region.
Figure 9:
Ireland’s Regions versus the ECI Top Ten Regions
0
20
40
60
80
100
120
140
160
180
Top 10 EU Regions =100
Econ
omic
Perf
orm
ance
Crea
tivity
Infr
astr
uctu
re
Know
ledg
eEm
ploy
men
t
Educ
atio
n
South & East Northern IrelandBorder, Midlands West
Source: European Competitiveness Index, 2006-2007
4.4 Key Findings from the European Competitiveness Index
■ Ireland’s overall ranking in the 2006 European Competitiveness Index was 13th of 17 countries,
the same ranking as the 2004 report.
■ Ireland’s strengths in the European Competitiveness Index are in the areas of productivity,
employment/unemployment and vocational education.
■ There are significant weaknesses to Ireland’s performance, however, particularly in the area of
R&D – both employment and expenditure – but also in infrastructure and certain sectoral
productivity levels.
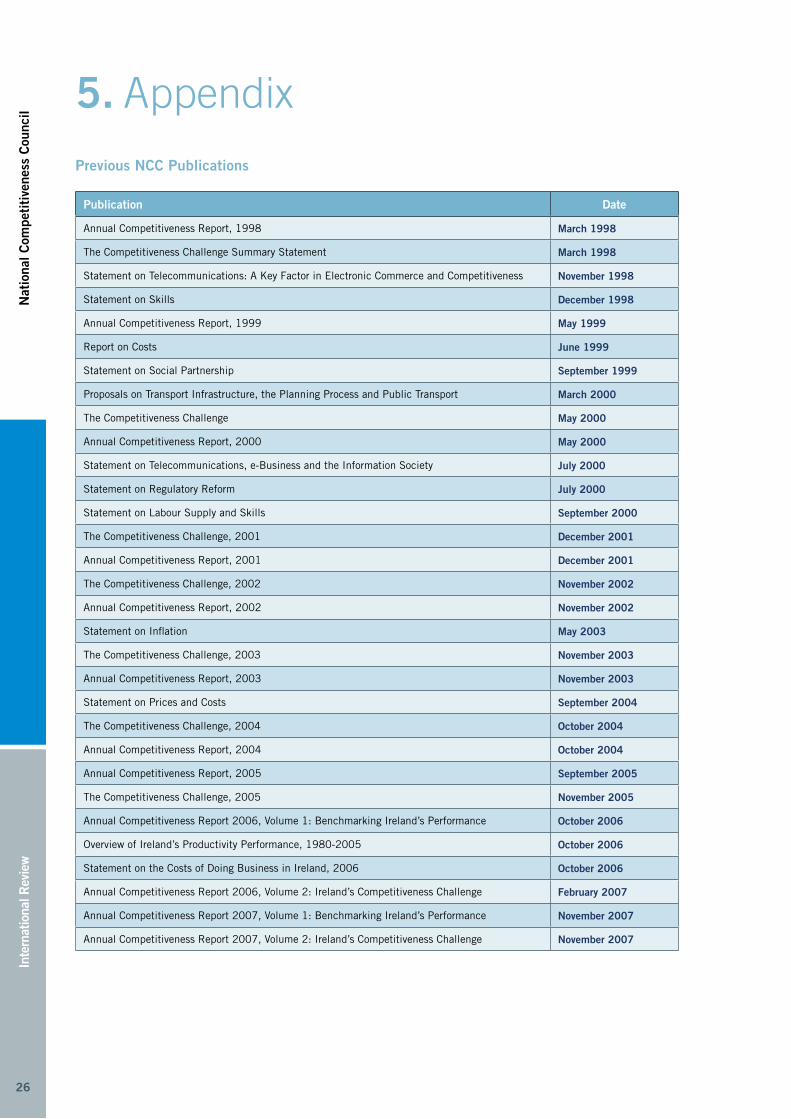
26
Inte
rnat
iona
l Rev
iew
Nat
iona
l Com
peti
tive
ness
Cou
ncil
26
5. Appendix
Previous NCC Publications
Publication Date
Annual Competitiveness Report, 1998 March 1998
The Competitiveness Challenge Summary Statement March 1998
Statement on Telecommunications: A Key Factor in Electronic Commerce and Competitiveness November 1998
Statement on Skills December 1998
Annual Competitiveness Report, 1999 May 1999
Report on Costs June 1999
Statement on Social Partnership September 1999
Proposals on Transport Infrastructure, the Planning Process and Public Transport March 2000
The Competitiveness Challenge May 2000
Annual Competitiveness Report, 2000 May 2000
Statement on Telecommunications, e-Business and the Information Society July 2000
Statement on Regulatory Reform July 2000
Statement on Labour Supply and Skills September 2000
The Competitiveness Challenge, 2001 December 2001
Annual Competitiveness Report, 2001 December 2001
The Competitiveness Challenge, 2002 November 2002
Annual Competitiveness Report, 2002 November 2002
Statement on Inflation May 2003
The Competitiveness Challenge, 2003 November 2003
Annual Competitiveness Report, 2003 November 2003
Statement on Prices and Costs September 2004
The Competitiveness Challenge, 2004 October 2004
Annual Competitiveness Report, 2004 October 2004
Annual Competitiveness Report, 2005 September 2005
The Competitiveness Challenge, 2005 November 2005
Annual Competitiveness Report 2006, Volume 1: Benchmarking Ireland’s Performance October 2006
Overview of Ireland’s Productivity Performance, 1980-2005 October 2006
Statement on the Costs of Doing Business in Ireland, 2006 October 2006
Annual Competitiveness Report 2006, Volume 2: Ireland’s Competitiveness Challenge February 2007
Annual Competitiveness Report 2007, Volume 1: Benchmarking Ireland’s Performance November 2007
Annual Competitiveness Report 2007, Volume 2: Ireland’s Competitiveness Challenge November 2007

27
International Review
National C
ompetitiveness C
ouncil
27

28
Inte
rnat
iona
l Rev
iew
Nat
iona
l Com
peti
tive
ness
Cou
ncil
28
29
International Review
National C
ompetitiveness C
ouncil
29

30
Inte
rnat
iona
l Rev
iew
Nat
iona
l Com
peti
tive
ness
Cou
ncil
30