Embed Size (px)
Citation preview
Portland State University Portland State University
PDXScholar PDXScholar
TREC Webinar Series Transportation Research and Education Center (TREC)
10-30-2017
Webinar: Transportation Benefits of Parking Cash-Webinar: Transportation Benefits of Parking Cash-
Out, Pre-Tax Commuter Benefits, and Parking Out, Pre-Tax Commuter Benefits, and Parking
Surtaxes Surtaxes
Allen Greenberg Federal Highway Administration
James Choe ICF Strategic Consulting
Sonika Sethi Leidos Consulting
Colleen Stoll City of Santa Monica
Follow this and additional works at: https://pdxscholar.library.pdx.edu/trec_webinar
Part of the Transportation Commons, Transportation Engineering Commons, and the Urban Studies
Commons
Let us know how access to this document benefits you.
Recommended Citation Recommended Citation Greenberg, Allen; Choe, James; Sethi, Sonika; and Stoll, Colleen, "Webinar: Transportation Benefits of Parking Cash-Out, Pre-Tax Commuter Benefits, and Parking Surtaxes" (2017). TREC Webinar Series. 23. https://pdxscholar.library.pdx.edu/trec_webinar/23
This Book is brought to you for free and open access. It has been accepted for inclusion in TREC Webinar Series by an authorized administrator of PDXScholar. Please contact us if we can make this document more accessible: [email protected].
WEBINARTransportation Benefits of Parking Cash-Out,
Pre-Tax Commuter Benefits, and Parking Surtaxes
October 30, 2017
TREC is co-hosting this webinar in partnership with Leidos Consulting and the Federal Highway Administration (FHWA).
Transportation Benefits of Parking Cash-Out, Pre-Tax Commuter Benefits, and Parking Surtaxes
Sonika Sethi
Leidos Consulting
Allen GreenbergFHWA
James Choe
ICF Strategic Consulting
Colleen Stoll
City of Santa Monica
Webinar Overview
• Presentation with 15 minutes for questions• The webinar recording and slides will be posted online
and a link will be sent out• The webinar has been approved for 1 CM and PDH• Upcoming webinars
http://trec.pdx.edu/events/webinars– November 9 – “What Do We Know About Location
Affordability in US Shrinking Cities?” presented by Joanna Ganning, Cleveland State University
– December 4 – “Case Studies in the FTA Manual on Pedestrian and Bicycle Connections to Transit” presented by Nathan McNeil, Portland State University
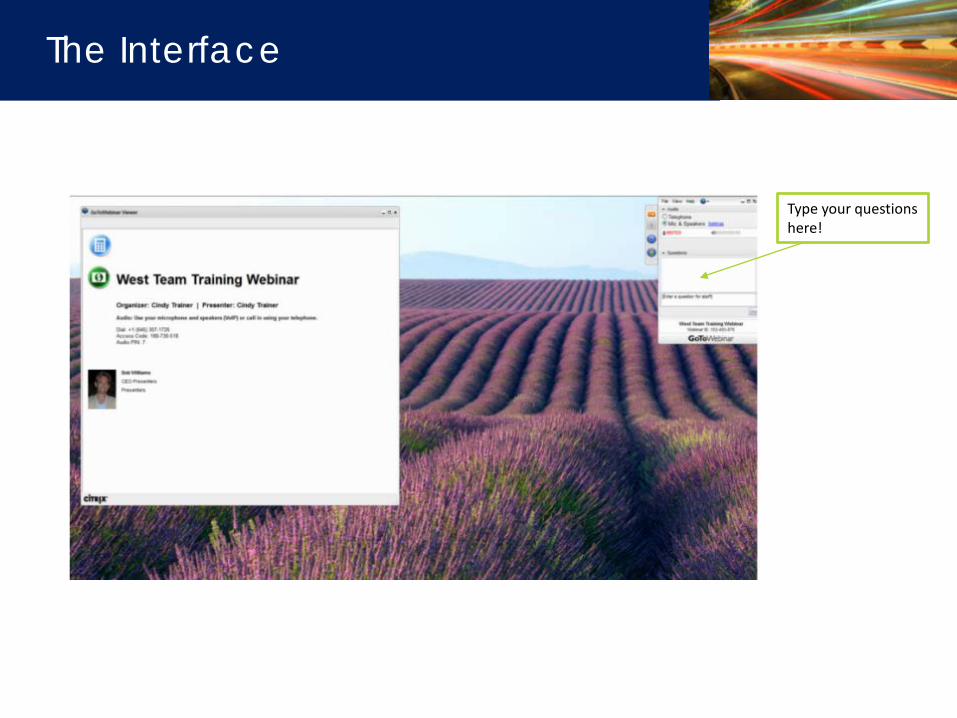
The Interface
Type your questions here!
Expected Impacts of City-Level Parking Cash-Out and Transit
Benefit Ordinances
TREC at Portland State UniversityNational Institute for Transportation &
Communities (NITC)October 30, 2017
What is Parking Cash Out?
• Employers that subsidize parking offer commuters the option to take a benefit of equivalent monetary value instead of the parking subsidy
• The benefit could pay for public transit or another tax-free commute alternative and the employee would pocket the rest as taxable cash (or pocket all of it if carpooling, bicycling, or walking to work)
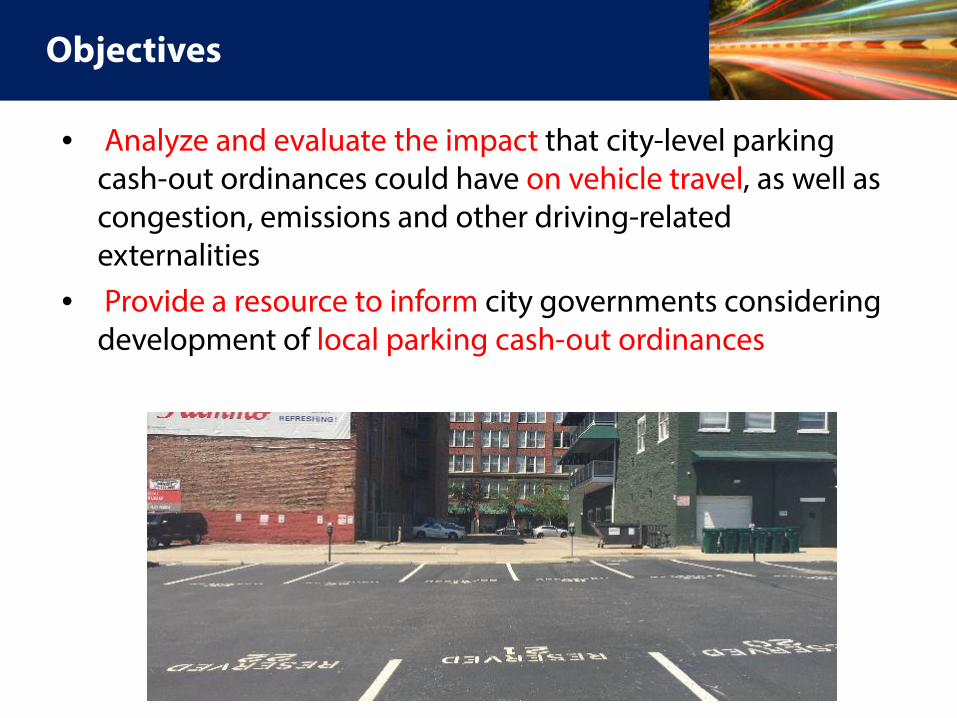
Objectives
• Analyze and evaluate the impact that city-level parking cash-out ordinances could have on vehicle travel, as well as congestion, emissions and other driving-related externalities
• Provide a resource to inform city governments considering development of local parking cash-out ordinances
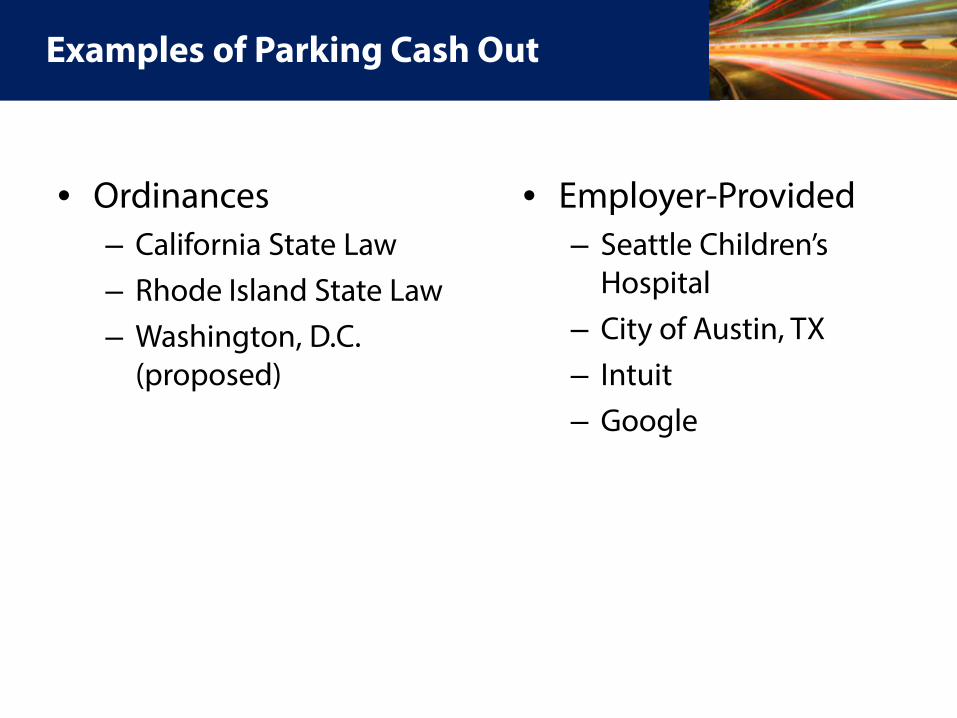
Examples of Parking Cash Out
• Ordinances– California State Law– Rhode Island State Law– Washington, D.C.
(proposed)
• Employer-Provided– Seattle Children’s
Hospital– City of Austin, TX– Intuit– Google
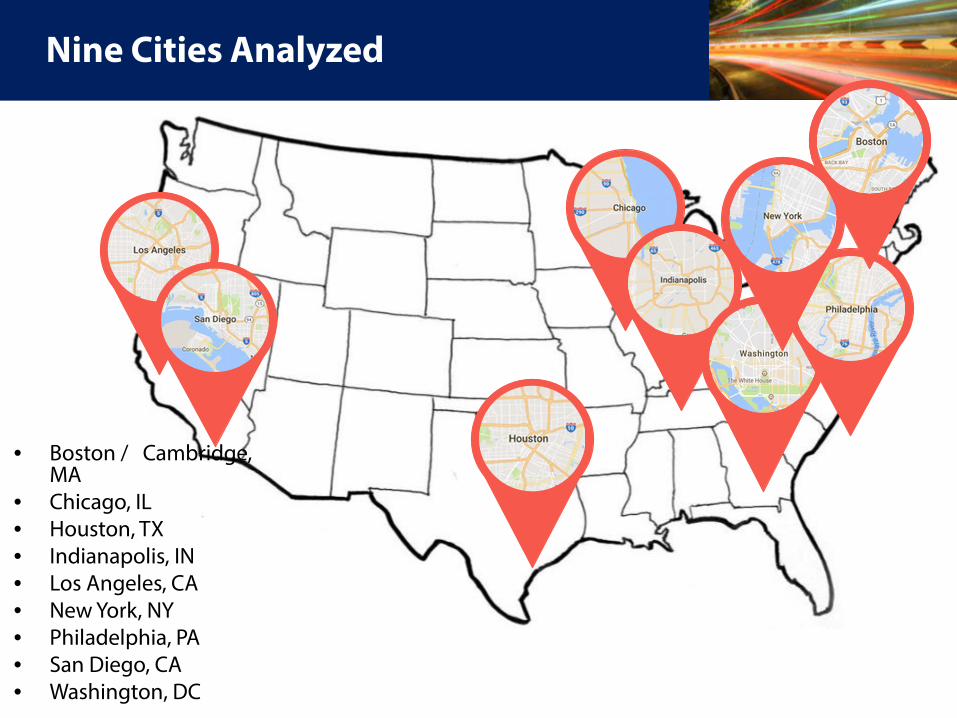
Nine Cities Analyzed
• Boston / Cambridge, MA
• Chicago, IL• Houston, TX• Indianapolis, IN• Los Angeles, CA• New York, NY• Philadelphia, PA • San Diego, CA• Washington, DC
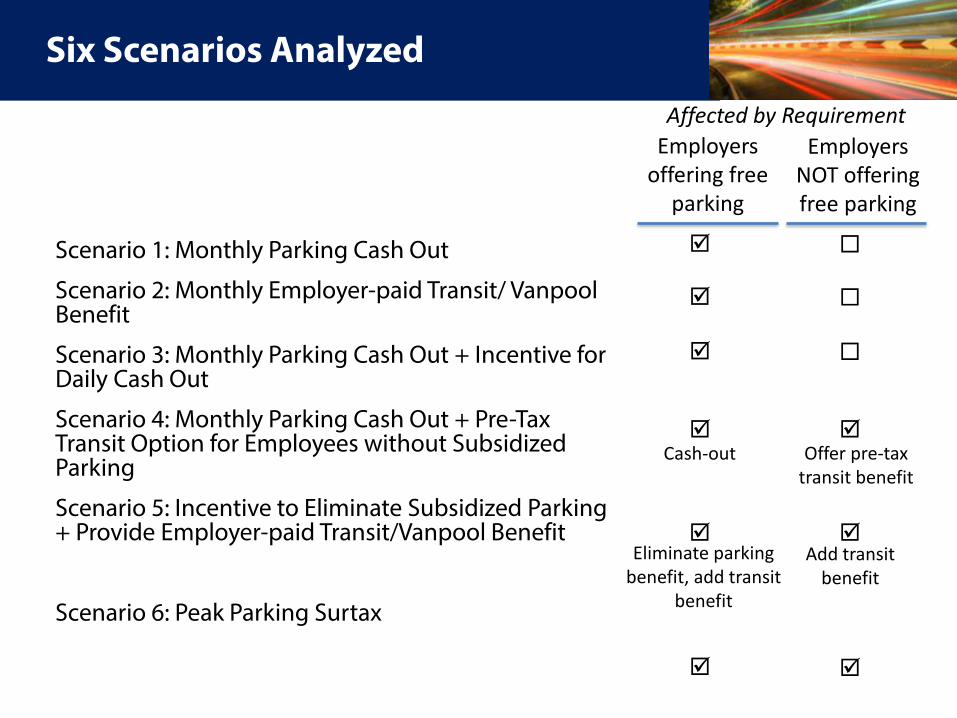
Six Scenarios Analyzed
Scenario 1: Monthly Parking Cash Out
Scenario 2: Monthly Employer-paid Transit/ Vanpool Benefit
Scenario 3: Monthly Parking Cash Out + Incentive for Daily Cash Out
Scenario 4: Monthly Parking Cash Out + Pre-Tax Transit Option for Employees without Subsidized Parking
Scenario 5: Incentive to Eliminate Subsidized Parking + Provide Employer-paid Transit/Vanpool Benefit
Scenario 6: Peak Parking Surtax
Affected by RequirementEmployers
offering free parking
Employers NOT offering free parking
Cash-out Offer pre-tax transit benefit
Eliminate parking benefit, add transit
benefit
Add transit benefit

Six Scenarios Analyzed
Only for Employers that Offer Subsidized Parking:
Scenario 1: Monthly Parking Cash Out: Requires employers to offer employees the option to cash out their parking on a monthly basis. The cash-out value is equal to the monthly parking rate but no less than the average cost of riding transit.
Scenario 2: Monthly Employer-paid Transit/Vanpool Benefit: Requires employers to offer employees for whom they are subsidizing parking tax-exempt transit and vanpool benefits up to the maximum allowed by law for each commuter, but not in excess of the value of the parking benefit.
Scenario 3: Monthly Parking Cash Out + Incentive for Daily Cash Out:Requires employers to offer monthly cash out and provides tax credits to encourage employers to offer daily cash out instead of monthly cash out.
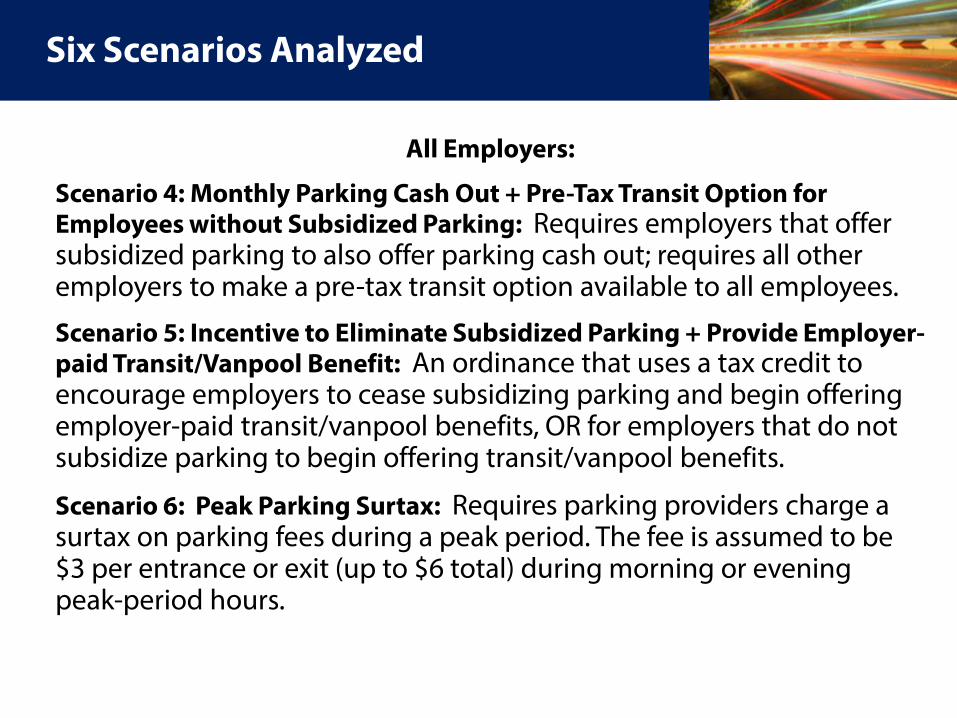
Six Scenarios Analyzed
All Employers:
Scenario 4: Monthly Parking Cash Out + Pre-Tax Transit Option for Employees without Subsidized Parking: Requires employers that offer subsidized parking to also offer parking cash out; requires all other employers to make a pre-tax transit option available to all employees.
Scenario 5: Incentive to Eliminate Subsidized Parking + Provide Employer-paid Transit/Vanpool Benefit: An ordinance that uses a tax credit to encourage employers to cease subsidizing parking and begin offering employer-paid transit/vanpool benefits, OR for employers that do not subsidize parking to begin offering transit/vanpool benefits.
Scenario 6: Peak Parking Surtax: Requires parking providers charge a surtax on parking fees during a peak period. The fee is assumed to be $3 per entrance or exit (up to $6 total) during morning or evening peak-period hours.

Key Inputs and Outputs
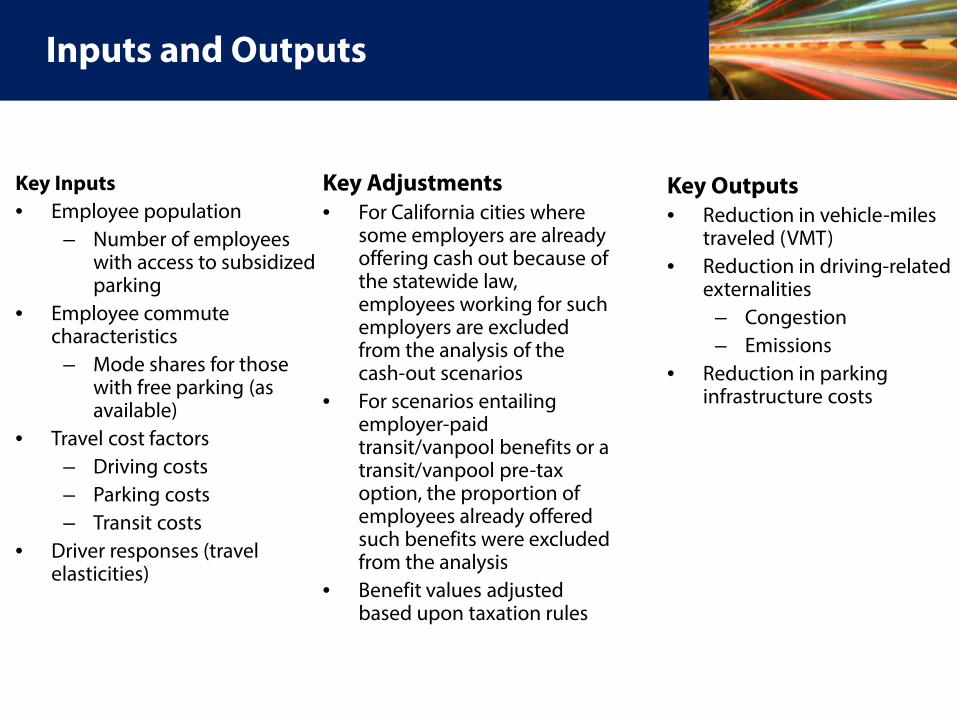
Inputs and Outputs
Key Inputs• Employee population
– Number of employees with access to subsidized parking
• Employee commute characteristics
– Mode shares for those with free parking (as available)
• Travel cost factors– Driving costs– Parking costs– Transit costs
• Driver responses (travel elasticities)
Key Outputs• Reduction in vehicle-miles
traveled (VMT)• Reduction in driving-related
externalities – Congestion – Emissions
• Reduction in parking infrastructure costs
Key Adjustments• For California cities where
some employers are already offering cash out because of the statewide law, employees working for such employers are excluded from the analysis of the cash-out scenarios
• For scenarios entailing employer-paid transit/vanpool benefits or a transit/vanpool pre-tax option, the proportion of employees already offered such benefits were excluded from the analysis
• Benefit values adjusted based upon taxation rules
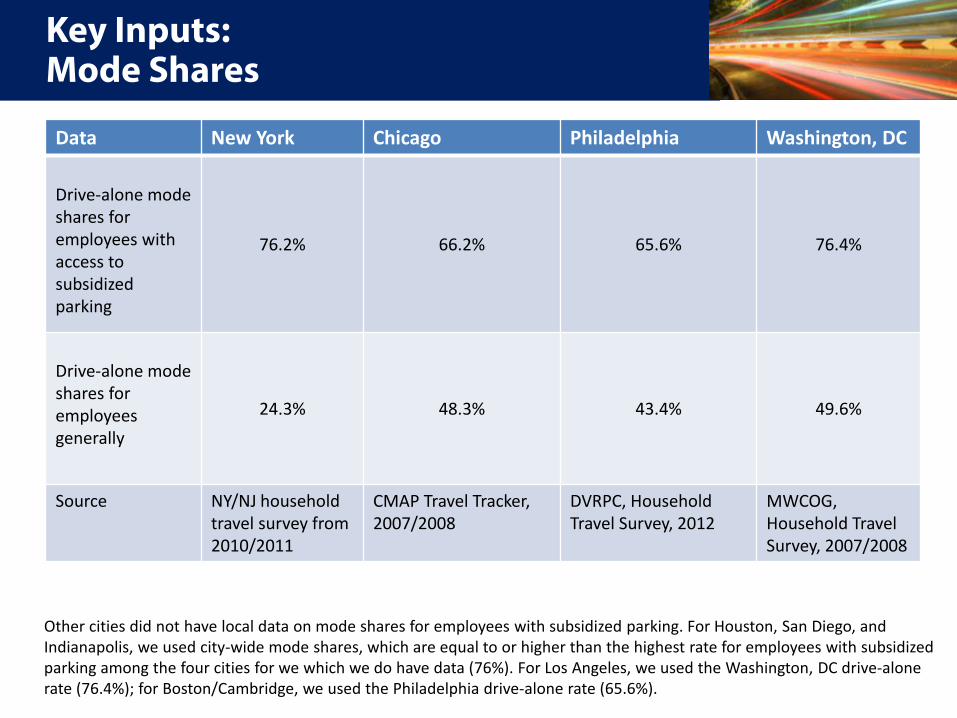
Key Inputs:Mode Shares
Data New York Chicago Philadelphia Washington, DC
Drive-alone mode shares for employees with access to subsidized parking
76.2% 66.2% 65.6% 76.4%
Drive-alone mode shares for employees generally
24.3% 48.3% 43.4% 49.6%
Source NY/NJ household travel survey from 2010/2011
CMAP Travel Tracker, 2007/2008
DVRPC, Household Travel Survey, 2012
MWCOG, Household Travel Survey, 2007/2008
Other cities did not have local data on mode shares for employees with subsidized parking. For Houston, San Diego, and Indianapolis, we used city-wide mode shares, which are equal to or higher than the highest rate for employees with subsidized parking among the four cities for we which we do have data (76%). For Los Angeles, we used the Washington, DC drive-alone rate (76.4%); for Boston/Cambridge, we used the Philadelphia drive-alone rate (65.6%).
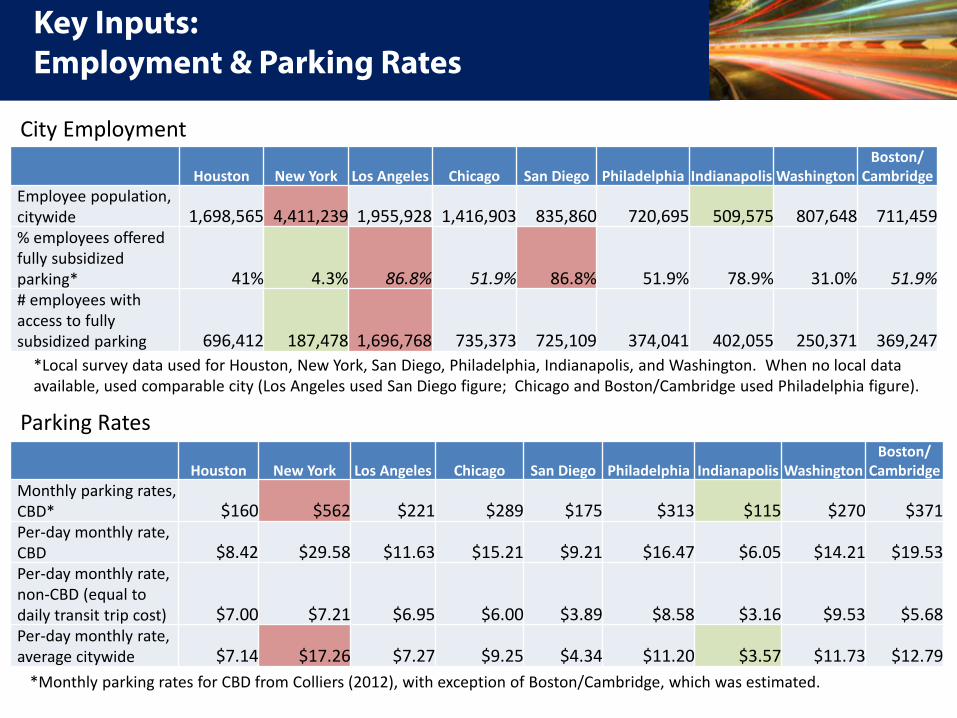
Key Inputs: Employment & Parking Rates
*Local survey data used for Houston, New York, San Diego, Philadelphia, Indianapolis, and Washington. When no local data available, used comparable city (Los Angeles used San Diego figure; Chicago and Boston/Cambridge used Philadelphia figure).
Houston New York Los Angeles Chicago San Diego Philadelphia Indianapolis WashingtonBoston/
CambridgeEmployee population, citywide 1,698,565 4,411,239 1,955,928 1,416,903 835,860 720,695 509,575 807,648 711,459% employees offered fully subsidized parking* 41% 4.3% 86.8% 51.9% 86.8% 51.9% 78.9% 31.0% 51.9%# employees with access to fully subsidized parking 696,412 187,478 1,696,768 735,373 725,109 374,041 402,055 250,371 369,247
Houston New York Los Angeles Chicago San Diego Philadelphia Indianapolis WashingtonBoston/
CambridgeMonthly parking rates, CBD* $160 $562 $221 $289 $175 $313 $115 $270 $371 Per-day monthly rate, CBD $8.42 $29.58 $11.63 $15.21 $9.21 $16.47 $6.05 $14.21 $19.53 Per-day monthly rate, non-CBD (equal to daily transit trip cost) $7.00 $7.21 $6.95 $6.00 $3.89 $8.58 $3.16 $9.53 $5.68 Per-day monthly rate, average citywide $7.14 $17.26 $7.27 $9.25 $4.34 $11.20 $3.57 $11.73 $12.79
City Employment
Parking Rates
*Monthly parking rates for CBD from Colliers (2012), with exception of Boston/Cambridge, which was estimated.
Key Assumptions and Approaches
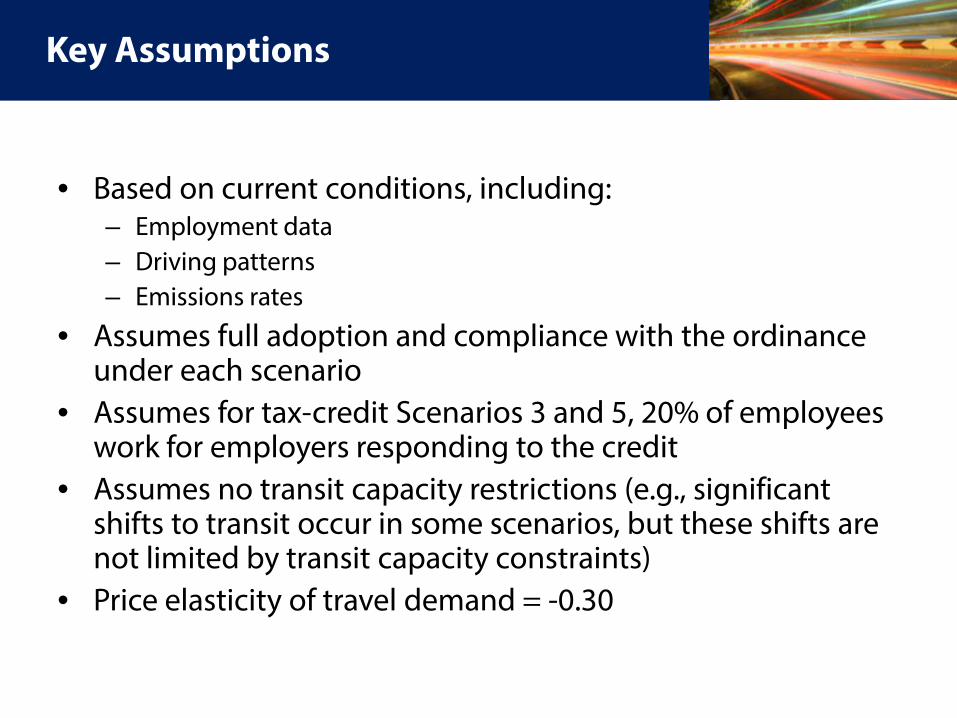
Key Assumptions
• Based on current conditions, including:– Employment data– Driving patterns – Emissions rates
• Assumes full adoption and compliance with the ordinance under each scenario
• Assumes for tax-credit Scenarios 3 and 5, 20% of employees work for employers responding to the credit
• Assumes no transit capacity restrictions (e.g., significant shifts to transit occur in some scenarios, but these shifts are not limited by transit capacity constraints)
• Price elasticity of travel demand = -0.30
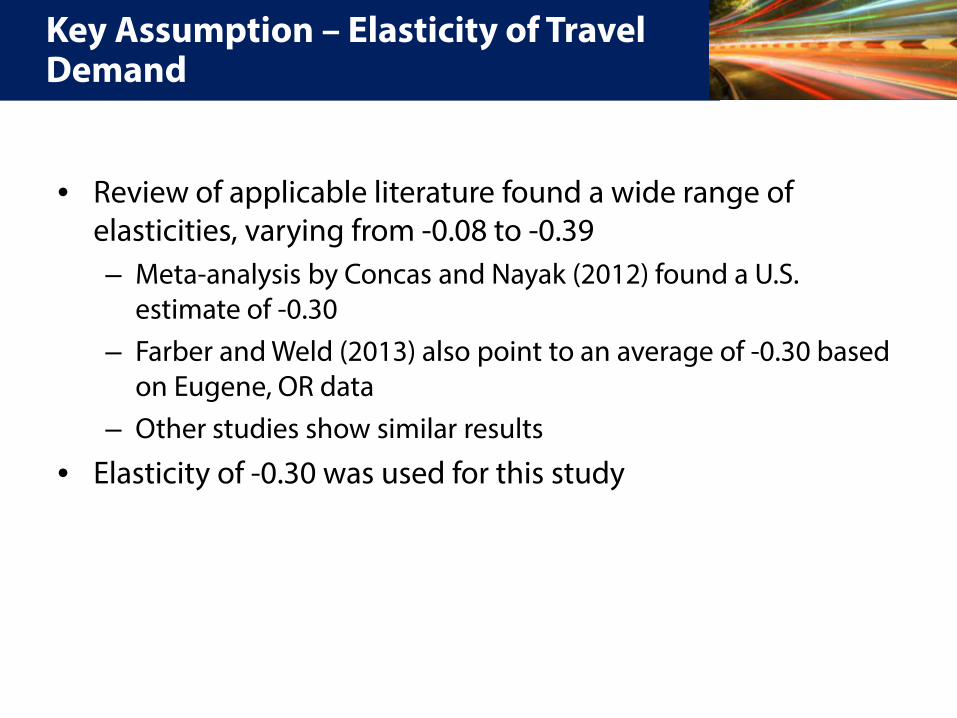
Key Assumption – Elasticity of Travel Demand
• Review of applicable literature found a wide range of elasticities, varying from -0.08 to -0.39– Meta-analysis by Concas and Nayak (2012) found a U.S.
estimate of -0.30– Farber and Weld (2013) also point to an average of -0.30 based
on Eugene, OR data– Other studies show similar results
• Elasticity of -0.30 was used for this study
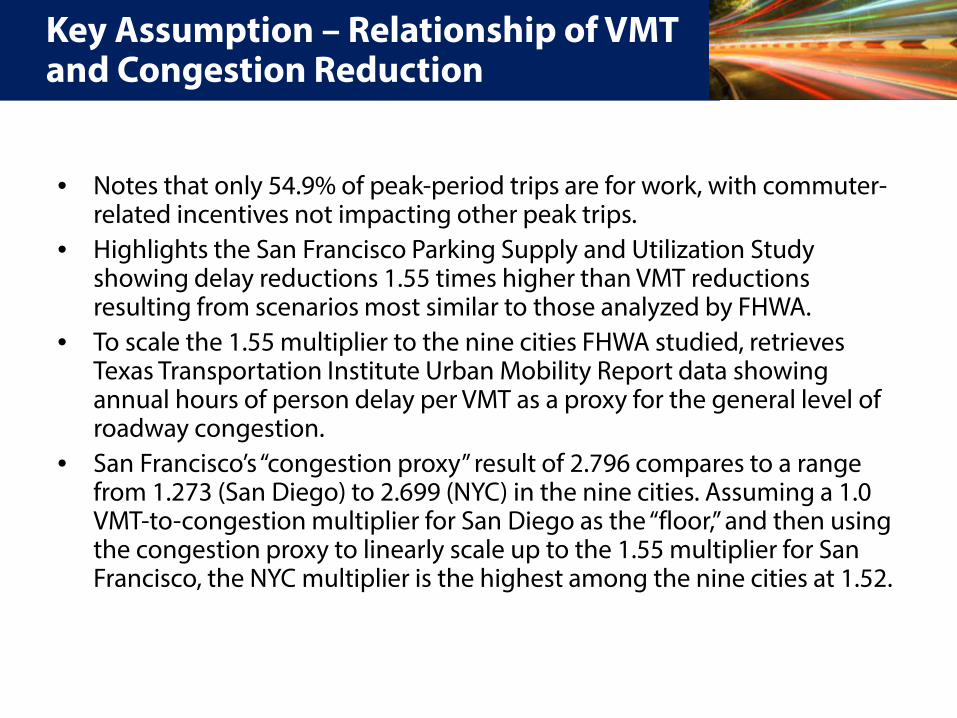
Key Assumption – Relationship of VMT and Congestion Reduction
• Notes that only 54.9% of peak-period trips are for work, with commuter-related incentives not impacting other peak trips.
• Highlights the San Francisco Parking Supply and Utilization Study showing delay reductions 1.55 times higher than VMT reductions resulting from scenarios most similar to those analyzed by FHWA.
• To scale the 1.55 multiplier to the nine cities FHWA studied, retrieves Texas Transportation Institute Urban Mobility Report data showing annual hours of person delay per VMT as a proxy for the general level of roadway congestion.
• San Francisco’s “congestion proxy” result of 2.796 compares to a range from 1.273 (San Diego) to 2.699 (NYC) in the nine cities. Assuming a 1.0 VMT-to-congestion multiplier for San Diego as the “floor,” and then using the congestion proxy to linearly scale up to the 1.55 multiplier for San Francisco, the NYC multiplier is the highest among the nine cities at 1.52.
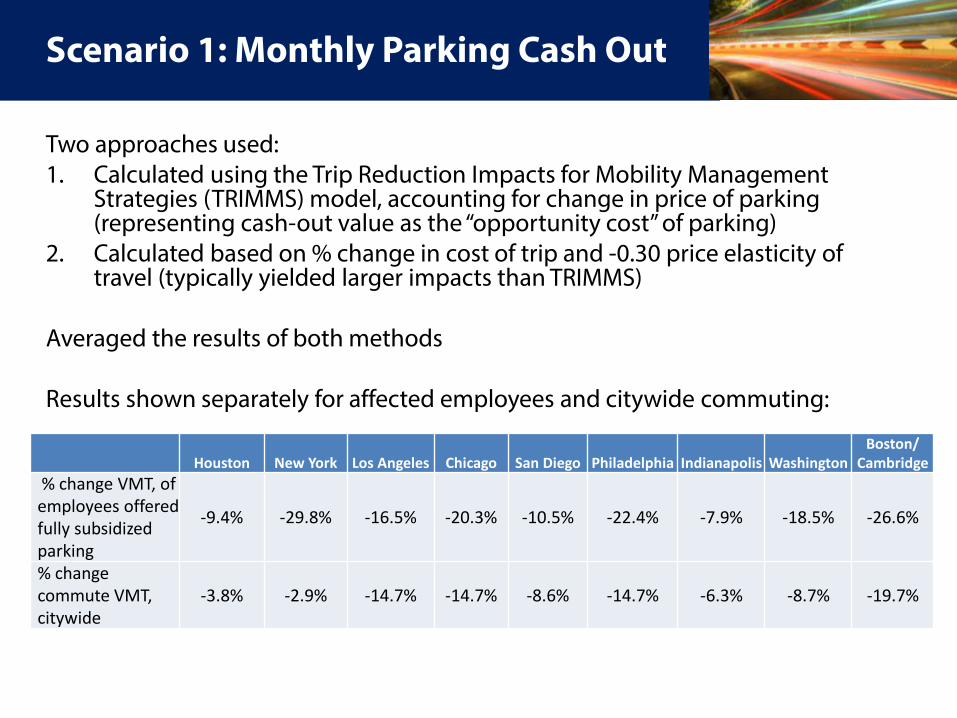
Scenario 1: Monthly Parking Cash Out
Two approaches used:1. Calculated using the Trip Reduction Impacts for Mobility Management
Strategies (TRIMMS) model, accounting for change in price of parking (representing cash-out value as the “opportunity cost” of parking)
2. Calculated based on % change in cost of trip and -0.30 price elasticity of travel (typically yielded larger impacts than TRIMMS)
Averaged the results of both methods
Results shown separately for affected employees and citywide commuting:
Houston New York Los Angeles Chicago San Diego Philadelphia Indianapolis WashingtonBoston/
Cambridge% change VMT, of employees offered fully subsidized parking
-9.4% -29.8% -16.5% -20.3% -10.5% -22.4% -7.9% -18.5% -26.6%
% change commute VMT, citywide
-3.8% -2.9% -14.7% -14.7% -8.6% -14.7% -6.3% -8.7% -19.7%
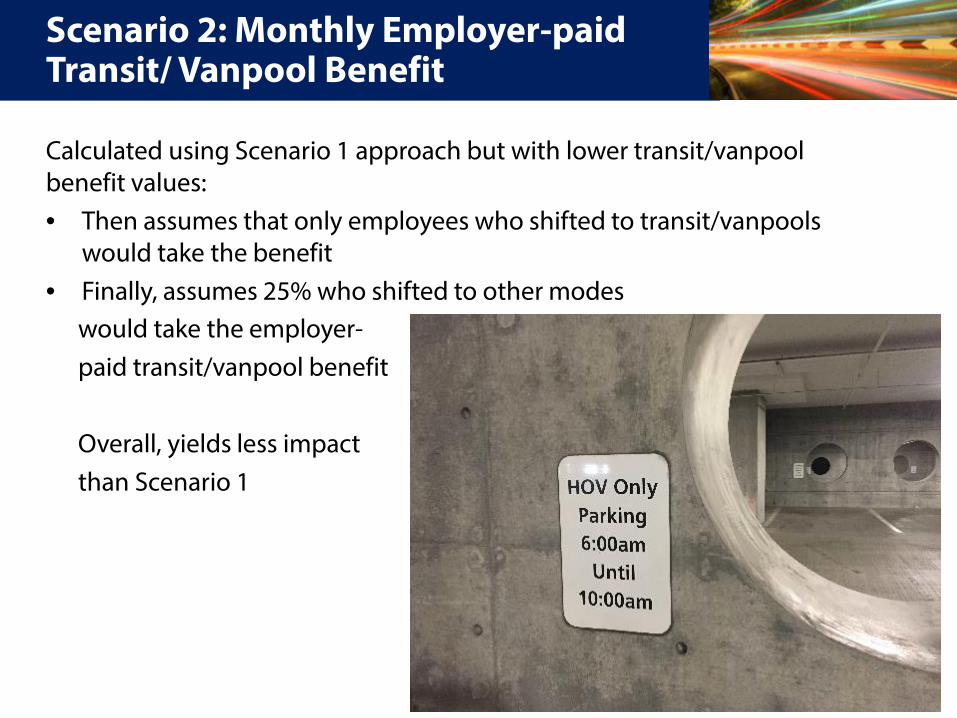
Scenario 2: Monthly Employer-paid Transit/ Vanpool Benefit
Calculated using Scenario 1 approach but with lower transit/vanpool benefit values:• Then assumes that only employees who shifted to transit/vanpools
would take the benefit• Finally, assumes 25% who shifted to other modes
would take the employer-paid transit/vanpool benefit
Overall, yields less impact than Scenario 1
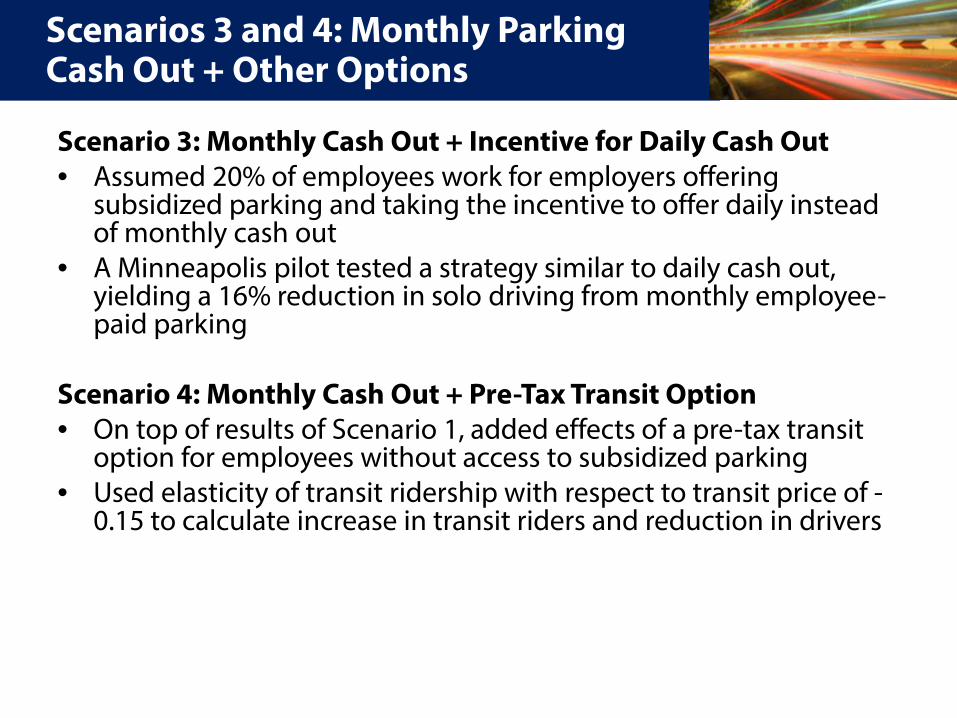
Scenarios 3 and 4: Monthly Parking Cash Out + Other Options
Scenario 3: Monthly Cash Out + Incentive for Daily Cash Out• Assumed 20% of employees work for employers offering
subsidized parking and taking the incentive to offer daily instead of monthly cash out
• A Minneapolis pilot tested a strategy similar to daily cash out, yielding a 16% reduction in solo driving from monthly employee-paid parking
Scenario 4: Monthly Cash Out + Pre-Tax Transit Option• On top of results of Scenario 1, added effects of a pre-tax transit
option for employees without access to subsidized parking• Used elasticity of transit ridership with respect to transit price of -
0.15 to calculate increase in transit riders and reduction in drivers
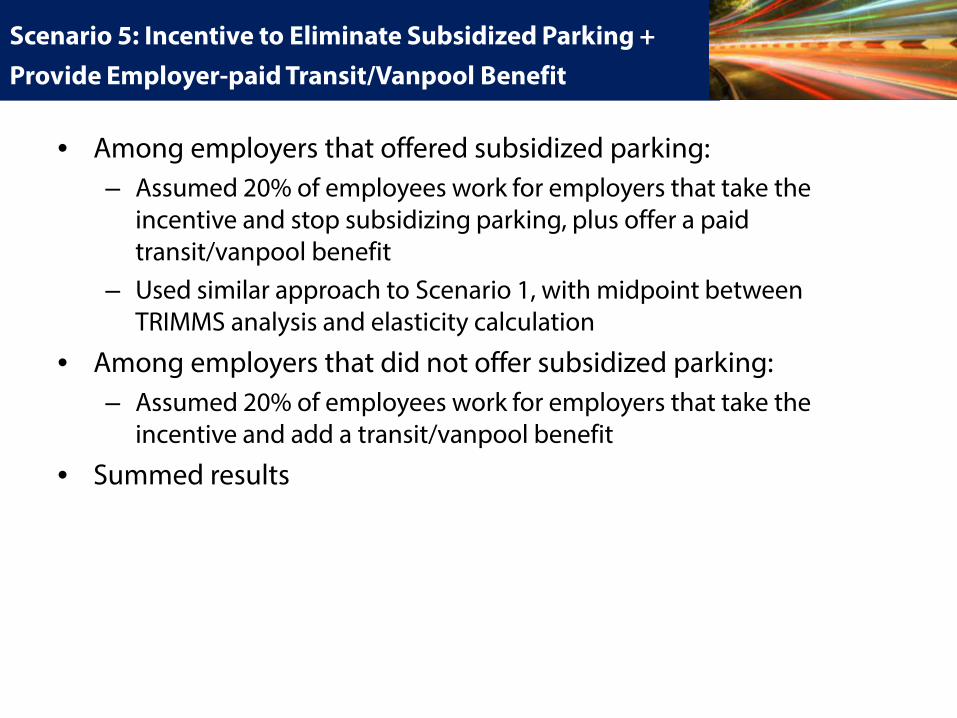
Scenario 5: Incentive to Eliminate Subsidized Parking + Provide Employer-paid Transit/Vanpool Benefit
• Among employers that offered subsidized parking:– Assumed 20% of employees work for employers that take the
incentive and stop subsidizing parking, plus offer a paid transit/vanpool benefit
– Used similar approach to Scenario 1, with midpoint between TRIMMS analysis and elasticity calculation
• Among employers that did not offer subsidized parking: – Assumed 20% of employees work for employers that take the
incentive and add a transit/vanpool benefit
• Summed results
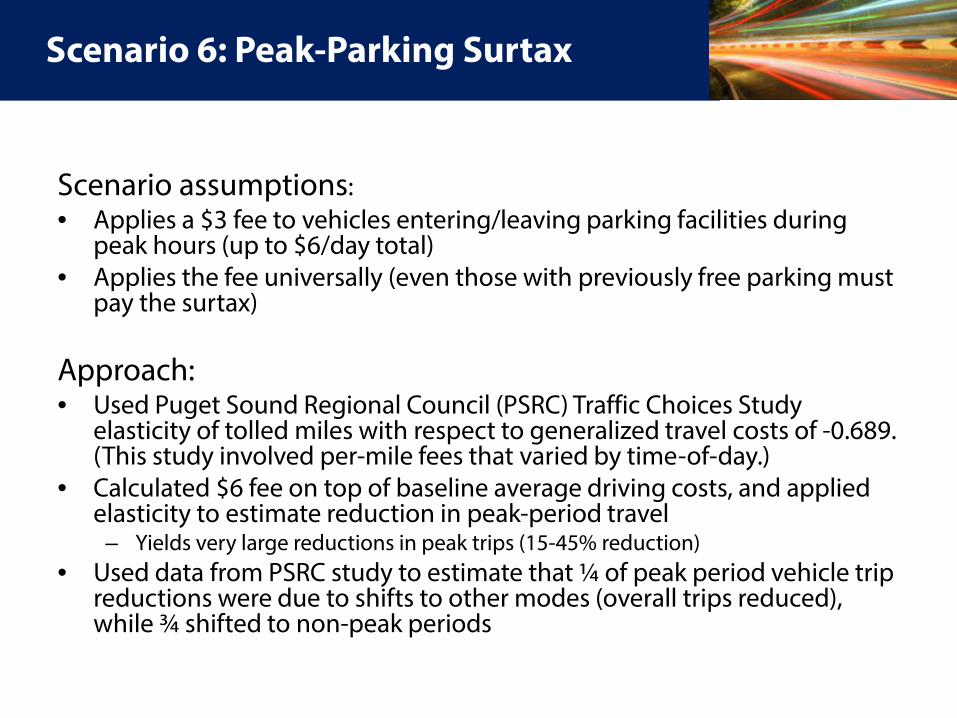
Scenario 6: Peak-Parking Surtax
Scenario assumptions:• Applies a $3 fee to vehicles entering/leaving parking facilities during
peak hours (up to $6/day total)• Applies the fee universally (even those with previously free parking must
pay the surtax)
Approach:• Used Puget Sound Regional Council (PSRC) Traffic Choices Study
elasticity of tolled miles with respect to generalized travel costs of -0.689. (This study involved per-mile fees that varied by time-of-day.)
• Calculated $6 fee on top of baseline average driving costs, and applied elasticity to estimate reduction in peak-period travel– Yields very large reductions in peak trips (15-45% reduction)
• Used data from PSRC study to estimate that ¼ of peak period vehicle trip reductions were due to shifts to other modes (overall trips reduced), while ¾ shifted to non-peak periods
Results and Conclusions
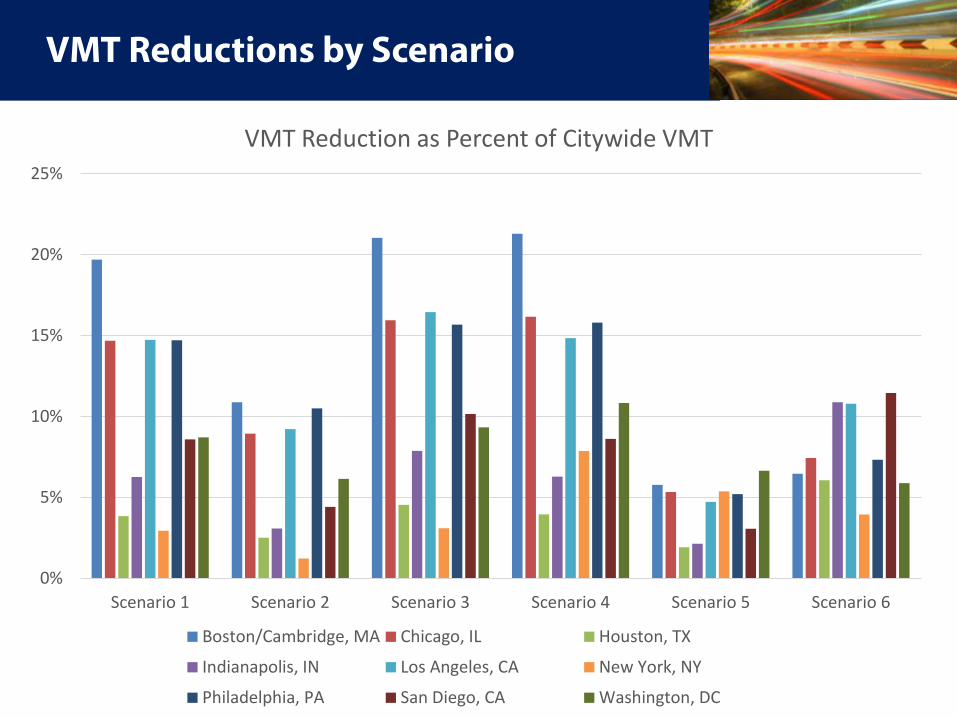
VMT Reductions by Scenario
0%
5%
10%
15%
20%
25%
Scenario 1 Scenario 2 Scenario 3 Scenario 4 Scenario 5 Scenario 6
VMT Reduction as Percent of Citywide VMT
Boston/Cambridge, MA Chicago, IL Houston, TX
Indianapolis, IN Los Angeles, CA New York, NY
Philadelphia, PA San Diego, CA Washington, DC
Scenario-Specific Conclusions
• Parking cash-out requirements (Scenario 1 and Scenario 3, which adds an incentive for daily cash out) show significant potential for VMT reduction– Scenario 3 shows somewhat greater reductions due to assumed
attractiveness of the more flexible daily option• Employer-paid transit/vanpool requirement (Scenario 2) shows more
modest (but still substantial) reductions than full monthly cash out• Adding a requirement that employers offer a pre-tax transit option
(Scenario 4) provides additional impacts, particularly in cities where relatively few employers subsidize parking– The proportion of employees responding is likely to be small due to
employees needing to set aside transit money in advance and only being able to pocket the tax savings
– Since, however, the policy applies in many cities to a large population of employees who do not currently receive subsidized parking, it does offer modest overall impact
Scenario-Specific Conclusions
• An incentive to eliminate employer-paid parking benefits and add employer-paid transit/vanpool benefits (Scenario 5) yields very large impacts for employees working at firms that accept the incentive– Analysis assumed that only 20% of employees see such an incentive
scheme (although results from 100% adoption were also calculated)
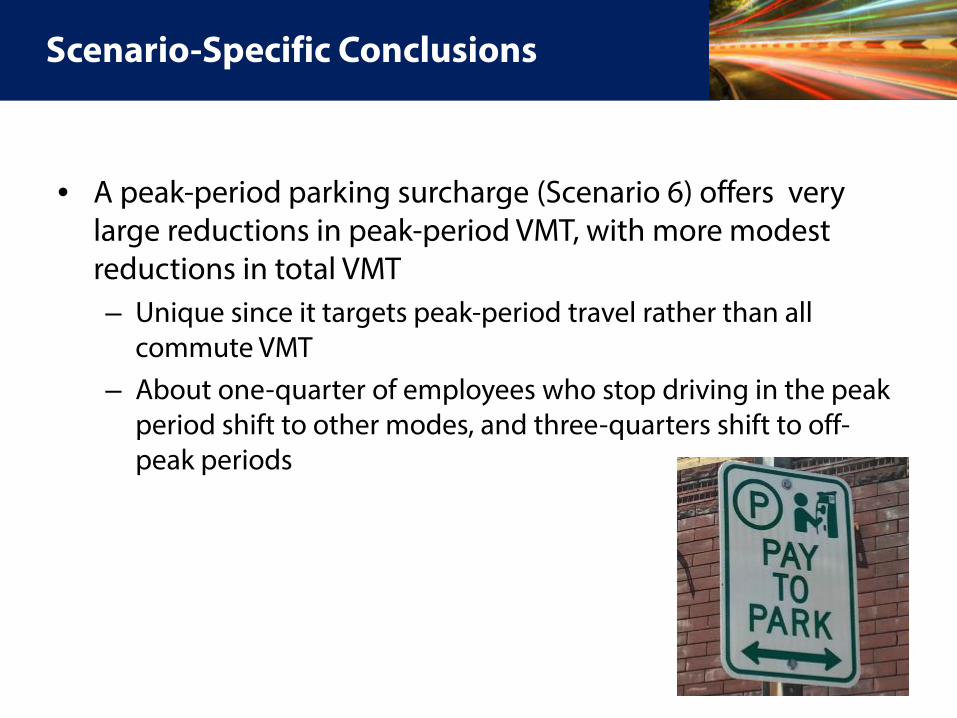
Scenario-Specific Conclusions
• A peak-period parking surcharge (Scenario 6) offers very large reductions in peak-period VMT, with more modest reductions in total VMT– Unique since it targets peak-period travel rather than all
commute VMT– About one-quarter of employees who stop driving in the peak
period shift to other modes, and three-quarters shift to off-peak periods
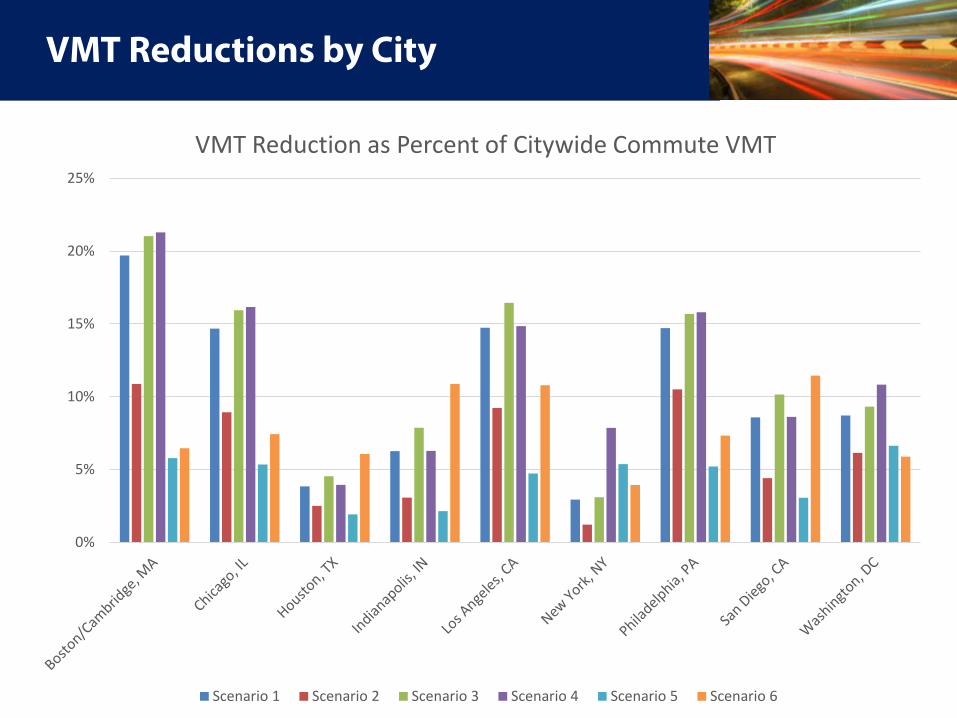
VMT Reductions by City
0%
5%
10%
15%
20%
25%
VMT Reduction as Percent of Citywide Commute VMT
Scenario 1 Scenario 2 Scenario 3 Scenario 4 Scenario 5 Scenario 6
City-Specific Conclusions
• Higher VMT reduction in some cities where: – high parking rates– lower drive-alone mode share - existing transit infrastructure is
good or the option is perceived to be viable
• Lower than expected VMT reduction in some cities where: – high citywide drive-alone share (e.g., Houston and
Indianapolis: drive-alone shares of 80 percent or higher)– low share of employees receiving subsidized parking (e.g.,
New York)
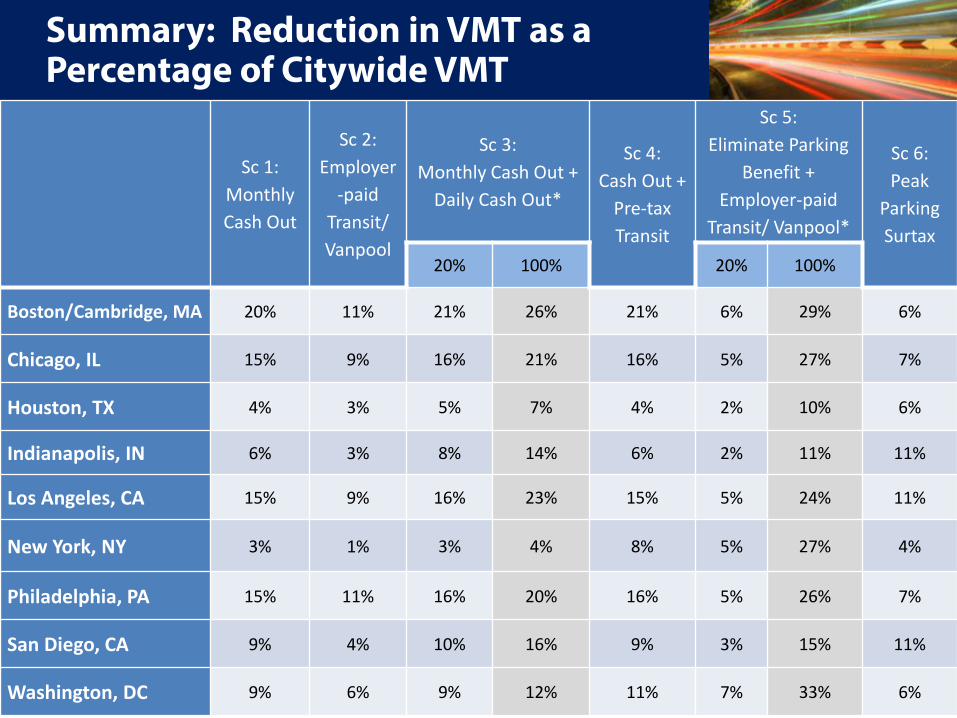
Summary: Reduction in VMT as a Percentage of Citywide VMT
Sc 1: Monthly Cash Out
Sc 2: Employer
-paid Transit/ Vanpool
Sc 3:Monthly Cash Out +
Daily Cash Out*
Sc 4:Cash Out +
Pre-tax Transit
Sc 5: Eliminate Parking
Benefit +Employer-paid
Transit/ Vanpool*
Sc 6: Peak
Parking Surtax
20% 100% 20% 100%
Boston/Cambridge, MA 20% 11% 21% 26% 21% 6% 29% 6%
Chicago, IL 15% 9% 16% 21% 16% 5% 27% 7%
Houston, TX 4% 3% 5% 7% 4% 2% 10% 6%
Indianapolis, IN 6% 3% 8% 14% 6% 2% 11% 11%
Los Angeles, CA 15% 9% 16% 23% 15% 5% 24% 11%
New York, NY 3% 1% 3% 4% 8% 5% 27% 4%
Philadelphia, PA 15% 11% 16% 20% 16% 5% 26% 7%
San Diego, CA 9% 4% 10% 16% 9% 3% 15% 11%
Washington, DC 9% 6% 9% 12% 11% 7% 33% 6%
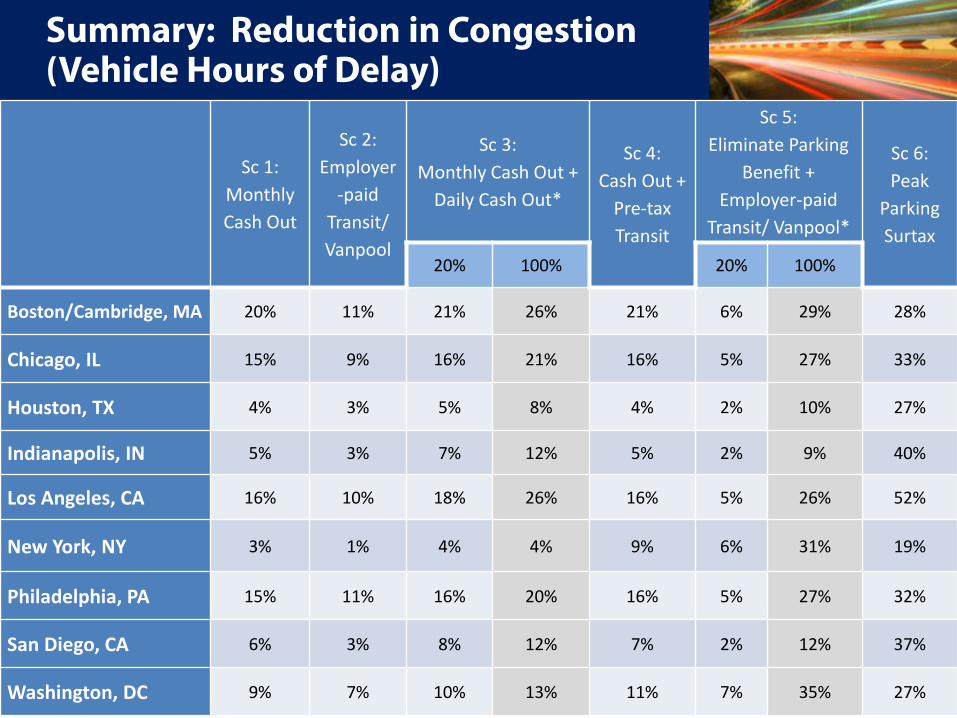
Summary: Reduction in Congestion (Vehicle Hours of Delay)
Sc 1: Monthly Cash Out
Sc 2: Employer
-paid Transit/ Vanpool
Sc 3:Monthly Cash Out +
Daily Cash Out*
Sc 4:Cash Out +
Pre-tax Transit
Sc 5: Eliminate Parking
Benefit +Employer-paid
Transit/ Vanpool*
Sc 6: Peak
Parking Surtax
20% 100% 20% 100%
Boston/Cambridge, MA 20% 11% 21% 26% 21% 6% 29% 28%
Chicago, IL 15% 9% 16% 21% 16% 5% 27% 33%
Houston, TX 4% 3% 5% 8% 4% 2% 10% 27%
Indianapolis, IN 5% 3% 7% 12% 5% 2% 9% 40%
Los Angeles, CA 16% 10% 18% 26% 16% 5% 26% 52%
New York, NY 3% 1% 4% 4% 9% 6% 31% 19%
Philadelphia, PA 15% 11% 16% 20% 16% 5% 27% 32%
San Diego, CA 6% 3% 8% 12% 7% 2% 12% 37%
Washington, DC 9% 7% 10% 13% 11% 7% 35% 27%
Questions & Contacts
• Allen Greenberg, FHWA Office of Operations– [email protected]
• Sonika Sethi, Leidos– [email protected]
• James Choe, ICF– [email protected]
Parking Cash-OutIPI WebinarOctober 18 , 2017
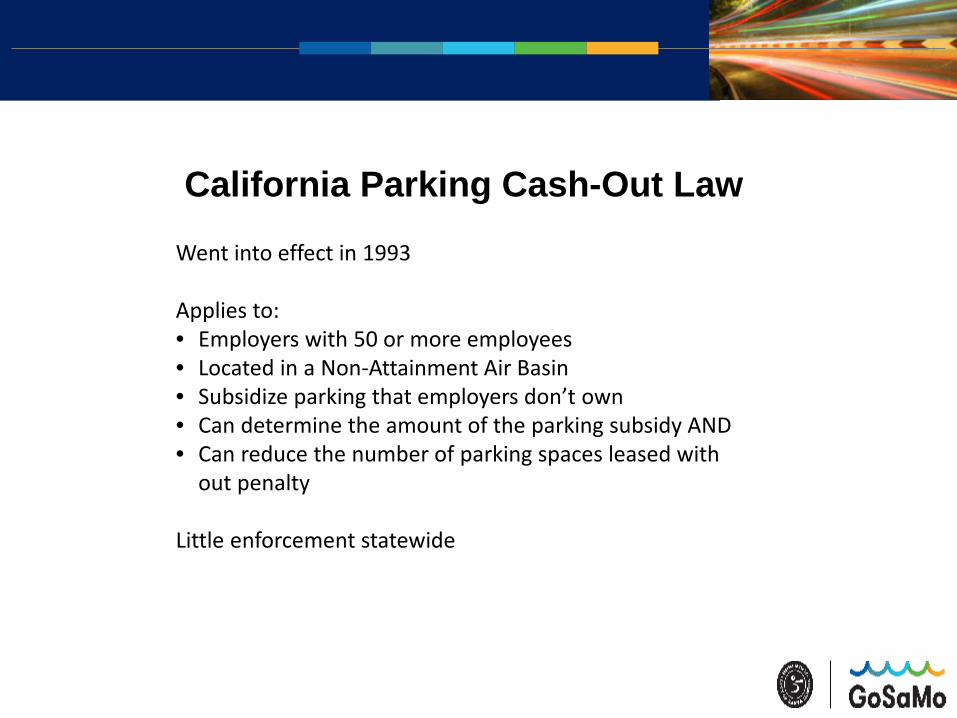
California Parking Cash-Out Law
Went into effect in 1993
Applies to:• Employers with 50 or more employees• Located in a Non-Attainment Air Basin• Subsidize parking that employers don’t own• Can determine the amount of the parking subsidy AND• Can reduce the number of parking spaces leased with
out penalty
Little enforcement statewide
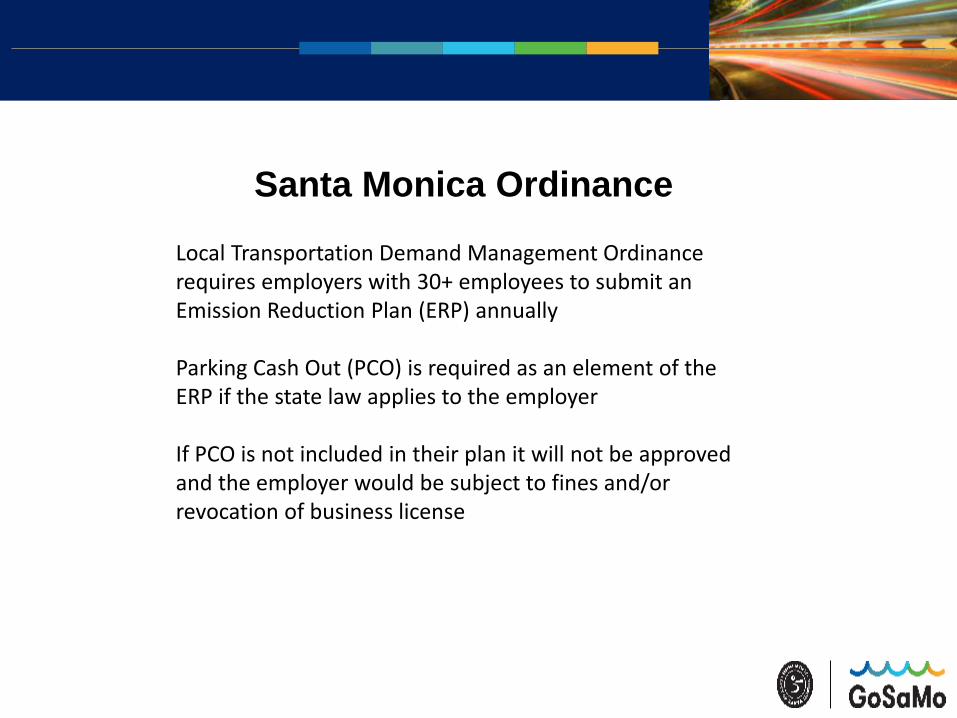
Santa Monica Ordinance
Local Transportation Demand Management Ordinance requires employers with 30+ employees to submit an Emission Reduction Plan (ERP) annually
Parking Cash Out (PCO) is required as an element of the ERP if the state law applies to the employer
If PCO is not included in their plan it will not be approved and the employer would be subject to fines and/or revocation of business license
Santa Monica Implementation
Help employers subject to law with implementation
Determine the value of cash-out (can be an average of parking expenses)
Provide a template agreement for employers to use with their employees (states that the employee will not drive alone to work more than a given number of days per month)
Set aside a few parking spaces for occasional use by PCO participants
Santa Monica Results
When it is offered it is the single most effective TDM measure for our employers
Limited applicability (as many employers have long-term leases with bundled parking)
Requiring parking to be unbundled in future developments so that there will be greater applicability
When we have the option we are requesting a daily cash-out
Colleen Stoll, City of Santa MonicaTransportation Demand Program [email protected] x 5318
Thank You!
• For more information about TREC, visit: – http://trec.pdx.edu
• Upcoming webinars http://trec.pdx.edu/events/webinars– November 9 – “What Do We Know About Location
Affordability in US Shrinking Cities?” presented by Joanna Ganning, Cleveland State University
– December 4 – “Case Studies in the FTA Manual on Pedestrian and Bicycle Connections to Transit” presented by Nathan McNeil, Portland State University