Embed Size (px)
Citation preview

Reporting year: 2017-18
Executive Summary
The purpose of the executive summary is to provide a strategic context to the overall RIIO-T1 performance expected by the network company at this point in the price control period. The summary must distil key messages of the drivers of performance against the relevant RIIO measures and present clear strategic insights on the expected performance over the full eight years of the price control and beyond.
The audience is Ofgem’s senior management team. The information will be scrutinised to evaluate the sustainability of current performance, consequences on future delivery and to assess value for money provided to customers over the price control.
The summary will contain the following information.
a. Summarised analysis of company totex performance across RIIO-T1 by the CEO (TO and SO activities to be separately identified). This will include the current company view of the eight-year RoRE value and customer bill impact.
b. Brief update on the delivery of the required targets/outputs1 across the following time-periods: (i) during the current reporting year (ii) forecast of future performance across the remaining RIIO-T1 period, and (iii) expected outturn at the end of RIIO-T1 period. Details of any assumptions relevant to the treatment of ‘close-out’ issues - for example, the expected ‘true-up’ of excluded services – must be provided.
c. A high-level explanation of what is driving the current forecast level of performance and materiality for each performance driver. More detail on the broad categorisation of drivers is set out in table 2.2. The summary will focus on major cost categories (eg. non-load related, load related and opex) where material differences exist between the level of allowance and costs incurred to date and the current company view of future forecast allowances and costs. The explanation will be set against the performance and forecasts provided in last year’s submission. It will also identify any new drivers or instances where the influence of drivers has materially changed (or is currently expected to change) from previous years.
d. Brief explanation of any material changes in the portfolio of investment relative to the original baseline plan (eg changes to underlying energy scenario and customer intelligence), the company response to the level of change and implications for delivery of performance.
e. Update on the strategy and priorities for the delivery of the rest of the price control (how will the strategy and objectives deliver performance targets), plus an overview of any significant
1 To support this explanation a tabulated summary of performance against targets in all six output categories (primary and secondary outputs) including a ‘Red Amber Green’ (RAG) rating where possible, and short description where not, can be provided in an annex to the commentary. Table five in the 2016-17 electricity transmission annual report can be used as a starting template.

risks to delivery with key mitigation actions (including key management and asset management initiatives).
Please note that supporting narrative is required for all tables unless otherwise stated. A blank template does not indicate an agreement that no commentary is to be provided – please refer to the “Regulatory Instructions and Guidance” document.
Section 1 – Table commentary
The purpose of this commentary is to provide the opportunity for licensees to set out further supporting information related to the data provided in the Financial Issues tables of the cost and volumes reporting Pack.
Changes to Amounts Reported in Prior Year(s) Explain each and any change(s) to amounts reported in prior year(s) columns. Identify each separately by table number and cell number.
1.4 Reconciliation to Regulatory Accounts
Commentary should specifically include explanation of the reasons for each reconciling item. The commentary should include:
- A description of the reconciling item
- A basic explanation of why the reconciling item has arisen
- An explanation of how the figure has been calculated
- Where IFRS has been adopted a statement of that fact listing the principle changes in the Accounts to opex and capex is required.
- Where costs are incurred by an affiliate and not recharged to the licensee, state name of affiliate, amount and reasons why not recharged and justification for allowing such costs as efficient and why they should be allowed in computing RAV additions.
- Where any pension costs (ongoing employer contributions, deficit funding payments, PPF levies or pension scheme administration costs are incurred by an affiliate and not recharged to the
licensee, state name of affiliate, amount and reasons why not recharged and justification for allowing such costs as efficient and why they should be allowed as distribution costs of the licensee.
Comments
1.5 Net Debt and Tax Clawback
Comments
Within the “Other amounts due to/ (from) group companies per Balance Sheet (memorandum)” there are any amounts that are more than one year old. If this is so, explain whether or not these amounts should be considered as part of net debt for the purpose of assessing whether the gearing ratio has been exceeded.
If there are any derivative financial instruments held by a related party that are not included in the value reported in the table, quantifying them and stating which debt(s) is being hedged.
Interest rate swaps:
Losses and gains:
Cross currency swaps:
Identify any new debt or debt refinanced, or new derivative financial instruments in the regulatory year.
New debt in the year:
Detail the covenants relating to the top five loans by value.

Commentary should specifically include explanation of the reasons for each item reported as a borrowing not in accordance with the defined net debt item. The commentary should include:
- A description of the item
- A basic explanation of why the item has arisen
- An explanation of how the figure has been calculated. This should be sufficient for Ofgem to confirm the calculation during the visits if required.
Where you disagree with or have comments on tax/gearing clawback computation explain those.
Comments
1.6 Disposals
Allocation methodologies
Additional commentary
Section 2 – Table commentary
2.1 Provisional Price Control Financial Model (PCFM) Inputs
Allocation methodologies
Additional commentary
2.2 Totex Forecast
Allocation methodologies
Summary views (guide word limit: 800 per summary section)a. Graphs illustrating the profile of actual expenditure to
date and the licensees’ current forecast of expenditure to be incurred for the remaining RIIO-T1 period for all SO (where applicable) and TO TOTEX2, compared with:
i. baseline TOTEX allowance3 ii. baseline TOTEX allowance including the impact of
the Annual Iteration Process (the latest published PCFM)4,
iii. revised allowances based on the company’s latest 8-year totex forecast (including uncertainty mechanisms).
b. Identification of the main reasons and drivers of actual/forecast spend and the material differences between allowances and spend between last year’s information and the latest information.
c. Confirmation of the outputs delivered and currently forecast to be delivered during the price control period, and how these levels vary from last year’s information.
d. Separately identify the proportion of expenditure incurred (actual and forecast) within the current submission that is associated with the delivery of outputs in RIIO-T2 with no associated allowance.
e. Separately identify the proportion of expenditure associated with the completion of schemes where costs incurred in the RIIO-T1 period were expected to be completed in the previous price control period when the baseline assumptions were made.
f. For NGET, there is an additional requirement to separately identify the proportion of expenditure (actual and forecast) and forecast allowance related to the delivery of outputs in “T1+2” timescales.5
2 For NGET, totex values relating to SO activities and TO activities must be detailed separately.3 This is the opening baseline totex allowance set at the start of the price control (1 April 2013) which were set on the basis of the portfolio of projects in the original business plan. The totex values will not include the impact of the February 2017 Mid-Period Review decision, the July 2017 parallel work decision or the impact of any voluntary deferral decision by the network company. 4 This will include the impact of the February 2017 Mid-Period Review decision, the July 2017 parallel work decision, the value of any agreed voluntary deferral and any within period determination by the Authority. 5 NGET’s Final Proposals document acknowledged that NGET TO may incur costs to deliver outputs beyond RIIO-T1 in advance of funding. The parameters of the applicable RIIO-T1 revenue drivers were developed to allow NGET TO

For a-f; highlight the level of spend and allowance and provide a strategic overview of what is driving the level of performance across two time periods:
(ii) current year reporting year (comparing the actual position to last year’s RRP forecast), and
(iii) the cumulative eight years of RIIO-T1 (comparing the latest forecast view to last year’s eight-year forecast).
A list of drivers that will inform the strategic performance explanation is set out below.
1. Efficiency: Associated with projects that deliver outputs exactly as per with the original ‘baseline’ assumptions at a different cost (or where there have been substitutions the delivery involves like-for-like replacements6). This will identify whether performance is the result of:
a. genuine improvements that reduce the costs (or are forecast to reduce cost) of delivery resulting from, for example, technology innovation or more efficient working practices or commercial improvements.
b. Where direct action by the company has led to a reduction in the scope of works to deliver the output and a reduction in costs (or a forecast reduction in cost). Further explanation will be required to establish why such scope reductions were unforeseeable at the time of setting the price control.
c. factors that increase the cost (or are forecast to increase cost) of delivery. The assumption is that the network company have driven costs as low as possible while still delivering agreed outputs.
2. External factors: Drivers for the variation of expenditure from allowances involve factors outside of the direct control of network companies (eg. weather or economic conditions).
This driver can be applied in the following situations: a. where the level of delivery differs in some regard as a result of a
changes in the wider economic context. For example, the variance against the original baseline assumptions may be due to project-specific requirements as mandated by planning or environmental authorities.
b. where the driver of performance can be explained by a
to trigger an allowance adjustment towards the end of RIIO-T1 period for outputs delivered in the first two years of RIIO-T2 (2021/22 and 2022/23). This is referred to as ‘T1+2’.6 For example, a 275kV overhead line project has been substituted with another 275kV overhead line with the same replacement priority and the overall volume of overhead replacement is largely unchanged compared with the original submission.

measurement change after the RIIO-T1 bid. For example, changes in accounting treatment and/or measurement.
3. Circumstantial factors: Associated with the delivery of outputs in line with the original ‘baseline’ assumptions but where the method of delivery differs in some regard.
This driver can be applied in the following situations: a. where the network company expects to deliver the output
anticipated by the baseline assumptions but with different physical content. For example, if the baseline assumptions had forecast installation of voltage support to resolve concerns over possible voltage variations but further analysis has since concluded that a reduced programme of works is required.
b. where a network company has significantly altered the solution but has resolved (or expects to resolve) the issue identified in the baseline assumptions. For example, where a network company is expecting to deliver the same units as per the baseline assumptions but through more works completed at fewer sites.
c. Where the driver of performance can be explained by cancellation of investments (or increase in investments a network company had to make) that do not have specified outputs.
4. Provision in the price control settlement: assumptions made within the RIIO-ET1 settlement that have varied against the actual position. For example, the actual unit cost currently delivering outputs in the RIIO-ET1 period is seen to be lower (or higher) than the unit cost adjustment for delivering an additional unit of the relevant output due to reductions (increases) in the size of the connection or changes in the phasing of projects7)
Please include details of any assumptions relevant to the treatment of ‘close out’ issues – for example, the expected ‘true-up’ of excluded services – and assumptions relevant to the reporting of allowances and costs where a within-period determination has not been reached by Ofgem.
Please provide all excel sheets that were used to create the above graphs and include confirmation of the source material of the data contained in each graph (the cell(s), column and row of the relevant tab of the Regulatory Reporting pack
7 For example, projects originally envisaged to incur expenditure in T2 and be delivered in T2 timescales being brought forward into T1 or projects originally envisaged to incur expenditure in T1 and be delivered in T1 timescales being deferred to T2.

used to populate the data).
NOTE: The explanation provided must refer to RRP Table 2.2 of the submitted pack. If a company is minded-to restate the allowances then all supporting analysis and narrative must be provided as a separate annex to the document.
Please populate the summary tables below in £m (current reporting year prices)8
A*: Current view of Allowance, £m
B: 2016-17 RRP forecast expenditure for reporting year 17-18, £m
C: 2017-18 RRP actual expenditure for reporting year 17-18, £m
D: Variance from forecast spend, £m (C-B)
E: Variance from current view of Allowance, £m(C-A)
F**: Baseline Allowance, £m
TOTEX (i + ii + iii + iv + v + vi + vii)2017-18
8 year
i. LR CAPEX BASELINE2017-18
8 year ii. LR CAPEX VOLUME DRIVER (excl SWW)2017-188 year iii. LR CAPEX, SWW projects (construction and pre construction)2017-188 year iv. ASSET REPLACEMENT CAPEX2017-18
8 yeariv. OTHER CAPEX2017-18
8 year vi. NON-OPERATIONAL CAPEX2017-18
8 year vii. CONTROLLABLE OPEX2017-18
8 year *NOTE: “2017-18”will reflect the outcome of the relevant AIP. “8 year” will reflect the company’s latest 8-year forecast.** NOTE: The opening value of the baseline allowance at the start of RIIO-T1 period (1 April 2013).
8 Values include Real Price Effects (RPEs) and exclude value of Related Party Margins Disallowed (RPMs).

Additional commentary
2.3a Forecast Allowances
Allocation methodologies
Summary views (guide word limit: 600 per summary section)1. Current year:
a. Confirmation of the volume driver allowances that have been entered and the uncertainty mechanisms and cost categories to which they relate. Where applicable, please identify the additional allowances that have been agreed by Ofgem (including links to all relevant Ofgem decisions/correspondence – can be provided on a confidential basis if required) and where the level of funding is not yet approved.
Please identify the value of any additional adjustments driven by other factors. For example, the impact of relevant MPR decisions and the cost categorisation applied.
b. Comparison of forecast allowance provided in the previous year against this year’s allowance and the reasons for any significant changes and variance.
2. Eight year view:a. Comparison of forecast 8-year allowance in previous year against this
year’s 8-year forecast allowances. b. Confirmation of the volume driver allowances that have been entered
and the uncertainty mechanisms and cost categories to which they relate. Where applicable, identify and explain the main drivers of variances for: load related capex base allowances; revised load related allowances; asset replacement capex base allowances; other capex base allowances; revised other capex allowances; non-operational capex; opex base allowance and revised opex allowances.
Please identify any additional adjustments driven by other factors. For example, the impact of any MPR decision, voluntary deferral, assumptions on the forecast value of the end of period excluded services “true-up” etc. and the cost categorisation applied.

Please provide all excel sheets that support all graphs and tables used in the supporting narrative and include confirmation of the source material of the data contained in each graph (the cell(s), column and row of the relevant tab of the Regulatory Reporting pack used to populate the data).
Additional commentary
2.3b Forecast Volumes
Allocation methodologies
Summary views (guide word limit: 600 per summary section)See commentary structure for table 6.10.
a.a.
Additional commentarySPT and SHE Transmission to populate the following generic template summarising the key facts about the “sole” and “shared use” local generation connections (entry) mechanism.
A. Baseline Output
(MW / MVa)
B. Revenue Driver
Forecast Output
(MW / MVa)*
Total Output (A+B)
2016-17RRP: 8-year Forecast
2017/18RRP: 8-year Forecast:
Contracted
Best View
*NOTE: Value may be positive or negative.

A. Baseline Output
(MW / MVa)
B. Revenue Driver
Forecast Output
(MW / MVa)*
Total Output (A+B)
2016/17RRP: 2017-18 Forecast
2017/18RRP: 2017-18 Actual
*NOTE: Value may be positive or negative.
2.4 Published Totex (including re-stated 2.4 allowances)
Allocation methodologies
Additional commentaryPlease refer to previous 2.2 section details.
Where a restated table 2.4 has been submitted the licensee must, in a separate annex. The supporting commentary will
detail the value and profile of all adjustments that have been made by the licensee,
identify the categories of cost that are involved, explain the rationale for the movement (including links to all relevant
Ofgem decisions/correspondence – can be provided on a confidential basis if required),
explain the extent to which the level of restatement has changed since the levels reported in the previous year and the reasons for any significant changes and variances, and
the impact of the restatement on the level of under or over-performance in the current year, the cumulative price control period to date and the eight-year view.
The Licensee will summarise the forecast spend and allowances against the seven main activity areas (TO LR capex, TO asset replacement capex, TO other capex, TO non-operational capex, TO opex, SO capex and SO opex) and the tables and graphs used in tables 2.2, 2.3a and 2.3b.
2.5 Published Outputs
Allocation methodologies
Additional commentary

2.6 Published Wider Works
Allocation methodologies
Summary views (guide word limit: 400 per summary section)For each wider works mechanism:Current year:
a. Wider works output delivered (to trigger additional allowances).b. Main drivers for over/under delivery and/or re-profiling of work. c. The reasons for year-on-year change.
a.a.a.
Additional commentary
2.7 Input Prices
Allocation methodologies (Methodology, assumptions and data sources used to complete the table. If the current methodology, assumptions and/or data sources are different than those used to provide the RPE’s forecast in the business plan, please explain those differences and the rationale for change)
Summary views (guide word limit: 250 per summary section)1. Current year:
a. What Real Price Effects (RPEs) have been realised this year? How do these figures compare to the business plan? How do these figures compare with allowances?
2. Cumulative to date:a. What RPEs have been realised to date? How do these figures compare to business plan? How do these compare with allowances?
3. Eight year view:a. What RPEs do you expect to realised over the price control? How do those figures compare to the business plan? How do these compare with allowances?
Additional commentary (if a third party consultant was used to complete table 2.7 then a consultant’s report should be included here or in the appendices).
3.1 Opex Summary and 3.2 Indirect summary

Allocation methodologies
Summary views (guide word limit: 300 per summary section)1. Current year:
a. Spend against allowance.b. Main drivers of over/under spend.
2. Year-on-year comparison of:a. Spend against allowance.b. Main drivers of over/under spend c. The reasons for year-on-year change.
a.
Additional commentary
3.3 Asset Management Opex
Allocation methodologies
Summary views (guide word limit: 200 per summary section)1. Current year:
a. Spend against allowance.b. Main drivers of over/under spend.
2. Year-on-year comparison of:a. Spend against allowance.b. Main drivers of over/under spend. c. To include the reasons for year-on-year change and where applicable reasons for changes in year on year unit costs and volumes.
a.
Additional commentary
3.4 Business Support – Group Costs
Allocation methodologies
Summary views (guide word limit: 200 per summary section)1. Current year:

a. Spend against allowance.b. Main drivers of over/under spend.
2. Year-on-year comparison of:a. Spend against allowance.b. Main drivers of over/under spend. c. The reasons for year-on-year change.
d.
Additional commentary
3.5 Business Support – Allocation [This table has been deleted]
3.6 Business Support – Supplementary Detail
Allocation methodologies
Additional commentary
3.7 Operational Training
Allocation methodologies
Summary views (guide word limit: 200 per summary section)1. Current year:
a. Spend against allowance.b. Main drivers of over/under spend.
2. Year-on-year comparison of:a. Spend against allowance.b. Main drivers of over/under spend. c. Are training costs changing proportionately to FTE numbers?d. To include the reasons for year-on-year change.
Additional commentary
3.8 Total Transmission Salary and FTE numbers
Allocation methodologies

Summary views (guide word limit: 200 per summary section)1. Year-on-year comparison of:
a. FTE numbers and whether this relates to any changes in the mix of different employee grades.
Additional commentary
3.9 Analysis of Excluded, Consented and De Minimis Services
Allocation methodologies
Summary views (guide word limit: 250 per summary section)1. Current year:
a. Describe the outputs delivered through works associated with de minimis spend.b. Provide information where excluded and consented services have had a notable impact on non-excluded areas.
Additional commentary
3.10 Provisions
Allocation methodologies
Additional commentary
3.11 Related Party Transactions
Allocation methodologies
Additional commentary
3.12 Innovation Rollout Mechanism (IRM) Expenditure
Allocation methodologies

Summary views (guide word limit: 400 per summary section)1. Current year:
a. Brief description and current status of successful IRM projects.b. Comparison of Allowed Expenditure for the relevant year to determine if it is different to the IRM value in the PCFM for the corresponding relevant year.
2. Comparison of total allowed expenditure and forecast total expenditure on project(s), explaining any over or under expenditure.
Additional commentary
3.13 Network Innovation Allowance (NIA) Expenditure
Allocation methodologies
Summary views (guide word limit: 250 per summary section)1. Please list the successfully completed and reported NIA projects.
Additional commentary
3.14 Network Innovation Competition (NIC) Expenditure
Allocation methodologies
Summary views (guide word limit: 600 per summary section)1. Current year:
a. Summary and status of successful NIC projects including a brief summary of whether conditions set by Ofgem have been metb. NIC funding allowance for each project – breaking down innovation funding and funding by licensee.c. NIC expenditure on each project (net and gross) explaining royalties/revenues. d. Reasons for over or under expenditure.
Additional commentary
3.15 Physical Security Opex
Allocation methodologies
Additional commentary
3.16 System Operator EMR Data Volumes
Allocation methodologies
Additional commentary
Load Related: 4.1 Capex Summary and 4.2 Expenditure on Load Related Schemes
Allocation methodologies
Summary views (guide word limit: 750 per summary section)1. Current year, by mechanism:
a. Comparisons across the portfolio between absolute output delivered and that expected from the business plan. Some individual explanation of the most significant schemes, to explain changes from the business plan, changes in scope of works, substitutions, or whether these schemes are no longer necessary, with reasons why and commentary on the economic impact of these delays/deferral decisions.
b. As above, for expenditure.c. For each mechanism, at the portfolio level (unless changes driven by
significant individual schemes, for which individual commentary is necessary) the main drivers of over/under delivery and over/under spend against business plans, and/or re-profiling of work. The narrative will explain the company view of what is driving this level of performance (ie multiple drivers) and the materiality for each performance driver (as detailed in table 2.2). Explain the impact of material variances in both economic and technical terms.
d. Commentary on how the portfolio composition has changed between best view, base view, new schemes etc.
2. Year-on-year comparison, by mechanism, of:a. Output and spend, both absolute and vs. allowance/targets.b. Main drivers of over/under performance. c. The reasons for year-on-year change. Explain the impact of material
variances in both economic and technical terms.d. Commentary on how the average portfolio basis has changed from the
previous reporting year and against the original business plan

expectations.
Please provide a summary table of the key numerical data presented in this section (in current reporting year prices).
a.
3. Eight year view, by mechanism:a. Output and spend, both absolute and vs. allowance/targets.b. Main drivers of over/under performance.c. Change in the forecast since last year’s report.d. Drivers of change in forecast since last year’s report. The explanation will
explain the company view of what is driving this level of performance (ie multiple drivers) and the materiality for each performance driver (as detailed in table 2.2);
e. Explanation of the impact of material variances in both economic and technical terms.
f. Commentary on how the portfolio composition (for each mechanism) has changed between best view, base view, new schemes etc.
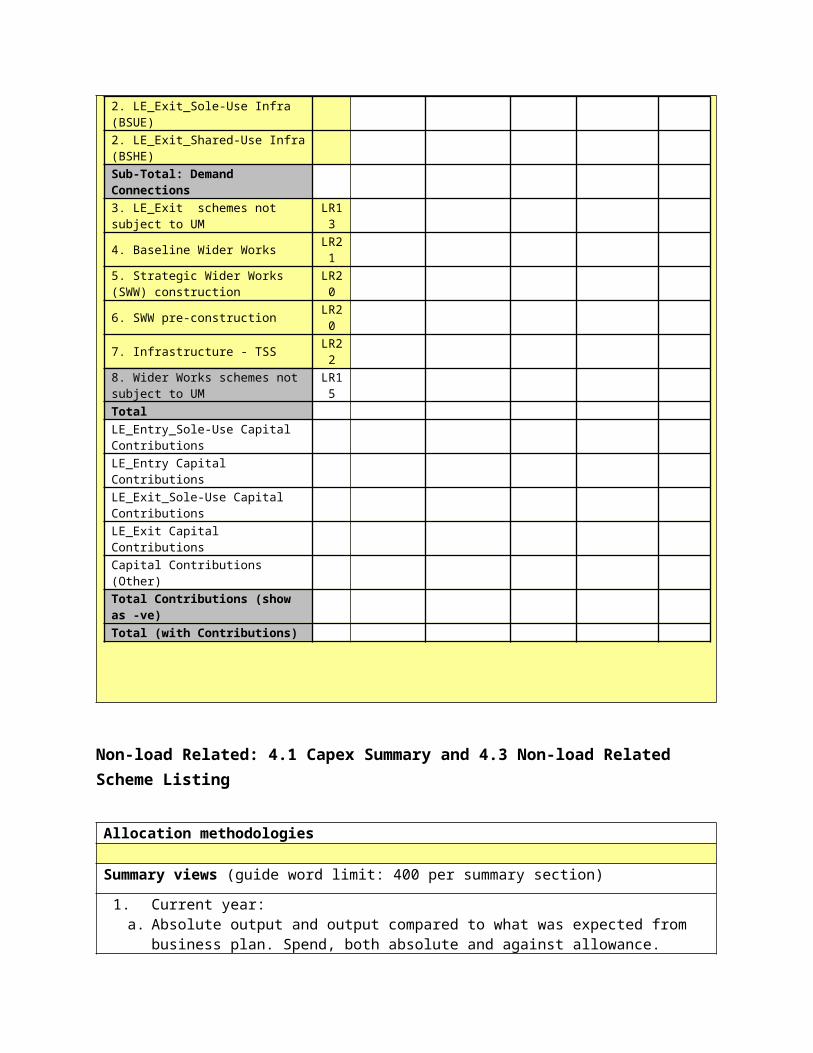
Additional commentarySHE Transmission to populate the table below to assist in the above narrative.
Table 1: SHE Tranmission
Mechanism (2017-18 prices) Baseline Allowance (1 April 2013)
T1 Allowance (current best view)
Spend (including de minimis and RPEs. Excluding RPMs), £m
Business Plan
RRP17-18: T1 forecast Change
1. LE_Entry_GenConns_Sole-Use (pre capital contribution)
LR1
LE Entry UM1 Sole-use Infra LR5LE Entry UM1 Sole-use Infra A-typical LR6LE Entry UM2 Shared-use Infra LR7LE Entry UM2 Shared-use Infra A-typical
LR8
1. LE Entry (schemes not subject to UM) LR3Sub-Total: Generation Connections2. LE_Entry_ExitConns_Sole-Use (pre capital contribution)
LR2
2. LE_Exit_Sole-Use Infra (BSUE)2. LE_Exit_Shared-Use Infra (BSHE)Sub-Total: Demand Connections

3. LE_Exit schemes not subject to UM LR134. Baseline Wider Works LR215. Strategic Wider Works (SWW) construction
LR20
6. SWW pre-construction LR207. Infrastructure - TSS LR228. Wider Works schemes not subject to UM
LR15
TotalLE_Entry_Sole-Use Capital ContributionsLE_Entry Capital ContributionsLE_Exit_Sole-Use Capital ContributionsLE_Exit Capital ContributionsCapital Contributions (Other)Total Contributions (show as -ve)Total (with Contributions)
Non-load Related: 4.1 Capex Summary and 4.3 Non-load Related Scheme Listing
Allocation methodologies
Summary views (guide word limit: 400 per summary section)1. Current year:
a. Absolute output and output compared to what was expected from business plan. Spend, both absolute and against allowance.
b. Main drivers of over/under delivery, over/under spend and/or re-profiling of work.
The narrative will explain the company view of what is driving the current level of performance (ie multiple drivers) and the materiality for each performance driver (as detailed in table 2.2).
2. Year-on-year comparison of:a. Output and spend both absolute and compared to what was expected in
business plan. b. The main drivers of over/under performance, over/under spend and re-
profiling of work.c. The reasons for year-on-year change.
a.
3. Eight year view:

a. Absolute output and output compared to what was expected from business plan. Spend, both absolute and against allowance.
b. Main drivers of over/under delivery, over/under spend and/or re-profiling of work. The narrative will explain the company view of what is driving the current forecast level of performance (ie multiple drivers) and the materiality for each performance driver (as detailed in table 2.2).
c. The change in the eight year view since last year’s report. d. Drivers of change in the eight year view since last year’s report.
Additional commentary
4.3.1 NLR Volume Change
Allocation methodologies
Summary views (guide word limit: 400 per summary section)Explanation of the volume changes in an 8 year and Year on Year context across the lead plant types. Please refer to what is driving the current changes in volumes and the extent of the variation.
Additional commentary
4.3.2 T2 Output Cost Deferral
Allocation methodologies
Additional commentary
4.3.3 Tower Steelwork
Allocation methodologies
Additional commentary
4.4 Uncertain Costs
Allocation methodologies
Additional commentary

4.5 Non Operational Capex
Summary views (guide word limit: 400 per summary section)1. Current year:
a) Absolute output and output compared to what was expected from business plan. Spend, both absolute and against allowance.
b) Main drivers of over/under delivery, over/under spend and/or re-profiling of work.
The narrative will explain the company view of what is driving the current level of performance (ie multiple drivers) and the materiality for each performance driver (as detailed in table 2.2).
2. Year-on-year comparison of:a) Output and spend both absolute and compared to what was expected in
business plan. b) The main drivers of over/under performance, over/under spend and re-
profiling of work.The reasons for year-on-year change.
3. Eight year view:a) Absolute output and output compared to what was expected from business
plan. Spend, both absolute and against allowance.b) Main drivers of over/under delivery, over/under spend and/or re-profiling of
work. The narrative will explain the company view of what is driving the current forecast level of performance (ie multiple drivers) and the materiality for each performance driver (as detailed in table 2.2).
c) The change in the eight year view since last year’s report. d) Drivers of change in the eight year view since last year’s report.
4.6 System Operator (SO) Capex
Allocation methodologies
Additional commentary
4.7 Transmission Investment Renewable Generation (TIRG)
Allocation methodologies
Additional commentary

4.8 Physical Security Capex (CNI only)
Allocation methodologies
Summary views (guide word limit: 250 per summary section)1. Current year:
a. Absolute output and output compared to what was expected from business plan. Spend, both absolute and against allowance.
b. Main drivers of over/under delivery, over/under spend and/or re-profiling of work.
2. Eight year view:a. Absolute output and output compared to what was expected from business plan. Spend, both absolute and against allowance.b. Main drivers of over/under delivery, over/under spend and/or re-profiling of work.c. The change in the eight year view since last year’s report. d. Drivers of change in the eight year view since last year’s report.
Additional commentary
5.1 System Characteristics and Activity Indicators
Allocation methodologies
Summary views (guide word limit: 150 per summary section)1. Year-on-year comparison (where something notable) of:
a. Asset inventory.b. Activity levels.c. The reasons for year-on-year change.
Additional commentary
5.2 Fault and Failure Reporting
Allocation methodologies
Summary views (guide word limit: 500 per summary section)1. Current year:

a. Summary of any significant fault which led to significant disruption, loss of supply or customer disconnection greater than 3 minutes on both lead assets and non-lead assets and the system loss incurred as well as the duration.b. Summary of any significant condition related faults affecting a family or a number of lead or non-lead asset category that have occurred, a description of the fault and its cause and actions that will be taken e.g. maintenance, replacement etc.
Additional commentary
5.3 Boundary Transfer Requirements and 5.4 Boundary Transfers and Capability Development
Allocation methodologies
Additional commentary
5.5 Demand and Supply at Substations
Allocation methodologies
Summary views (guide word limit: 150 per summary section)1. Current year:
Highlight any significant changes to >1500MW demand groups.
Additional commentary
5.6 Lead Assets Additions and Disposals
Allocation methodologies
Summary views (guide word limit: 150 per summary section)1. Current year:
Were there any data revisions during the year? What were the reasons behind these?
Additional commentary
5.7 Non-lead Assets Additions and Disposals
Allocation methodologies
Additional commentary
5.8 Lead Asset – Unit Cost Actuals
Allocation methodologies
Summary views (guide word limit: 800 per summary section)1. Current year:
a. Summarise the projects delivered and explain any significant changes in scope of works from the business plans (i.e. where single assets valued over £100k) compared to what was expected from the business plan.
b. Main drivers for over/under spend , and timing of delivery against the business plan by:
i. Scope – explain why the scope of works changed.ii. Cost driver – explain what drivers led to cost changes (using the new
unit cost table – e.g. consenting, environmental conditions).iii. Cost type – explain where the drivers impacted costs (e.g. project
management, construction).
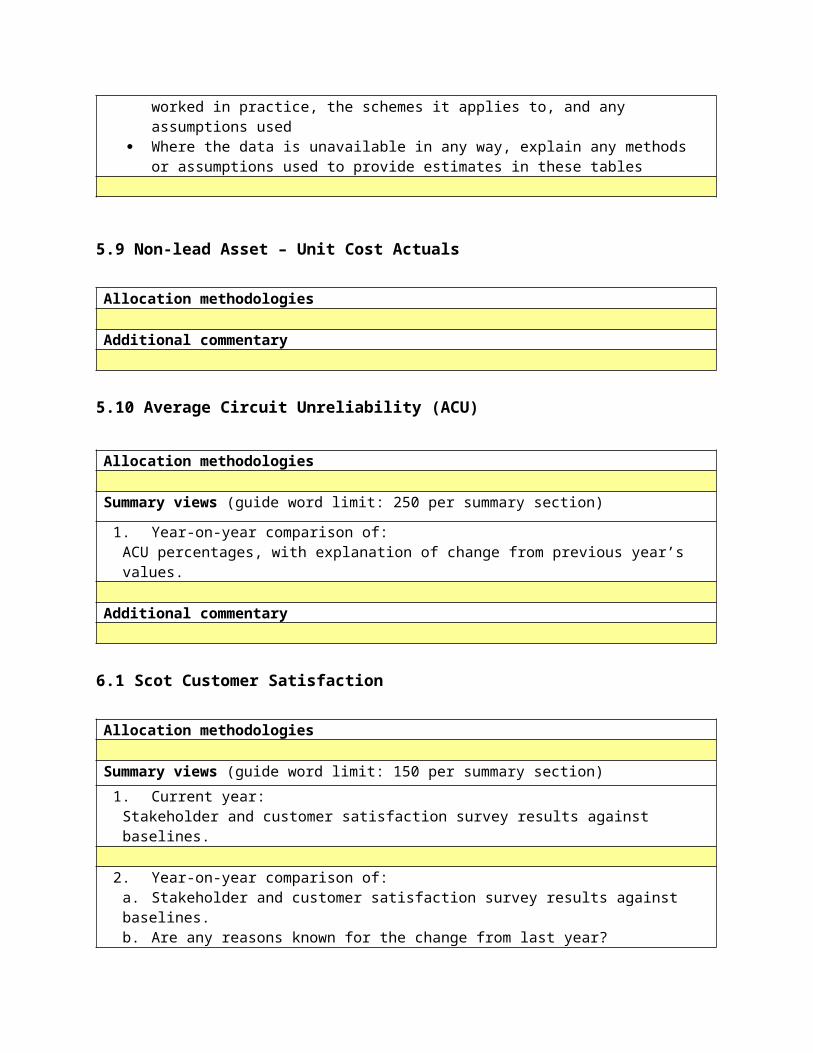
Additional commentary Where the data is held already on the system, explain any assumptions
made Where the data must be manually collected, explain how this has worked in
practice, the schemes it applies to, and any assumptions used Where the data is unavailable in any way, explain any methods or
assumptions used to provide estimates in these tables
5.9 Non-lead Asset – Unit Cost Actuals
Allocation methodologies
Additional commentary
5.10 Average Circuit Unreliability (ACU)

Allocation methodologies
Summary views (guide word limit: 250 per summary section)1. Year-on-year comparison of:
ACU percentages, with explanation of change from previous year’s values.
Additional commentary
6.1 Scot Customer Satisfaction
Allocation methodologies
Summary views (guide word limit: 150 per summary section)1. Current year:
Stakeholder and customer satisfaction survey results against baselines.
2. Year-on-year comparison of:a. Stakeholder and customer satisfaction survey results against baselines.b. Are any reasons known for the change from last year?
Additional commentary
6.2 Business Carbon Footprint (BCF)
Allocation methodologies
Summary views (guide word limit: 200 per summary section)1. Current year:
a. Emissions levels and how this compares to the RIIO T1 business plan. b. Main drivers of any notable differences between actual emissions and RIIO T1 business plan projections.
2. Year-on-year comparison of:a. Emissions levels and how this compares to RIIO T1 business plan (both absolute and within category). b. The main drivers of any notable differences between actual emissions and RIIO T1 business plan projection.
Additional commentary
6.3 Reliability

Allocation methodologies
Summary views (guide word limit: 250 per summary section)1. Current year:
a. Performance compared to target.b. Drivers behind difference between actual performance and target.c. Summary of exceptional event applications to the authority, decision and
impact on reliability incentive adjustment.
2. Year-on-year comparison of:a. Performance.b. Drivers behind difference between actual performance and target.
Additional commentary
6.4 SHE Transmission and SPTL Timely Connections
Allocation methodologies
Summary views (guide word limit: 250 per summary section)
Year-on-year comparison of the number of new ‘in area’ connection offers made in the reporting year.
Confirmation of the volume of offers issued within the timescales set out in the Transmission Licence and volume (and reasons) of offers not issued within licence timescales.
Additional commentarySPT and SHE Transmission to provide confirmation of the volume of new offers (or modifications to existing contracts) in its role as TO, the volume that were provided within the timescales set out in the Transmission Licence and the proportion of these offers that met the customer requested date.
6.5 SF6 Emissions
Allocation methodologies
Summary views (guide word limit: 200 per summary section)1. Current year:
a. Emissions levels and how this compares to business plan. b. Main drivers of any notable differences between actual emissions and

business plan projections. c. Summary of exceptional event applications to the authority, decision and impact on reliability incentive adjustment.
2. Year-on-year comparison of:a. Emissions levels and how this compares to business plan. b. The main drivers of any notable differences between actual emissions and business plan projections.
Additional commentary
6.6 Designated Area Visual Amenity Outputs for Existing Transmission Infrastructure
Allocation methodologies
Summary views (guide word limit: 300 per summary section)1. Current year:
a. Output and spend, both absolute and against approved VA output and allowance.b. Main drivers for over/under spend and delivery.
2. Cumulative to date:a. Output and spend, both absolute and against approved VA output and allowance.b. Main drivers for over/under spend and delivery.
Additional commentary
6.7 Baseline Wider Works Outputs and Strategic Wider Works Outputs
Allocation methodologies
Summary views (guide word limit: 250 per summary section)
1. Year-on-year comparison of the drivers behind difference between actual performance and the fixed allowance.
2. Main drivers for over/under delivery. The narrative will explain the company view of what is driving this level of performance (ie multiple drivers) and the materiality for each performance driver (as detailed in table 2.2).

Additional commentary All licensees to populate summary tables 1 and 2 below (additional rows can be added as required). The narrative column will include details of the expenditure during the RIIO-T1 period, the reasons for the extent that the expenditure exceeds or fall below the agreed allowance and details of any remedial action taking to mitigate risks. All financial values will be reported in the current reporting year price base (and exlcude related party margins disallowed).
Table 1: Baseline Wider WorksAll
Agreed projects
Allowance in RIIO T1 (£m)
Expenditure within RIIO T1 (£m)
Output delivered Narrative
Table 2: Strategic Wider Works
Please note that the details provided in the supporting commentary for T6.7 will align with the performance insights (including changes in outputs) described in T2.2 and T4.1 above (and, ultimately, the executive summary). The narrative in this section should only seek to provide relevant additional information not previously covered as part of the above narrative. For example, providing a more granular explanation on specific scheme/projects to support the key messages of what the network company sees as important indicators of performance across the relevant time period.
6.8 SWW Pre-construction Deliverables
Allocation methodologies
Summary views (guide word limit: 250 per summary section)
1. Current year:a. Output and spend, both absolute and against approved output and allowance.b. Main drivers for over/under spend and delivery.
Construction only
Agreed projects
Allowance in RIIO T1 (£m)
Pre RIIO expenditure (£m)
Expenditure within RIIO-T1 (£m)
Post RIIO-T1 expenditure (£m)
Output delivered Narrative

2. Year-on-year comparison of the material spending and/or further development work undertaken.
Additional commentary
6.9 SHE Transmission Local Generation Volume Driver
Allocation methodologies
Summary views (guide word limit: 1000 per summary section)For each mechanism:1. Current year:
a. Outputs and spend compared to what was expected from the business plan or licence requirement (whichever is more relevant). Provide comparisons at the (i) aggregated level, but must also distinguish at a sub-aggregated level between (ii) schemes in the business plan that continue to be delivered, (iii) those which were not in the business plan and are new, and (iv) those preceding RIIO that also were not in the business plan. Information should summarise the outputs (e.g. total MW) for business plan schemes: as planned, displaced by new schemes, delayed, or no longer needed.
b. Main drivers for over/under delivery and/or re-profiling of work against the business plans. The narrative will explain the company view of what is driving this level of performance (ie multiple drivers) and the materiality for each performance driver (as detailed in table 2.2).
For each mechanism:2. Year-on-year comparison9
a. Outputs and spend compared to what was expected from last year’s forecast. Comparisons at the (i) aggregated level, but also between (ii) schemes in the business plan that continue to be delivered, (iii) those which were not in the business plan and are new, and (iv) those preceding RIIO that also were not in the business plan. Information should summarise the outputs (e.g. total MW) for business plan schemes: as planned, displaced by new schemes, delayed, or no longer needed.
b. The main drivers of over/under delivery and/or re-profiling of work against the business plans. The narrative will explain the company view of what is driving this level of performance (ie multiple drivers) and the materiality for each performance driver (as detailed in table 2.2).
c. The reasons for year-on-year change
a.
9 Except in the case of terminations in tables 6.13 and 6.14 (ie terms TPG, TPRG, TPD and TPRD)

Additional commentary
Please note that the details provided in the supporting commentary for T6.9 will align with the performance insights (including changes in outputs) described in T2.2 and T4.1 above (and, ultimately, the executive summary). The narrative in this section should only seek to provide relevant additional information not previously covered as part of the above narrative. For example, providing a more granular explanation on specific scheme/projects to support the key messages of what the network company sees as important indicators of performance across the relevant time period.
NOMs: 6.15.1 NOMs Detail and 6.15.2 NOMs RP
Allocation methodologies
Summary views (guide word limit: 600 per summary section)1. Current year:
a. Output against what was expected in business plan.b. Main drivers of any over/under delivery or re-profiling of work.
2. Year-on-year comparison of:a. Output against what was expected in business plan.b. Main drivers of any over/under delivery or re-profiling of work.c. The reasons for year-on-year change.
d.
3. Eight year view:a. Output against targets.b. Main drivers of any over/under delivery.c. Change in the eight year view since last year’s report.d. Drivers of change in eight year view since last year’s report.
Additional commentary
6.16.1 Criticality Substations
Allocation methodologies
Additional commentary
6.16.2 Criticality Circuits
Allocation methodologies
Additional commentary
6.16.3 Criticality SP
Allocation methodologies
Additional commentary
6.17 Flood Mitigation
Allocation methodologies
Additional commentary