Embed Size (px)
Citation preview
Passwords, Heroin and Timelines: Forensics and Graph Theory
A Teaching Module for a Liberal Arts Math Class
By:
Lila Ghemri, Texas Southern University, [email protected];
Carol Gibbons, Salve Regina University, [email protected];
Carol Overdeep, Saint Martin’s University, [email protected]
Note to teachers: Teacher notes appear in dark red in the module, allowing faculty to pull these notes off the teacher version to create a student version of the module.
Synopsis of the Module:
Thanks to the popularity and longevity of such television shows as “CSI” and “NCIS”, forensics and/or forensic science are common household words. The television shows tend to focus on solving crimes involving dead and/or missing victims and as a result, forensics tends to be equated with chemical and biological lab work in the popular culture. Forensics runs a much larger gamut of disciplines, e.g., accounting and digital security to name but two areas, and one of the purposes of this module is to alert students to the depth and breadth of the area. From a very simplified perspective, forensics consists of two steps: gathering facts and drawing conclusions.
It’s imperative that these two things be viewed as disjoint activities. For the latter, graph theory can be used to help find patterns in the facts which lead to conclusions. The remaining two goals of this module are to provide students with the basics of graph theory and the ability to apply it to a variety of situations.
Target Audience: The primary target audience includes undergraduates in a “Math for Liberal Arts” course. By increasing the complexity of subsequent examples, students in an undergraduate Discrete Mathematics course could also be targeted. Other appropriate audiences include introductory Computer Science students and introductory Criminal Justice students.
Prerequisites: None.
Topics: The topics in this module include the introduction of forensics and basic graph theory definitions, the various types of graphs, the construction of graphs, and forensic applications.
Goals: Our goals are to introduce students to a new structure for representing connections and interactions between entities as well as enhanced critical thinking skills.
Anticipated number of classes: 4 (50 minutes each)
Learning Outcomes: Students will understand various types of graphs and the salient differences between them, e.g., the difference between a simple graph and a directed graph; students will be able to use graphs to model various situations; and students will (hopefully!) appreciate the connection between math and the “real world” application of forensics.
2
Notes to the Teacher
Welcome to this module that uses graph theory to explore the broad area of forensics while concurrently developing new critical thinking skills. The material involves several in-class examples to motivate both discussion and understanding of the underlying principles.
This module will take between 3-5 days depending on the amount of time the instructor chooses to spend on the various topics.
Lesson 1 consists of an overview of forensics. The important point to stress during this lesson is the difference between facts and conclusions/judgments. The opening exercise provides an opportunity for students to make this distinction, but it bears repeating.
Lesson 2 covers the some of the basic definitions of graph theory and how to construct graphs. This is neither a thorough nor rigorous treatment of these topics. The goal is to motivate the students’ intuition for graph theory and how it can be applied.
Lesson 3 covers several applications of graph theory, including analyzing an ecosystem, determining influence within a group, determining where/how heroin was cut, password verification, and the “traveling salesman” problem.
Lesson 4 introduces precedence graphs and their application to forensics.
3
Lesson 1:
Forensics Overview
Broadly speaking, forensic science is the analysis of traces of evidence (such as body fluids, glass fragments, footprints, drugs, etc.) left at the scene of a crime by the criminal, victim, or others. The evidence may be used subsequently to either implicate or exonerate a person suspected of committing that crime, or just to gain further insight into the incident. [1]
Observation is a critical skill in forensics. The investigator must determine what evidence to collect and how to collect it.
Activity: Have students pair up and examine each other’s clothing, shoes, etc. Ask them to take notes about what they observe, such as are the shoes comfortable? Do the clothes have won spots? Is there any dirt on the shoes? This activity should take 3-5 minutes of observation followed by discussion. After one or two students have shared their observations, ask the class to distinguish between facts that were observed and conclusions that were drawn.
Broad Overview
As noted above, forensic science is the analysis of traces of evidence (such as body fluids, glass fragments, footprints, drugs, etc.) left at the scene of a crime by the criminal, victim, or others. The evidence may be used subsequently to either implicate or exonerate a person suspected of committing that crime, or just to gain further insight into the incident. [1]
But forensic science involves more than just identifying traces of evidence – sometimes it isn’t obvious just what a piece of evidence really is. Other important questions that need to be answered are:
- How did the evidence come to be at the crime scene?- From where did the evidence originally come?- Who left it there?
This suggests a natural role for statistics and mathematics, as these questions can only be answered in terms of probabilities. So it is not surprising that the primary task of forensic statisticians and/or mathematicians is to evaluate any evidence found at a crime scene, so that his evidence can be appropriately presented to a jury in court.
The word “forensics” is derived from the Latin forēnsis, meaning “of or before the forum.” [2]
4
Romans charged with a crime meant presenting the case before a group of public individuals in the forum. Each side gave speeches presenting their side of the case.
The best argument/delivery determined the outcome of the case. Modern usage is based on: 1) a form of legal evidence, and 2) a category of public presentation.
Brief History
- Ancient world: no standardized forensic practices, relied on forced confessions and witness testimony.
- Early Recorded Cases: o Archimedes (287-212 BCE) developed a method for determining the volume of an
object with an irregular shape. Used law of displacement to determine whether some silver had been substituted for gold by dishonest goldsmith in the making of King Hiero II’s crown.
o First application of Medicine & Entomology to solve a crime attributed to book of Xi Yuan Lu (Washing Away of Wrongs) in 1248 (Song Dynasty). In account by Song Ci (1186-1249), murder of a person by a sickle was solved by investigator instructing everyone to bring their sickles to central location. Investigator determined it was a sickle by testing different blades. Flies eventually gathered on a single sickle, resulting in confession by murderer. The book also offers other advice on methodologies, such as drowning (water in lungs) versus strangulation (broken cartilage).
- 16th Century: o Ambroise Paré, French army surgeon, systematically studied effects of violent death
on internal organs. o Italian surgeons, Fortunato Fidelis & Paolo Zacchia, studied changes in occurred in
body structure as the result of disease (foundations of modern pathology).- 18th Century:
o Writings begin to appear on medical forensic topics. o Criminal investigation becomes more evidence-based, use of torture is curtailed
and belief in witchcraft loses influence in court decisions and is gradually replaced with rational procedure.
o Lancaster, England (1784) John Toms was tried and convicted of murdering Edward Culshaw with a pistol. A wad of paper pulled from Culshaw’s body is examined and matches perfectly with a torn newspaper in Tom’s pocket.
o Methods for detecting arsenic, etc. are developed by examining walls of victim’s stomach.
- 19th Century:o Poison detection methods continue to improve.o Ballistics is seen in cases for the first time using bullet comparisons by examining
flaws in bullets (Henry Goddard, Scotland Yard).
5
o Alphonse Bertillon created identification system based on physical measurements (forensic anthropology).
o Fingerprint collection, analysis, and identification is applied for the first time.
Despite what is seen on “CSI” and other such television shows, there’s a surprisingly wide variety of fields that play a role in forensics:
- Biology:o Entomology: Time of Death, detection of drugs/poison, DNAo Botany: leaves, seeds, pollen found on body/sceneo Zoology: analysis of animal and human remainso Anthropology: identification/recovery of remains
- Psychology: understanding legal principles/eye witness- Chemistry: identifying unknown substances, origins- Economics: calculating pecuniary damages, discrimination- Accounting: financial statement analysis- Statistics: techniques applied to evidence (DNA , etc.) - Computer Science: recovering digital data, cybersecurity- Physics: ballistics, tool marks, accident reconstruction- Criminal Justice: instructing police in forensic methods- Sociology: human behavior, history of area, negligence- Medicine: autopsy, cause of death/illness, whether torture was involved- Mathematics:
o Descriptive Statistics: Stride vs. gendero Linear Regression: Bone length vs. body heighto Geometry and Trigonometry: Blood spatter length vs. angleo Algebra: Fly larva cycle vs. time of deatho Genetic Probabilities: Blood typingo Newton’s Law of Cooling: Body temperature vs. time of deatho Algebraic formulas and graphs: Blood alcohol level over timeo Angles and measurement: Crime scene sketcho Data collection: Lyingo Algorithms and graph theory: Fingerprint analysis
Let’s consider the time of death calculation. Forensic science presents several methods for estimating the time of death for when a person died. Different methods are used depending on how long it has been since death occurred. Generally, the longer it has been since the death occurred, the less accurate the estimation given by forensic pathologists. Some of the factors considered (depending on when the body is found compared to when death occurred) include body temperature (Newton’s Law of Cooling);
6
presence/absence of rigor mortis (valid for 0-36 hours after death); film over the eyes; skin color; blood pooling; contents of the digestive system; and entomology.
Newton’s Law of Cooling is a first-order, linear differential equation. The equation, givens, and steps to solving the linear differential equation are contained in Table 1.
Givens and Equations Solving the Linear Differential Equation
Solution
dudt
=k (u (t )−T R)dudt
=k (u (t )−T R)
k is a constant du(u (t )−T R)
=k dt
u(t) is the body temperature at time t ∫ du
(u ( t )−T R)=¿∫k dt ¿ u(t )=T R+Ae
kt
T R is the room temperature ln(u (t )−T R) = kt+Cu(0) is the body temperature when the body is discovered
(u ( t )−T R )=ekt+C
u(t 0) is the body temperature at t 0
u(t )=T R+eC ekt
Table 1. Newton’s Law of Cooling for a Dead Body.
Table 2 shows the timeline for rigor mortis:
Body Temperature Body Stiffness Time Since DeathWarm Not stiff Dead not more than 3 hours
Less warm Stiff Dead 3 to 8 hoursColder Stiff Dead 8 to 36 hoursCold Not stiff Dead more than 36 hours
Table 2. Rigor Mortis Timeline.
The eyes of a victim can also hold answers to the time of death. A thin cloudy film develops over the eye within 3 hours after death has occurred. The eyeballs become softer as a result of less fluid pressure behind the eye and the degree to which this has occurred can be used as a measure of the time since death. This is a less common procedure for deaths that evidently occurred out of the limit of several days.
The general formula for pressure, measured in Newton/m2 (a Pascal), is given by Pressure = Force/Area
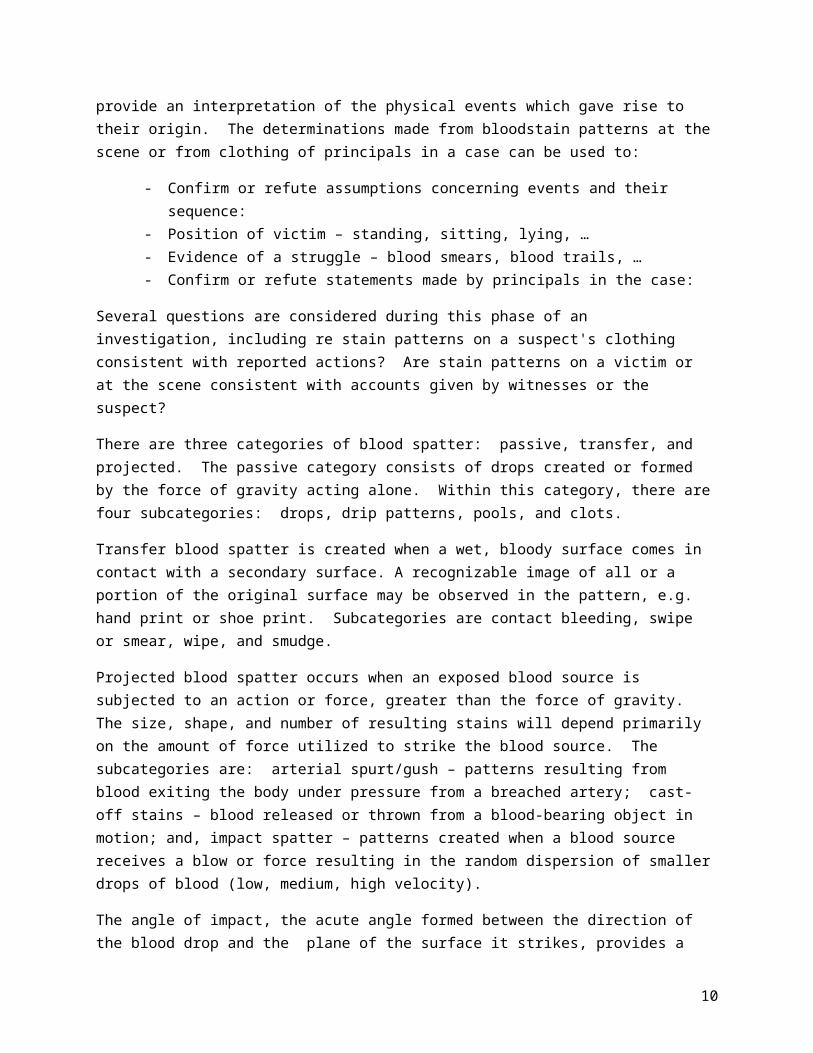
Bloodstain pattern analysis is the examination of the shapes, locations, and distribution patterns of bloodstains, in order to provide an interpretation of the physical events which gave rise to their origin. The determinations made from bloodstain patterns at the scene or from clothing of principals in a case can be used to:
- Confirm or refute assumptions concerning events and their sequence:
7
- Position of victim – standing, sitting, lying, …- Evidence of a struggle – blood smears, blood trails, …- Confirm or refute statements made by principals in the case:
Several questions are considered during this phase of an investigation, including re stain patterns on a suspect's clothing consistent with reported actions? Are stain patterns on a victim or at the scene consistent with accounts given by witnesses or the suspect?
There are three categories of blood spatter: passive, transfer, and projected. The passive category consists of drops created or formed by the force of gravity acting alone. Within this category, there are four subcategories: drops, drip patterns, pools, and clots.
Transfer blood spatter is created when a wet, bloody surface comes in contact with a secondary surface. A recognizable image of all or a portion of the original surface may be observed in the pattern, e.g. hand print or shoe print. Subcategories are contact bleeding, swipe or smear, wipe, and smudge.
Projected blood spatter occurs when an exposed blood source is subjected to an action or force, greater than the force of gravity. The size, shape, and number of resulting stains will depend primarily on the amount of force utilized to strike the blood source. The subcategories are: arterial spurt/gush – patterns resulting from blood exiting the body under pressure from a breached artery; cast-off stains – blood released or thrown from a blood-bearing object in motion; and, impact spatter – patterns created when a blood source receives a blow or force resulting in the random dispersion of smaller drops of blood (low, medium, high velocity).
The angle of impact, the acute angle formed between the direction of the blood drop and the plane of the surface it strikes, provides a great deal of insight. Figures 1 and 2 come from http://www.bloodspatter.com/bloodstain-tutorial-page-2.
Figure 1. Blood
8
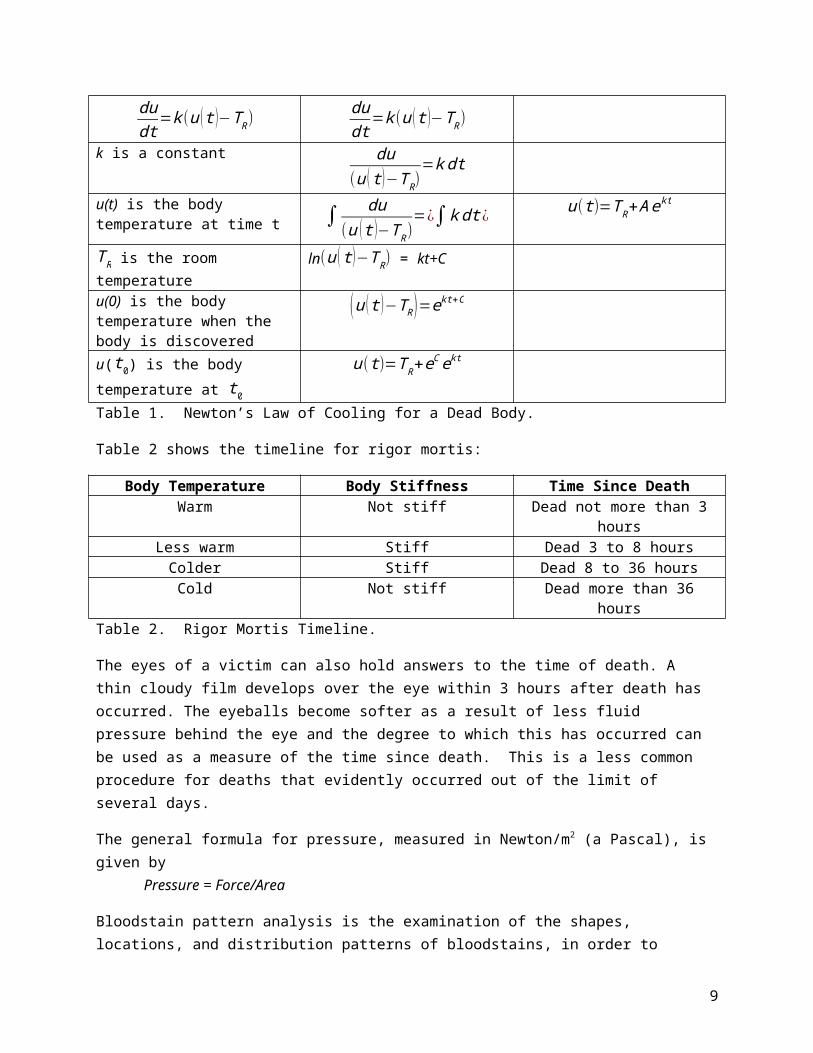
Figure 2. Calculating the impact angle of bloodspatter.
From http://wardsci.com/images/pdf/color_blood_spatter_images.pdf, examples of various impact angles:
Figure 3. Bloodspatter patterns as a function of impact angle.Picture citations or redraw –make sure pictures are clear. Add brief homework set 1
9
sin−1 (opposite ( width )hypotenuse ( length ) )=sin−1 (|b−c||a−b|)
Homework for Lesson 1
1. Make measurements from the bloodspatter patterns in Figure 3 and verify that the listed angle is the correct angle.2. Table 1 showed the derivation for the time of death calculation using Newton’s Law of Cooling. Use the internet to find possible value(s) of the parameters in the equation, A and k.2. Suppose someone is murdered in a room where the thermostat is set to 98.6˚F. Describe the impact, if any, to the time of death calculation.
Lesson 2:
Graph Theory Basics
Graph theory has its roots in the eastern European city of Konigsberg. The city has four land masses and seven bridges as depicted in Figure 4 from http://photonics.cusat.edu/Article4.html.
Figure 4. The City of Konigsberg.
Residents wondered if it was possible to walk around the town crossing each bridge exactly once. This is a good exercise for students to try—it stimulates observation and conversation about some of the basics of graph theory. In 1736, Leonhard Euler wrote a paper on this problem; this paper is considered the seminal paper on graph theory and showed that a route is not possible.
A seemingly unrelated problem is the map coloring question: how many different colors are needed so that no two adjacent regions have the same color? This question can be posed to the class as two specific questions: first, how many colors are required for the United States; and second, how many for a map of the world. The US map comes from http://motls.blogspot.com/2013/05/short-questions-often-require-long.html and the map of the world comes from http://www.mapsnworld.com/world-map.html.
10
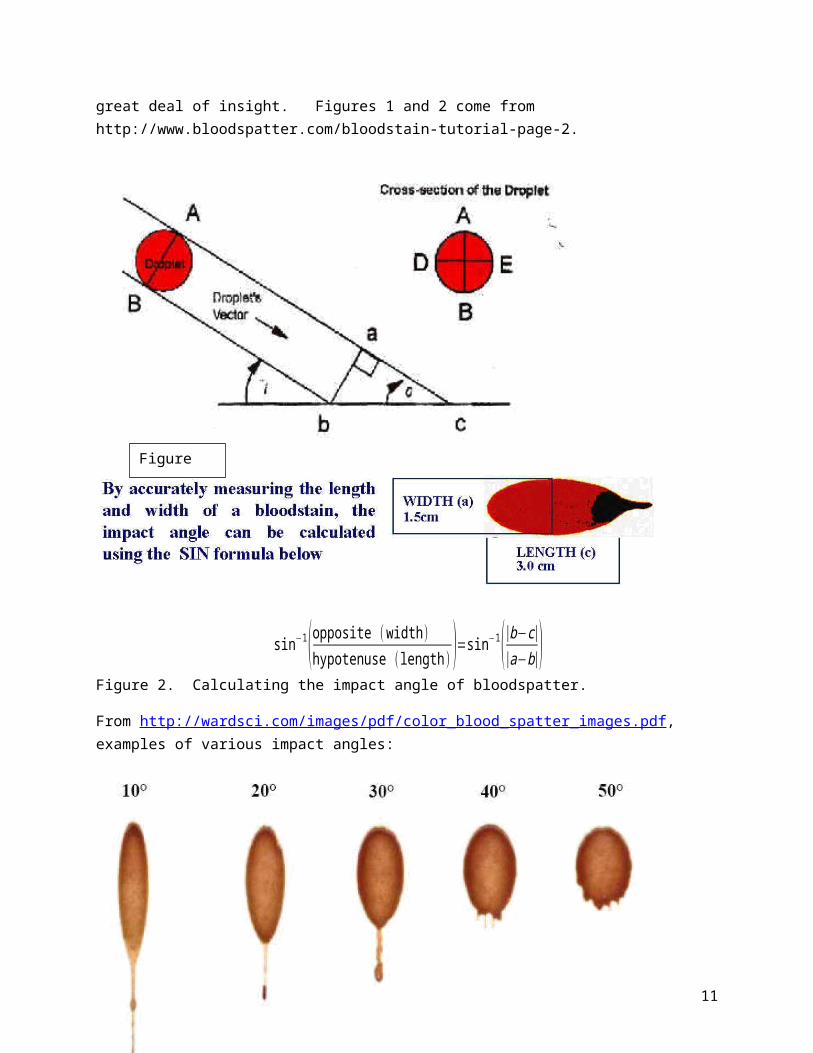
Figure 5. Map of the United States and map of the world.
These questions provide the students to engage with the concept. Students may be surprised to learn that only four colors are required!
These two problems are two of the classic problems in Graph Theory. Graphs can be a useful tool for analyzing situations where there are links between entities:
– Electrical networks
– Telephone communication systems
– Transportation networks
– Computer data structures
– Evolutionary trees in biology
– Who is friends with who on Facebook
Definition: A graph consists of a collection of points, called vertices, connected by lines, called edges.
Figure 6. Two different graphs.
11
Graph (a) comes from http://www.analytictech.com/networks/graphtheory.htm and graph (b) from http://commons.wikimedia.org/wiki/File:Graph_theory_tree.svg.
Graphs (a) and (b) in Figure 6, above, are examples of simple graphs:
– All of the edges are undirected, i.e., it is possible to go from a to e and e to a; from 2 to 4 and from 4 to 2
– None of the edges are loops, i.e., there are no edges from a vertex to itself
– There is, at most, one edge between any pair of vertices, i.e., there is only one edge between a and e
These points can be illustrated in class with the following examples.
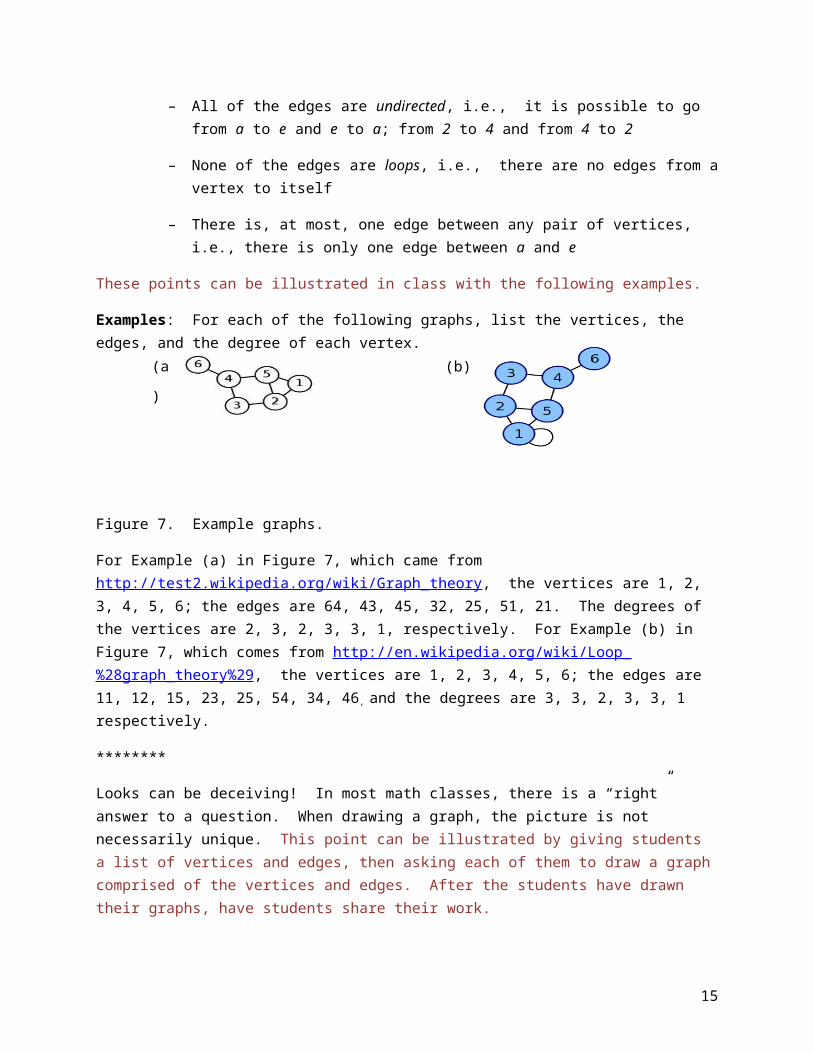
Examples: For each of the following graphs, list the vertices, the edges, and the degree of each vertex.
Figure 7. Example graphs.
For Example (a) in Figure 7, which came from http://test2.wikipedia.org/wiki/Graph_theory, the vertices are 1, 2, 3, 4, 5, 6; the edges are 64, 43, 45, 32, 25, 51, 21. The degrees of the vertices are 2, 3, 2, 3, 3, 1, respectively. For Example (b) in Figure 7, which comes from http://en.wikipedia.org/wiki/Loop_%28graph_theory%29, the vertices are 1, 2, 3, 4, 5, 6; the edges are 11, 12, 15, 23, 25, 54, 34, 46, and the degrees are 3, 3, 2, 3, 3, 1 respectively.
********
Looks can be deceiving! In most math classes, there is a “right” answer to a question. When drawing a graph, the picture is not necessarily unique. This point can be illustrated by giving students a list of vertices and edges, then asking each of them to draw a graph comprised of the vertices and edges. After the students have drawn their graphs, have students share their work.
Example (a) Vertices: A, B, C, D (b) Vertices: 1, 2, 3, 4, 5 Edges: AB, BC, BD, CD Edges: 23, 24, 44, 43, 35, 55, 53
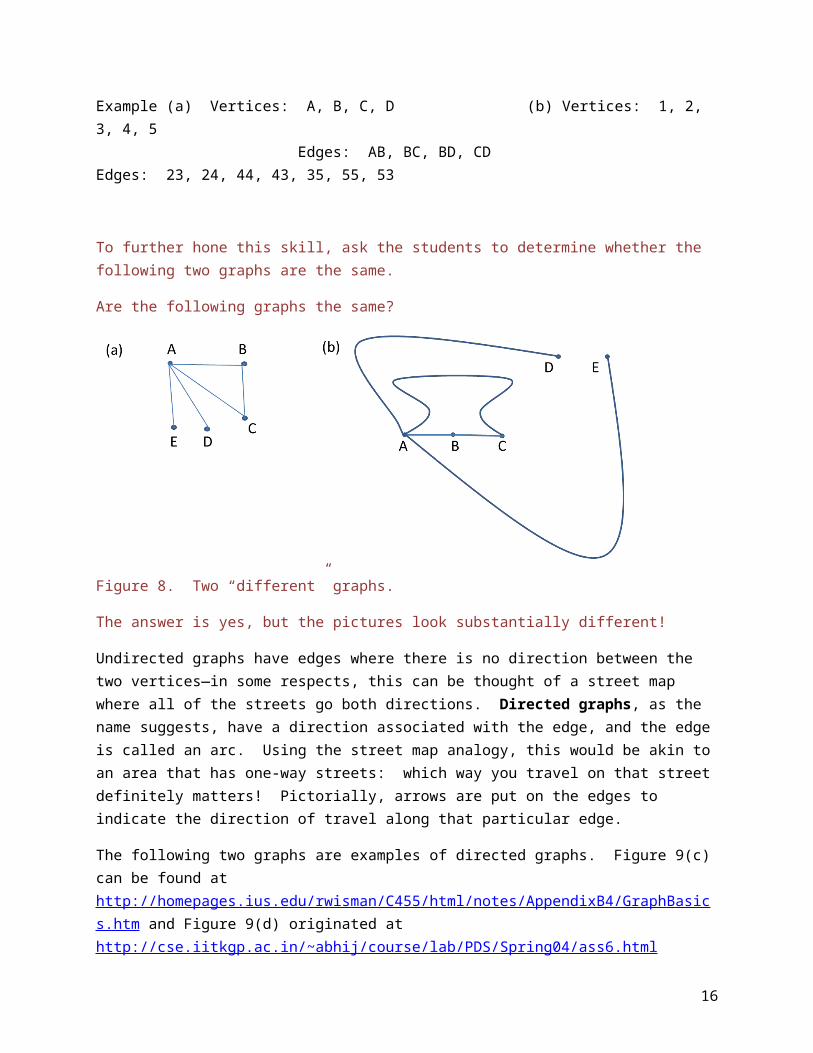
To further hone this skill, ask the students to determine whether the following two graphs are the same.
Are the following graphs the same?
(b) (a)
12
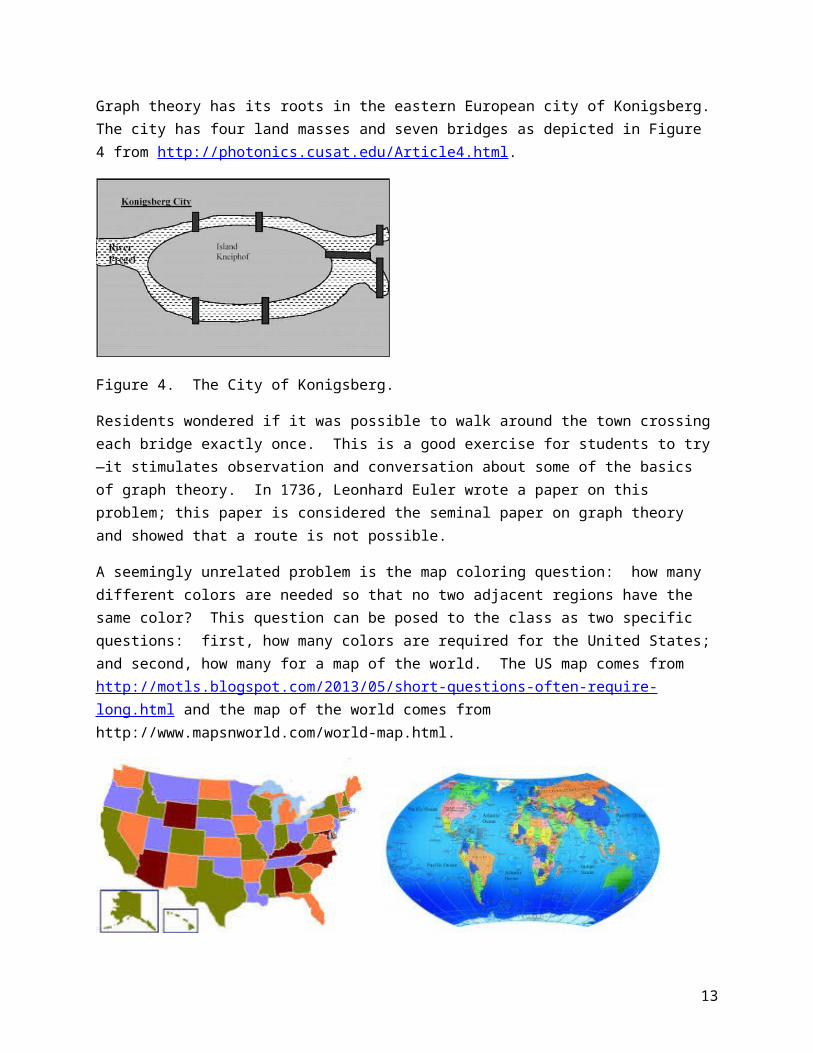
Figure 8. Two “different” graphs.
The answer is yes, but the pictures look substantially different!
Undirected graphs have edges where there is no direction between the two vertices—in some respects, this can be thought of a street map where all of the streets go both directions. Directed graphs, as the name suggests, have a direction associated with the edge, and the edge is called an arc. Using the street map analogy, this would be akin to an area that has one-way streets: which way you travel on that street definitely matters! Pictorially, arrows are put on the edges to indicate the direction of travel along that particular edge.
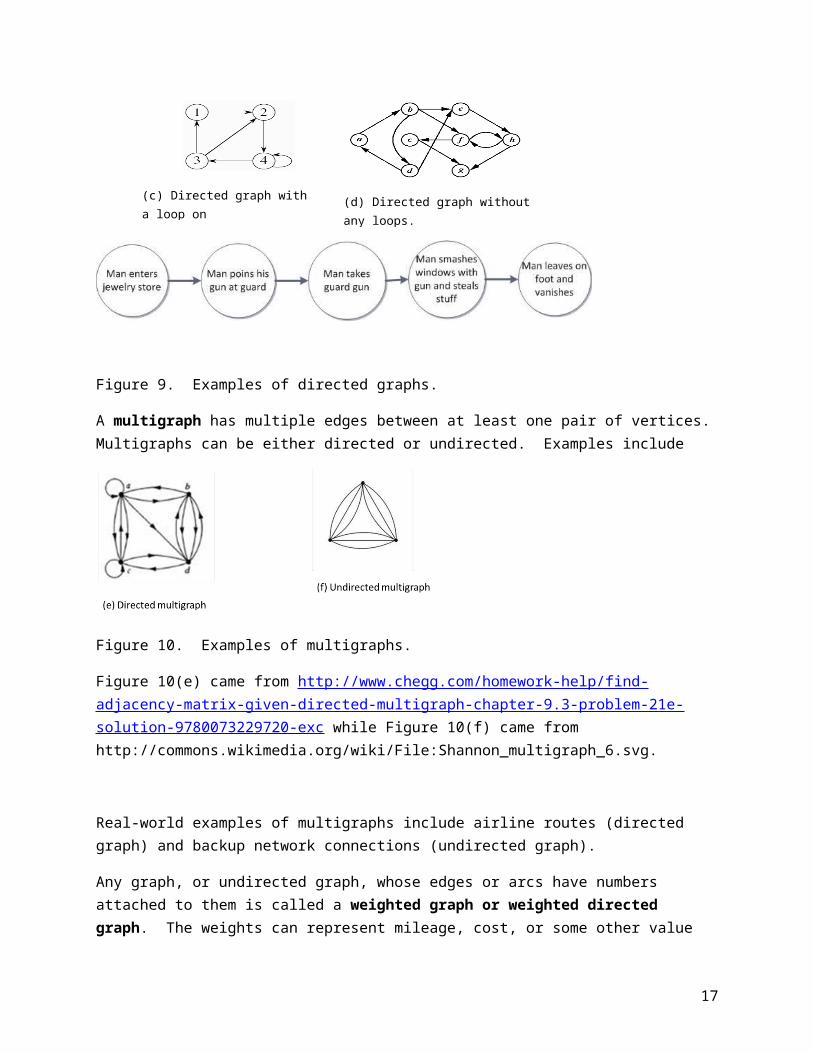
The following two graphs are examples of directed graphs. Figure 9(c) can be found at http://homepages.ius.edu/rwisman/C455/html/notes/AppendixB4/GraphBasics.htm and Figure 9(d) originated at http://cse.iitkgp.ac.in/~abhij/course/lab/PDS/Spring04/ass6.html
Figure 9. Examples of directed graphs.
A multigraph has multiple edges between at least one pair of vertices. Multigraphs can be either directed or undirected. Examples include
(c) Directed graph with a loop on vertex 4.
(d) Directed graph without any loops.
13
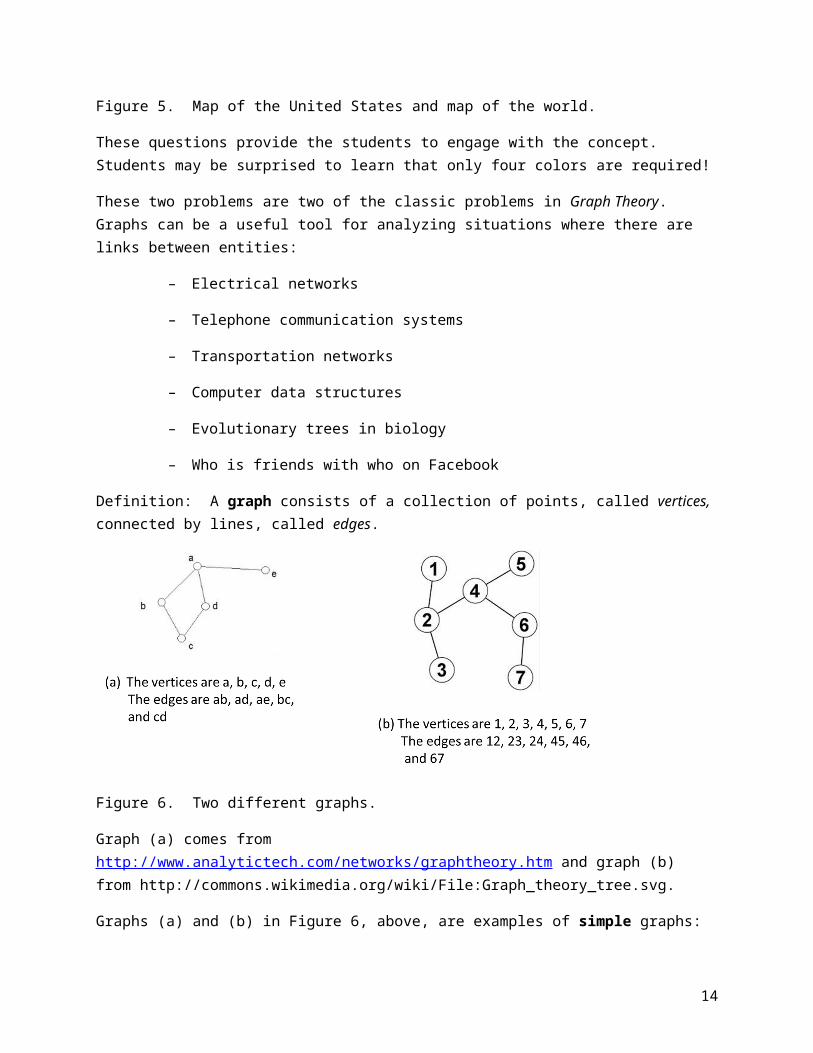
Figure 10. Examples of multigraphs.
Figure 10(e) came from http://www.chegg.com/homework-help/find-adjacency-matrix-given-directed-multigraph-chapter-9.3-problem-21e-solution-9780073229720-exc while Figure 10(f) came from http://commons.wikimedia.org/wiki/File:Shannon_multigraph_6.svg.
Real-world examples of multigraphs include airline routes (directed graph) and backup network connections (undirected graph).
Any graph, or undirected graph, whose edges or arcs have numbers attached to them is called a weighted graph or weighted directed graph. The weights can represent mileage, cost, or some other value associated with each particular path. From http://hansolav.net/sql/graphs.html:
(g) Weighted graph
Figure 10. Example of a weighted graph.
More terminology:
• Definition: Two vertices are said to be adjacent if there is an edge joining them. If a vertex has a loop, it is adjacent to itself.
• Definition: Two edges are adjacent if they share a common vertex.
14
• Definition: The degree of a vertex is the number of edges at that vertex. A loop contributes twice to the degree.
• Definition: A path is a sequence of vertices with the property that each vertex in the sequence is adjacent to the next one.
• A vertex can appear on the path more than once.
• An edge can be part of a path only once!
• Definition: A circuit has the same definition as a path with one additional requirement: it must start and end at the same vertex.
• Definition: A Hamilton circuit is a circuit that visits each vertex exactly once (other than the starting/ending vertex).
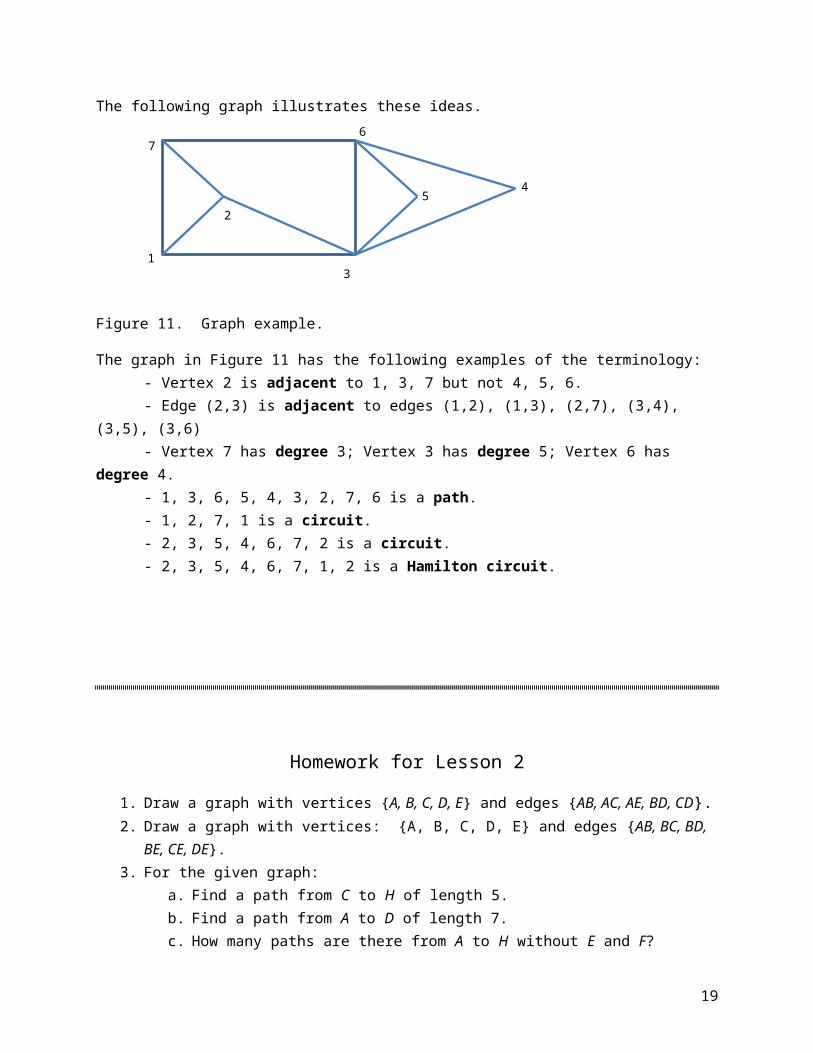
The following graph illustrates these ideas.
Figure 11. Graph example.
The graph in Figure 11 has the following examples of the terminology:- Vertex 2 is adjacent to 1, 3, 7 but not 4, 5, 6.- Edge (2,3) is adjacent to edges (1,2), (1,3), (2,7), (3,4), (3,5), (3,6)- Vertex 7 has degree 3; Vertex 3 has degree 5; Vertex 6 has degree 4.- 1, 3, 6, 5, 4, 3, 2, 7, 6 is a path.- 1, 2, 7, 1 is a circuit.- 2, 3, 5, 4, 6, 7, 2 is a circuit.- 2, 3, 5, 4, 6, 7, 1, 2 is a Hamilton circuit.
31
2
76
54
15
Homework for Lesson 2
1. Draw a graph with vertices {A, B, C, D, E} and edges {AB, AC, AE, BD, CD}.2. Draw a graph with vertices: {A, B, C, D, E} and edges {AB, BC, BD, BE, CE, DE}.3. For the given graph:
a. Find a path from C to H of length 5.b. Find a path from A to D of length 7.c. How many paths are there from A to H without E and F?d. Find two circuits of length 4 starting/ending at D.e. Find a circuit of length 7 starting/ending at A.f. Find a Hamilton circuit, if one exists. If one does not exist, say so.
4. Draw a directed graph with vertices {A, B, C, D, E} and edges {AB, AC, AE, BD, CD}. How is this graph different from your answer to #1?
5. Draw a graph with vertices: {A, B, C, D, E} and edges {AB, BC, BD, BE, CE, DE}. How is this graph different from your answer to #2?
Solutions
1. Answers will vary.2. Answers will vary.3. a. CDDEEFFGGH or CAABBDDCCH are two possible answers.
b. ABBCCHHGGFFEED is one possible answer.c. 4: ACCH; ABBCCH; ABBDDCCH; ACCBBDDCCHd. DBBAACCD and DEEGGFFD are two possible answers.e. ACCHHGGEEDDBBA is one possible answer.f. ACCHHGGFFEEDDBBA is one possible answer.
4. Answers will vary, but now the edges should have arrows. For example, edge AB will have an arrow pointing from A to B.
HG
FE
C
D
B
A
16
5. Same as 4.
Lesson 3:
Applications of Graph Theory
As noted earlier, graphs can be a useful tool for analyzing situations where there are links and/or relationships between entities. We now consider a few such situations.
Undirected Graph Example: Consider an ecosystem inhabited by raccoons, hawks, owls, opossums, squirrels, crows, shrews, mice, and woodpeckers. Some of these species will compete for food (e.g., raccoons and hawks) while others will not (e.g., raccoons and woodpeckers). A graph can be drawn: the various species are the vertices and an undirected edge between two species indicates competition for food (see Discrete Mathematics by Ken Rosen, 5th edition). The graph is in Figure 12:
Figure 12. Application of graph theory to an ecosystem.
From this graph, we know that raccoons compete with hawks, owls, and squirrels; hawks compete with raccoons, owls, and crows; opossums compete with squirrels, woodpeckers, and shrews; and so on. Questions:
- What does the degree of each vertex represent? (The degree of the vertex indicates the number of competitors.)
- Which species has the most competition for food? (Squirrels with degree 4.)- Which species has the fewest competitors for food? (Mouse has degree one.)
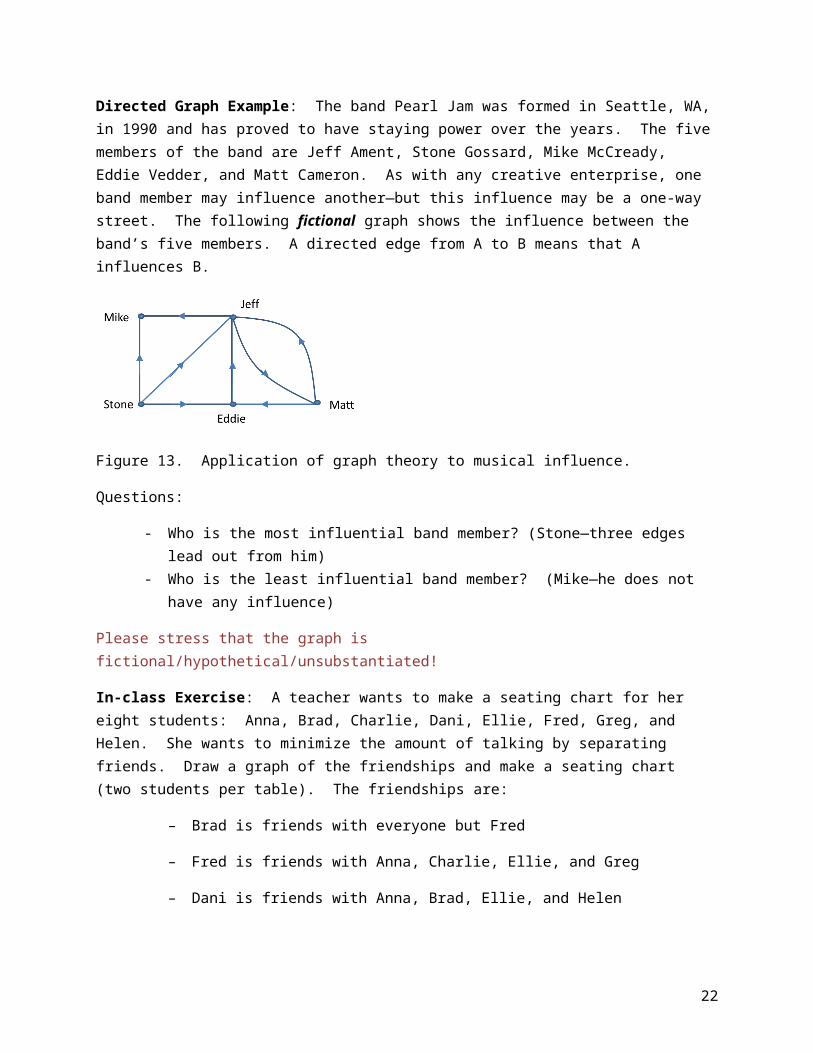
Directed Graph Example: The band Pearl Jam was formed in Seattle, WA, in 1990 and has proved to have staying power over the years. The five members of the band are Jeff Ament, Stone Gossard, Mike McCready, Eddie Vedder, and Matt Cameron. As with any creative enterprise, one band member may influence another—but this influence may be a one-way street. The following fictional graph shows the influence between the band’s five members. A directed edge from A to B means that A influences B.
17
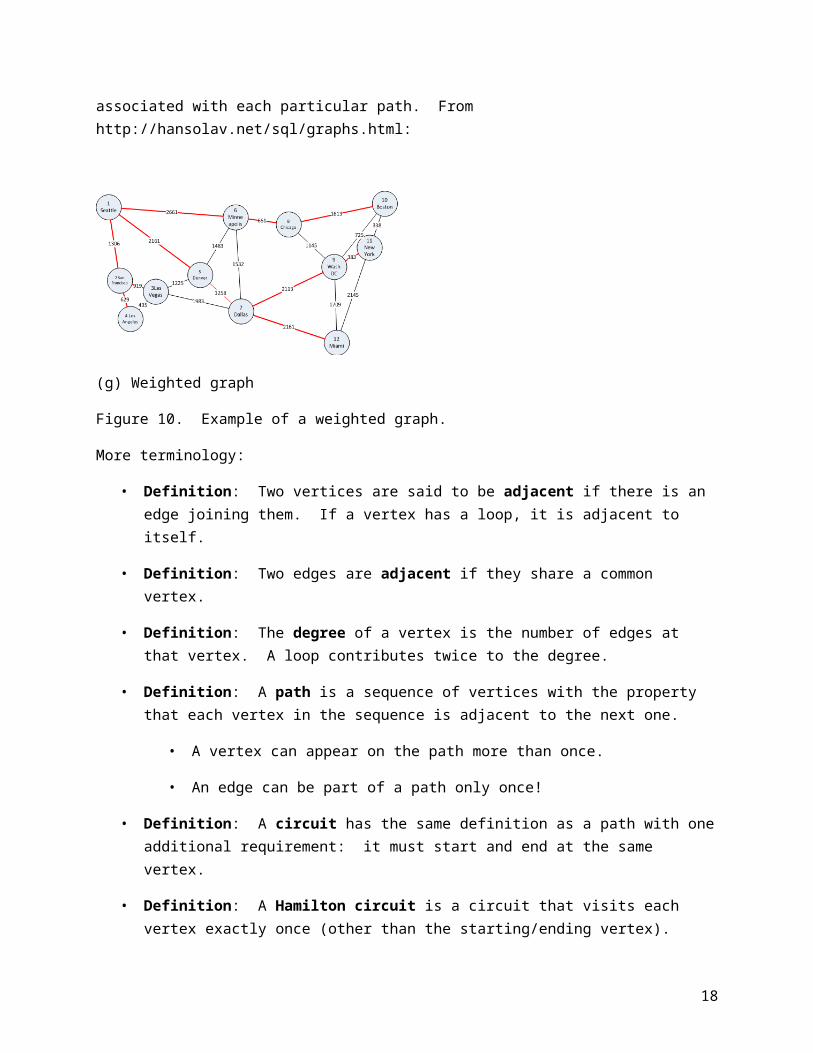
Figure 13. Application of graph theory to musical influence.
Questions:
- Who is the most influential band member? (Stone—three edges lead out from him)- Who is the least influential band member? (Mike—he does not have any influence)
Please stress that the graph is fictional/hypothetical/unsubstantiated!
In-class Exercise: A teacher wants to make a seating chart for her eight students: Anna, Brad, Charlie, Dani, Ellie, Fred, Greg, and Helen. She wants to minimize the amount of talking by separating friends. Draw a graph of the friendships and make a seating chart (two students per table). The friendships are:
– Brad is friends with everyone but Fred
– Fred is friends with Anna, Charlie, Ellie, and Greg
– Dani is friends with Anna, Brad, Ellie, and Helen
One possible answer is Brad/Fred, Charlie/Dani, Anna/Ellie, and Greg/Helen.
Application 1. Seizure of heroin.
Graph theory pops up in all sorts of interesting places. Read the following article:
Anne-Laure Terrettaz-Zufferey, Fre´de´ric Ratle, Olivier Ribaux, Pierre Esseiva, Mikhail Kanevski; Pattern detection in forensic case data using graph theory: Application to heroin cutting agents; Forensic Science International 167 (2007) 242–246
The abstract states:
Pattern recognition techniques can be very useful in forensic sciences to point out to relevant sets of events and potentially encourage an intelligence-led style of policing. In this study, these techniques have been applied to categorical data corresponding to cutting agents found in heroin seizures. An application of graph theoretic methods has been performed, in order to highlight the possible relationships between the location of seizures and co-occurrences of particular heroin cutting agents. An analysis of the co-occurrences to establish several main combinations has been done. Results illustrate the practical potential of mathematical models in forensic data analysis.
18
In short, the researchers wanted to determine if there was a relationship between the cutting agents found in heroin and the seizure location. They defined/built their vertices, V, and edges, E, as follows:
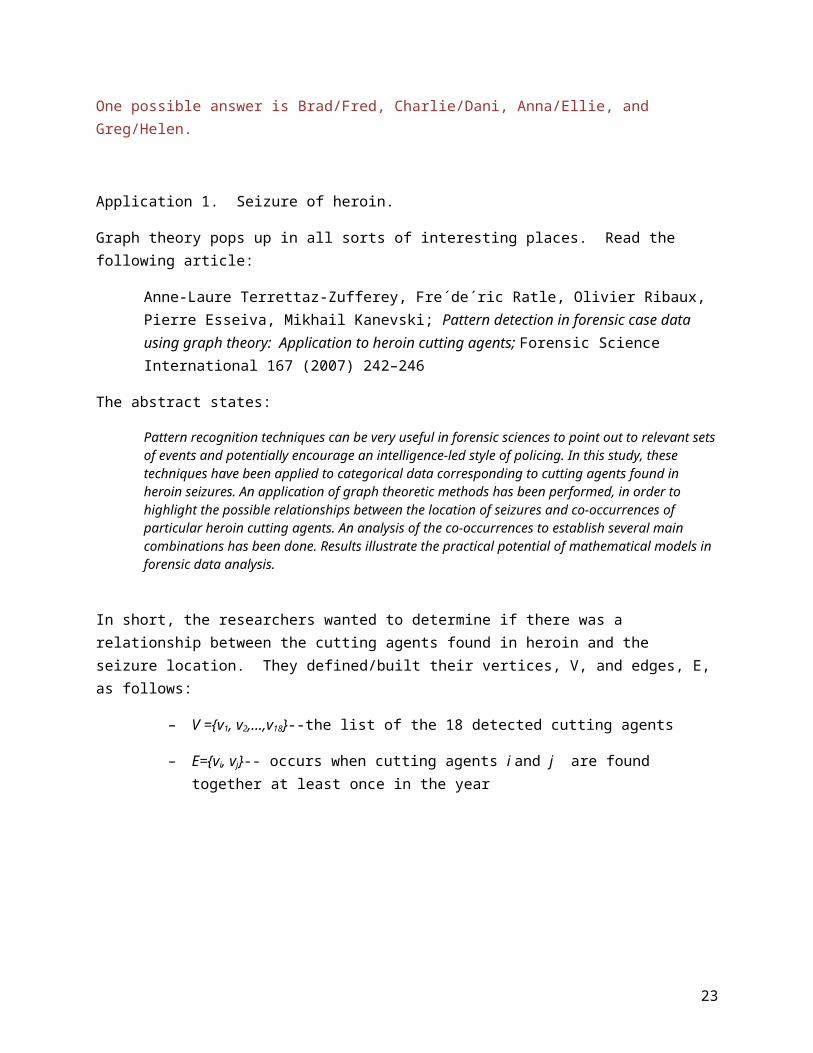
– V ={v1, v2,…,v18}--the list of the 18 detected cutting agents
– E={vi, vj}-- occurs when cutting agents i and j are found together at least once in the year
The eighteen cutting agents are
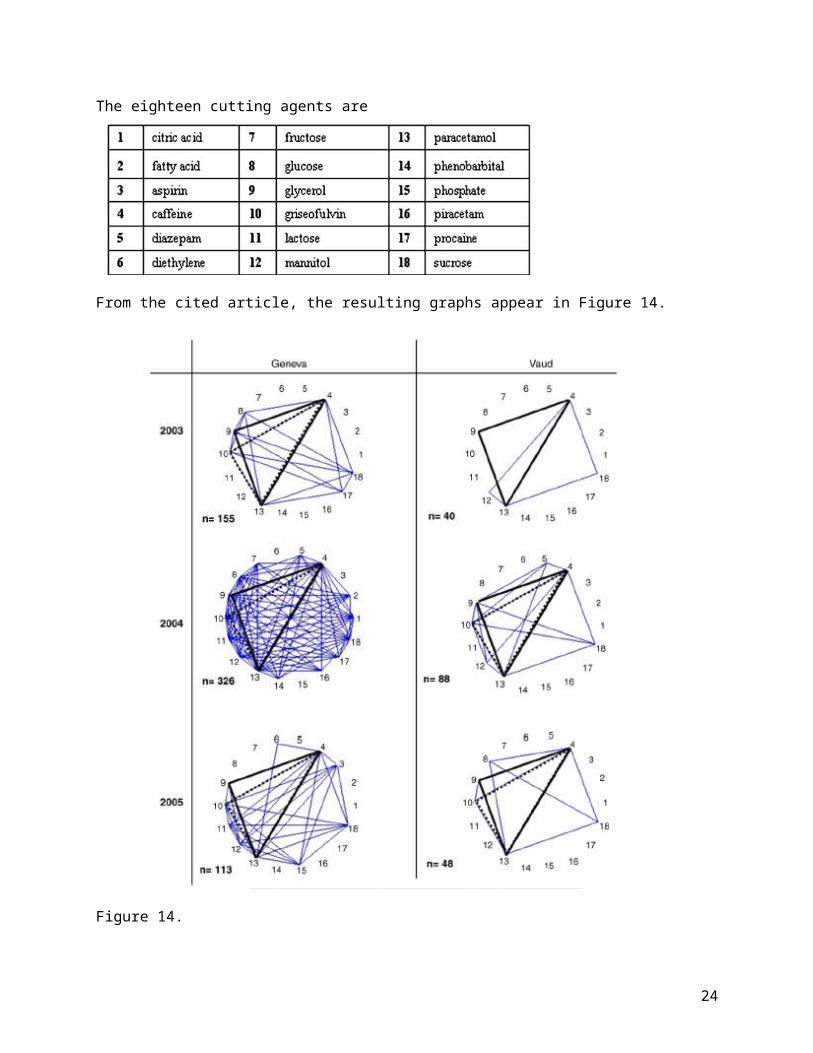
From the cited article, the resulting graphs appear in Figure 14.
19
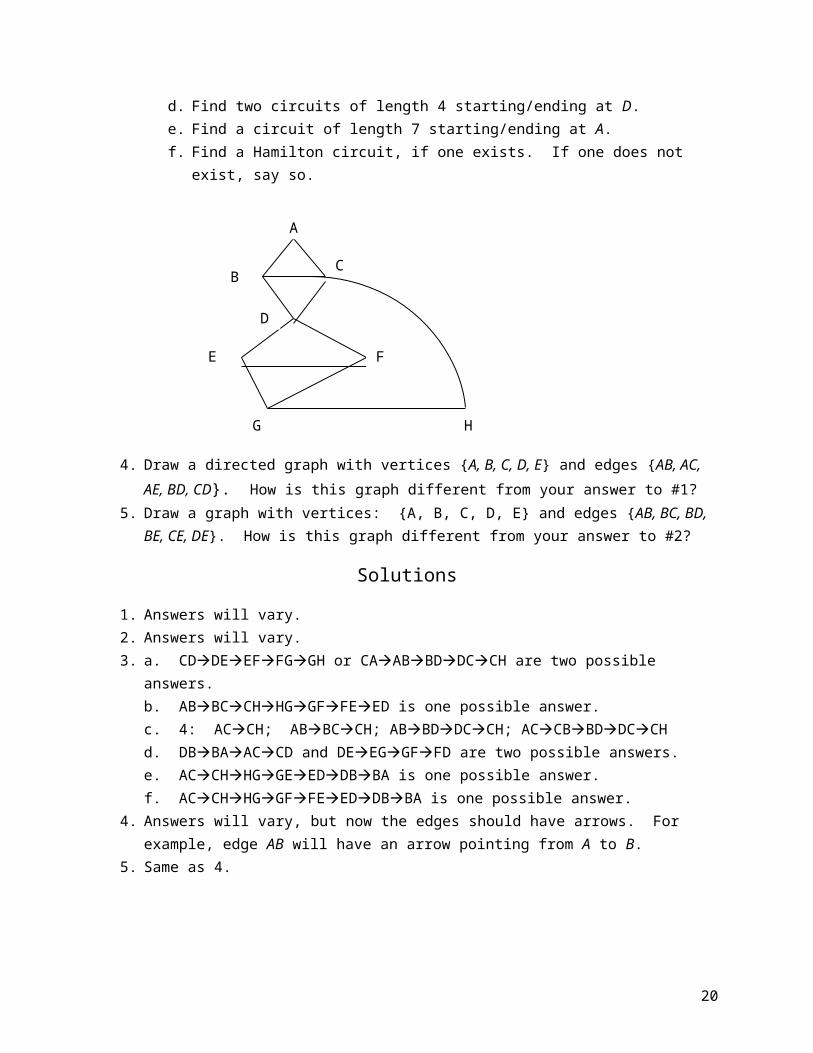
Figure 14.
Graphs will allow us to see the use of 4 (caffeine), 9 (glycerol), and 13 (paracetamol).
Application2. Graph theory and password protection
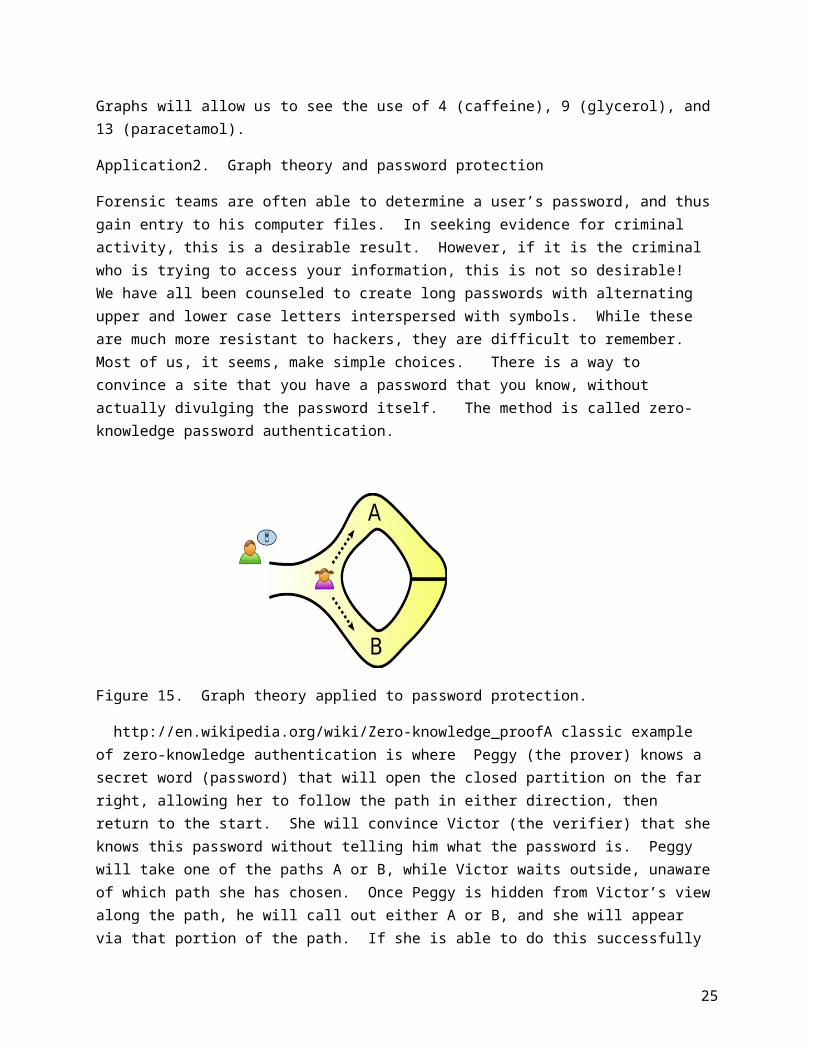
Forensic teams are often able to determine a user’s password, and thus gain entry to his computer files. In seeking evidence for criminal activity, this is a desirable result. However, if it is the criminal who is trying to access your information, this is not so desirable! We have all been counseled to create long passwords with alternating upper and lower case letters interspersed with symbols. While these are much more resistant to hackers, they are difficult to remember. Most of us, it seems, make simple choices. There is a way to convince a site that you have a password that you know, without actually divulging the password itself. The method is called zero-knowledge password authentication.
20
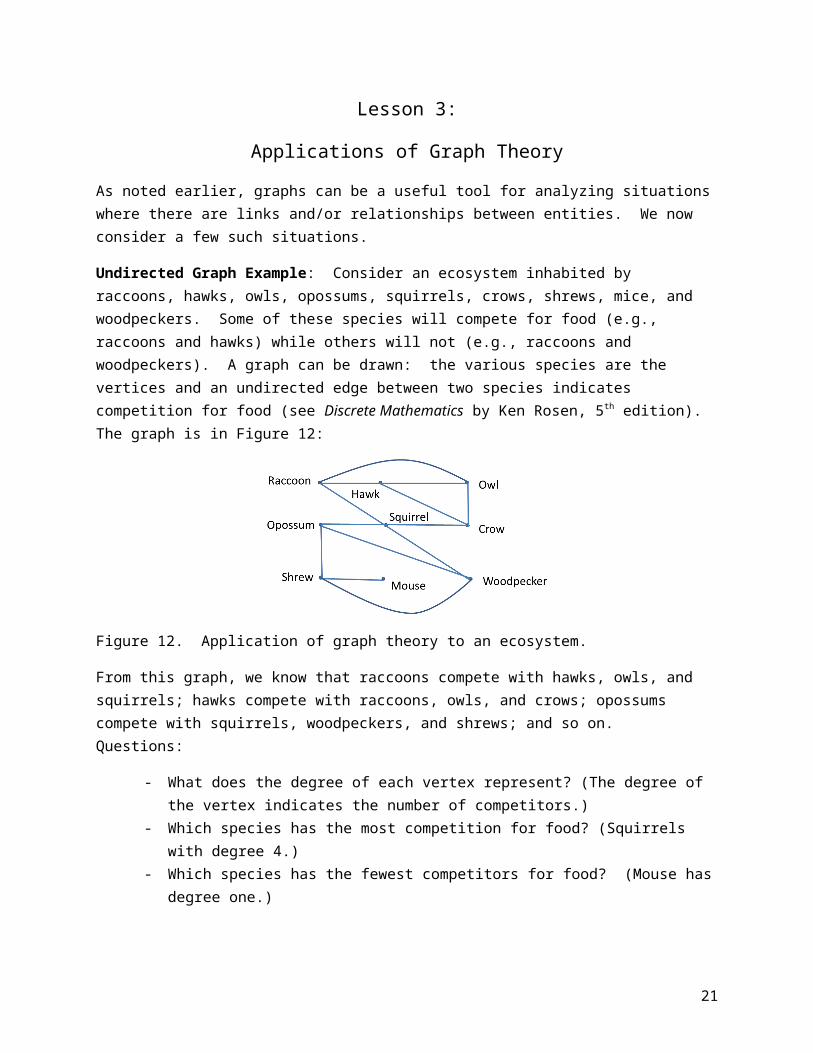
Figure 15. Graph theory applied to password protection.
http://en.wikipedia.org/wiki/Zero-knowledge_proofA classic example of zero-knowledge authentication is where Peggy (the prover) knows a secret word (password) that will open the closed partition on the far right, allowing her to follow the path in either direction, then return to the start. She will convince Victor (the verifier) that she knows this password without telling him what the password is. Peggy will take one of the paths A or B, while Victor waits outside, unaware of which path she has chosen. Once Peggy is hidden from Victor’s view along the path, he will call out either A or B, and she will appear via that portion of the path. If she is able to do this successfully every time Victor calls out, Victor will at some point conclude that Peggy does indeed know the secret word which opens the partition, without learning what the secret word is. (If Peggy does not know the secret word, she will only appear via the correct path about half the time.)
A second classic example is one in which two balls, identical in every way except for their color, are shown to a person who is color blind, and to whom the balls look exactly the same. Peggy wishes to prove to Victor that the balls are in fact differently colored, without telling Victor what the colors are. She does this by handing the balls to Victor, who will place them behind his back after Peggy observes the balls in his hands. He will then either switch the balls or not, then show them to Peggy. She will state whether or not the balls have been switched. After many repetitions of this, Victor will become convinced that the balls are in fact of different colors, but he will not know what those colors are.
Graph theory, in particular graph coloring, provides a way to protect a password by convincing the site that the password is known, without having to divulge it. The procedure is as follows:
Color the vertices of some suitable graph (not too simple) so that no edge connects vertices of the same color. You (the prover) send the graph, but not the coloration, to the server (the verifier). You randomly permute the colors, keeping the same ones selected in the original coloring. The verifier selects an edge, and observes that the ends are differently colored. This process is repeated numerous times, so that each time an edge is selected by the verifier, the vertices at the ends of the edge may have different colors than the previous time that edge was selected, yet the end colors will always be different, if the prover does in fact know the graph coloring. If the coloring is not actually known, then at some point there is a high probability that an edge will be selected with its ends having the same color.
21
[INTERACTIVE SITE: http://web.mit.edu/~ezyang/Public/graph/svg.html ]
Other sites with additional information: put in references:
http://cscursos.info/material/research/AP_2132.pdf
www.cse.cuhk.edu.hk/~andrejb/csc3130/f08/slides/08L24.ppt
Application 3. Can you make this a forensics example of a spy visiting places to pick up info?
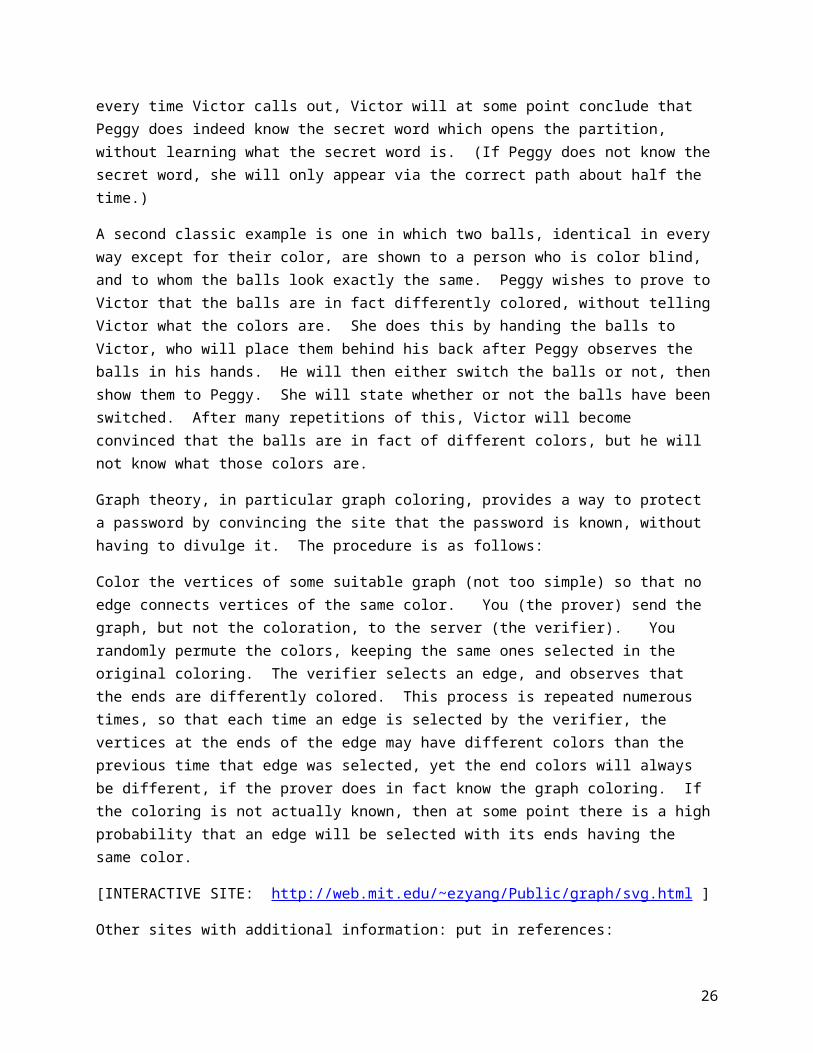
Eastern Washington tate has many “data farms” for large corporations. Suppose a spy, specializing in industrial and information espionage, needed to visit Leavenworth, Ellensburg, George, Coulee City, Moses Lake, Pasco, Ritzville, Davenport, Sprague, and Spokane to perform reconnaissance on various sites, then write a report to his/her superiors. With gas prices being what they are, it would make sense to take the shortest route to economize on fuel costs. This is an example of the Traveling Salesman Problem (TSP). [See http://penguin.ewu.edu/cscd320/Topic/Graph/AllPaths/EastWash.gif and http://penguin.ewu.edu/cscd320/Topic/Graph/Travail.ppt for Figures 16 and 17.]
Figure 16. Cities to be visited by the spy.
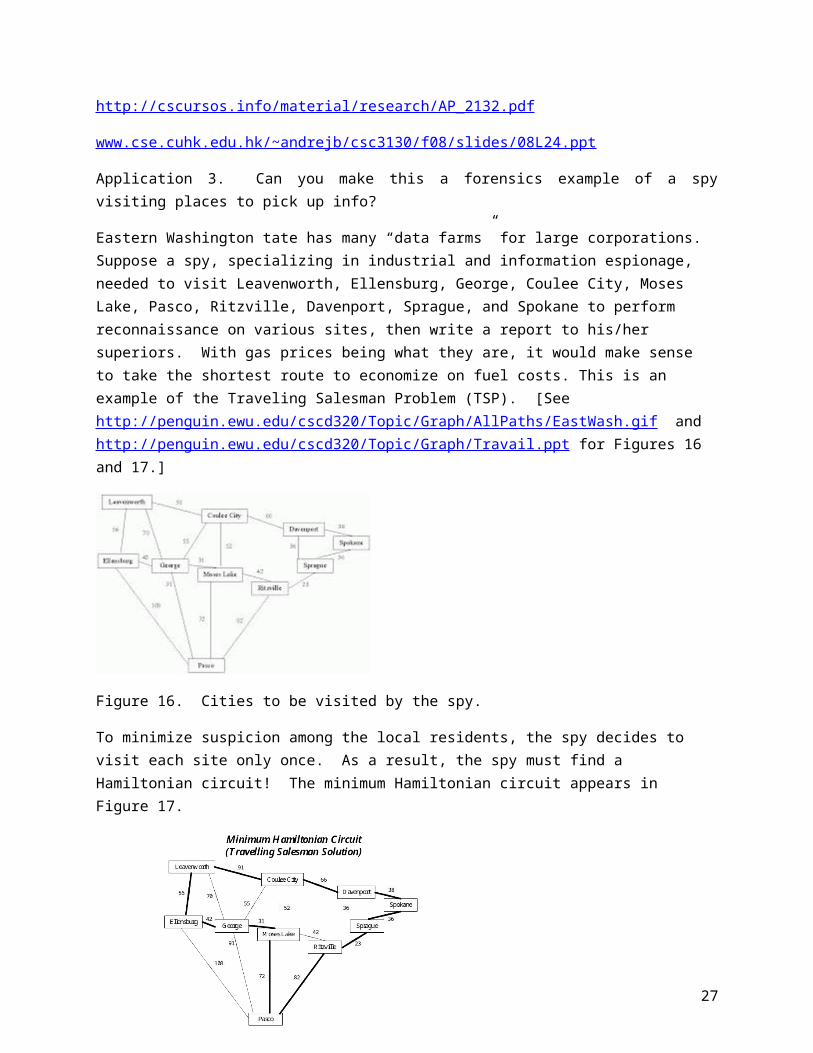
To minimize suspicion among the local residents, the spy decides to visit each site only once. As a result, the spy must find a Hamiltonian circuit! The minimum Hamiltonian circuit appears in Figure 17.
Figure 17. Minimum Hamiltonian circuit.
22
We consider a special situation: when the underlying structure is a complete graph. We suggest breaking the class into groups and letting them wrestle with this for a bit and see what emerges.
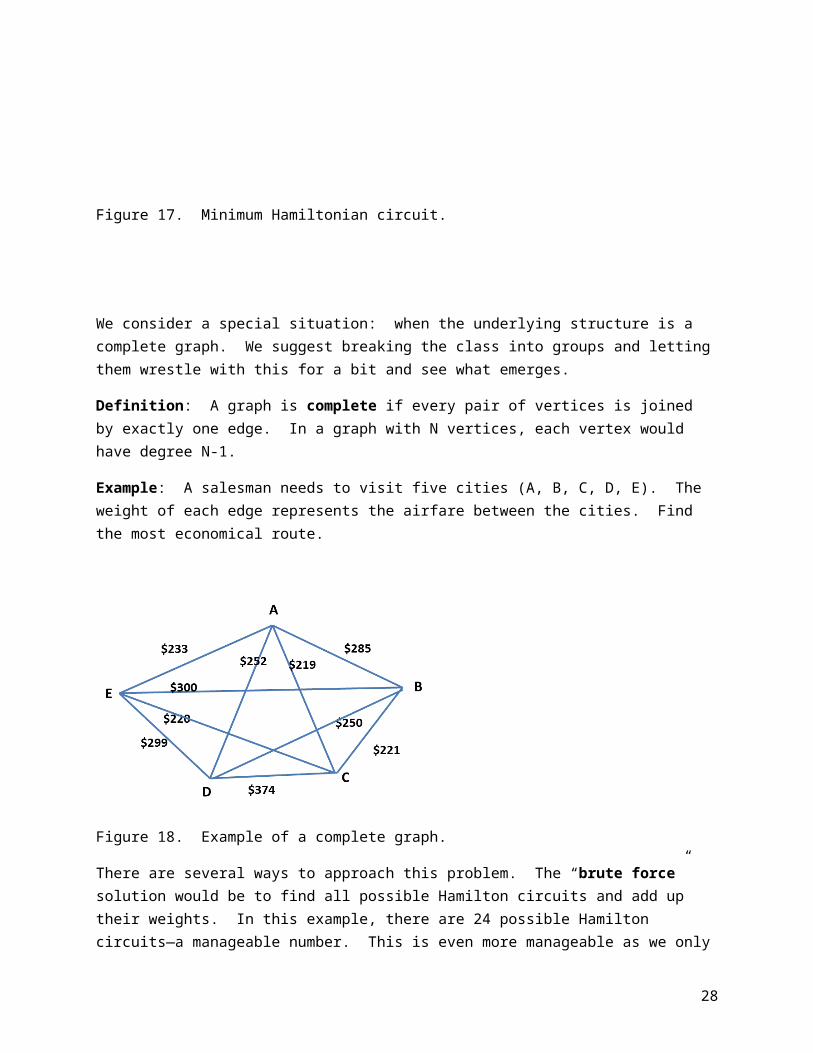
Definition: A graph is complete if every pair of vertices is joined by exactly one edge. In a graph with N vertices, each vertex would have degree N-1.
Example: A salesman needs to visit five cities (A, B, C, D, E). The weight of each edge represents the airfare between the cities. Find the most economical route.
Figure 18. Example of a complete graph.
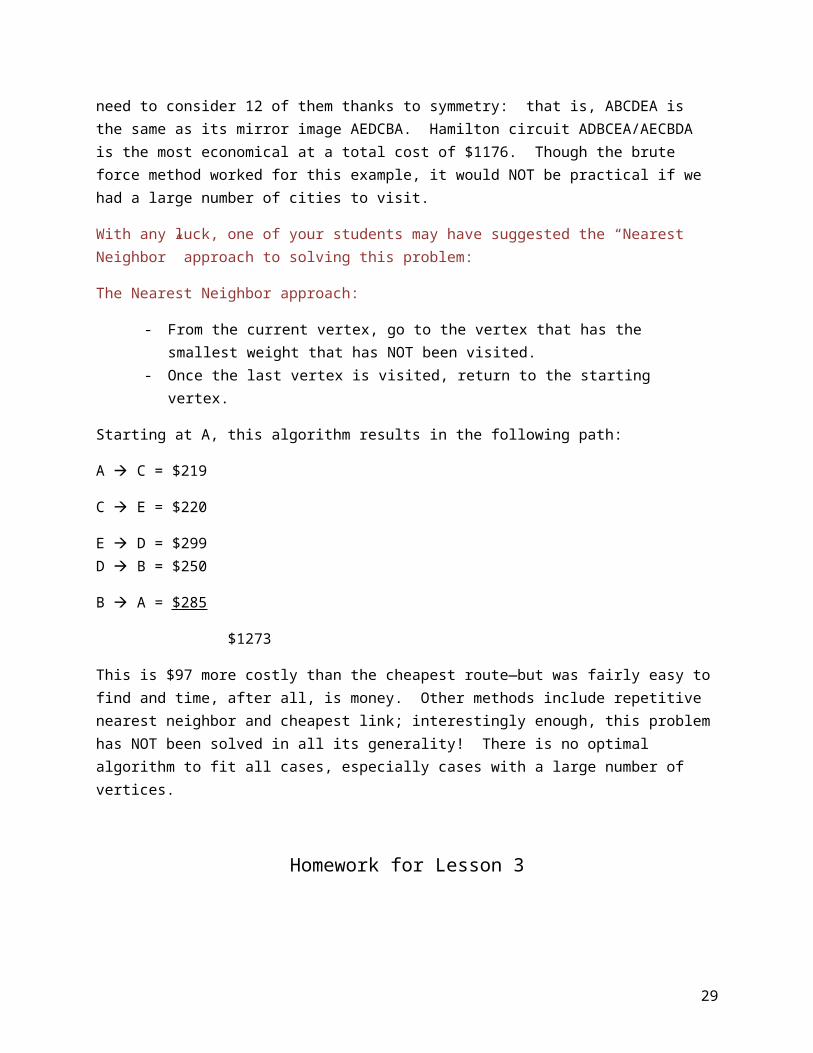
There are several ways to approach this problem. The “brute force” solution would be to find all possible Hamilton circuits and add up their weights. In this example, there are 24 possible Hamilton circuits—a manageable number. This is even more manageable as we only need to consider 12 of them thanks to symmetry: that is, ABCDEA is the same as its mirror image AEDCBA. Hamilton circuit ADBCEA/AECBDA is the most economical at a total cost of $1176. Though the brute force method worked for this example, it would NOT be practical if we had a large number of cities to visit.
With any luck, one of your students may have suggested the “Nearest Neighbor” approach to solving this problem:
The Nearest Neighbor approach:
- From the current vertex, go to the vertex that has the smallest weight that has NOT been visited.
- Once the last vertex is visited, return to the starting vertex.
Starting at A, this algorithm results in the following path:
23
A C = $219
C E = $220
E D = $299D B = $250
B A = $285
$1273
This is $97 more costly than the cheapest route—but was fairly easy to find and time, after all, is money. Other methods include repetitive nearest neighbor and cheapest link; interestingly enough, this problem has NOT been solved in all its generality! There is no optimal algorithm to fit all cases, especially cases with a large number of vertices.
Homework for Lesson 3
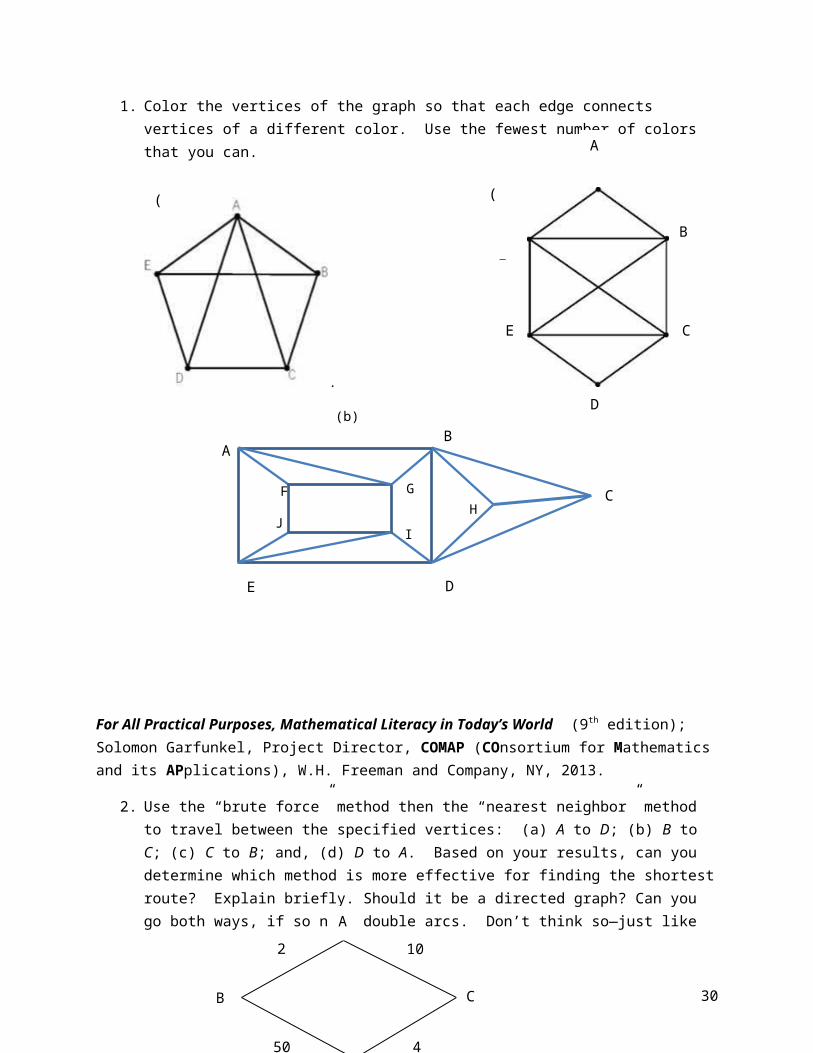
1. Color the vertices of the graph so that each edge connects vertices of a different color. Use the fewest number of colors that you can.
.
(b)
F
JI
HG C
E D
BA
B
A
C
D
E
F
(a) (c)
24
For All Practical Purposes, Mathematical Literacy in Today’s World (9th edition); Solomon Garfunkel, Project Director, COMAP (COnsortium for Mathematics and its APplications), W.H. Freeman and Company, NY, 2013.
2. Use the “brute force” method then the “nearest neighbor” method to travel between the specified vertices: (a) A to D; (b) B to C; (c) C to B; and, (d) D to A. Based on your results, can you determine which method is more effective for finding the shortest route? Explain briefly. Should it be a directed graph? Can you go both ways, if so need double arcs. Don’t think so—just like traveling salesman problem, you can go either way on a given road.
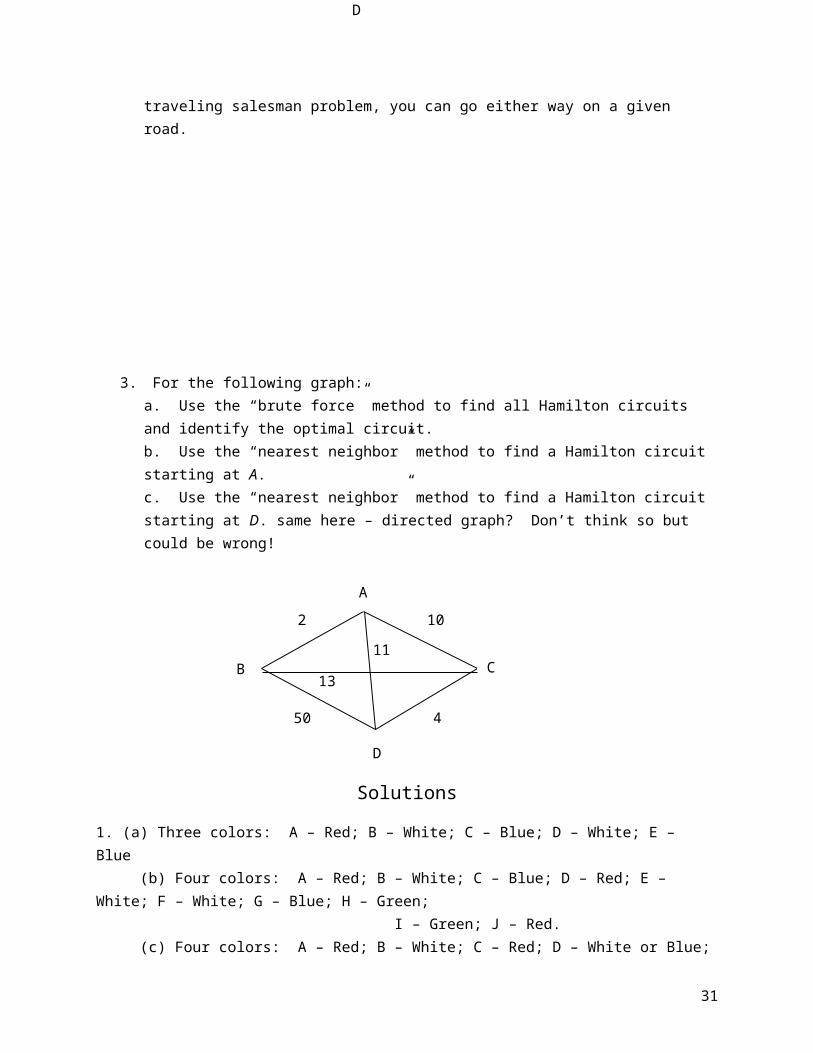
3. For the following graph:a. Use the “brute force” method to find all Hamilton circuits and identify the optimal circuit.b. Use the “nearest neighbor” method to find a Hamilton circuit starting at A.c. Use the “nearest neighbor” method to find a Hamilton circuit starting at D. same here – directed graph? Don’t think so but could be wrong!
Solutions
1. (a) Three colors: A – Red; B – White; C – Blue; D – White; E – Blue (b) Four colors: A – Red; B – White; C – Blue; D – Red; E – White; F – White; G – Blue; H – Green;
13
11
450
102
D
CB
A
450
102
D
CB
A
25
I – Green; J – Red. (c) Four colors: A – Red; B – White; C – Red; D – White or Blue; E – Green; F – Blue
Note: other answers are possible!
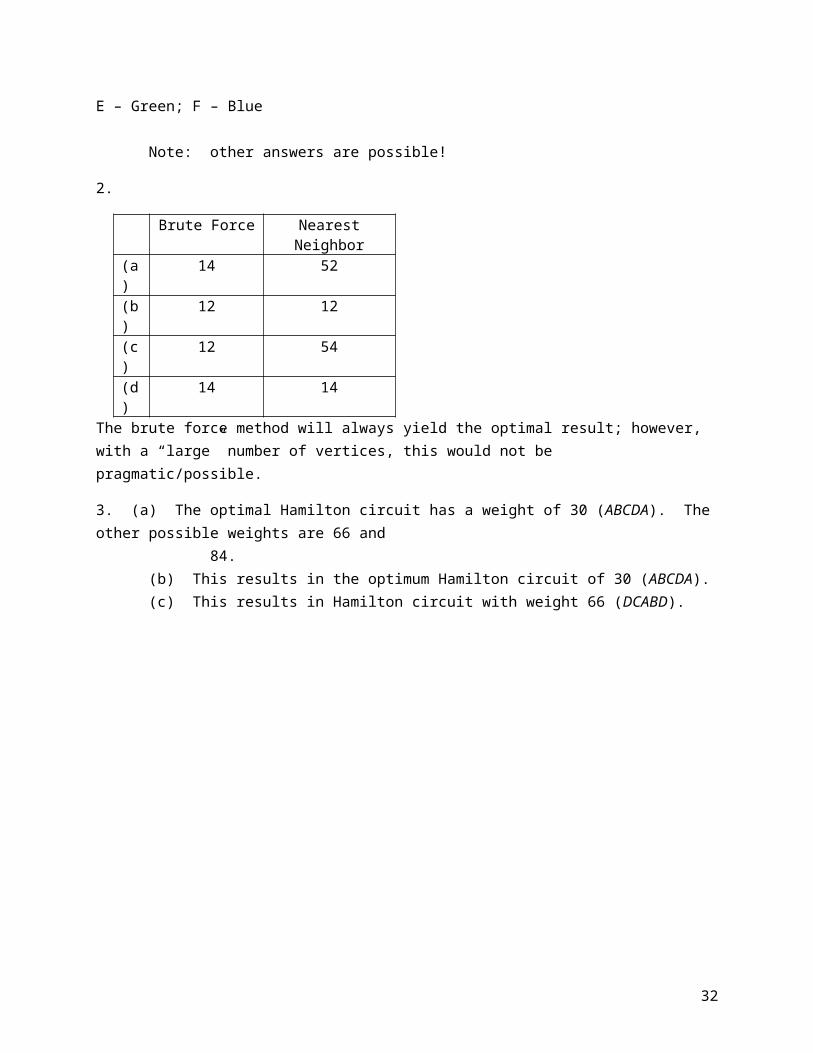
2.
Brute Force Nearest Neighbor(a) 14 52(b) 12 12(c) 12 54(d) 14 14
The brute force method will always yield the optimal result; however, with a “large” number of vertices, this would not be pragmatic/possible.
3. (a) The optimal Hamilton circuit has a weight of 30 (ABCDA). The other possible weights are 66 and 84. (b) This results in the optimum Hamilton circuit of 30 (ABCDA). (c) This results in Hamilton circuit with weight 66 (DCABD).
26
Lesson 4:
Precedence Graphs and Their Applications to Forensics
Sometimes, in solving a crime, it is necessary to build a timeline of the events that preceded the crime. This timeline is used to represent the sequencing of events, it helps understand what event occurred before or caused or facilitated another. It can also help eliminate or focus on some suspects, if their whereabouts puts them away or in the crime scene.
One application of graph theory that is widely used in scheduling is precedence graphs.
Precedence Graphs are widely used in computer science as a method to represent programs execution. Computer programs can be executed more rapidly if some statements can be run in parallel. It is, however, important that a statement be executed only if its required operands have been evaluated.
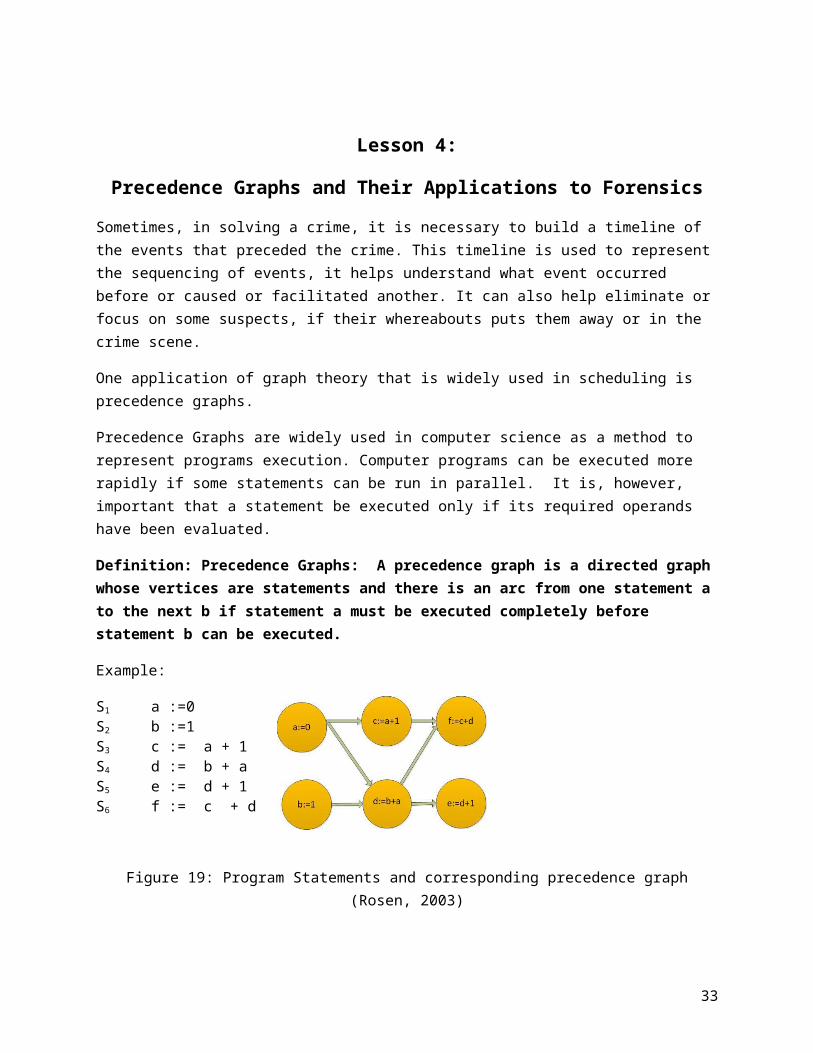
Definition: Precedence Graphs: A precedence graph is a directed graph whose vertices are statements and there is an arc from one statement a to the next b if statement a must be executed completely before statement b can be executed.
Example:
S1 a :=0S2 b :=1S3 c := a + 1S4 d := b + aS5 e := d + 1S6 f := c + d
Figure 19: Program Statements and corresponding precedence graph (Rosen, 2003)
The graph in Figure 19 shows that the statement S5 cannot be executed before statements S1 , S2, and S4
are executed.
Precedence Graphs and scheduling:
Building a precedence graph of tasks to be performed enables us to schedule these tasks in order to minimize the time to execute the whole program. Task scheduling is represented by a tuple of tasks S i in which the order determines which tasks should execute first. Tasks that can be executed in parallel are included in the same set. For example: (S1,S2,S3, S4, S5,S6) is such a scheduling, another is (S2, S1, S4, S3, S6, S5). These are sometimes called PERT networks.
Topological Sort
27
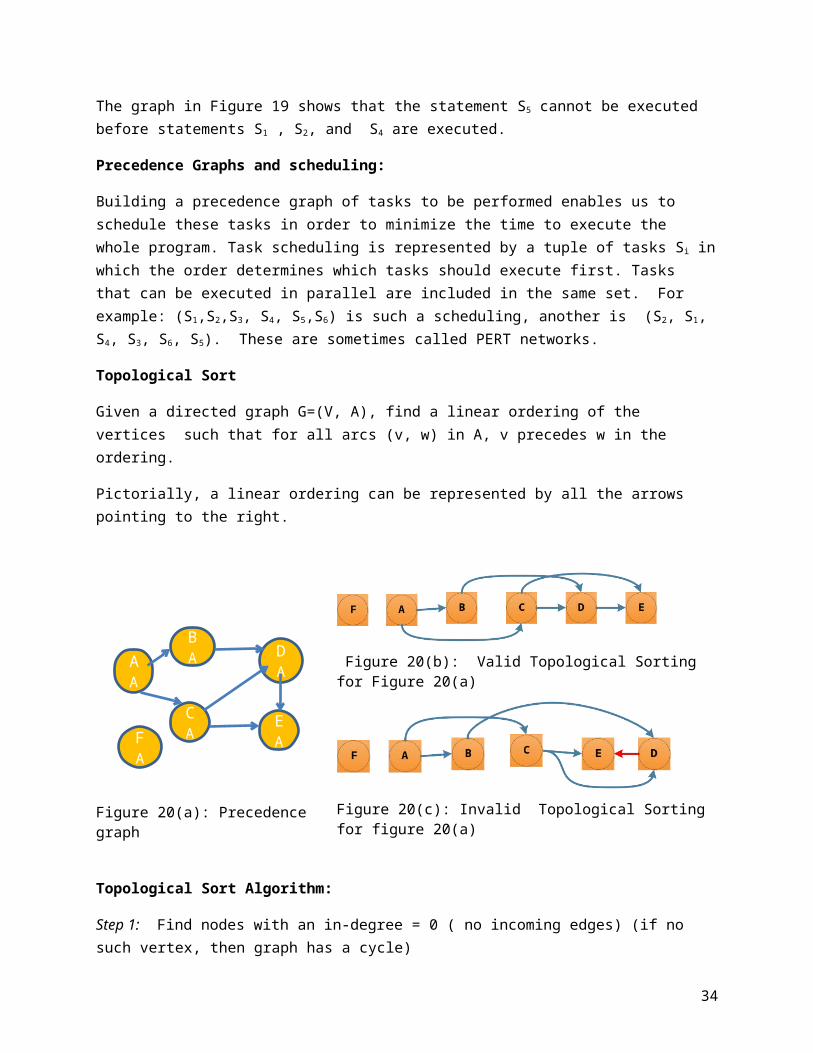
Given a directed graph G=(V, A), find a linear ordering of the vertices such that for all arcs (v, w) in A, v precedes w in the ordering.
Pictorially, a linear ordering can be represented by all the arrows pointing to the right.
Figure 20(a): Precedence graph
Figure 20(b): Valid Topological Sorting for Figure 20(a)
Figure 20(c): Invalid Topological Sorting for figure 20(a)
Topological Sort Algorithm:
Step 1: Find nodes with an in-degree = 0 ( no incoming edges) (if no such vertex, then graph has a cycle)
Step 2: Select one such node, add to the list of nodes, delete this node and remove all outgoing edges.
Step 3: Repeat Step 1 and Step 2 until the graph is empty.
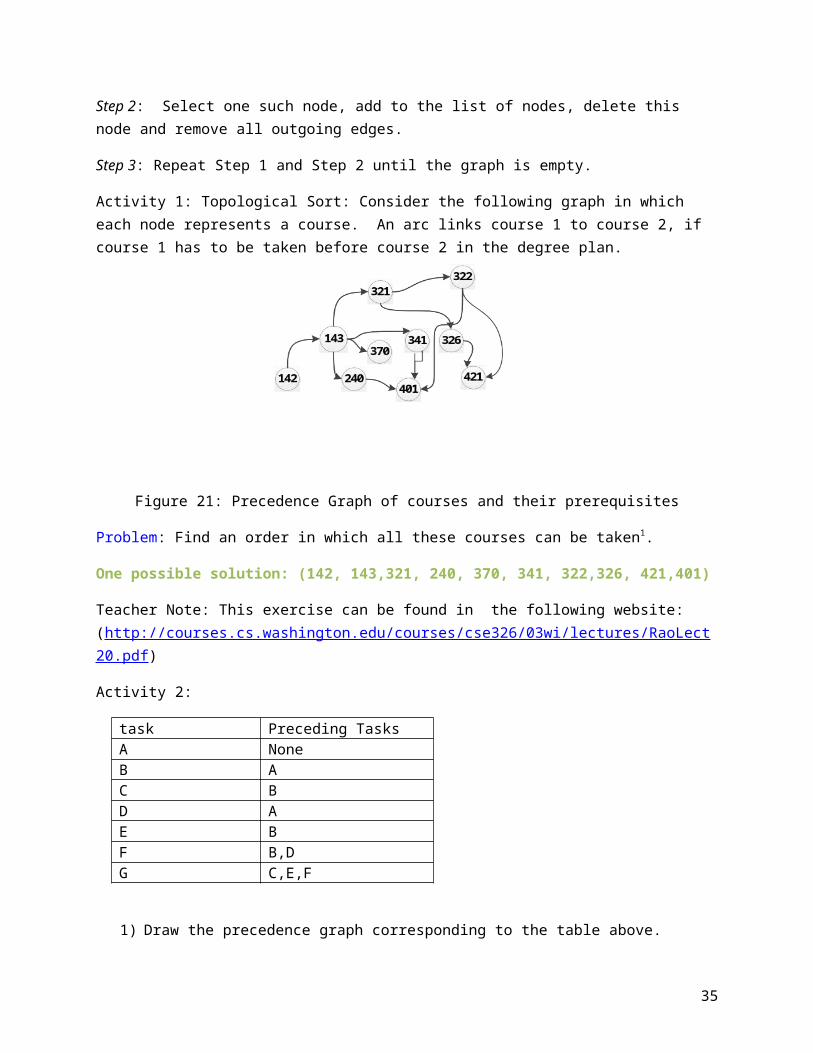
Activity 1: Topological Sort: Consider the following graph in which each node represents a course. An arc links course 1 to course 2, if course 1 has to be taken before course 2 in the degree plan.
Figure 21: Precedence Graph of courses and their prerequisites
Problem: Find an order in which all these courses can be taken1.
One possible solution: (142, 143,321, 240, 370, 341, 322,326, 421,401)
28
Teacher Note: This exercise can be found in the following website: (http://courses.cs.washington.edu/courses/cse326/03wi/lectures/RaoLect20.pdf)
Activity 2:
task Preceding TasksA NoneB AC BD AE BF B,DG C,E,F
1) Draw the precedence graph corresponding to the table above.2) Find a valid topological sort of the tasks.
Solution: (A,B, D, C, E, F,G)
Precedence Graphs and Forensics:
Timelines are used in many fields in order to give an overview of the sequencing of events or progression of a phenomenon. After a crime is committed, it is usually customary to try to build a timeline of the victim’s schedule and also to the main suspects. These timelines, with other clues, help investigators determine important events and also focus on some suspects and exonerate others.
Application 4.
The Case of the Ruined Roses (http://kids.mysterynet.com/solveit/)
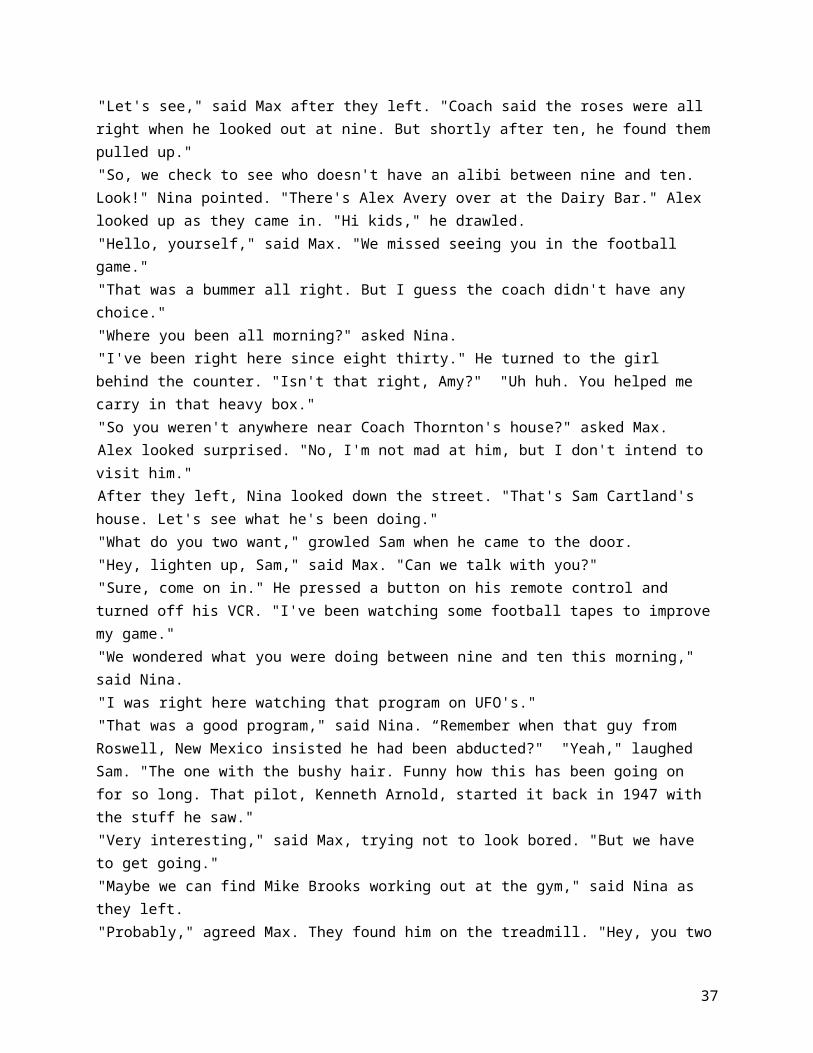
Instructor to distribute this text to student. Allow few minutes for reading and then discussing it.Read the following:"That was a neat program on UFO's," said Nina to her cousin Max as they walked down the street. "I think what really amazed me was that UFO's were reported as early as 1800." "That's pretty hard to believe," said Max. Right then, they heard a loud scream coming from Coach Thornton's house. "Come on," shouted Max. They ran into the yard where the coach was staring at ten rose bushes that had been pulled from the ground. "Look at that!" he demanded. "Just look at that." "That's terrible," cried Nina. "Who could have done it?" Coach Thornton looked disgusted. "I had to bench three of my best football players for cutting class. They were pretty mad at me." "First thing, we'd better get these roses back in the ground," said Max. "Then we'll figure out who did it." Nina and Max helped Coach Thornton replant the roses. Then he invited them in for milk and cookies. "Now," said Nina. "Am I right? You benched Sam Cartland, Mike Brooks, and Alex Avery." "And you lost
29
the game," added Max. The coach rubbed his eyes. "I know, but rules are rules." "I'll bet one of them did it to get even," said Nina. "How about we nose around a little?" "Let's see," said Max after they left. "Coach said the roses were all right when he looked out at nine. But shortly after ten, he found them pulled up." "So, we check to see who doesn't have an alibi between nine and ten. Look!" Nina pointed. "There's Alex Avery over at the Dairy Bar." Alex looked up as they came in. "Hi kids," he drawled. "Hello, yourself," said Max. "We missed seeing you in the football game." "That was a bummer all right. But I guess the coach didn't have any choice." "Where you been all morning?" asked Nina. "I've been right here since eight thirty." He turned to the girl behind the counter. "Isn't that right, Amy?" "Uh huh. You helped me carry in that heavy box." "So you weren't anywhere near Coach Thornton's house?" asked Max. Alex looked surprised. "No, I'm not mad at him, but I don't intend to visit him." After they left, Nina looked down the street. "That's Sam Cartland's house. Let's see what he's been doing." "What do you two want," growled Sam when he came to the door. "Hey, lighten up, Sam," said Max. "Can we talk with you?" "Sure, come on in." He pressed a button on his remote control and turned off his VCR. "I've been watching some football tapes to improve my game." "We wondered what you were doing between nine and ten this morning," said Nina. "I was right here watching that program on UFO's." "That was a good program," said Nina. “Remember when that guy from Roswell, New Mexico insisted he had been abducted?" "Yeah," laughed Sam. "The one with the bushy hair. Funny how this has been going on for so long. That pilot, Kenneth Arnold, started it back in 1947 with the stuff he saw." "Very interesting," said Max, trying not to look bored. "But we have to get going." "Maybe we can find Mike Brooks working out at the gym," said Nina as they left. "Probably," agreed Max. They found him on the treadmill. "Hey, you two want to join down here? It's a great place to work out." "Not right now," said Max. "We were wondering about what you were doing from nine to ten this morning." "Right here. You can check the log book. Why?" “Just curious," said Nina with a smile as they went back to the desk. Sure enough, Mike had signed in at five to nine. This is great," Nina groaned. "They all have alibis." "I'm not so sure of that," said Max.
How do we solve this problem?
1- Let us build a table with times of events and each suspect activity with their times.
Latest Starting Time Event9:05 am S1: Roses are uprooted8:30 am S2: Alex Avery working at the Dairy Bar9:05 am S3: Sam Cartland watching program on UFO’s8:55 am S4: Mike Brooks working out at the gym
30
2- Draw a directed precedence graph to represent each suspect’s activities for that morning.
Question: Who could the prime suspect be?
Answer : Sam Cartland (no witnesses and other clues)
The Case of Two Guns maybe put this example in section 2 just as an example of a graph – before it is called a precedence graph – draw as circles not squares there.
Report from the store guard
1) A man enters a jewelry store with a gun and a bag at 11:30 AM.2) The man points his gun at the guard inside and takes his gun3) The man then smashes the 5 store windows with his gun and takes as many as 30 Rolex
watches, 20 diamond rings and 10 diamond bracelets.4) The man then leaves the store on foot and vanishes.5) The whole thing took less 5 minutes
Ask students to build the precedence graph based on the events description.
Answer below:
A reenactment of the events shows that smashing one window takes care because the burglar can injure himself and it would require about 45 seconds to break. Picking one item takes about 2 seconds.
1) Based on these numbers figure out how much time would be required for the burglary ( 3 minutes 45 seconds to break the windows, 3 minutes to pick up the items , 1 minutes to enter and remove gun from guard. Total time almost 8 minutes)
31
2) What other conclusions can you draw (the guard might be an accomplice).
Application 5: Calculating time of death Teacher Note: (http://www.practicalhomicide.com/Research/LOmar2007.htm)
Calculating the time of death of the victim is a very important piece of evidence. A body’s temperature increases or decreases to match the ambient temperature following this formula:
37.5oC - 1.5oC
This formula equates to the body temperature (37.5oC), which loses 1.5oC per hour until the temperature of the body is that of the environment around it; known as the ambient temperature. This ambient temperature – depending on how low it is – may take minutes or hours to be reached and this is a good indicator as to how long a body has been in situ. Additionally it is worth noting that a body’s temperature will drop much more slowly if the body has been exposed to extreme cold; such as being left outdoors, submerged in water or icy conditions. Activity : The Case of Murder in the Desert
YUMA, Ariz. – The Pima County Medical Examiner has identified a woman whose body was found in the in the Adair Park, by the Gila River in October as 26-year-old Betty Fox of Yuma, Ariz. Next of kin notification has been made. The park has rifle, pistol and archery ranges are the center points of the facility. On Wednesday, October 15, at approximately 12:30 a.m., the Yuma County Sheriff’s Office responded to a report of a deceased person in the Park. On Saturday, October 18, Yuma County Sheriff’s Office Investigators were present during Fox’s autopsy. The Pima County Medical Examiner’s autopsy revealed that Fox had a single gunshot wound to the chest that resulted in her death. On October 15, the temperature in Yuma was 90oF. When discovered the body was at the ambient temperature. The victim was seen filling up gas at 8:00 am and used her Visa to pay for gas. Then at 10:00 am the same card was used to buy a $3,000 Nikon camera online.
1) Can you determine the time of death?Answer: From the body temperature, death occurred 3 and ½ hour before the time of discovery. So she must have been killed around 9:00 AM2) What clues/conclusions can you infer from this?
Answer: The person who killed her probably stole her credit card and bought the item
Note to the teachers: Students have to be reminded to convert temperatures from Fahrenheit to Celsius using either a web app such as http://www.mathsisfun.com/temperature-conversion.html or the formula( Deduct 32, multiply by 5, then divide by 9)
Homework for Lesson 4
Exercise 1:
The graph of courses and prerequisites (Figure 21) is not properly drawn to show precedence between courses. If you notice, you can see arcs pointing up, down or crossing.
32
1- Redraw this graph so that all arcs are pointing right.2- Find a topological ordering that is different from the one presented in class.
Solution: Many combinations are possible.
Teacher Note: The teacher can ask for which classes can be taken in the same semester, so as to introduce the topic of the next exercise.
Exercise 2:
Figure 10 is a precedence diagram for a particular set S of jobs.
a. If one person is to perform all of the jobs, one after the other , find an order in which the jobs can be done.
Answer : (1,9 10,6,7, 5,4,3,8,2)
b. Suppose enough people are available to perform any of the jobs simultaneouslyi. if each job requires one day to perform which is the least number of days needed to
perform all ten jobs.
Answer: ({1,9}, (10,6},7,{3,5},4,{8,2}), jobs contained in a set can be performed in parallel. This is called the critical path. 6 days
ii. What is the maximum number of jobs that can be performed at the same time.
Answer: 4
Exercise 3:
A large department is having a Fourth of July sale and plans to send an eight-page advertisement for it. To be effective, this advertisement must be mailed at least 10 days before July 4th. A table is given
33
telling the various tasks that have to be done and how much each task takes together with the tasks that must precede each:
Unfortunately it is already June 2sd and there are concerns whether the advertisement can be gotten in time. Will there be enough time for the advertisement to be delivered before July 4 th ?
Answer: No
Exercise 4:
Mama Bear wants to teach Joey to be responsible and clean his room. She sets up a schedule of tasks for him and specifically requests that he does all of them by himself and not ask his best friend Alex, who is visiting to help. This table shows all tasks Joey is supposed to do
Task Preceding tasks TimeA:Gather toys None 15 minutesB:Gather dirty clothes None 10 minutesC: Put toys away A 5D: Sort dirty clothes into whites and color
B 15
E: Remove dirty sheets from bed None 5 minutesF: Bring clean sheets from closet None 5 minutesG: Make Bed E, F 10 minutesH: Take dirty laundry (clothes and sheets) to washing machine
E,D 3 minutes
I: Wipe dust from furniture G, C 8 minutesJ: Clean floor J 12 minutes
34
Task Name Task Time in Days Preceding taskA Choose items-Managers 3 NoneB Choose items-Buyers 2 NoneC Choose and price items 2 A, BD Prepare art 4 CE Prepare Copy 3 CF Design Advertisement 2 D,EG Compile mailing list 3 CH Print Labels 1 GI Print Advertisement 5 FJ Affix Labels 2 H, IK Deliver Advertisement 10 J
After one hour, Joey is done and his room is clean as a whistle… Did Joey clean the room by himself or did he get help from Alex ? Answer: Alex helped
Exercise 5:
Teacher Note: Information in this exercise is excepted from the 10 Tell-Tales of Deception (http://www.fraud-magazine.com/article.aspx?id=4294971184)
For each of the following witness statements, build the timeline of events as a precedence graph.
Statement 1:
"I was driving east on Elm Street at about 4:00 on Tuesday. I was on my way home from the A&P supermarket. The traffic light at the intersection of Elm and Patterson was red, so I came to a complete stop. After the light turned green, I moved slowly into the intersection. All of a sudden, a car ran into me. The other driver didn't stop, so I drove home and called my insurance agent."
Statement 2:
" I was giving a bath to my son upstairs when we heard one or possibly two people enter the house. Then my husband said “I am a cop” , then 2 guns shots . The house was ransacked, I think it was a home invasion or robbery. We had devised a plan for those cases and my husband told me to hide in the master’s bathroom. So we stay there until we hear no noise. I swear to God I was shaking like a leaf”
Besides a crime timeline, investigators also rely on other techniques to ascertain whether a suspect or a witness is telling the truth. Suspects and witnesses often try to mislead investigators when they make statements. However, law enforcement agents are also trained to recognize the signs of deception in statements. Some of these signs are:
1. Lack of self-reference: People who try deceive usually avoid using the pronoun “I” in their statements
2. Verb tense: using present tense to describe events that happened in the past3. Answering questions with questions4. Mean length of utterances: Sentences in casual speech tend to have between 10 and 15
words. When a person feels anxious about an issue, their sentences are significantly shorter or longer than the norm.
5. Equivocation: The subject avoids an interviewer's questions by filling his or her statements with expressions of uncertainty, words such as: think, guess, sort of, maybe, might, perhaps, approximately.Noncommittal verbs are: think, believe, guess, suppose, figure, assume. Equivocating adjectives and adverbs are: sort of, almost, mainly, perhaps, maybe, about. Vague qualifiers are: you might say, more or less.
6. Oaths: Deceptive subjects try very hard to convince interviewers that what they say is true
35
In order to decide whether a statement is truthful or deceptive, we assume that at least 3 out of the 6 signs must be present in statements. Reconsider the statements above and decide which one is truthful and which one is a lie. ( Answer: Statement 1 is true, Statement 2is a lie)
Acknowledgment
The authors would like to thank Dr. Gene Fiorini for allowing us to include, verbatim, material he created and presented to the group at the CCICADA Reconnect 2014 workshop (all of the Lesson 1 material). The authors would also like to thank Dr. Midge Cozzens for organizing the CCICADA Reconnect 2014 workshop and the Department of Homeland Security for funding the workshop.
References:
[KB] http://photonics.cusat.edu/Article4.html
[US] http://motls.blogspot.com/2013/05/short-questions-often-require-long.html
[World] http://www.mapsnworld.com/world-map.html
S.S Epp, Discrete Mathematics with Applications, 3rd Edition, Thompson, 2004
Powerpoint slides presented by Dr. Gene Fiorini, Associate Director of DIMACS, Rutgers University, at CCICADA Reconnect 2014
Anne-Laure Terrettaz-Zufferey, Fre´de´ric Ratle, Olivier Ribaux, Pierre Esseiva, Mikhail Kanevski; Pattern detection in forensic case data using graph theory: Application to heroin cutting agents; Forensic Science International 167 (2007) 242–246
www.cse.cuhk.edu.hk/.../ 08L24.ppt
How to make a perfect milkshake http://blog.foodnetwork.com/fn-dish/2011/08/how-to-make-the-perfect-milkshake/
A graph oriented approach for network forensic analysis. Wei Wang, PhD dissertation (2010)
36
Richard Johnsonbaugh, Discrete Mathematics, 6th Edition, Prentice Hall, 2005.
Kenneth Rosen, Discrete Mathematics and Its Applications, 5th Edition, McGraw-Hill, New York, New York, 2003.
http://penguin.ewu.edu/cscd320/Topic/Graph/Travail.ppt
Peter Tannenbaum, Excursions in Modern Mathematics, 5th Edition, Pearson Prentice-Hall, Upper Saddle River, New Jersey, 2004
K.H. Rosen “ Discrete Mathematics and its Applications”, Sixth Edition, McGraw Hill. The 10 Tell-Tale Signs of Deception http://www.fraud-magazine.com/article.aspx?
id=4294971184 http://www.cs.princeton.edu/courses/archive/spr13/cos226/lectures/42DirectedGraphs.pdf http://courses.cs.washington.edu/courses/cse326/03wi/lectures/RaoLect20.pdf http://kids.mysterynet.com/solveit/ http://www.practicalhomicide.com/Research/LOmar2007.htm http://www.mathsisfun.com/temperature-conversion.html
37


![[Smith, Kohn, 2000] Nonparametric Seemingly Unrelated Regression](https://img.pdfslide.us/doc/110x75/577cd1081a28ab9e7893727a/smith-kohn-2000-nonparametric-seemingly-unrelated-regression.jpg)
