Embed Size (px)
Citation preview
COMPREHENSIVE PLANfor the
TOWN of AMHERST
100a 1#974 4 4
srr_______________________
N I -/o I 1VP.73 A' - S i A ' . '9 rAir. 'A. .0.4 a. a%r.: 17Ba Firr /Tlt 92, r
Lotter '•r / . . .r : A '1°.2f ,N Jba:wet- 's p. Jar
.',fern %Ls,. Ave i
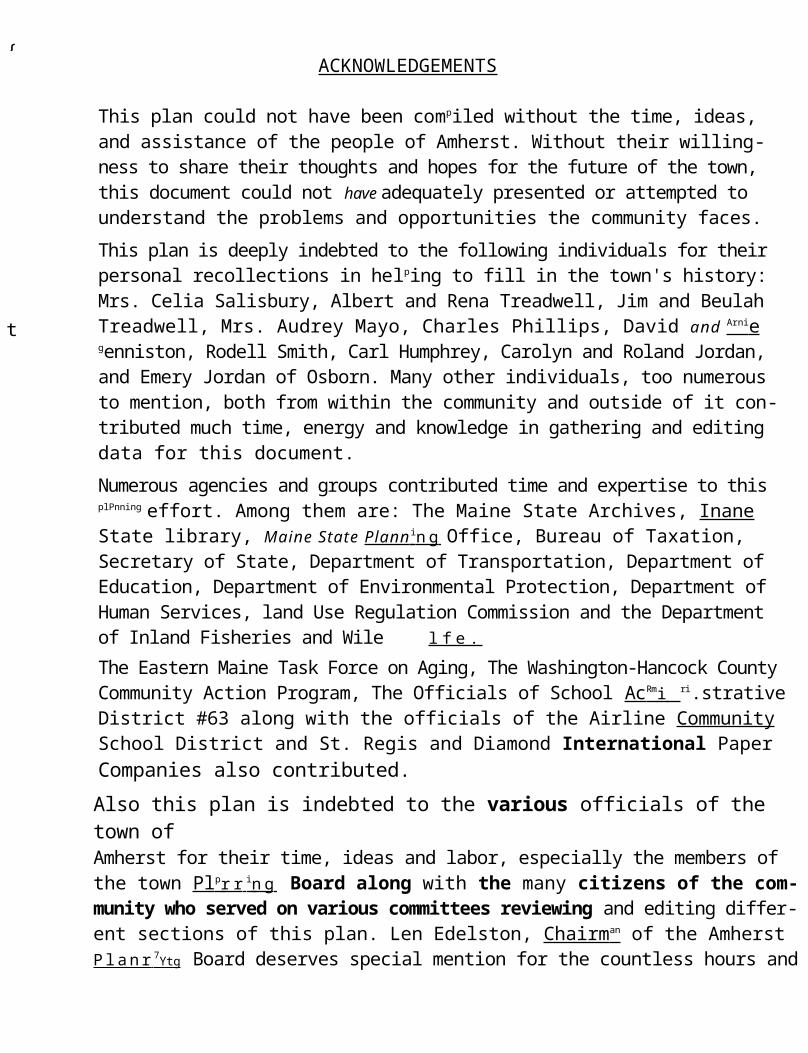
ACKNOWLEDGEMENTS
This plan could not have been compiled without the time, ideas, and assistance of the people of Amherst. Without their willing-ness to share their thoughts and hopes for the future of the town, this document could not have adequately presented or attempted to understand the problems and opportunities the community faces.
This plan is deeply indebted to the following individuals for their personal recollections in helping to fill in the town's history: Mrs. Celia Salisbury, Albert and Rena Treadwell, Jim and Beulah Treadwell, Mrs. Audrey Mayo, Charles Phillips, David and Arni e
genniston, Rodell Smith, Carl Humphrey, Carolyn and Roland Jordan, and Emery Jordan of Osborn. Many other individuals, too numerous to mention, both from within the community and outside of it con-tributed much time, energy and knowledge in gathering and editing data for this document.
Numerous agencies and groups contributed time and expertise to this plPnning effort. Among them are: The Maine State Archives, Inane State library, Maine State Plann i n g Office, Bureau of Taxation, Secretary of State, Department of Transportation, Department of Education, Department of Environmental Protection, Department of Human Services, land Use Regulation Commission and the Department of Inland Fisheries and Wile l f e .The Eastern Maine Task Force on Aging, The Washington-Hancock County Community Action Program, The Officials of School Ac Rm i ri.strative District #63 along with the officials of the Airline Community School District and St. Regis and Diamond International Paper Companies also contributed.Also this plan is indebted to the various officials of the town ofAmherst for their time, ideas and labor, especially the members of the town Pl p r r i n g Board along with the many citizens of the com-munity who served on various committees reviewing and editing differ-ent sections of this plan. Len Edelston, Chairm an of the Amherst P la n r 7 Ytg Board deserves special mention for the countless hours and immense amount of work he has contributed to this document.
{
t

CONTENTS
I. INTRODUCTION
A. Background 1B. Approach 2C. Purpose 3D.E.
Scope 4
II.F. Summary of Recommendations
8
REGIONAL PERSPECTIVE
A. IntroductionB. Immediate Region 8C. Influences External to the Immediate Region
18
III. HISTORIC PERSPECTIVE 20
IV. HUMAN COMMUNITY
34A. IntrodutionB. Amherst's Historic Population Trends 34C. Recommendations 44V. INFRASTRUCTURE
{A. Introduction 45B. Existing Situation 45C. Recommendations 84
CVI. PHYSICAL ENVIRONMENT
92A. IntroductionB. Existing Situation 92C. Recommendations 113
VII. ACTION PROGRAM
115A. IntroductionB. Planning Action Program 115C. Government Action Program 116
VIII. APPENDICES
A. Attitudinal Survey ResultsB. Bibliography
L.
Page
MAPS AND FIGURES Pac'
II. REGIONAL PERSPECTIVE
Figure I. Summary of Ratings for The Soils ofHancock County 7
Figure 2. Demographic Characteristics 9Figure 3. Elements of Population Change 10Figure 4. Employed Labor Force by Industry 12Figure 5. Employed Population by Occupation 13Figure 6. Place of Employment 14Figure 7. Per Capita Money Income 15Map 1. Regional Transportation Map 16Map 2. Regional Land Use Map 17Figure 8. Comparative Population Figures 19
III. HISTORIC PERSPECTIVE
Map 3. Hancock County - Grants and Charters 21
IV. HUMAN COMMUNITY
32Figure 9. Historical PopulationFigure 10.Amherst's Population From Incorpora-
tion and Future Projections 33Figure 11. Comparison of Age Distribution 36Figure 12. Population by Age Group, 1970-75 37Figure 13. Causes of Recent Population Growth 39Figure 14. Net Migration 40Figure 15. Population Density, 1975 41Figure 16. Population Trends 42Figure 17. Local Commerce and Industry 43
V. INFRASTRUC! u±tE
46Figure 18. Town ValuationFigure 19. Town Appropriation 47Figure 20. Real Estate Tax 48Figure 21. Educational vs Noneducational Expendi-
tures 49Figure 22. Educational vs Noneducational Expendi-
tures Graph 50Figure 23. Relative Financial Ability 51Figure 24. Tree Growth Land - Tree Growth Valuation 52Figure 25. 1977 Tax on Land and Buildings 53Figure 26. Social Characteristics - Public School
rollment, 1970 and 1977 56Figure 27. Amherst School nrollments, 1968-1977 57Figure 28. Analysis of Social Cohesiveness 59Figure 29. Social-Religious-Civic Organization 60Map 4. Highways and Roads in Amherst 63Figure 30. Commrun.ications Services 65Figure 31. Transportation 69Figure 32. Housing Count - 1978 72

Page
. V. INFRASTRUCTURE (continued)
Figure 33. Housing Types 73Figure 34. Housing Survey 74Figure 35. Year Structure Built - Value of Housing 75Figure 36. Housing Starts 76Figure 37. Housing Need Analysis 77Figure 38. Project?rlg the Number of Dwelling Units
in Amherst 78Figure 39. Land Subdivision Activity 79Figure 40. Housing Map Symbols 80Map 5. Housing in Amherst 81Map 6. Blueberry Land in Amherst 83Figure 41. Land Ownership Patterns 85Figure 42. Land Use and Housing Survey 86Map 7. Forest Land Ownership 87
VI. PHYSICAL ENVIRONMENT
Map 8. Union River Drainage 91Figure 43. Climate Monograph 93Figure 44. Average Temperature and Precipitation94Figure 45. Bedrock of Amherst 97Figure 46. General Soil Description 100Map 9. Resource Protection District 103Map 10. Vegetation Cover 107Map 11. Deer Winter Yards 109Figure 47. Unique Scenic or Natural Areas -
Historic Sites/Buildings 11'1Map 12. Natural and Scenic Areas 112
I N T R O D U C T I 0 N
- - - - - - - - - - - -
I

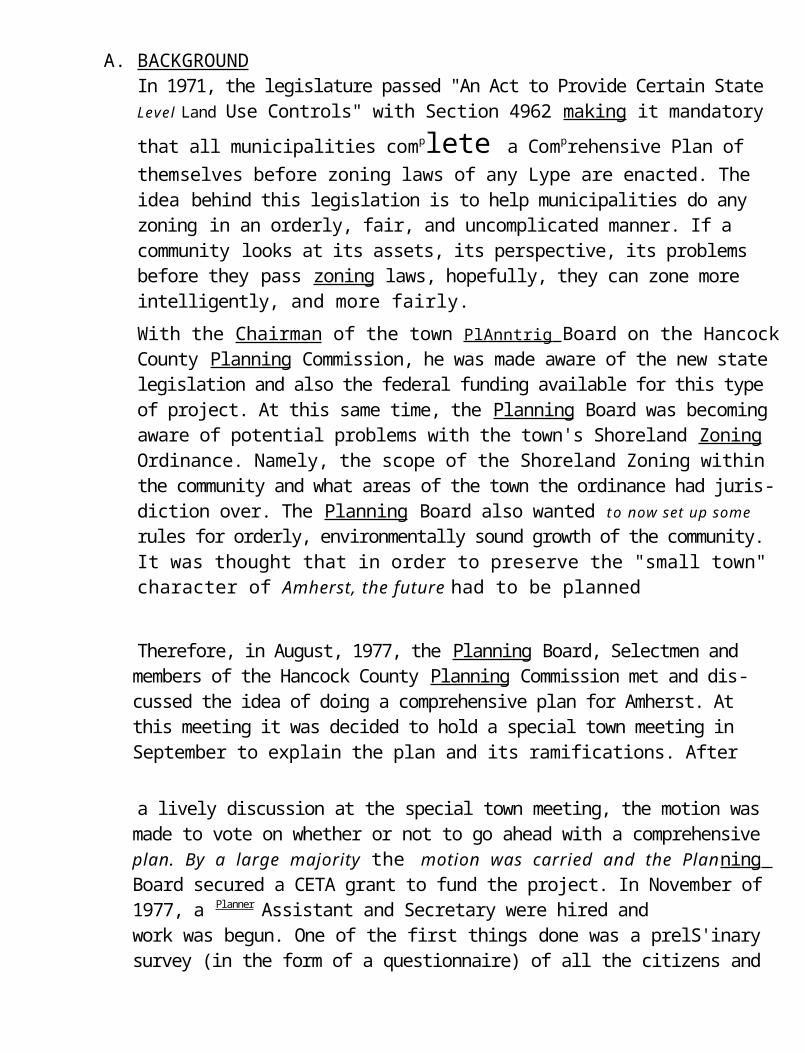
A. BACKGROUNDIn 1971, the legislature passed "An Act to Provide Certain State Level Land Use Controls" with Section 4962 making it mandatory that all municipalities complete a Comprehensive Plan of themselves before zoning laws of any Lype are enacted. The idea behind this legislation is to help municipalities do any zoning in an orderly, fair, and uncomplicated manner. If a community looks at its assets, its perspective, its problems before they pass zoning laws, hopefully, they can zone more intelligently, and more fairly.With the Chairman of the town PlAnntrig Board on the Hancock County Planning Commission, he was made aware of the new state legislation and also the federal funding available for this type of project. At this same time, the Planning Board was becoming aware of potential problems with the town's Shoreland Zoning Ordinance. Namely, the scope of the Shoreland Zoning within the community and what areas of the town the ordinance had juris-diction over. The Planning Board also wanted to now set up some rules for orderly, environmentally sound growth of the community. It was thought that in order to preserve the "small town" character of Amherst, the future had to be planned
Therefore, in August, 1977, the Planning Board, Selectmen and members of the Hancock County Planning Commission met and dis-cussed the idea of doing a comprehensive plan for Amherst. At this meeting it was decided to hold a special town meeting in September to explain the plan and its ramifications. After
a lively discussion at the special town meeting, the motion was made to vote on whether or not to go ahead with a comprehensive plan. By a large majority the motion was carried and the Plan-ning Board secured a CETA grant to fund the project. In Novem-ber of 1977, a Planner Assistant and Secretary were hired andwork was begun. One of the first things done was a prelS'inary survey (in the form of a questionnaire) of all the citizens and land owners in Amherst. The questionnaire was designed to pro-vide feedback to the Planning Board on how the townspeople felt on numerous issues.
The Comprehensive Plan is designed to provide the citizens of Amherst with a framework upon which to build the town's future. The Plan provides an overall strategy for the citizens and town government to meet their problems, needs and objectives. The P l a n n i n g Board has identified the following as the major plan-ning problems and planning needs:
Problems1. Amherst is currently inadequately prepared to contro l growth
at a local level.2. Amherst is the third fastest growing town in Hancock County.3. The Tree Growth Tax Law has produced an inequitable
tax burden upon the residents of Amherst.4. Because of weak communication l ines, there exists
inadequate community organization and act iv i ty .5. Confusion is created by the present Shoreland Zoning Ordinance. Needs1. An ongoing, action-oriented planning process with an
action program based upon locally chosen alternatives.2. Land use regulations.3. Code Enforcement Officer.4. Recreation, communication and other activity that may i m i
to the community.
5. Amendment and revision of Shoreland Zoning
Ordinance. B. APPROACHThe Planning Board has established committees of townspeople to review the different sections of the plan. Each committee ischaired by a member of the Planning Board. As the P l a n n i n g
Assistant submits the report on each section, the committee reviews the material and draws up various recommendations for implementation by the town. The committee process is designed to provide as much ongoing citizen participation as possible to make this plan truly a document of the town, not something done by distant bureaucrats.
At the completion of the plan, i t w i l l be submitted to the townspeople as a whole to be voted upon for acceptance or not at a town meeting.
C. PURPOSE
The purpose of this planning effort is to:1. Understand and describe the existing physical environment,
human community and community infrastructure of Amherstand the internal and external forces which affect the com-munity now, and which may affect i t s future;
2. Understand and describe the attitudes, opinions and aspira-
tions of the members of the Amherst community toward their community, its problems and its future;
Understand and describe for the members of the Amherst community the problems faced by the community and its probablefuture, assuming that certain conditions, trends, pressures, and demands continue;
4. Understand and describe for the members of the Amherst cammunity the options and alternatives available to them interms of alternative futures from which they will be able to more effectively select the particular future they wish to pursue; and
5. Prepare, based upon an understanding of A through D above, an action program for the members of the Amherst communitydesigned to systematically achieve the future they have selected.
D. SCOPEThe Comprehensive Plan is designed to be a thorough study of all aspects of Amherst that may be relevant and necessary for plannirg. These various aspects have been organized under the following headings: town history, town infrastructure (taxation, town government, schools, and services) human community, regional perspective, physical environment, possible futures of Amherst, and a recommended action program. The organization of this plan was derived for the most part from forms suggested by the Hancock County Planning Commission, Committees of local residents were formed to discuss and summarize the information contained under each section. In addition to local material that was researched and compiled by the Planning Assistant, a number of other sources were used, among these were: Maine State Archives, U. S. Bureau of Census, Diamond International Paper Company, Bangor Daily News, Mine State Library and many more.
3.
As a result of gathering this information and numerous meetings of the planning board, selectmen and townspeople, the Comprehensive
Plan is drawn together to present a detailed description of Amherst as it is today and probable changes that may be encountered in the future. To summarize, the Comprehensive Plan is an attempt to compile the information that is necessary for the residents of Amherst to plan effectively and democra-tically for their future.
The Comprehensive Plan in itself is not an ordinance but simply a document to present the problems, needs and possible solutions to the townspeople. In order for the plan to be implemented, the townspeople must provide the follow through. The Comprehen-sive Plan is the groundwork to base any further ordinances upon,
E. SUMMARY OF FINDINGSData gathered from state, county and local sources along with questionnaires returned by the townspeople have found out the following about the town of Amherst:
1. The town's population is once again growing and is projected to continue to grow.
2. The housing structures within the town are presently adequate for the town's population and are generally in good condition. Since 1965 the trend in new housing structures in Amherst has been that for each new frame house constructed there are two new house trailers.
3. The Tree Growth Tax law coupled with large increases in state property valuation have produced significant tax increases for local residents. The town's relative financial ability (see Pig. #23) reflects that the town isn't getting enough support from non-residents on taxes.
4 . Amherst has a greatly varied, rich and beautiful physical environment which the townspeople would like to see protected "as long as we can, in as pure a state as w e c a n " .
5. Three non-resident timber holding corporations own, by far, the majority of the land within the town.
6. The present grammar school is already crowded and with future population growth expected, the town is faced with increased school costs for school expansion.
7. There is a lack of organized recreation/social interaction within the community.
8. The economic base of the community is quite diversified withpeople employed in a great number of different types of jobsprofessional, clerical, laborer). Townspeople are employed

both within the community and in a number of other localities.
8. (continued)
The town seems to have a healthy, growing per capita income especially in view of the fact that 25% of the population is retired. There does exist the possibility of the town's tax base erroding as the increased mobile home units begin to age and depreciate. The town has a fairly large amount of money in its town surplus account, especially in view of the present inflation rate.
9. Amherst has a traditional town meeting-selectman form of government. Local government in Maine is losing some of its autonomy because of regional and state regulations.
10, There are a number of structures in Amherst that are of local historical interest.
11. There are presently three sources of information concerningtown events: a. word of mouth, b. posted notices of
town meetings, and 3. the Union River Electric Co-op news-letter.
SUMMARY OF RECOMENDATIONS
The following list of recommendations for the Comprehensive Plan for the town of Amherst was produced as a result of study of questionnaires and meetings with the people of Amherst, and suggests concern in two major areas: that the rural setting of the town is a major asset which must be protected; and that planning in Amherst should not be such as restricts or inhibits individuals in the use or development of their own land.
The Plan, then, is designed to assure that land use in Amherst be locally determined and directed; that forces from without the town boundaries, that is, public government and private enterprise, not be allowed to prevail in determinations regard-ing the land use and development in this town.
The following recommendations are presented in summary form and are more fully described after each section. They are an attempt to deal with identified problems and needs and to explore exist-ing opportunities.
1. Infrastructurea. The town should adopt a site plan review ordinance.b. A subdivision moratorium should be declared until
a subdivision ordinance is implemented.A Code Enforcement Officer should be either
elected or appointed, on either a loca l or regional basis.
infrastructure (continued)d. Town officials should join together with other
regional municipalities in a Joint effort to eliminate the tax burden created by the Tree Growth Tax Law.
e. The Amherst tax map of 1946 should be revised so that it is brought up to date.
f. The Shoreland Zoning Ordinance of 1974 should be revised, so that it is not overly restrictive, and so that it is in consistent with current planning efforts.
g. New positions in town government should be created to meet the need for planning, recreation and preservation of historical structures.a. Planning Board of Appealsb. Conservation Commissionc. Historical Society
h. Low cost housing should be investigated to explore alternatives to mobile home development. New mobile homes should be placed on permanent foundations.
2. Physical Environment
a. The rural landscape, wildlife habitats and scenic areas of Amherst should be preserved.
b. Timber practices should be consistent with such conservation.c. Areas that are not suitable, because of excessive grade
wetland characteristics or proximity to shoreland should remain in their natural state.
d. Any agricultural practices, such as pesticide spraying, which may seriously and adversely effect the environment should be carefully reviewed and regulated.
3. Human Common i tv a, Encourage growth of recreational activities:
1. More active use of town hall as social center; e. g., movies, dances, etc.
2. BPJ } park.b. Plan for slow population growth.c. Plan to maintain the rural character of Amherst.
R E G I O N A L P E R S P E C T I V E
SI
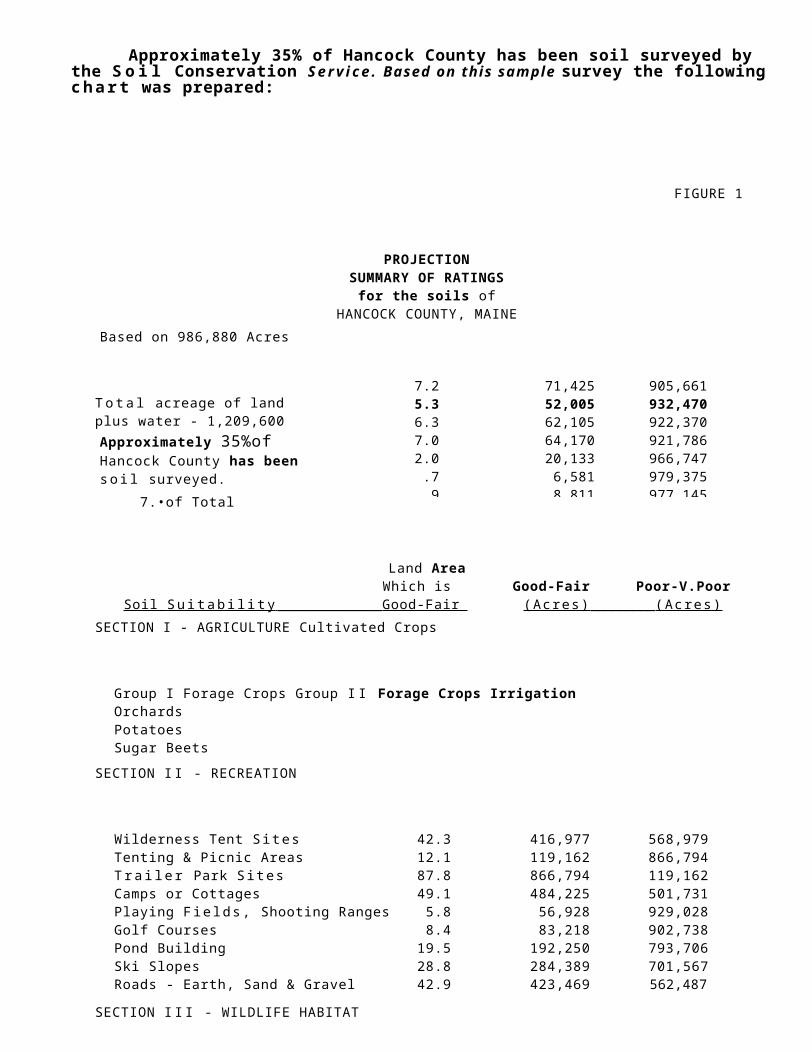
Approximately 35% of Hancock County has been soil surveyed by the S o i l Conservation Serv ice. Based on this sample survey the following char t was prepared:
FIGURE 1
PROJECTIONSUMMARY OF RATINGS
for the soils ofHANCOCK COUNTY, MAINE
Based on 986,880 Acres
T o t a l acreage of land plus water - 1,209,600Approximately 35%of Hancock County has been so i l surveyed.
7.•of Total
Land AreaWhich is Good-Fair Poor-V.Poor
Soil Su i t ab i l i t y _____________________Good-Fair (Acres) ____________(Acres)SECTION I - AGRICULTURE Cultivated Crops
Group I Forage Crops Group I I Forage Crops IrrigationOrchardsPotatoesSugar Beets
SECTION I I - RECREATION
Wilderness Tent S i tes 42.3 416,977 568,979Tenting & Picnic Areas 12.1 119,162 866,794T ra i l e r Park S i tes 87.8 866,794 119,162Camps or Cottages 49.1 484,225 501,731Playing F ie lds , Shooting Ranges 5.8 56,928 929,028Golf Courses 8.4 83,218 902,738Pond Building 19.5 192,250 793,706Ski Slopes 28.8 284,389 701,567Roads - Earth, Sand & Gravel 42.9 423,469 562,487
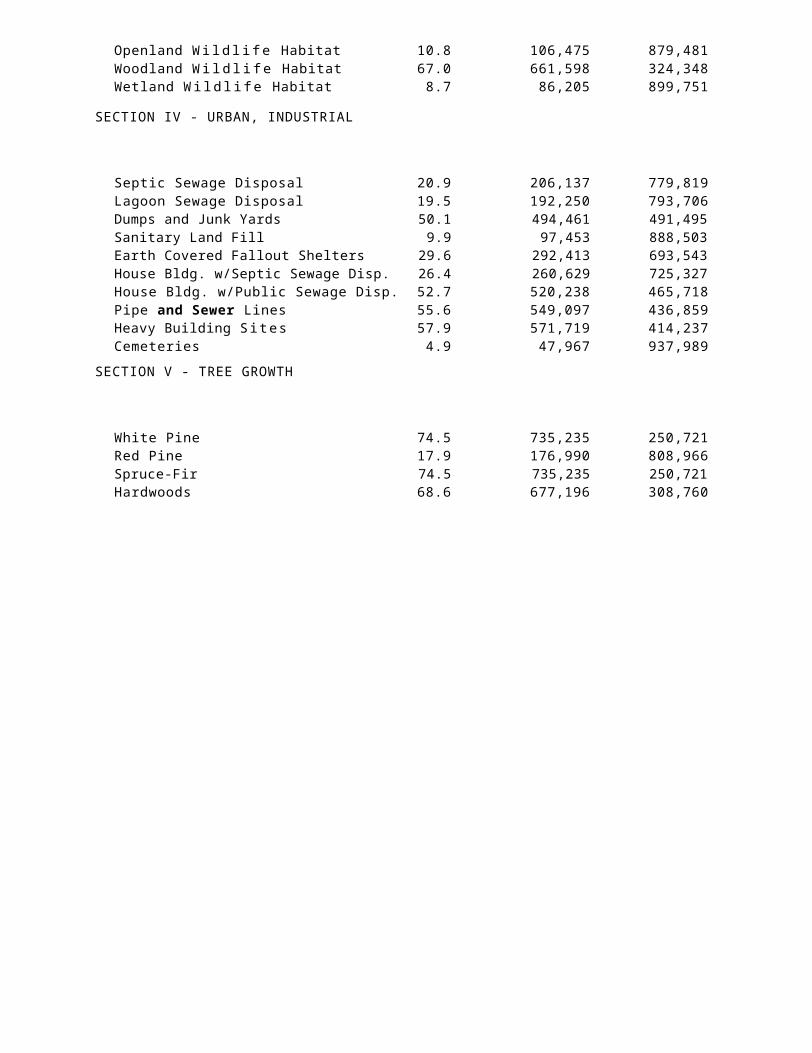
SECTION I I I - WILDLIFE HABITAT
Openland W i l d l i f e Habitat 10.8 106,475 879,481Woodland W i l d l i f e Habitat 67.0 661,598 324,348
7.2 71,425 905,6615.3 52,005 932,4706.3 62,105 922,3707.0 64,170 921,7862.0 20,133 966,747.7 6,581 979,375.9 8,811 977,145

Wetland W i l d l i f e Habitat 8.7 86,205 899,751SECTION IV - URBAN, INDUSTRIAL
Septic Sewage Disposal 20.9 206,137 779,819Lagoon Sewage Disposal 19.5 192,250 793,706Dumps and Junk Yards 50.1 494,461 491,495Sanitary Land Fill 9.9 97,453 888,503Earth Covered Fallout Shelters 29.6 292,413 693,543House Bldg. w/Septic Sewage Disp. 26.4 260,629 725,327House Bldg. w/Public Sewage Disp. 52.7 520,238 465,718Pipe and Sewer Lines 55.6 549,097 436,859Heavy Building Si tes 57.9 571,719 414,237Cemeteries 4.9 47,967 937,989
SECTION V - TREE GROWTH
White Pine 74.5 735,235 250,721Red Pine 17.9 176,990 808,966Spruce-Fir 74.5 735,235 250,721Hardwoods 68.6 677,196 308,760
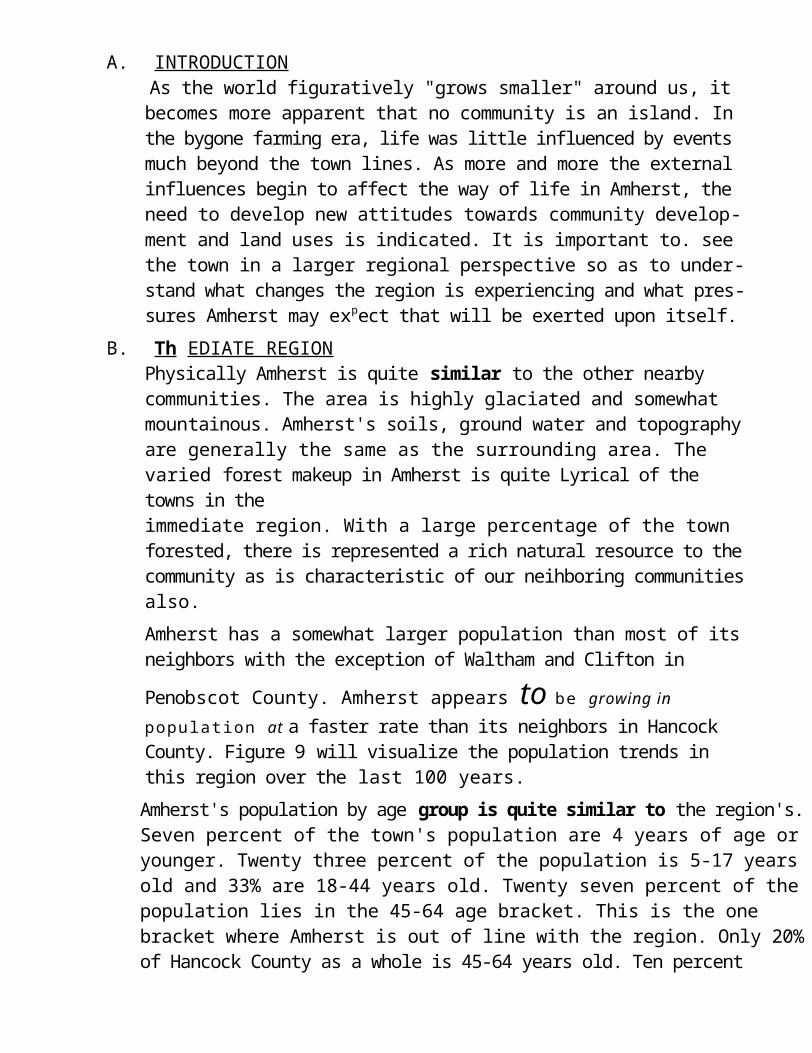
A. INTRODUCTION As the world figuratively "grows smaller" around us, it becomes more apparent that no community is an island. In the bygone farming era, life was little influenced by events much beyond the town lines. As more and more the external influences begin to affect the way of life in Amherst, the need to develop new attitudes towards community develop-ment and land uses is indicated. It is important to. see the town in a larger regional perspective so as to under-stand what changes the region is experiencing and what pres-sures Amherst may expect that will be exerted upon itself.
B. Th EDIATE REGIONPhysically Amherst is quite similar to the other nearby communities. The area is highly glaciated and somewhat mountainous. Amherst's soils, ground water and topography are generally the same as the surrounding area. The varied forest makeup in Amherst is quite Lyrical of the towns in theimmediate region. With a large percentage of the town forested, there is represented a rich natural resource to the community as is characteristic of our neihboring communities also.
Amherst has a somewhat larger population than most of its neighbors with the exception of Waltham and Clifton in
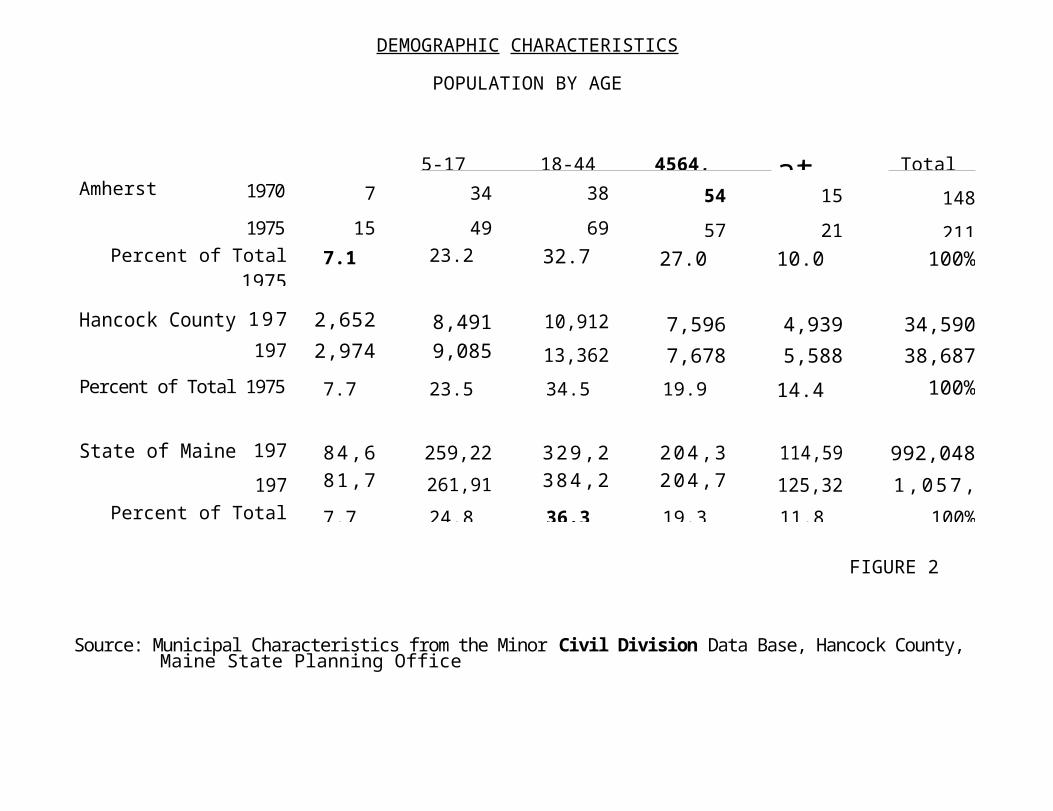
Penobscot County. Amherst appears to be growing in population at a faster rate than its neighbors in Hancock County. Figure 9 will visualize the population trends in this region over the last 100 years.Amherst's population by age group is quite similar to the region's. Seven percent of the town's population are 4 years of age or younger. Twenty three percent of the population is 5-17 years old and 33% are 18-44 years old. Twenty seven percent of the population lies in the 45-64 age bracket. This is the one bracket where Amherst is out of line with the region. Only 20%of Hancock County as a whole is 45-64 years old. Ten percent of the town i s 65+ years of age.
DEMOGRAPHIC CHARACTERISTICS
POPULATION BY AGE
5-17 18-44 4564, at TotalAmherst 1970
1975
7
15
34
49
38
695457
15
21148
211Percent of Total
19757.1 23.2 32.7 27.0 10.0 100%
Hancock County 1970
2,652 8,491 10,912 7,596 4,939 34,590197
52,974 9,085 13,362 7,678 5,588 38,687
Percent of Total 1975 7.7 23.5 34.5 19.9 14.4 100%
State of Maine 1970
84,622
259,225
329,262
204,347
114,592
992,0481975
81,740
261,912
384,266
204,709
125,329
1,057,956Percent of Total
19757.7 24.8 36.3 19.3 11.8 100%
FIGURE 2
Source: Municipal Characteristics from the Minor Civil Division Data Base, Hancock County, Maine State Planning Office
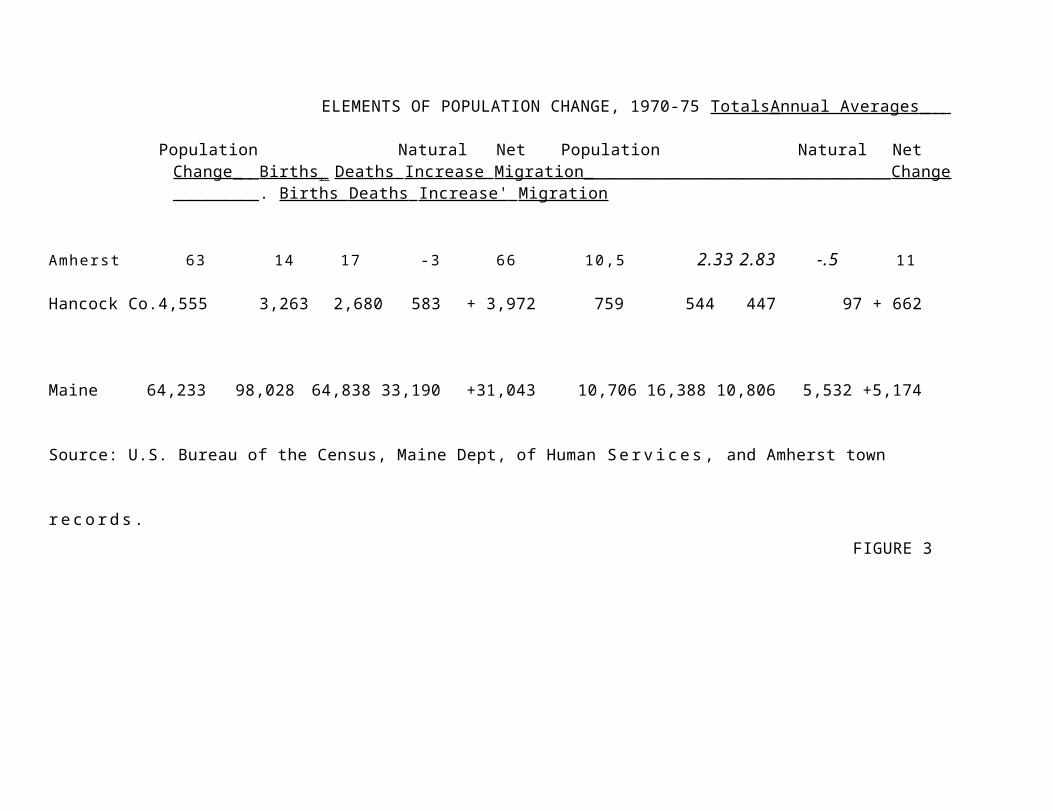
ELEMENTS OF POPULATION CHANGE, 1970-75 Totals _Annual Averages ______
Population Natural Net Population Natural NetChange ___Births , Deaths Increase Migration ______Change ___. Births Deaths Increase' Migration
Amherst 63 14 17 -3 66 10,5 2.33 2.83 -.5 11
Hancock Co. 4,555 3,263 2,680 583+ 3,972 759 544 447 97 + 662
Maine 64,233 98,028 64,838 33,190+31,043 10,706 16,388 10,806 5,532 +5,174
Source: U.S. Bureau of the Census, Maine Dept, of Human Se r v i ce s , and Amherst town r e c o r d s .FIGURE 3

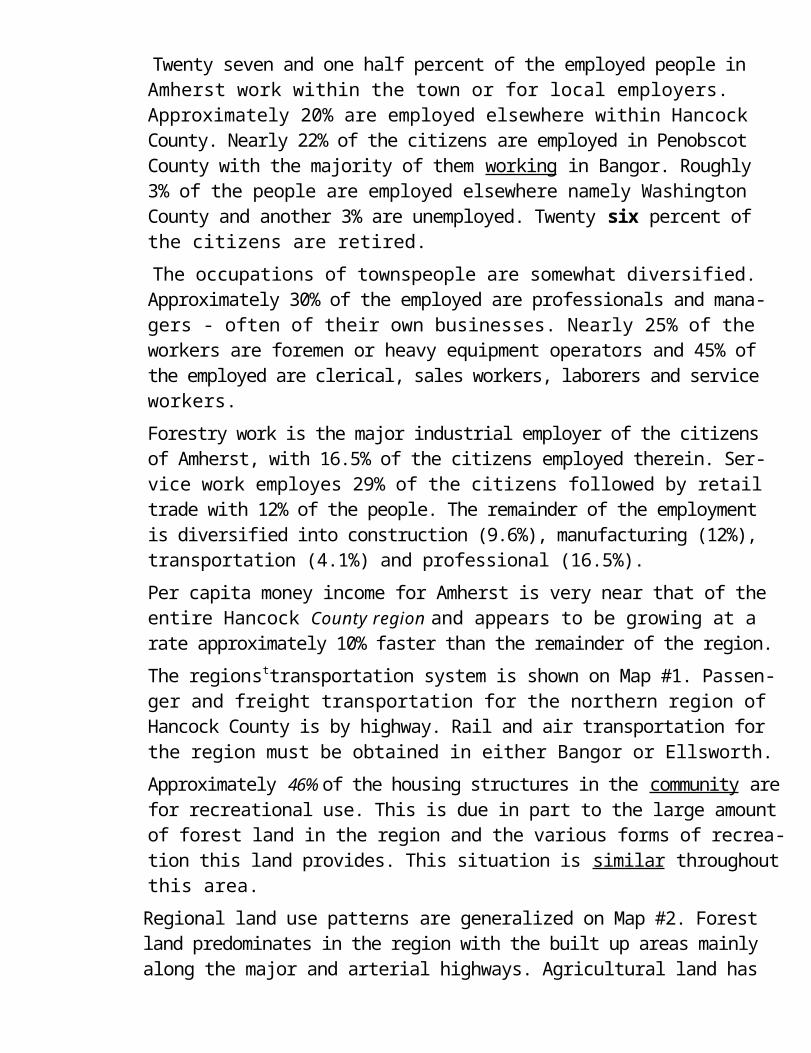
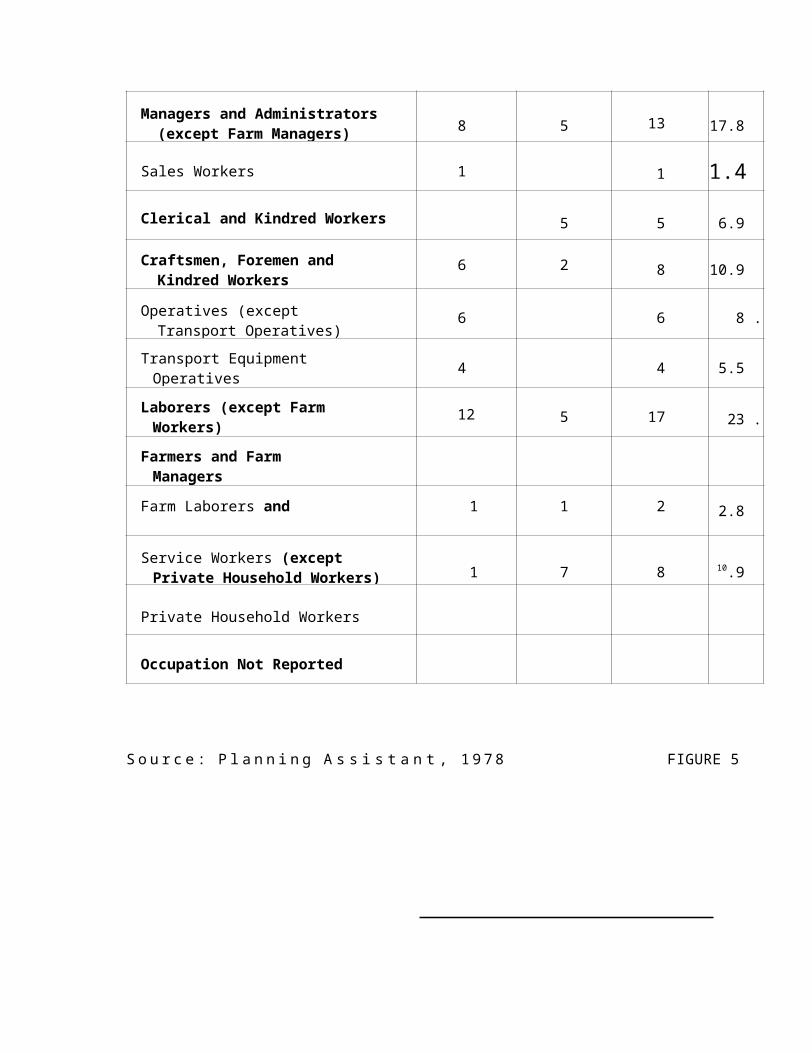
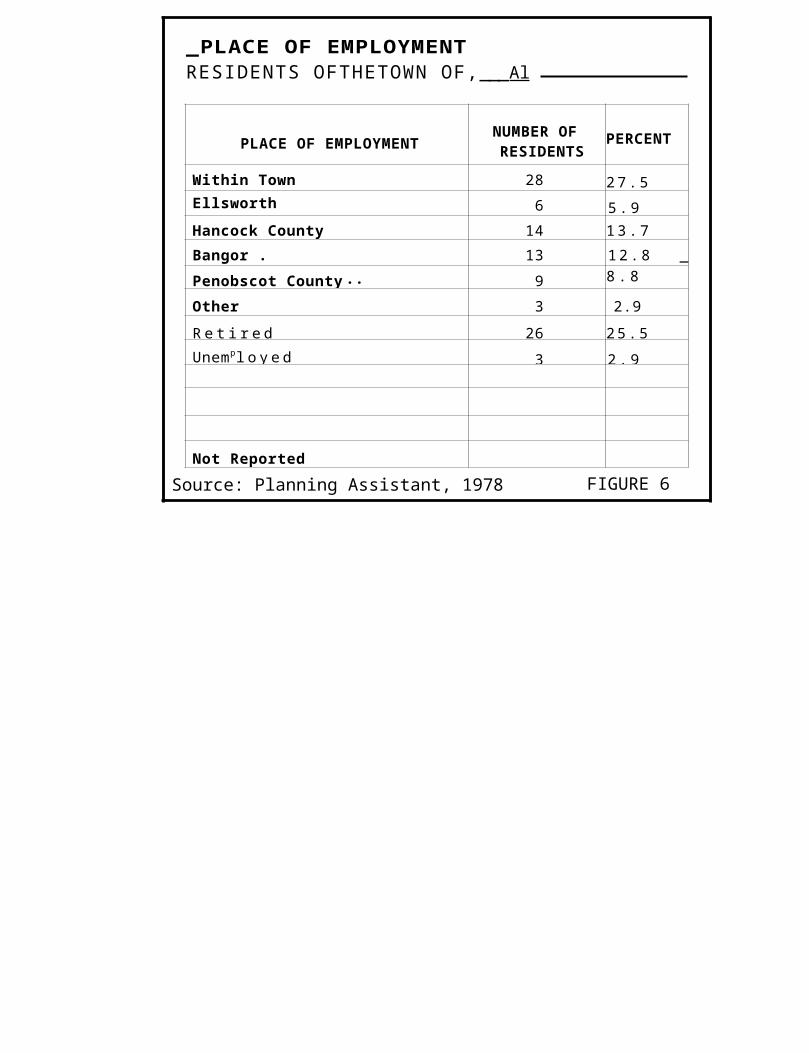
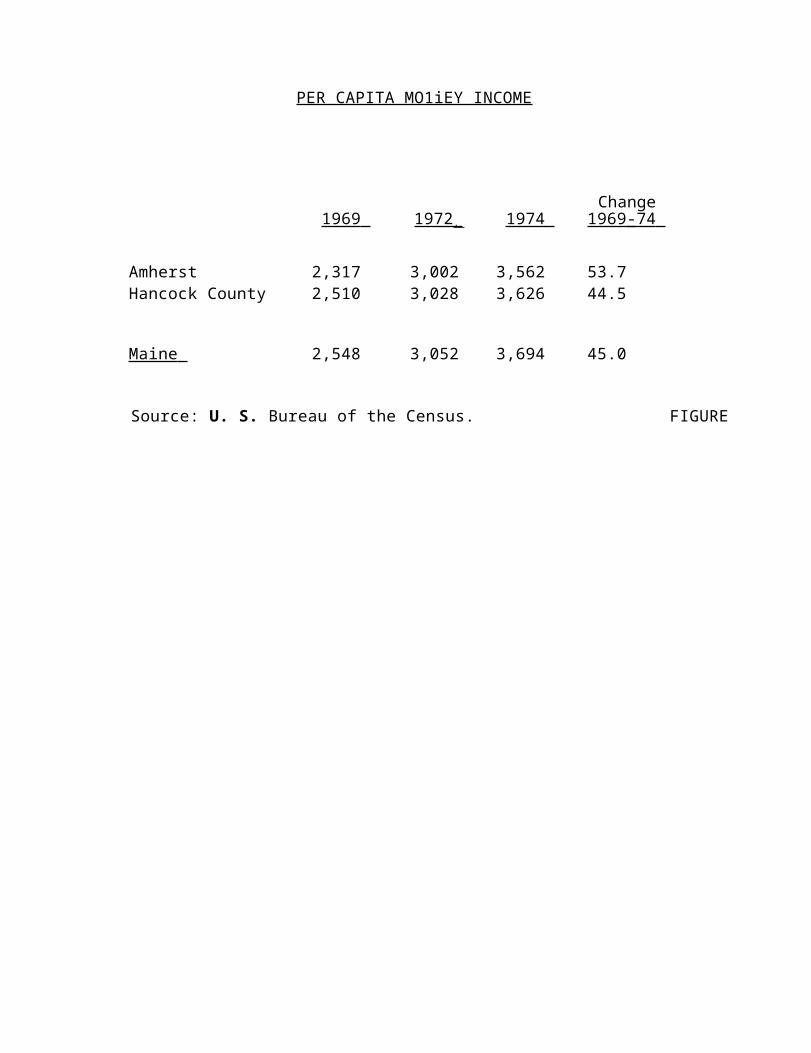
Twenty seven and one half percent of the employed people in Amherst work within the town or for local employers. Approximately 20% are employed elsewhere within Hancock County. Nearly 22% of the citizens are employed in Penobscot County with the majority of them working in Bangor. Roughly 3% of the people are employed elsewhere namely Washington County and another 3% are unemployed. Twenty six percent of the citizens are retired.The occupations of townspeople are somewhat diversified. Approximately 30% of the employed are professionals and mana-gers - often of their own businesses. Nearly 25% of the workers are foremen or heavy equipment operators and 45% of the employed are clerical, sales workers, laborers and service workers.Forestry work is the major industrial employer of the citizens of Amherst, with 16.5% of the citizens employed therein. Ser-vice work employes 29% of the citizens followed by retail trade with 12% of the people. The remainder of the employment is diversified into construction (9.6%), manufacturing (12%), transportation (4.1%) and professional (16.5%).Per capita money income for Amherst is very near that of the entire Hancock County region and appears to be growing at a rate approximately 10% faster than the remainder of the region.The regionsttransportation system is shown on Map #1. Passen-ger and freight transportation for the northern region of Hancock County is by highway. Rail and air transportation for the region must be obtained in either Bangor or Ellsworth.Approximately 46% of the housing structures in the community are for recreational use. This is due in part to the large amount of forest land in the region and the various forms of recrea-tion this land provides. This situation is similar throughout this area.Regional land use patterns are generalized on Map #2. Forest land predominates in the region with the built up areas mainly along the major and arterial highways. Agricultural land has been on the decline for a number of years although this trend
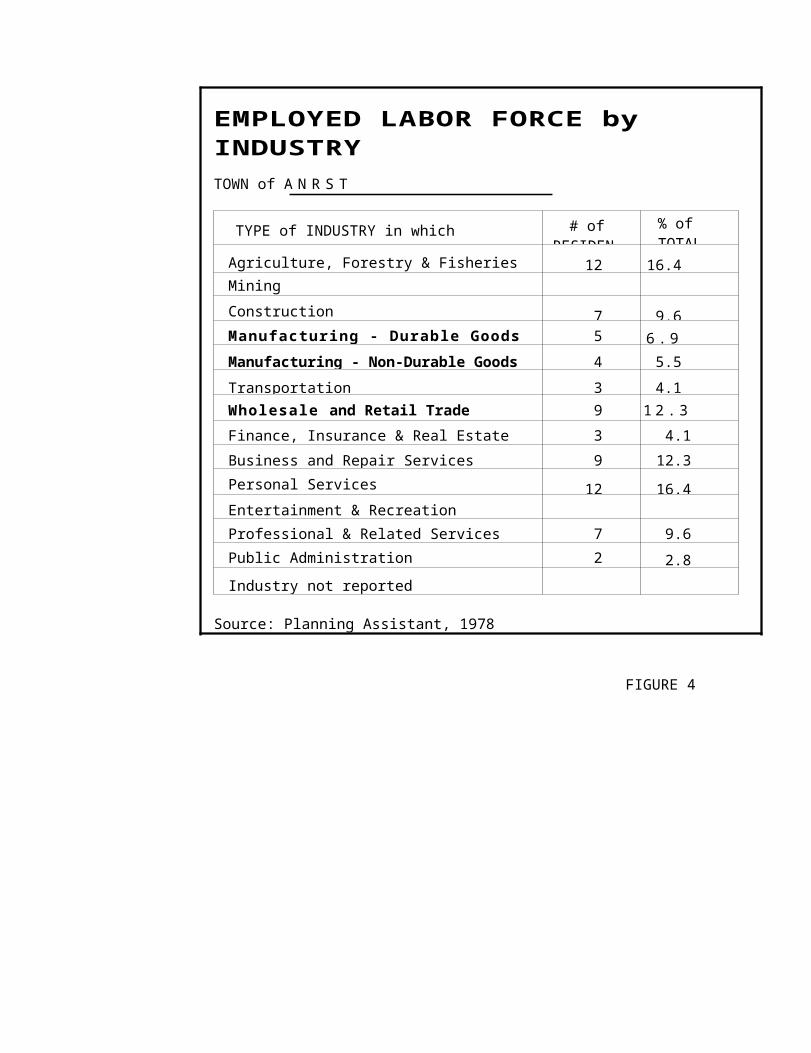
EMPLOYED LABOR FORCE by INDUSTRYTOWN of A N R S T
TYPE of INDUSTRY in which EMPLOYED
# ofRESIDEN
% ofTOTAL
Agriculture, Forestry & Fisheries 12 16.4Mining
Construction 7 9.6Manufacturing - Durable Goods 5 6 . 9Manufacturing - Non-Durable Goods 4 5.5
Transportation 3 4.1
Wholesale and Retail Trade 9 1 2 . 3
Finance, Insurance & Real Estate 3 4.1
Business and Repair Services 9 12.3
Personal Services 12 16.4Entertainment & Recreation ServicesProfessional & Related Services 7 9.6
Public Administration 2 2.8
Industry not reported
Source: Planning Assistant, 1978
FIGURE 4
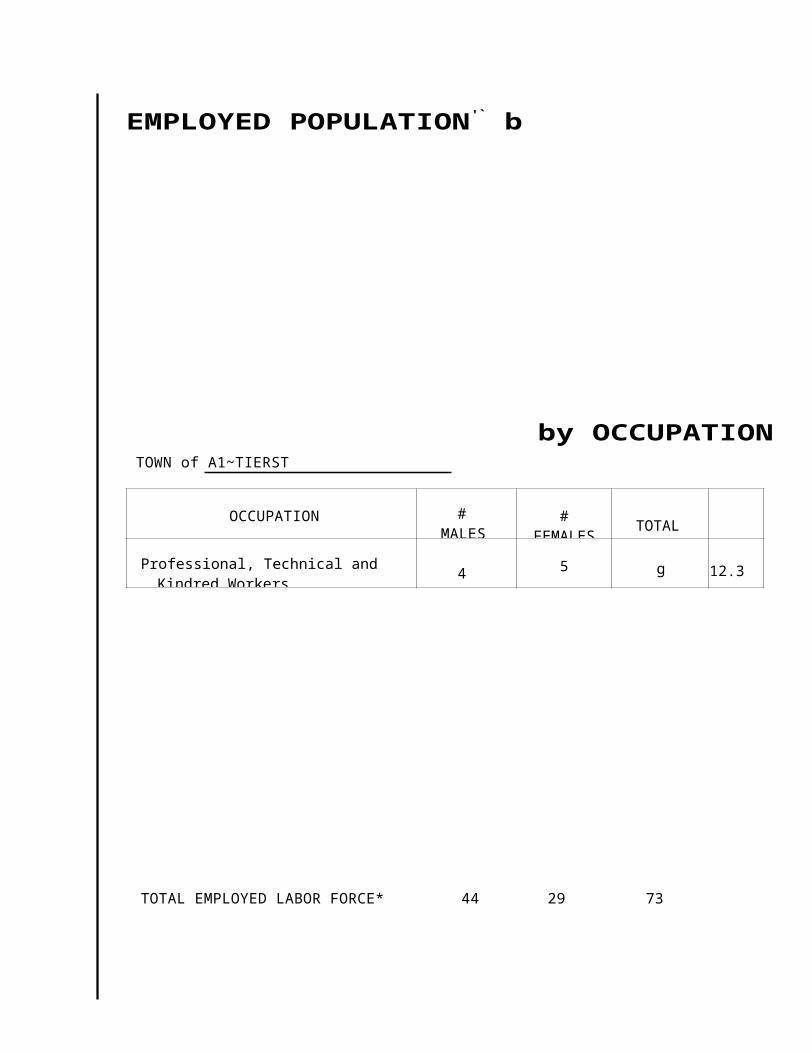
EMPLOYED POPULATION'` b
by OCCUPATIONTOWN of A1~TIERST
TOTAL EMPLOYED LABOR FORCE* 44 29 73
Managers and Administrators(except Farm Managers) 8 5 13 17.8
Sales Workers 1 1 1.4
Clerical and Kindred Workers 5 5 6.9
Craftsmen, Foremen andKindred Workers
6 2 8 10.9
Operatives (exceptTransport Operatives) 6 6 8 . 2
Transport EquipmentOperatives 4 4 5.5
Laborers (except FarmWorkers) 12 5 17 23 . 3
Farmers and FarmManagers
Farm Laborers and
Foremen
1 1 2 2.8
Service Workers (exceptPrivate Household Workers) 1 7 8 10.9
Private Household Workers
Occupation Not Reported
S o u r c e : P l a n n i n g A s s i s t a n t , 1 9 7 8 FIGURE 5

_PLACE OF EMPLOYMENT RESIDENTS OFTHETOWN OF,____Al___RST
PLACE OF EMPLOYMENTNUMBER OFRESIDENTS PERCENT
Within Town 28 2 7 . 5Ellsworth 6 5 . 9Hancock County 14 1 3 . 7
Bangor . 13 1 2 . 8 _
Penobscot County .. 9 8 . 8
Other 3 2.9
R e t i r e d 26 2 5 . 5
Unempl o y e d _ 3 2 . 9
Not Reported
Source: Planning Assistant, 1978 FIGURE 6
PER CAPITA MO1iEY INCOME
Change1969 1972 , 1974 1969 -74
Amherst 2,317 3,002 3,562 53.7Hancock County 2,510 3,028 3,626 44.5
Maine 2,548 3,052 3,694 45.0
Source: U. S. Bureau of the Census. FIGURE 28
29
30
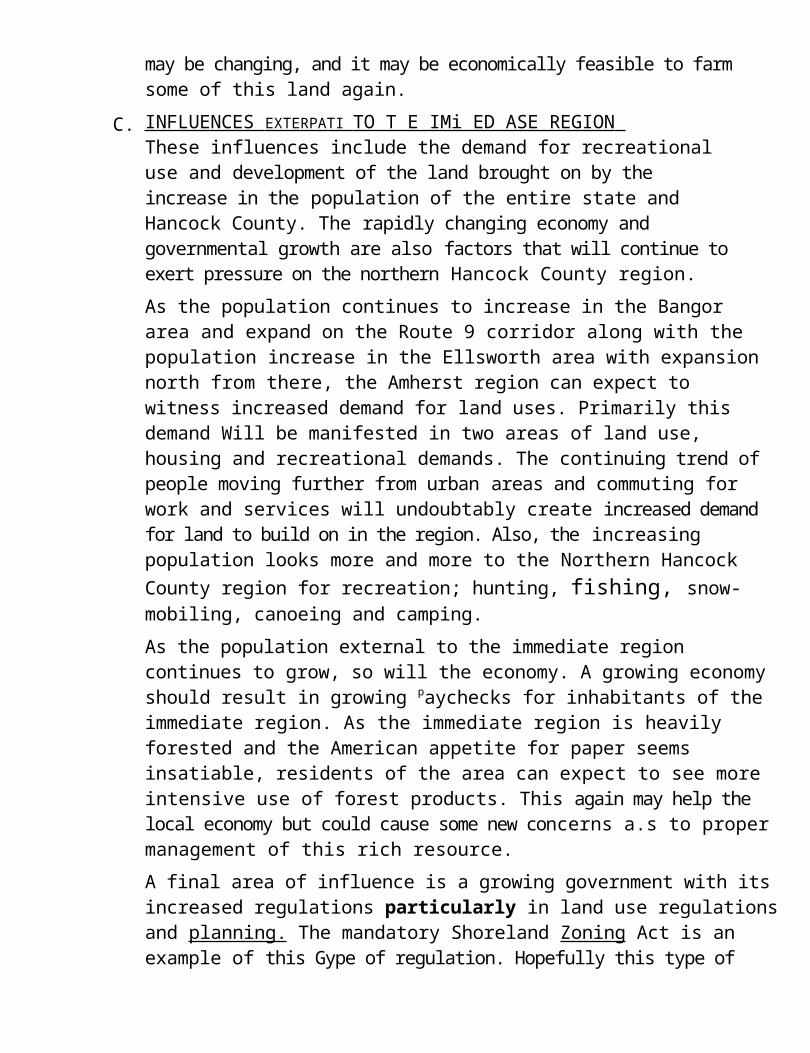
may be changing, and it may be economically feasible to farm some of this land again.INFLUENCES EXTERPATI TO T E IMi ED ASE REGION These influences include the demand for recreational use and development of the land brought on by the increase in the population of the entire state and Hancock County. The rapidly changing economy and governmental growth are also factors that will continue to exert pressure on the northern Hancock County region.
As the population continues to increase in the Bangor area and expand on the Route 9 corridor along with the population increase in the Ellsworth area with expansion north from there, the Amherst region can expect to witness increased demand for land uses. Primarily this demand Will be manifested in two areas of land use, housing and recreational demands. The continuing trend of people moving further from urban areas and commuting for work and services will undoubtably create increased demand for land to build on in the region. Also, the increasing population looks more and more to the Northern Hancock County region for recreation; hunting, fishing, snowmobiling, canoeing and camping.As the population external to the immediate region continues to grow, so will the economy. A growing economy should result in growing paychecks for inhabitants of the immediate region. As the immediate region is heavily forested and the American appetite for paper seems insatiable, residents of the area can expect to see more intensive use of forest products. This again may help the local economy but could cause some new con-cerns a.s to proper management of this rich resource.A final area of influence is a growing government with its increased regulations particularly in land use regulations and planning. The mandatory Shoreland Zoning Act is an example of this Gype of regulation. Hopefully this type of regulation will be channeled so as to help keep the Amherst region as well as the entire State of Maine; a nice place to live, work and play in the future for us and future generations.
C.
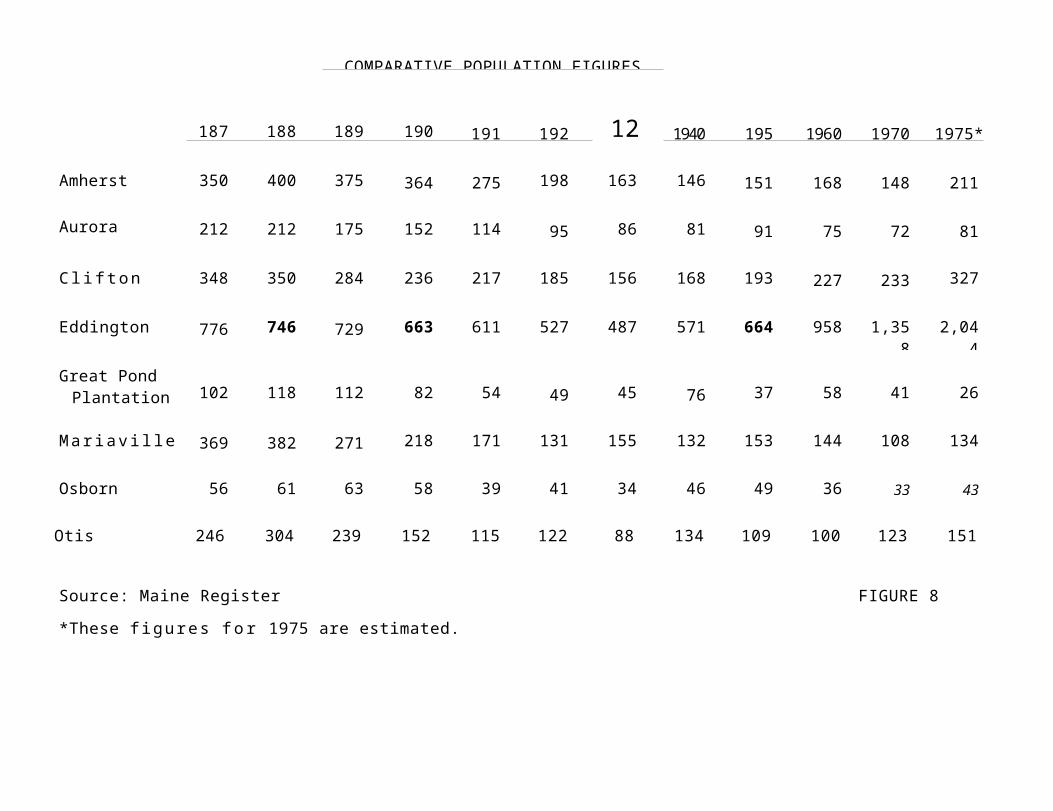
COMPARATIVE POPULATION FIGURES
1870
1880
1890
1900
191 192 121 1940 195 19 1970 1975*
Amherst 350 400 375 364 275 198 163 146 151 168 148 211
Aurora 212 212 175 152 114 95 86 81 91 75 72 81
C l i f t on 348 350 284 236 217 185 156 168 193 227 233 327
Eddington 776 746 729 663 611 527 487 571 664 958 1,358
2,044
Great PondPlantation 102 118 112 82 54 49 45 76 37 58 41 26
Mar iav i l l e 369 382 271 218 171 131 155 132 153 144 108 134
Osborn 56 61 63 58 39 41 34 46 49 36 33 43
Otis 246 304 239 152 115 122 88 134 109 100 123 151
Source: Maine Register FIGURE 8 *These figures f o r 1975 are estimated.


H I S T O R I C P E R S P E C T I V E
I I I
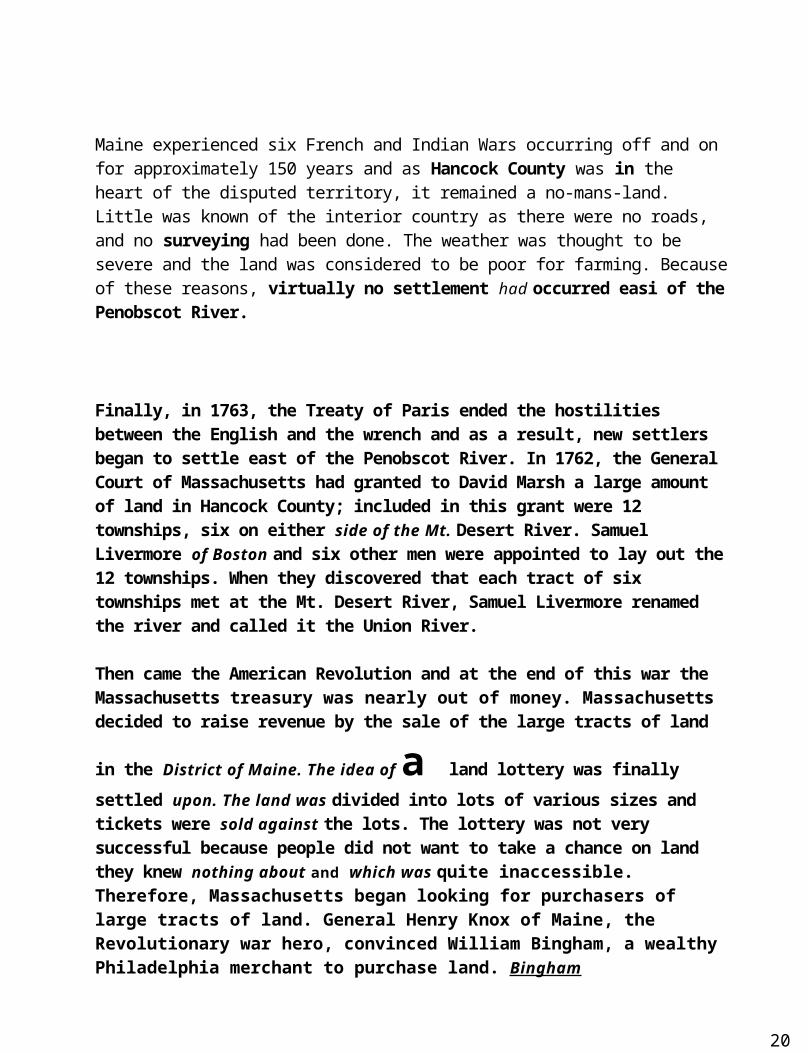
Maine experienced six French and Indian Wars occurring off and on for approximately 150 years and as Hancock County was in the heart of the disputed territory, it remained a no-mans-land. Little was known of the interior country as there were no roads, and no surveying had been done. The weather was thought to be severe and the land was considered to be poor for farming. Because of these reasons, virtually no settlement had occurred easi of the Penobscot River.
Finally, in 1763, the Treaty of Paris ended the hostilities between the English and the wrench and as a result, new settlers began to settle east of the Penobscot River. In 1762, the General Court of Massachusetts had granted to David Marsh a large amount of land in Hancock County; included in this grant were 12 townships, six on either side of the Mt. Desert River. Samuel Livermore of Boston and six other men were appointed to lay out the 12 townships. When they discovered that each tract of six townships met at the Mt. Desert River, Samuel Livermore renamed the river and called it the Union River.
Then came the American Revolution and at the end of this war the Massachusetts treasury was nearly out of money. Massachusetts decided to raise revenue by the sale of the large tracts of land
in the District of Maine. The idea of a land lottery was finally settled upon. The land was divided into lots of various sizes and tickets were sold against the lots. The lottery was not very successful because people did not want to take a chance on land they knew nothing about and which was quite inaccessible. Therefore, Massachusetts began looking for purchasers of large tracts of land. General Henry Knox of Maine, the Revolutionary war hero, convinced William Bingham, a wealthy Philadelphia merchant to purchase land. Bingham
20

2'
(
C
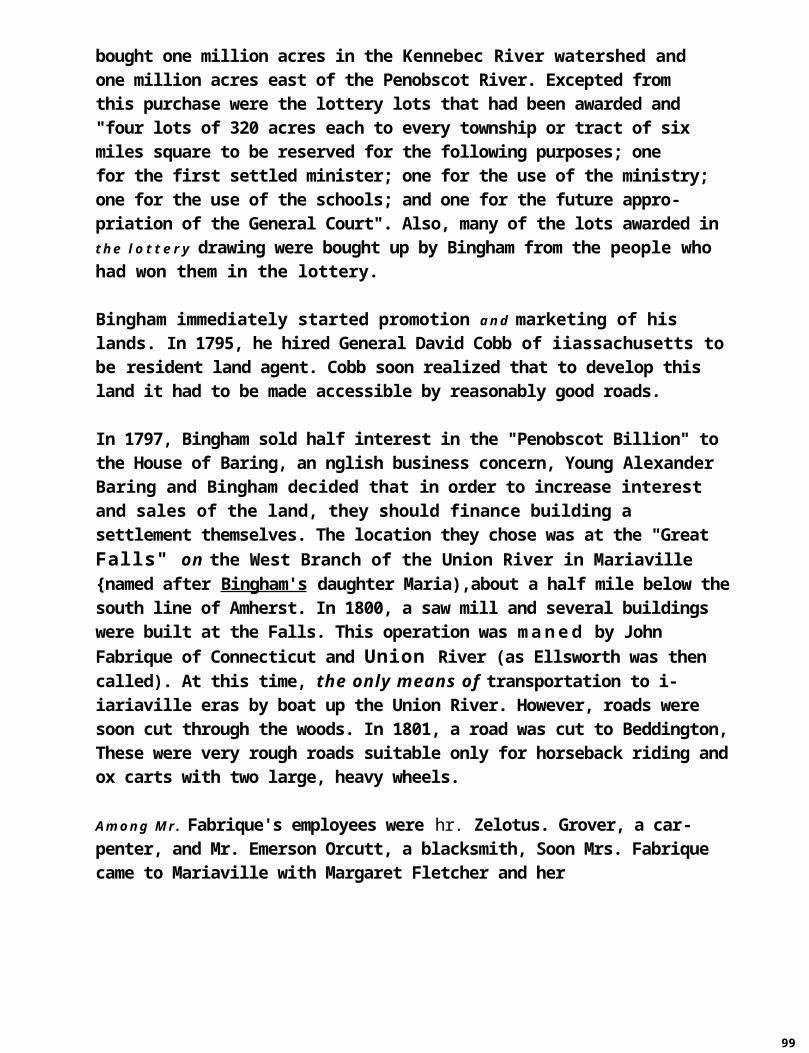
bought one million acres in the Kennebec River watershed and one million acres east of the Penobscot River. Excepted from this purchase were the lottery lots that had been awarded and "four lots of 320 acres each to every township or tract of six miles square to be reserved for the following purposes; onefor the first settled minister; one for the use of the ministry; one for the use of the schools; and one for the future appro-priation of the General Court". Also, many of the lots awarded in the l o t t e r y drawing were bought up by Bingham from the people who had won them in the lottery.
Bingham immediately started promotion and marketing of his lands. In 1795, he hired General David Cobb of iiassachusetts to be resident land agent. Cobb soon realized that to develop this land it had to be made accessible by reasonably good roads.
In 1797, Bingham sold half interest in the "Penobscot Billion" to the House of Baring, an nglish business concern, Young Alexander Baring and Bingham decided that in order to increase interest and sales of the land, they should finance building a settlement themselves. The location they chose was at the "Great Falls" on the West Branch of the Union River in Mariaville {named after Bingham's daughter Maria),about a half mile below the south line of Amherst. In 1800, a saw mill and several buildings were built at the Falls. This operation was ma ne d by John Fabrique of Connecticut and Union River (as Ellsworth was then called). At this time, the only means of transportation to i-iariaville eras by boat up the Union River. However, roads were soon cut through the woods. In 1801, a road was cut to Beddington, These were very rough roads suitable only for horseback riding and ox carts with two large, heavy wheels.
Among Mr. Fabrique's employees were hr. Zelotus. Grover, a car-penter, and Mr. Emerson Orcutt, a blacksmith, Soon Mrs. Fabrique came to Mariaville with Margaret Fletcher and her
99

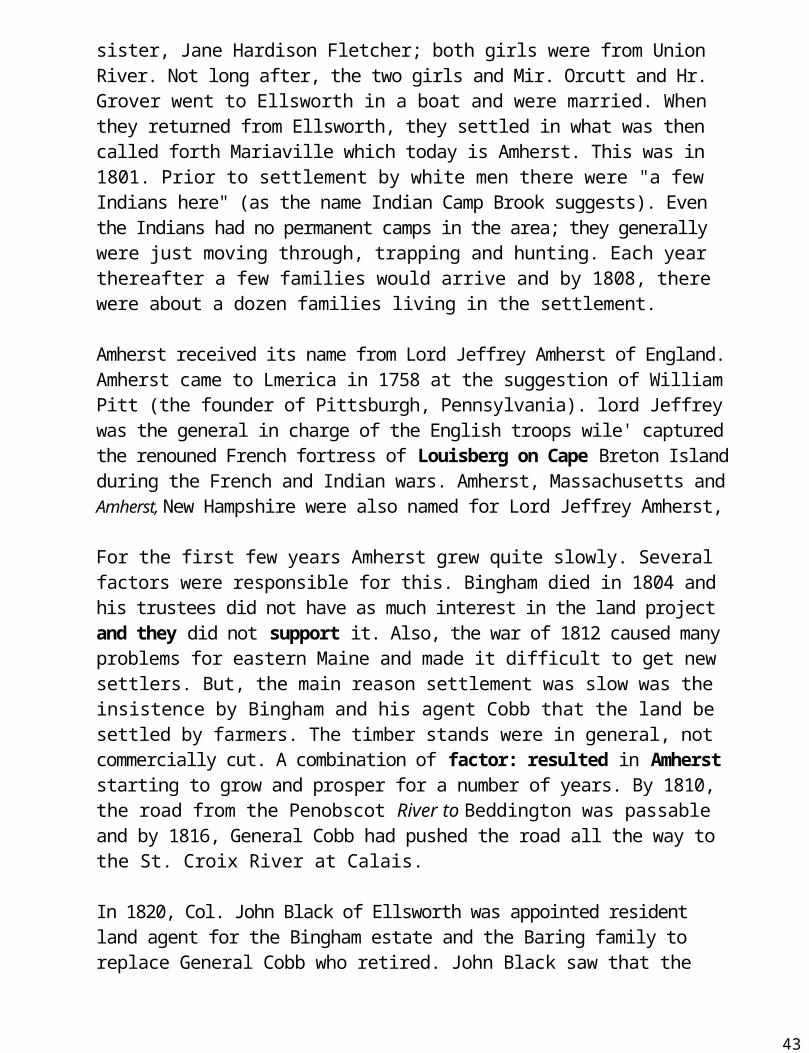
sister, Jane Hardison Fletcher; both girls were from Union River. Not long after, the two girls and Mir. Orcutt and Hr. Grover went to Ellsworth in a boat and were married. When they returned from Ellsworth, they settled in what was then called forth Mariaville which today is Amherst. This was in 1801. Prior to settlement by white men there were "a few Indians here" (as the name Indian Camp Brook suggests). Even the Indians had no permanent camps in the area; they generally were just moving through, trapping and hunting. Each year thereafter a few families would arrive and by 1808, there were about a dozen families living in the settlement.
Amherst received its name from Lord Jeffrey Amherst of England. Amherst came to Lmerica in 1758 at the suggestion of William Pitt (the founder of Pittsburgh, Pennsylvania). lord Jeffrey was the general in charge of the English troops wile' captured the renouned French fortress of Louisberg on Cape Breton Island during the French and Indian wars. Amherst, Massachusetts and Amherst, New Hampshire were also named for Lord Jeffrey Amherst,
For the first few years Amherst grew quite slowly. Several factors were responsible for this. Bingham died in 1804 and his trustees did not have as much interest in the land project and they did not support it. Also, the war of 1812 caused many problems for eastern Maine and made it difficult to get new settlers. But, the main reason settlement was slow was the insistence by Bingham and his agent Cobb that the land be settled by farmers. The timber stands were in general, not commercially cut. A combination of factor: resulted in Amherst starting to grow and prosper for a number of years. By 1810, the road from the Penobscot River to Beddington was passable and by 1816, General Cobb had pushed the road all the way to the St. Croix River at Calais.
In 1820, Col. John Black of Ellsworth was appointed resident land agent for the Bingham estate and the Baring family to replace General Cobb who retired. John Black saw that the
38

future of Eastern Maine was in lumber and not farming. Lumber-ing brought much prosperity to Amherst and the region. The population began to increase so that by 1831 there were 196 people in Amherst.
Amherst was a good location for settlement because it had the natural resources needed by settlers; water, fertile soil,hard and soft wood and meadows for wild hay. Most of the early settlers were young and eager to work hard to get ahead. The first homes were log cabins but by the early 1820's frame houses and barns were going up. It was easy for people to purchase land from the Bingham trustees. The land sold for one dollar per acre and people were given a long period of time in which to pay with time extentions i f needed. In 1822, Amherst was set apart from Mariaville and on February 5., 1331 was incorporated as the 290th town in Maine. (Prior to this, Amherst had been designated as Township #26.) By 1830, the roads were improved enough to allow horse drawn wagon traffic. Amherst has approximately six locations on streams that are capable of generating enough hydro power to run a mill. Uith this power, by the early 1830's two tanneries had been built in Amherst. One was a small operation built in the neighborhood of Jellison Hil l . In 1332, three men from Boston,. Mace Tisdale, Simeon K. iie:•rins and Lucuis.L. Flower, purchased from the Bingham Estate, two l o t s of land on either side of "Governor's Falls" on the Union River and the following year they constructed a large tannery. It was noted in the purchase that the men were to keep a sluice may in their dam so that logs from up the river could be driven through and on down to Ellsworth. This tannery employed an average of 35 men there besides the people employed in the woods cutting the hemlock and peeling its bark which was used to tan the hides. In 1841, the tannery was sold to Mr. inning for twenty thousand dollars. In 1842, a site on the west side of the dam was leased to Jonathan Barker of Amherst for a grist mill. And then sometime later on the Last side of the mill pond, a sawmill was put into operation along with a
39
shingle mill, Apparently another small tannery was constructed on the r i v e r at Silsby's Falls but this burned before 1860.
The boom was on, tanners and skilled workmen were imported from Scotland and Canada. Two large boarding homes were erected to house the workers. Farming was important as food was needed
for the people employed in the mills and in the woods operations. Also much feed grain and hay was produced to feed the many horses and oxen used in the woods. Soon a saw mill, four shingle mills and another grist mill were in operation. Doctors, ministers, blacksmiths and other tradesmen came and settled. Six stores were in operation (two of them were millinery) and Sam Silsby ran a brickyard near the Aurora town line. (Other accounts place the brickyard on the banks of the Union River where Chick Brook enters it.) This boom continued to draw more people here to provide services and food for those employed in the local industries. In 1843, the church building was completed in Amherst and has remained to this day a great moral and social center of the community. Four schools were built and utilized to provide education for the children of the town.
The lumber operators did not own the timber lands they cut on nor did they make much effort to buy the land. For years people had cut most anywhere due to the fact that there was so much public land. But, with John Black nor managing the Bingham lands, he resolved to put a stop to this "plundering", which he did do within a short time. The lumber operators now began purchasing stumpage from the Bingham Estate. As the years went by and the Bingham lands were sold off, stumpage agreements were worked out with the new owners. Amherst, inthe 1850 census, now had 323 people. In 1855, the large tannery at Governors Falls was once again sold to A. H. Buzzell & Son.By the mid 1850's, as General Cobb's road had been much improved, stage coaches were running regularly through Amherst for Bangor and Calais.
40

By 1852, the virgin pine had been cut off so the lumbermen began cutting sapling pine and virgin spruce. After the Civil War, the first growth timber had been cut off and lumbering was not as important as it had formerly been. Many people began peel-ing bark and hauling it to the tanneries.
Apparently the Civil War brought some changes to Amherst, as it did t o many Maine towns. In 1860, the population of Amherst had been 384 but in 1870, it was dawn to 350. People left togo to the industrial centers and to the west for their fortunes. At this time there were 43 men living in Amherst who had been Union soldiers. As the tannery was in full operation, the local economy remained good and by 1830, the population was up to 400 people. This was the decade of the towns economic zenith. Some reports say that at one time there were as many as 500 people in the community. But after 1880 there was a general decline in the old methods of tanning as chemicals were beginning to be used. There were at least three important reasons for the switch to chemicals from hemlock bark.
1. A steady impoverishment of the states supply of hemlock.2. The new chemicals were faster.3. Since plant locations became less dependent on nearby
hemlock, etc. it became more profitable to have leather preparation conducted near its principal markets. That meant boot and shoe manufacturers, concentrated largely in several cities in eastern Massachusetts.
By the end of the nineteenth century, the tannery industry in Maine had nearly vanished. The tanning operation here was gra-
dually slowing down a lso . Amherst's population in 1890 was down to 375 people. The towns decline was starting.
In 1887, the stage lines that had been running through Amherst were discontinued. Steamboat service was inagurated to Calais, i t could carry the mail cheaper and was much more comfortable
41
for the passengers. By the 1890's, both lumbering and farming were starting to decline, although they were still the chief occupations of the citizens. Maine farmers simply could not compete with the prairie farmers of the Midwest, where modern farm equipment was so efficient on their flat, unobstructed land. By 1900, the town's population had only declined to 364, but then about 1904 the tannery burned. Many people believed the fire was intentionally set in order to collect insurance on the mill as it was obviously feeling the changes in tanning methods. Within a year, more than thirty families moved out of Amherst as they no longer had employment.
The tannery fire effected not only those directly employed at the mill, but also many who worked in the woods harvesting the bark. Those people in the town who grew food for the men and animals employed in the various phases of the tannery operation found their market greatly reduced. Also, the stores, trades-
men, etc. experienced the same phenomenon. Everyone in the community was obviously affected in some manner. The 1910 census showed Amherst's population had declined by 89 people or approximately one quarter of the total population.
Shortly after 1910, with the continued decline in farming, much of the cleared land was allowed to revert to blueberry land and the berry crop became a commercial business in the area. Some farming was still done and men still worked in the woods although on a smaller scale as the demand for bark was now gone. The men in the woods now were cutting trees that were driven down the river to sawmills in Ellsworth to be cut into lumber. Some men were also cutting four foot pulpwood for the paper mills. The tannery had owned approximately 2600 acres of timberland in Amherst in various sized lots. This eventually.-was sold off to different individuals who then harvested the wood.
At this time, Amherst had a very active social life. The town hall had been constructed around 1895 and was used for many
dances, agricultural fairs,plays, etc. Around 1910 or 1915 an
42
addition was attached to the back end of the building which made the place the size it is today. In 1901, the Goodwill Grange was chartered and held its meetings in the store owned by Buzzeli & Rice at the tannery. Shortly after the tannery burned, the Grange acquired the store building and had it moved from Tannery Loop Road to its present location. The Amherst-Aurora Congregational Church was a great social center of the community with services, religious pagents and Ladies Aid. And of course the stores in the center of town (Amherst Corner) were always a place people could get together and discuss issues of the day.
In 1905, the Union River Telephone Company was organized to connect the towns of Waltham, hariaville, Otis, Osborn, Great Pond, Aurora and Amherst. This greatly increased the communi-
cations between the people in the area and added much to their ability to socialize, Amherst and the other towns in the area remained a tightly knit social community.
In 1911, Ernest Richardson of Aurora purchased the first auto-mobile in the area. As the roads were continually improved, more people became interested in autos. By the early 1920's, cars rapidly began replacing horses as the primary means of transportation. This change almost immediately put the local blacksmith shops out of business.
With the advent of the automobile, sIn ost everything tended to become more centralized and people began to think more in terms of Ellsworth or Bangor for their needs. This continued the decline in smR33 local businesses. As a shop or mill burned down, the proprietor would not rebuild and they would either find a new vocation or more likely move from the area. Also, agriculture (except for blueberry growing) continued its downward trend. In 1920, the towns population was down to 198 from the 275 just ten years erlier, a drop of 28%0 of the total population. As this spiral continued, more small businesses closed for lack of clientele and as less services and jobs were
available locally, more people would move to the larger communi - ties. As the old farmers died or gave up farming, no one took it up as it no longer paid to farm. The young often had left home for the larger towns and no one was left to look after the property or the buildings. By the late 1930's, even much of the blueberry land was abandoned and the fields began to fill in with bushes and trees. Many of the old homesteads fell into their cellars from lack of use and maintainance and the land was either sold off or acquired by the town for taxes. Also, fire claimed a number of the large homes, never to be rebuilt again.
In 1931, Samuel Pitt constructed a steam powered saw mill on Tannery Loop Road near Indian Camp Brook. The mill generated its own electricity and had a number of lights going at night. A welcome sight to the townspeople at that time. The mill was in operation until 1938 when it went backrupt and was torn down and the lumber sold off.
During the 1930's, the "Air Line" was more improved and tarring was started. The first piece to be tarred was a four mile piece centered at the Amherst-Aurora town line. Each year more was paved, eventually all the way west to Eddington. The automobile and improved roads continued to give the people more mobility and as a result, even those living here started socializing out-side the community. The Saturday night dances, grange suppers, and church fairs became less and less frequent. By 1940, the towns population was down to 146 people, the lowest point since the census started counting. In 1940, the Union River Electric Co-op was formed and the power lines were strung in 1941. This brought electricity to the area for the first time and was very much welcomed by the citizens.
Then the decade of the 50's brought the television into most homes. This was the death blow to the small town social patterns. People now stayed.home to watch TV or else jumped in the car for a relatively easy ride to entertainment in Ellsworth,
2q
Bangor or beyond. With the lack of patronage, most any community social interaction was doomed to failure.
Through the 50's and 60's, the towns population more or less stabilized with some normal in and out migration. In 1970, the population figure stood at 148, but by 1975 the population had risen to 211 people. The automobile and steadily improved roads combined with the more recent phenomenon of people moving from urban areas to suburbs and the country may have "turned the tide's on the population out migration. People can now live in Amherst and commute to Ellsworth or Bangor for employment.
There are a few small local employers, probably the largest being the Paul Bunyan Furniture Co. located in the center of Totin. The Company went into operation in 1957 making furniture - stock and parts. Today they manufacture assembled furniture out of locally harvested pine, maple and birch. The mill provides employment for a feel people in the woods and for some others at the mill, Many townspeople have- worked there at one time or - another.
The Valley High Restaurant also provides employment for local people and here again the number employed there flucuates. Some people in Amherst are self-employed and they also may employ
others from the community. Herbert Jordan runs a timber harvesting operation in Amherst and he usually employs four to six people from the area.
About the turn of the century, particularly after the tannery burned, non-residents began to own more and more of the property in town. In 1906, the town came into ownership of the real estate owned by the Hancock Leather Company (the Buzzell & Rice Tannery) for non-payment of the 1904 tax. This property was then sold off to mostly non-residents investing in timberland.
45
c
Also, as people moved out of town they s t i l l ot'rned their pro-perty,trhich eventually was sold. Here again in many instances it was sold to non-residents building up large holdings of timberlands. Isuch property was acquired by the town, again, for non-payment of taxes from people who had moved out due to lack of work after the Tannery burned. This property was then sold off more often than not to non-resident. A number of these lots have now been bought up by approximately six non-resident landholders, primarily St. Regis Paper Co. (8300 acres), Diamond International Paper Co. (4,460 acres), and G. P. Webber Timber-l a n d s ( 5 , 4 4 0 a c r e s ) .
46
H U M A N C O M M U N I T Y
IV
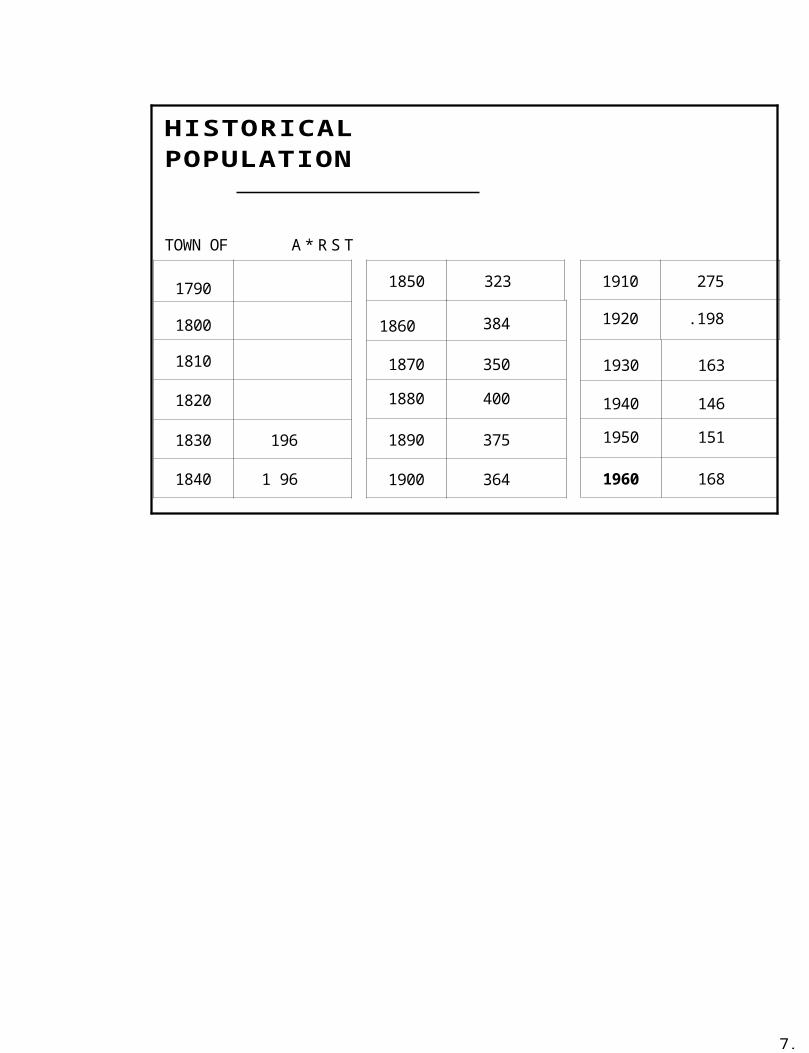
HISTORICAL POPULATION
TOWN OF A * R S T
1790
1800
1810
1820
1830 196
1840 1 96
1850 323
1860 384
1870 350
1880 400
1890 375
1900 364
1910 275
1920 .198
1930 163
7,
1940 1461950 151
1960 168
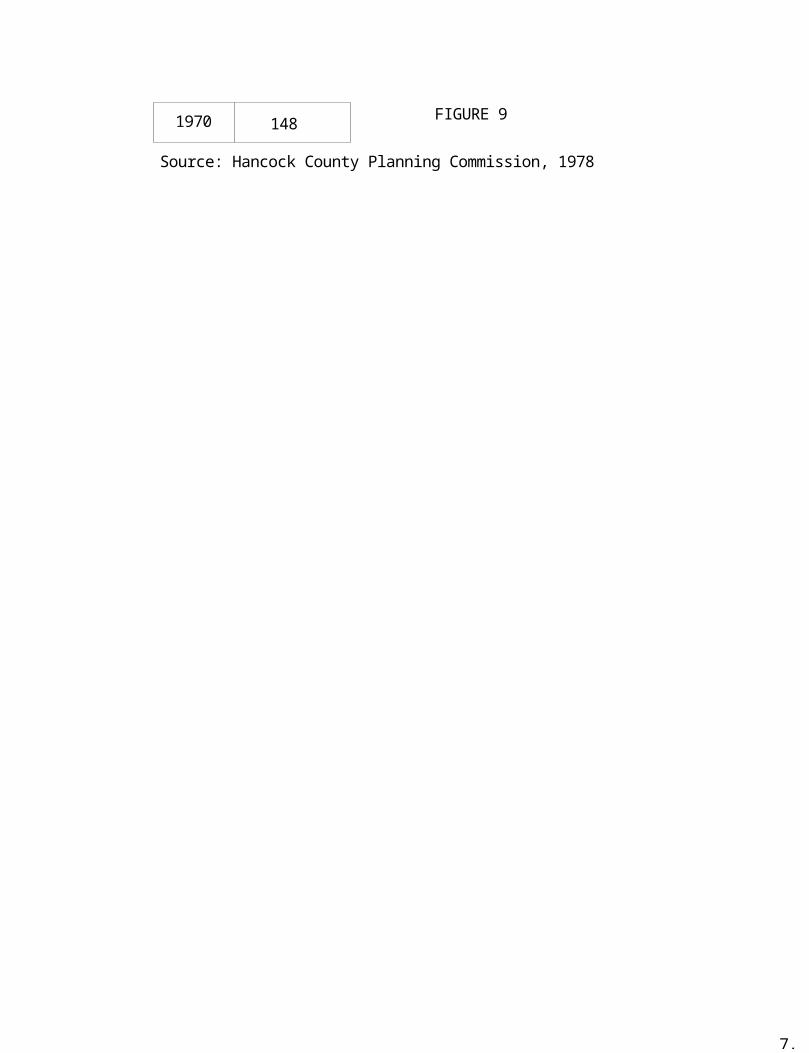
1970 148
FIGURE 9
Source: Hancock County Planning Commission, 1978
7,
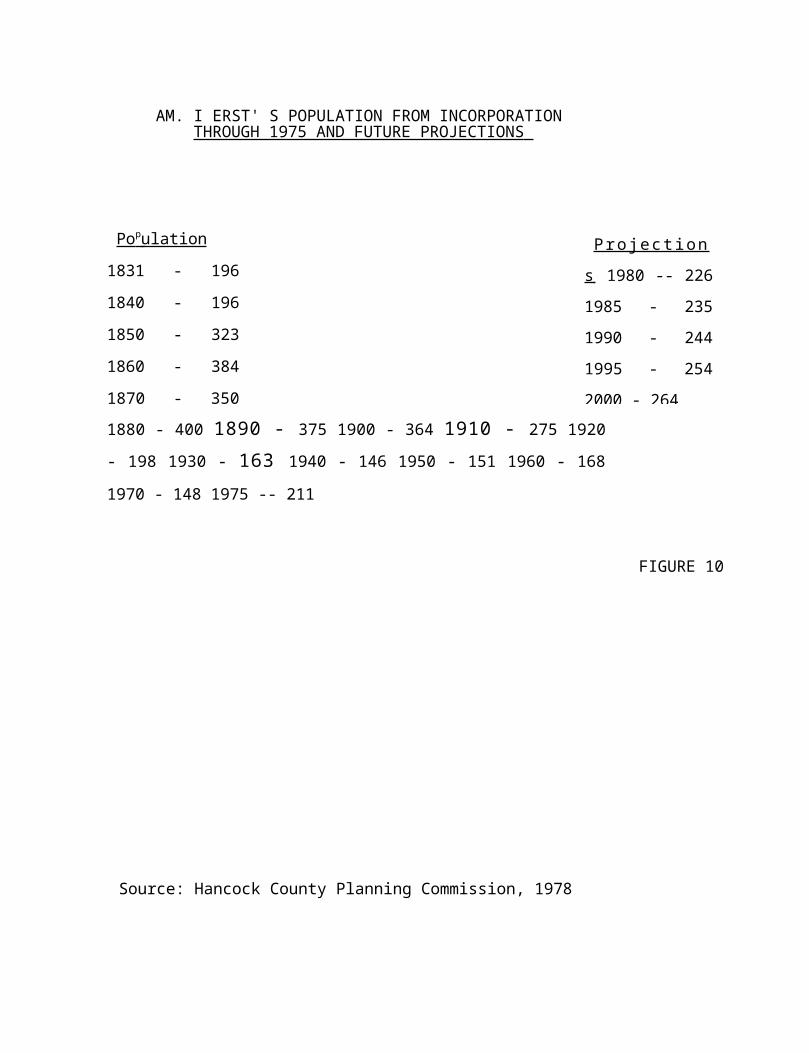
AM. I ERST' S POPULATION FROM INCORPORATIONTHROUGH 1975 AND FUTURE PROJECTIONS
Po p ulation 1831 - 196 1840 - 196 1850 - 323 1860 - 384 1870 - 350 1880 - 400 1890 - 375 1900 - 364 1910 - 275 1920 - 198 1930 - 163 1940 - 146 1950 - 151 1960 - 168 1970 - 148 1975 -- 211
Source: Hancock County Planning Commission, 1978
FIGURE 10
Pro ject ions 1980 -- 226 1985 - 235 1990 - 244 1995 - 254 2000 - 264

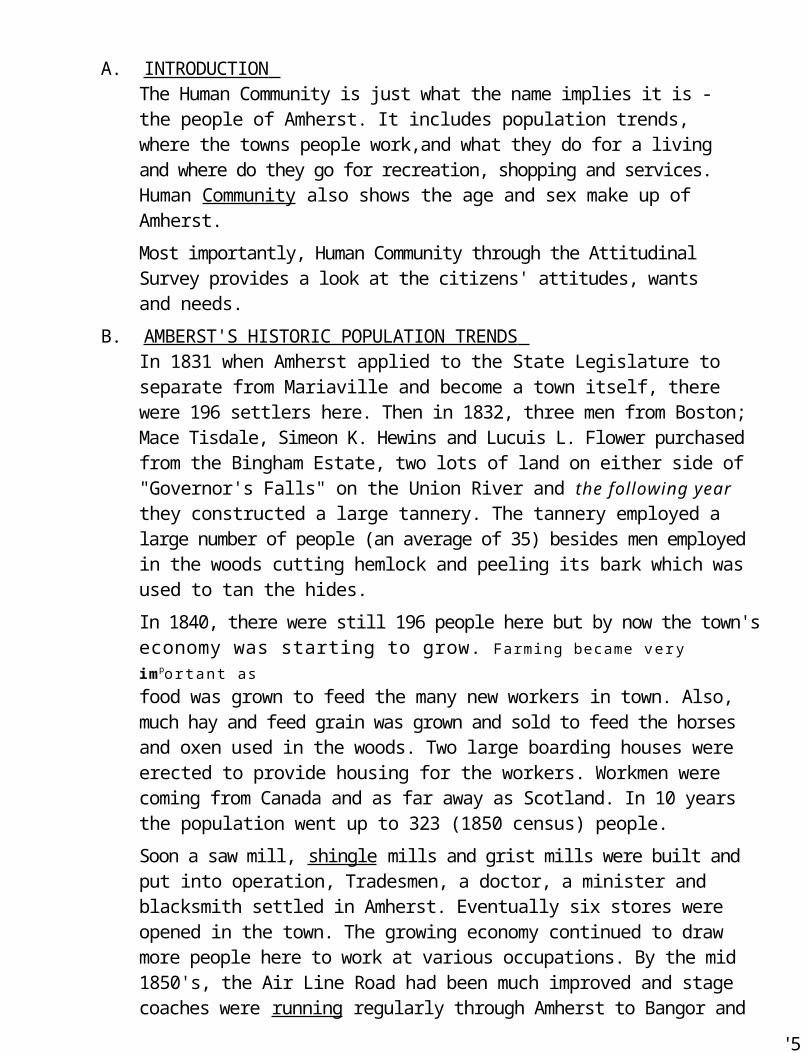
A. INTRODUCTION The Human Community is just what the name implies it is - the people of Amherst. It includes population trends, where the towns people work,and what they do for a living and where do they go for recreation, shopping and services. Human Community also shows the age and sex make up of Amherst.
Most importantly, Human Community through the Attitudinal Survey provides a look at the citizens' attitudes, wants and needs.
B. AMBERST'S HISTORIC POPULATION TRENDS In 1831 when Amherst applied to the State Legislature to separate from Mariaville and become a town itself, there were 196 settlers here. Then in 1832, three men from Boston; Mace Tisdale, Simeon K. Hewins and Lucuis L. Flower purchased from the Bingham Estate, two lots of land on either side of "Governor's Falls" on the Union River and the following year they constructed a large tannery. The tannery employed a large number of people (an average of 35) besides men employed in the woods cutting hemlock and peeling its bark which was used to tan the hides.
In 1840, there were still 196 people here but by now the town'seconomy was starting to grow. Farming became very important asfood was grown to feed the many new workers in town. Also, much hay and feed grain was grown and sold to feed the horses and oxen used in the woods. Two large boarding houses were erected to provide housing for the workers. Workmen were coming from Canada and as far away as Scotland. In 10 years the population went up to 323 (1850 census) people.Soon a saw mill, shingle mills and grist mills were built and put into operation, Tradesmen, a doctor, a minister and blacksmith settled in Amherst. Eventually six stores were opened in the town. The growing economy continued to draw more people here to work at various occupations. By the mid 1850's, the Air Line Road had been much improved and stage coaches were running regularly through Amherst to Bangor and
'5 51
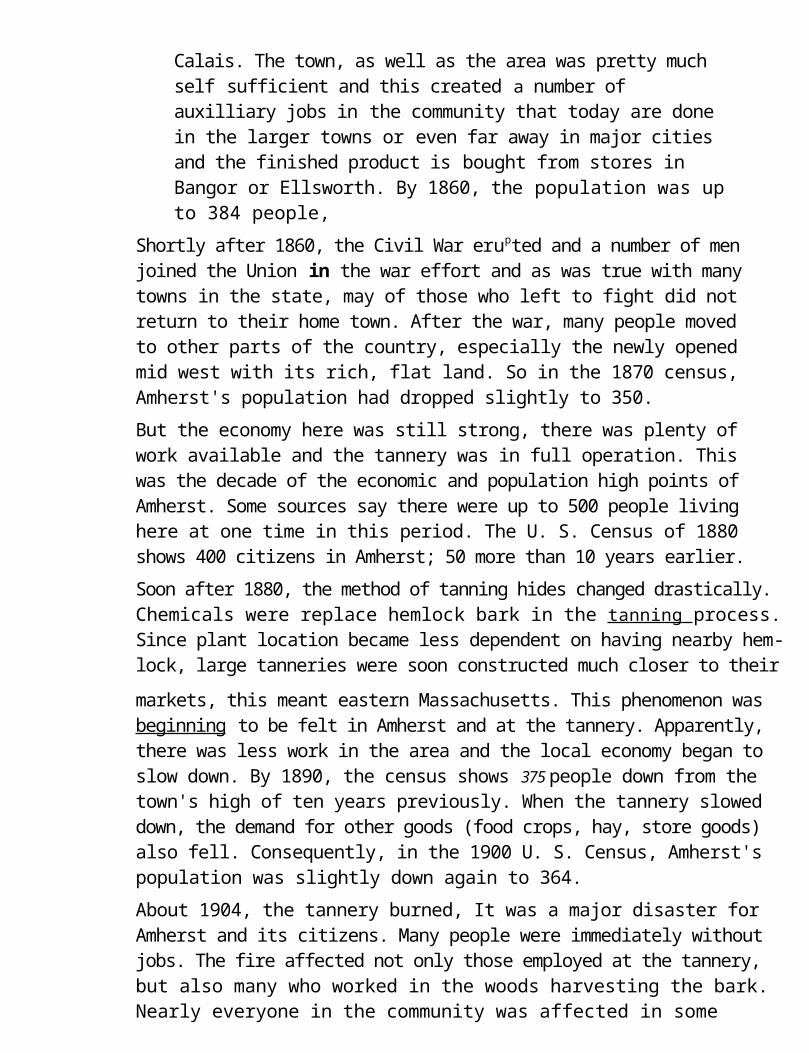
Calais. The town, as well as the area was pretty much self sufficient and this created a number of auxilliary jobs in the community that today are done in the larger towns or even far away in major cities and the finished product is bought from stores in Bangor or Ellsworth. By 1860, the population was up to 384 people,
Shortly after 1860, the Civil War erupted and a number of men joined the Union in the war effort and as was true with many towns in the state, may of those who left to fight did not return to their home town. After the war, many people moved to other parts of the country, especially the newly opened mid west with its rich, flat land. So in the 1870 census, Amherst's population had dropped slightly to 350.But the economy here was still strong, there was plenty of work available and the tannery was in full operation. This was the decade of the economic and population high points of Amherst. Some sources say there were up to 500 people living here at one time in this period. The U. S. Census of 1880 shows 400 citizens in Amherst; 50 more than 10 years earlier.Soon after 1880, the method of tanning hides changed drastically. Chemicals were replace hemlock bark in the tanning process. Since plant location became less dependent on having nearby hem-lock, large tanneries were soon constructed much closer to their
markets, this meant eastern Massachusetts. This phenomenon was beginning to be felt in Amherst and at the tannery. Apparently, there was less work in the area and the local economy began to slow down. By 1890, the census shows 375 people down from the town's high of ten years previously. When the tannery slowed down, the demand for other goods (food crops, hay, store goods) also fell. Consequently, in the 1900 U. S. Census, Amherst's population was slightly down again to 364.About 1904, the tannery burned, It was a major disaster for Amherst and its citizens. Many people were immediately without jobs. The fire affected not only those employed at the tannery, but also many who worked in the woods harvesting the bark. Nearly everyone in the community was affected in some manner, including the immediate reduction in business of the local farmers, storekeepers and tradesmen. Also, a great number of
COMPARISION OF AGE DISTRIBUTIONSTATE OF MAINE AND TOWN OF____________AMTERST1975

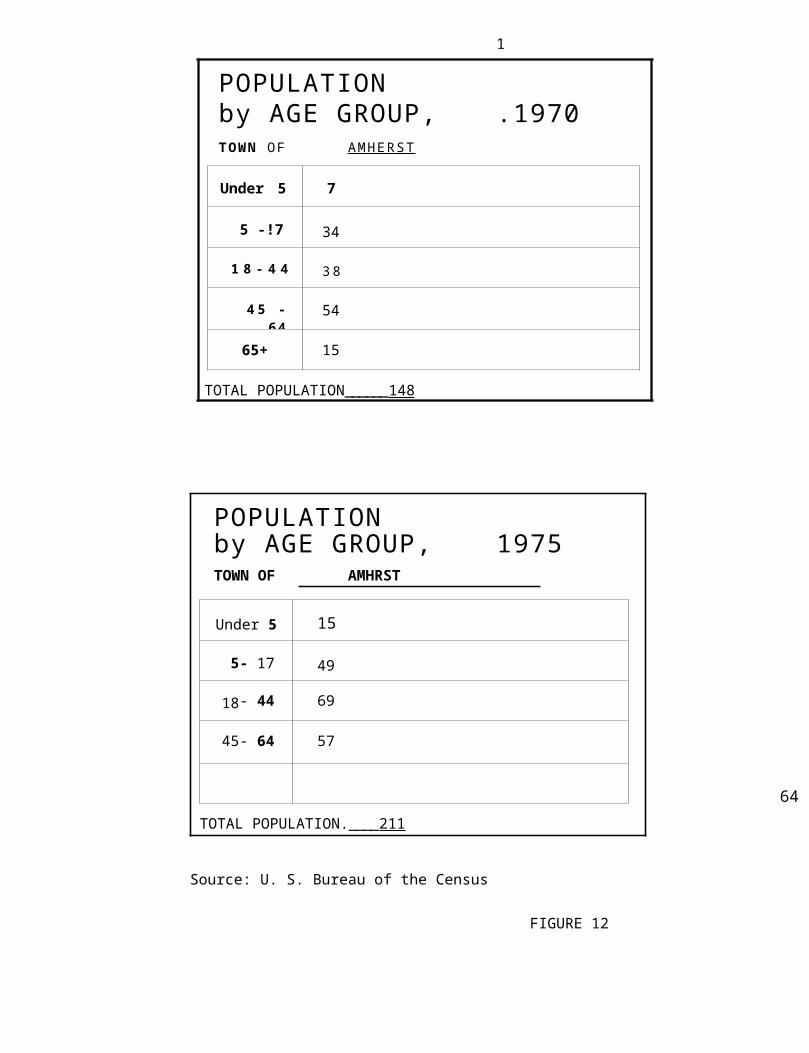
1
POPULATIONby AGE GROUP, .1970TO W N O F A M H E R S T
Under 5 7
5 -!7 34
1 8 - 4 4 3 8
4 5 - 6 4 54
65+ 15
TOTAL POPULATION______148
POPULATIONby AGE GROUP, 1975TOWN OF AMHRST
Under 5 15
5- 17 49
18- 44 69
45- 64 57
65+ 21
TOTAL POPULATION.____211
Source: U. S. Bureau of the Census
FIGURE 12
54
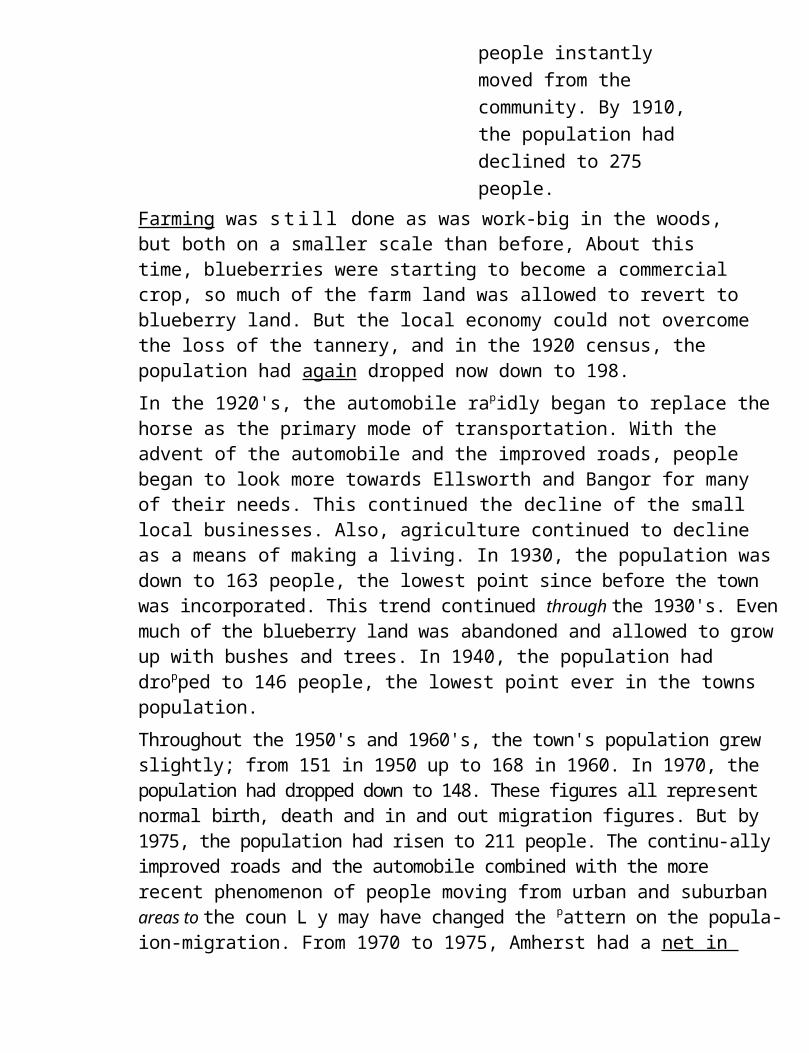
people instantly moved from the community. By 1910, the population had declined to 275 people.
Farming was s t i l l done as was work-big in the woods, but both on a smaller scale than before, About this time, blueberries were starting to become a commercial crop, so much of the farm land was allowed to revert to blueberry land. But the local economy could not overcome the loss of the tannery, and in the 1920 census, the population had again dropped now down to 198.In the 1920's, the automobile rapidly began to replace the horse as the primary mode of transportation. With the advent of the automobile and the improved roads, people began to look more towards Ellsworth and Bangor for many of their needs. This continued the decline of the small local businesses. Also, agriculture continued to decline as a means of making a living. In 1930, the population was down to 163 people, the lowest point since before the town was incorporated. This trend continued through the 1930's. Even much of the blueberry land was abandoned and allowed to grow up with bushes and trees. In 1940, the population had dropped to 146 people, the lowest point ever in the towns population.Throughout the 1950's and 1960's, the town's population grew slightly; from 151 in 1950 up to 168 in 1960. In 1970, the population had dropped down to 148. These figures all represent normal birth, death and in and out migration figures. But by 1975, the population had risen to 211 people. The continu-ally improved roads and the automobile combined with the more recent phenomenon of people moving from urban and suburbanareas to the coun L y may have changed the pattern on the popula-ion-migration. From 1970 to 1975, Amherst had a net in migration of 69 people.The U. S. Bureau of the Census' population projections to the year 2000 show a steady increase in population for Amherst and the surrounding area. I t is believed that the trend of people moving into rural areas will continue, however, there are a number of variables (i.e. the future price of gasoline) that may affect the projected population figure.

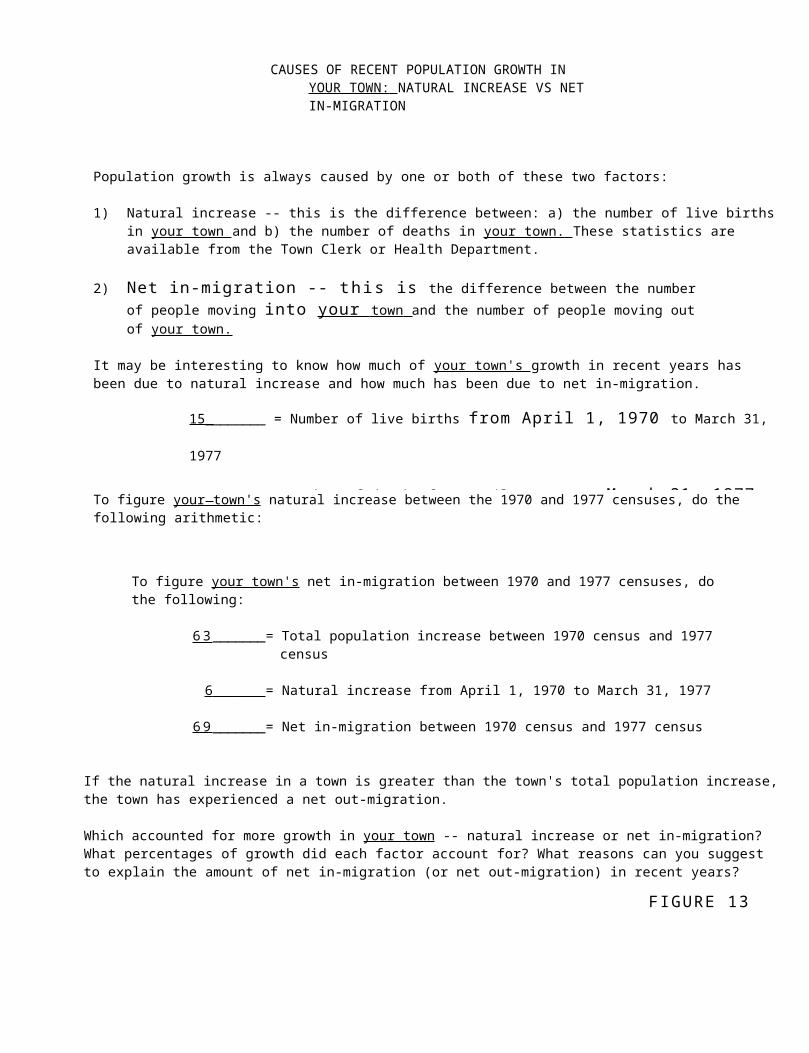
CAUSES OF RECENT POPULATION GROWTH IN YOUR TOWN: NATURAL INCREASE VS NET IN-MIGRATION
Population growth is always caused by one or both of these two factors:
1) Natural increase -- this is the difference between: a) the number of live births in your town and b) the number of deaths in your town. These statistics are available from the Town Clerk or Health Department.
2) Net in-migration -- t h i s is the difference between the number of people moving into your town and the number of people moving out of your town.
It may be interesting to know how much of your town's growth in recent years has been due to natural increase and how much has been due to net in-migration.
To figure your town's natural increase between the 1970 and 1977 censuses, do the following arithmetic:
To figure your town's net in-migration between 1970 and 1977 censuses, do the following:
63 _______= Total population increase between 1970 census and 1977 census
6 _______= Natural increase from April 1, 1970 to March 31, 1977
69 _______= Net in-migration between 1970 census and 1977 census
If the natural increase in a town is greater than the town's total population increase, the town has experienced a net out-migration.
Which accounted for more growth in your town -- natural increase or net in-migration? What percentages of growth did each factor account for? What reasons can you suggest
to explain the amount of net in-migration (or net out-migration) in recent years?
FIGURE 13*For current figures contact HCPC
S o u r c e : Town R e c o r d s
56
15 ________ = Number of live births from April 1, 1970 to March 31, 1977
21 ________ = Number of deaths from April 1, 1970 to March 31, 1977
-6 ________= Natural increase from April 1 , 1970 to March 31, 1977
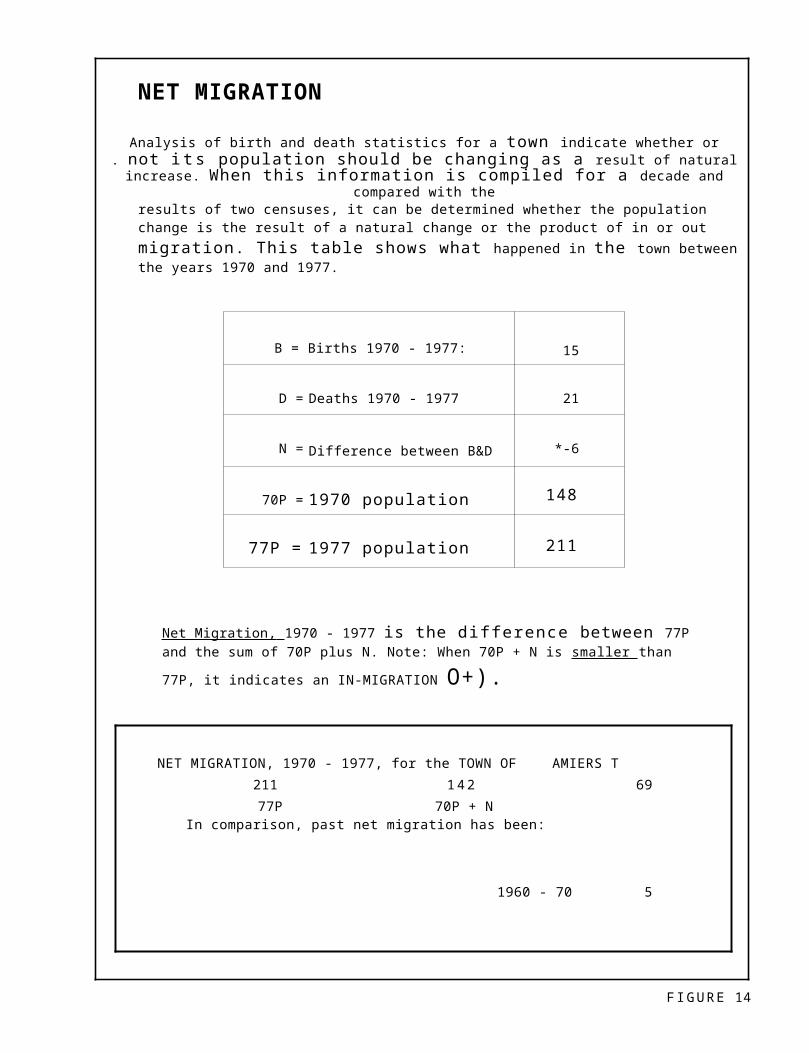
NET MIGRATION
Analysis of birth and death statistics for a town indicate whether or. not i t s population should be changing as a result of natural increase. When this
information is compiled for a decade and compared with theresults of two censuses, it can be determined whether the population change is the result of a natural change or the product of in or out migration. This table shows what happened in the town between the years 1970 and 1977.
B = Births 1970 - 1977: 15
D = Deaths 1970 - 1977 21
N = Difference between B&D *-6
70P = 1970 population 148
77P = 1977 population 211
Net Migration, 1970 - 1977 is the difference between 77P and the sum of 70P plus N. Note: When 70P + N is smaller than 77P, it
indicates an IN-MIGRATION O+).
NET MIGRATION, 1970 - 1977, for the TOWN OF AMIERS T
211 142 69
77P 70P + NIn comparison, past net migration has been:
1960 - 70 5
Source: U. S. Bureau of the Census and Amherst town records
FIGURE 14
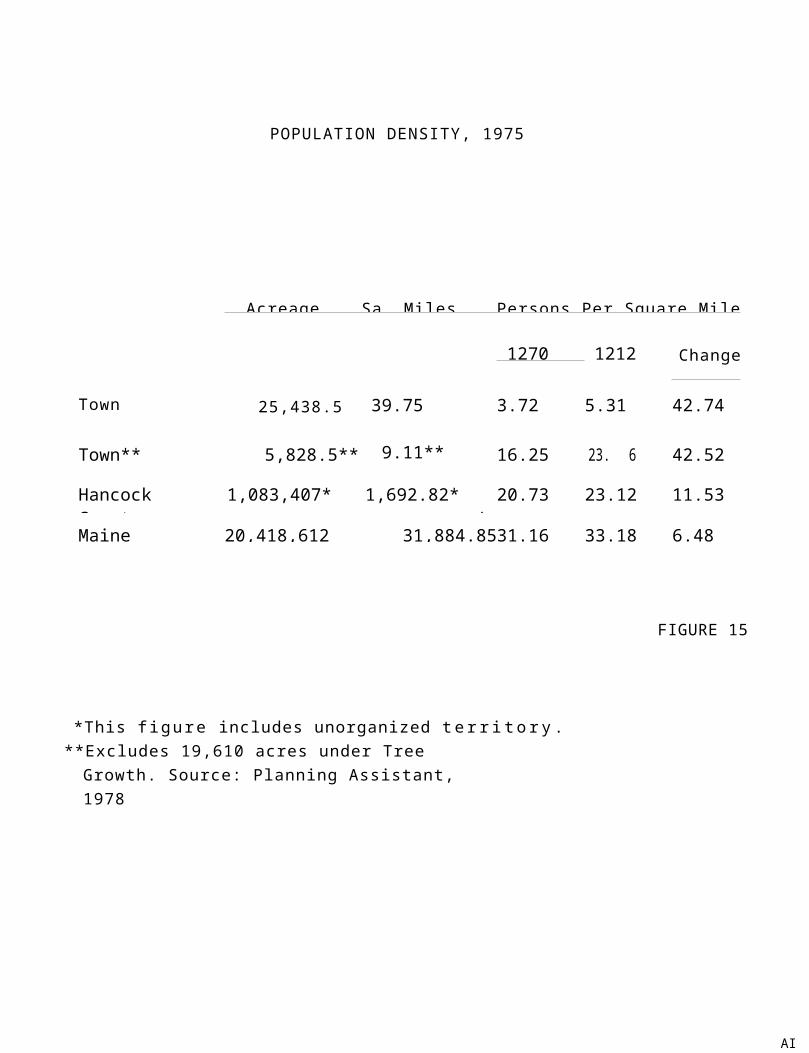
POPULATION DENSITY, 1975
Acreage Sa. Miles Persons Per Square Mile
1270 1212 Change
Town 25,438.5 39.75 3.72 5.31 42.74
Town** 5,828.5** 9.11** 16.25 23. 6 42.52
Hancock County 1,083,407* 1,692.82* ' 20.73 23.12 11.53
Maine 20,418,612 31,884.85 31.16 33.18 6.48
FIGURE 15
*This figure includes unorganized t e r r i t o r y .**Excludes 19,610 acres under Tree Growth.
Source: Planning Assistant, 1978
AI
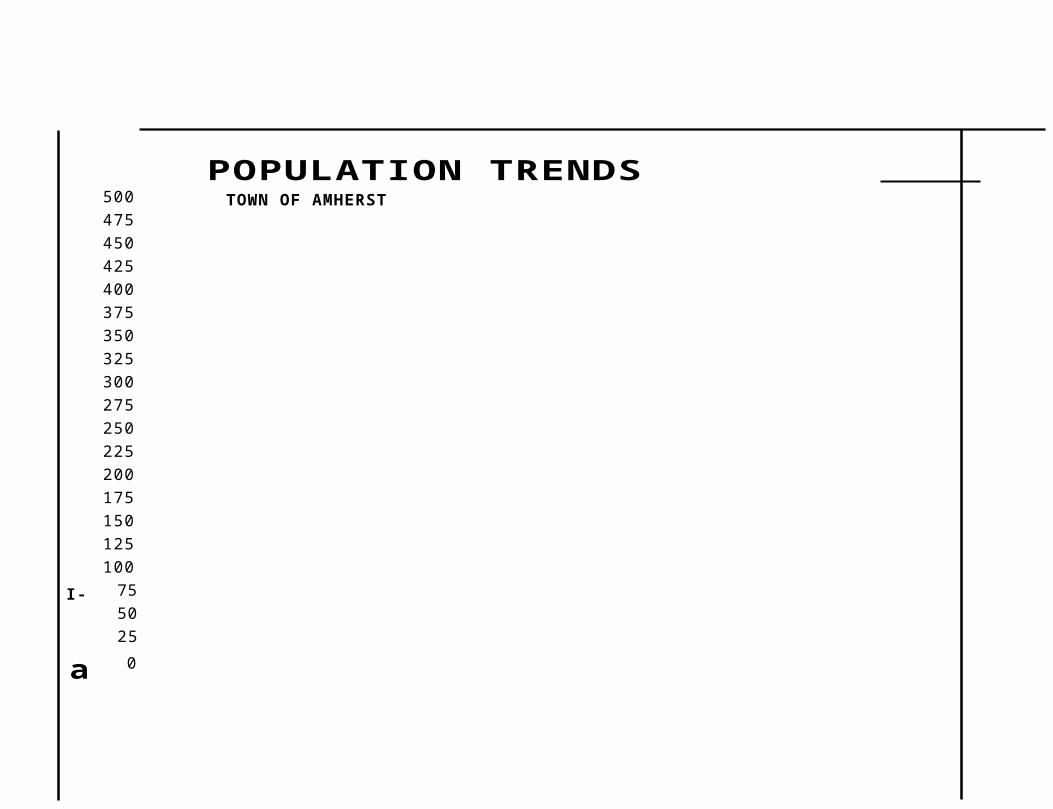
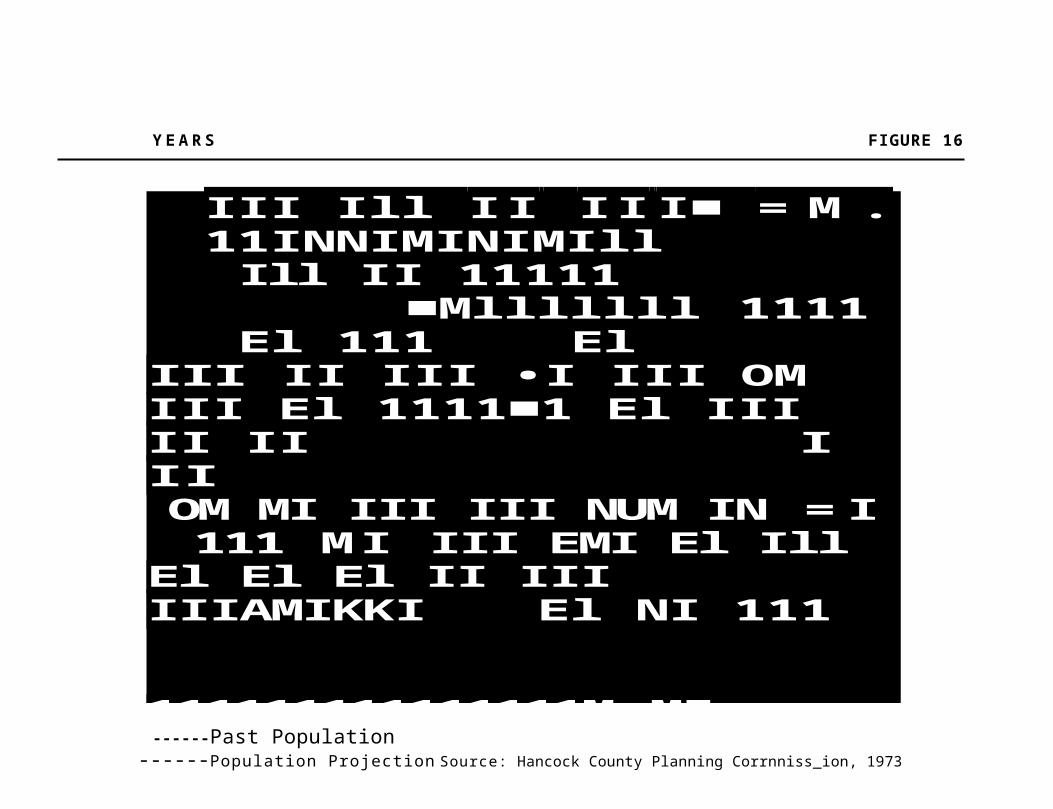
POPULATION TRENDS TOWN OF
AMHERST
Y E A R S FIGURE 16
500 475 450 425 400 375 350 325 300 275 250 225 200175 150 125 100
75 50 25
0
I-
a
III Ill I I I I I■ = M . 11INNIMINIMIllIll II 11111 ■Mlllllll 1111 El 111 El
III II III •I III OM III El 1111■1 El III II III II
OM MI III III NUM IN = I 111 MI III EMI El Ill
El El El II III IIIAMIKKI El NI111
111111111111111M MI 1111111111111 EMI 111 El El IIII II EMI 111I1111 M I M I . MINI MEER 11111 Illlll Ill El
EMI 1111 MI ■1111■1■1 IM ■111 111
----------Past Population-------------Population Projection Source: Hancock County Planning Corrnniss_ion, 1973
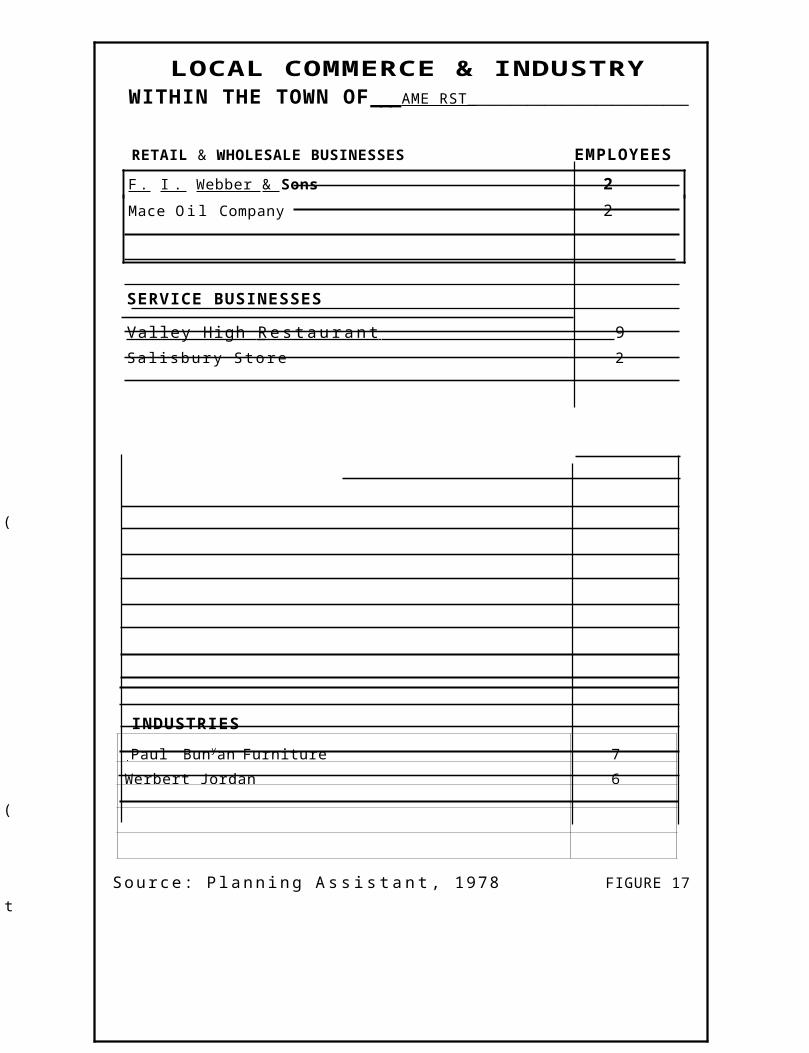
LOCAL COMMERCE & INDUSTRYWITHIN THE TOWN OF________AME RST ______________________________
RETAIL & WHOLESALE BUSINESSES EMPLOYEES
F . I . Webber & Sons 2Mace O i l Company 2
SERVICE BUSINESSES
Valley High R e s t a u r a n t 9Sa l i sbury S to re 2
INDUSTRIES
,Paul Bunyan Furniture 7Werbert Jordan 6
S o u r c e : P l a n n i n g A s s i s t a n t , 19 78 FIGURE 17
(
(
t_
C. RECOMMENDATIONSThe following recommendations are derived from responses in the Attitudinal Survey:1. In the Attitudinal Survey, fifty percent of the
respondants indicated a desire for an active social center within the community. A tDwn conservation commission should organize and promote expanded town social events in the manner of a PTA or church group, such as, planning a dance or movie each month at the town social center. As indicated in the survey, a large number of people would like to see the town hall repaired, maintained, and utilized as the town social center. Also, many respondants indicated they would like the town to acquire a piece of property to be used for a ball field and other outdoor activities.
2. By an overwhelming majority, the people of Amherst have indicated they want to maintain the rural character of the town, and try to maintain a stable population growth. As Amherst is now growing in population and is likely to continue to do so, the town should prepare itself to plan for a slow population growth. By a vast majority, the citizens have indicated they would like to discourage more seasonal homes and related activities in the community.
3, The townspeople would like to see traditional local resources (i.e. agriculture, wood) developed to provide more employment for year round residents. A significant number of people would like to see light industry (i.e. a small wood manu-facturing plant) developed in town. But by an almost unani-mous majority, the townspeople don't want to attract or encourage heavy industry.

- - - - - - - - - - - - - -
V
C O M M U N I T Y I N F R A S T R U C T U R E
A. INTRODUCTION
A coTn ityts infrastructure includes all aspects of com-munity life: government, land ownership, transportation, communication and human services. It consists of the traditions, institutions, services and facilities through which people interact with each other and the physical environment.
B. EXISTING SITUATION
1. Government and Taxation
Amherst is an organized town with the traditional Town Meeting-Selectman form of government. There are three selectmen, twenty other elected and two appointed offi-cials. The selectmen are also the town assessors and overseers of the poor. The other elected officials include a moderator for the town meeting, a town clerk, three members of the school committee and three members to the school trustee board. Also, there is a town constable, tax collector, town treasurer, two fi re war-dens, five members of the town planning board, a sexton and one member of the Hancock County Regional Pla nni ng Commission.
The two appointed officials are a plumbing inspector who inspects and approves new plumbing installations in Amherst and a public health officer, who works in con-junction with the public health nurse in overseeing the general health of the citizens in the community.
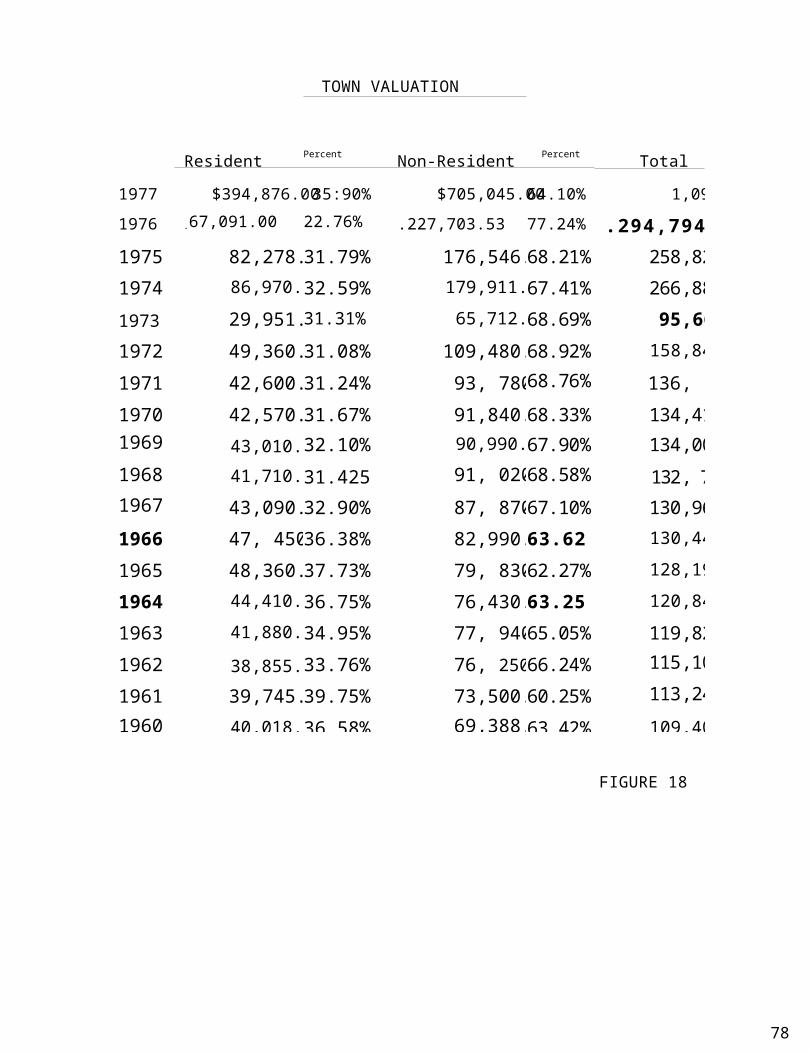
The following lists and graphs portray the recent trends in valuation, taxation, and the expenditure of this tax money in different areas. There is also a chart to show how Amherst compares in relation to communities in our area in terms of ability to fund town services.
4
TOWN VALUATION
Resident Percent
T o t a lNon-Resident Percent
TotalTotal
1977 $394,876.00 35:90% $705,045.00 64.10% 1,099,921.001976 .67,091.00 22.76% .227,703.53 77.24% .294,794
.531975 82,278.45 31.79% 176,546.61 68.21%
258,825.061974 86,970.00 32.59% 179,911.00 6
7.41%266,881.00
1973 29,951.00 31.31% 65,712.00 68.69%
95,663.001972 49,360.00 31.08% 109,480.00 6
8.92%158,840.00
1971 42,600.00 31.24% 93, 780.0068.76%
136, 380.001970 42,570.00 31.67% 91,840.00 6
8.33%134,410.00
1969 43,010.00 32.10% 90,990.00 67.90%
134,000.001968 41,710.00 31.425 91, 020.006
8.58%132, 730.00
1967 43,090.00 32.90% 87, 870.0067.10%
130,960.001966 47, 450.0036.38% 82,990.00 6
3.62%130,440.00
1965 48,360.00 37.73% 79, 830.0062.27%
128,190.001964 44,410.00 36.75% 76,430.00 6
3.25%120,840.00
1963 41,880.00 34.95% 77, 940.0065.05%
119,820.001962 38,855.00 33.76% 76, 250.006
6.24%115,105.00
1961 39,745.00 39.75% 73,500.00 60.25%
113,245.001960 40,018.00 36.58% 69,388.00 6 109,406.00
FIGURE 18
MMMMMM EMMMMEMMEMMMEMMAIM MM MI MEMMMMMMMMEMM MM 1 f li m c m
' EMMMI MMME ME IM = NM= M UM=MI MMMEM ME MEHME Rm c'm
MM MM/ MMMMI MMMMM: E F'''''' AMMMEMMPun _ a
_ . ETr
I O R N MEMOMMEMEMm
, MOrNMENammMEMEME
Residentdent
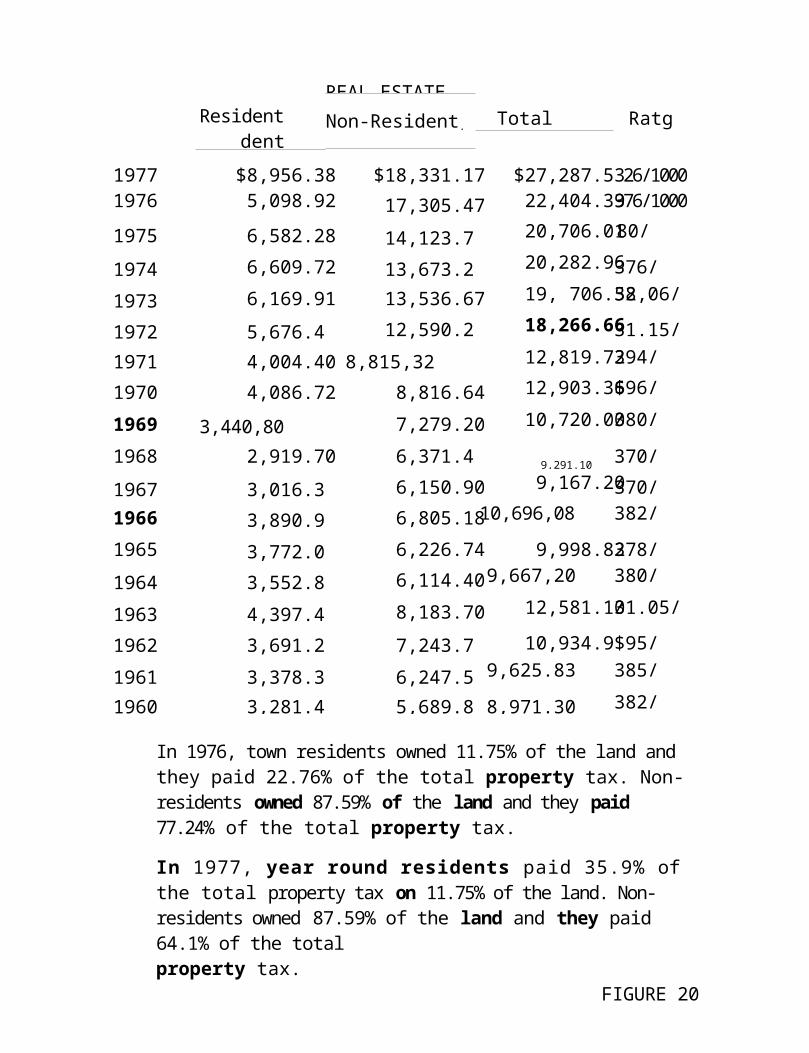
REAL ESTATE Total RatgNon-Resident.
1977 $8,956.38 $18,331.17 $27,287.55 326/10001976 5,098.92 17,305.47 22,404.39 376/1000
1975 6,582.28 14,123.73 20,706.01 80/
1974 6,609.72 13,673.24 20,282.96 376/
1973 6,169.91 13,536.67 19, 706.5832,06/
1972 5,676.43 12,590.23 18,266.66 31.15/
1971 4,004.40 8,815,32 12,819.72 394/
1970 4,086.72 8,816.64 12,903.36 $96/
1969 3,440,80 7,279.20 10,720.00 380/
1968 2,919.70 6,371.409,291.10
370/
1967 3,016.30 6,150.90 9,167.20 370/
1966 3,890.90 6,805.18 10,696,08 382/
1965 3,772.08 6,226.74 9,998.82 378/
1964 3,552.80 6,114.40 9,667,20 380/
1963 4,397.40 8,183.70 12,581.10 31.05/
1962 3,691.23 7,243.75 10,934.98 $95/
1961 3,378.33 6,247.50 9,625.83 385/
1960 3,281.48 5,689.82 8,971.30 382/
In 1976, town residents owned 11.75% of the land and they paid 22.76% of the total

property tax. Nonresidents owned 87.59% of the land and they paid 77.24% of the total property tax.
In 1977, year round residents paid 35.9% of the total property tax on 11.75% of the land. Non-residents owned 87.59% of the land and they paid 64.1% of the totalproperty tax.
FIGURE 20
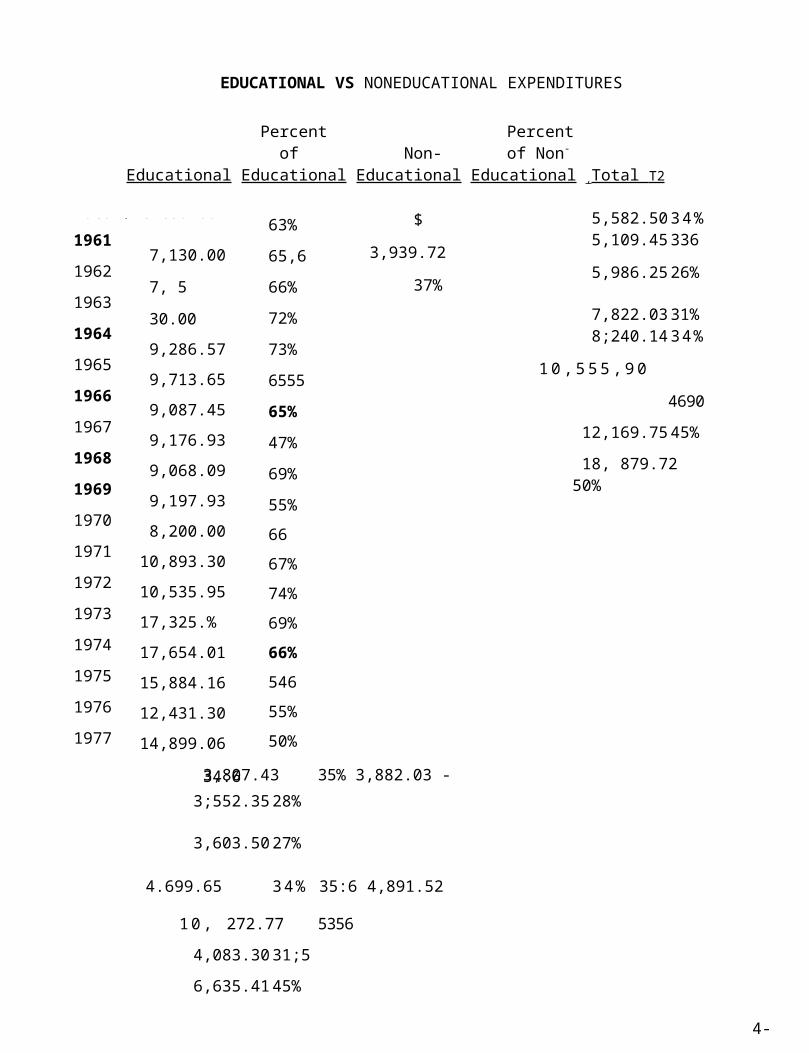
EDUCATIONAL VS NONEDUCATIONAL EXPENDITURES
Percent Percentof Non- of Non-
Educational Educational Educational Educational ,Total T2
$ 3,939.72
37%
3,807.43 35% 3,882.03 -34:63;552.35 28%
3,603.50 27%
4.699.65 34% 35:6 4,891.52
10, 272.77 53564,083.30 31;56,635.41 45%5,582.50 34%
5,109.45 3365,986.25 26%
7,822.03 31%8;240.14 34%
1 0 , 5 5 5 , 9 04690
12,169.75 45%18, 879.72 50%
4-9
7,130.00 7, 5 30.009,286.579,713.65 9,087.45 9,176.93 9,068.09 9,197.93 8,200.00
10,893.30 10,535.95 17,325.% 17,654.01 15,884.16 12,431.30 14,899.06 18,537.55
1960 $ 6,630.00 19611962 1963 1964 1965 1966 1967 1968 1969 1970 1971 19721973 1974 1975 1976 1977
63% 65,6 66% 72% 73%6555 65% 47% 69% 55%66 67% 74% 69% 66% 546 55% 50%
10,569.72 10,93743 11,412.03 12,838.9213,317=15 15,787.10 14,068.45 19,340,86 13:2.8123 14.835.41 ;6,475,80
15,645.40 23, 311.81 25,476.04 2rr,124.30 22,987.20 27,068.81 37,417.27
from 1960 to 1977, municipal expenditures in Amherst have increased a total of 254%.
FIGURE 21
4-9
4 _. .
EDU CATIONAL
j A
-' s
62 63 64 65 66 67 68 69 70 71 72 73 74 75 76 77 78 79 80 FIGURE 22
'k o_1iar5 in
thousa
nd
32.5
30
27.5
25
22.5
20
17.5
15
1245
107.5
5
2.5
01960
EDUCATIONAL vsNON-EDUCATIONAL EXPENDITURES
sviC
RELATIVE FINANCIAL ABILITY
Population State Valuation Valuation Per Capita,
1.977 0 1227
Amherst 148 211
$290,000
$1,000,000 $1,959.46 $ 4,739.34Aurora 72 80 260,000 900,000 3,611.11 11,250.00Otis 123 16
0950,000 6,350,000 7,723.58 39,687.50
far iav i l le 108 140
390,000 2,000,000 3,611.11 14,285.71Clifton 233 35
0690,000 3,150,000 2,961.37 9r000,00
;Jalth.am 167 210
360,000 1,350,000 2,155.69 6,428.57
Relative financial ability te l l s us how Amherst compares to towns in the area in terms of ability to finance town services, Valuation per capita should be noted particularly to compare Amherst to the towns in the region. Ahigh per capita valuation will usually indicate a relatively large amount of non-resident property in town. I f the .town's per capita valuation is more than that of the average regional town i t indicates that financing town services may create less of a burden, on resident property tax than i t does in the majority of towns in the region.
FIGURE 23
TRrF GROWTH LAND
Acres Value Tax
Diamond International 4,459.5 111,058 2,887.51St. Regis Paper Company 8,301.0 209,691 5,451.97G. P. Webber Timberland 5,440.0 137,637 3,578.56Harold B. Moore 741.5 23,090 600.34Clare S. Doolittle 668,0 19,349 503.07
19,610.0 500,826 13,021.45
TREE GROWTH VALUATION (1977)
Soft Wood Mixed Wood Hardwood OtherCamp lots Roads
30.50/acre19.40/acre7.80/acre40.00/acre
400.00/acre2,000.00/acre
Approximately 78% of the land in Amherst is valuated and taxed under Tree Growth Law. On this land, the town collects 47.7% of its total tax revenue. The $500,826 valuation of Tree Growth land represents 45.5% of the total town valuation. Out of a total town acreage of 25,306.9 (39.75 square miles), 19,610 acres (30.64 square miles) are under Tree Growth leaving a balance of 5,828.5 acres.
Percent of TotalTax Revenue
Tax Collected(land only)
Percent ofLand Owned
10.6% 2,889.64 11.77% = Residents47.7% 13,021.45 78% = Tree Growth
In 1977, year round residents paid 32.8 of the total property tax on 11.77% of the land. Non-residents owned
FIGURE 24

87.71% of the land and they paid 67.2% of the total property tax.
*This figure includes the tax paid on both the buildings and the land.
FIGURE 24
1977 TAX ON LAID AND BUILDINGS
Zed __________________________Buildin&sPercent Tax Percent Tax
Resident 10.6 2,889.64 22.2 6,066.74Non-Resident 13.3 3,627.00 6.2 1,682.72
Tree Growth 47.7 13,021.45
n/a n/a
Tax/acre taken in on Tree Growth land in 1977 = .66 acre.
I f the Tree Growth Land had been valued at $40/acre, (the standard woodland valuation in Amherst for 1977), the tax revenue would have been: $20,394.40 ($13,021.45 was the tax actually collected on this land.)
40 x 19,610 = $784,400 valuation$784,400 x .026 = $20,394.40 tax revenue on Tree Growth
$20,394.40 hypothetical tax revenue
-13,021,45 actual tax revenue$ 7,372.95 difference to be made up
When the state drew up the figures on tree yield/acre in Hancock County, all land in the county incluriing blueberry barrens and Mt. Desert Island was used to determine the yield. Therefore, the yield/acre would be shown artificially lower than it actually is on wood land. Consequently, the land under tree growth would be valued at a lower figure and the tax revenue to the respective communities on it would also be less.
FIGURE 25
77
2. Municiral ServicesMunicipal services are provided by the town to meet the needs of the community.
a.Amherst obtains police protection from three differ-ent sources. The Town Constable can be called upon to oversee any disturbances or problems until other law enforcement agencies arrive. A Hancock County Deputy Sheriff also patrols the area. The Deputy is to oversee rural crime (breaks, thefts, and the like) and he is to take charge at the scene of accidents or at major crime scenes until the Maine State Police arrive at which time he is to assist them in their investigation. The Maine State Police run periodic patrols through Amherst and are called in to take charge of any major crime, or motor vehicle accident.
An'ierstts fire protection is provided by the Aurora Volunteer Fire Department (approximately 2i miles east of the center of town). The department is made up of volunteers from Amherst, Aurora, Great Pond, and Osborn. Amherst pays the fire department, at present,500/year for its share of the overhead. This is a flat fee to cover building fires in Amherst. For forest or grass fires, the town is billed by the fire department, for the amount of time the men and equip-ment are used. The fire department was formed approxi-mately five years ago. Prior to that time, Amherst and the towns in the area depended on Ellsworth or Brewer for fire protection. In addition, the State Forestry Department houses a fire truck at the Paul Banyan Furniture Company Mill located in the center of town. The Forestry truck is available for fires in Amherst and the immediate are. The only cost to the town for the truck is maintenance and gasoline. Amherst has approximately a dozen Indian tanks for grass and forest fires and a number of lengths of fire hose.
78
(
(
(

b. EducationGrammar school education for the children of Amherst is provided at the Airline Community School in Aurora (approximately four miles from the center of town easterly on Route #9). The Airline Community School is a Community School District (C.S.D.) com-prised of Amherst, Aurora, Great Pond and Osborn.
The school was built in 1971 on three acres of land at the junction of the Great Pond Road and Route #9. The Community School replaces a number of one room schools in each of the communities. There are three class rooms (approximately 29 x 22, 24 x 22 and 18 x 20) and the basement (approximately 50 x 22) which is used for special education work, Also, there is a teachers room. The general condition of the schoolis good, but by state standards it is considered some-what overcrowed, especially the room housing kinder-garden, first and second grades. At present, there is no hot lunch facility at the school.
The school is staffed by three teachers, each of whom instructs three grades, and one of the teachers also is the principal. In addition, there is a teachers aide, and a part time special education teacher. One teacher instructs kindergarden, first and second grade; this year (771-781) she has 19 students. Grades 3, 4, and 5 are instructed by another teacher; this year she has 21 students. Grades 6, 7 and 8 are taught by the third teacher. This year there are 24 pupils in 6, 7 and 8th grades, so the ratio of students to teachers within the school is I to 21,3.The Superintendent of S.A.D. #63 (the Holbrook School) in East Holden, also acts as the Superintendent forthe Airline Community School District. The Superinten-dent along with the secretarial and bookkeeping services are retained by the Community School District. The
79

SOCIAL CHARACTERISTICS. Public School EnrollmentsChange 1970-1977
1970, 1,77 Number
Total Enrollments
Amherst 30 47 15 50
County 8,528 9,047 559 6.6
Maine 249,907 245,764 -4145 -1.7
Elementary Enrollments
Amherst 24 31 729.2
County 6,069 6,094 25 .4
Maine 177,932 166,704 -11,228 -6.3
Secondary Enrollments
Amherst 6 14 8 133.3
County 2:459 2,993 534 21.7
£iaine 71,975 79,060 7,085 9.8
FIGURE 26
Source: Maine Department of Education
80
SCHOOL ENROLLMENTSTOWN OF _____APUlRST
YEAR S
GRADE 1977 1976 1975 1974 1973 1972 1971 1970 1969 1968,Sub Primary 4 6 0 3 4 3 1 4 2 3
First 5 1 3 3 3 0 4 2 4 3
Second 0 3 3 3 0 4 4 5 2 3
Third 4 3 3 0 4 3 4 2 3 3Fourth 4 4 0 4' 4 4 3 3 3 2
Fifth 5 2 4 4 5 3 2 3 2 0
Sixth 2 3 4 6 5 2 3 2 0 3Special
SUBTOTAL 24 22 17 23 25 19 21 21 16 17
Seventh 2 4 7 3 3 3 3 1 03 2
Ei g hth 4 7 2 3 2 0 © © *© 0Ninth 6 © © © 4 0 0 4
S • ec ial - - - -SUBTOTAL ® 14 12 9 10 5 6 4 6 7
81
GRAND TOTAL f 43 46___136___1 36 38 ___! __29 ! ___33 28 32 FIGURE
27
30

Seniors 4 0 1 2 1 3 2 2 3
SUB TOTAL 7 10 7 4 3 5 6 5 6 8
Source: Airline Community School District, 1978
District pays a percent of S.A.D. #63's cost for the Superintendent and his office help, based on the per-cent of their time devoted to the Airline Community School District. For school year 1975-76, the Airline Community School District paid approximately $13,050 to S. A. D. #63.
The children at the school are provided with some basic playground equipment. There are soccer balls, baseball equipment, and basketballs. Tumbling mats have been purchased for indoor use. Outside there is a large area for recreation.
The School District will pay tuition (within reason) for secondary education at the school of the student's choice. The District provides bus transportation to Brewer High School, where the majority of students attend. Although, at present there are some students enrolled at John Bapst High School in Bangor. The tuition at Brewer is approximately $1,075 per student, per year, and at John Bapst, the figure is $950/year.
Amherst Public School EnrollmentElementary Secondary Total
1970 21 7 281975 29 7 361978 29 14 43
% 19700-7$e+38.10% +100; +58.57%
At the present time, school transportation is provided by the Mace Transportation Company. They carry the elementary children and make the trip to Brewer each day with the secondary students.
All post-high school education has to be acquired in either Ellsworth, Bangor or the University of Maine in Orono. There are no post-secondary courses available in the area.
83
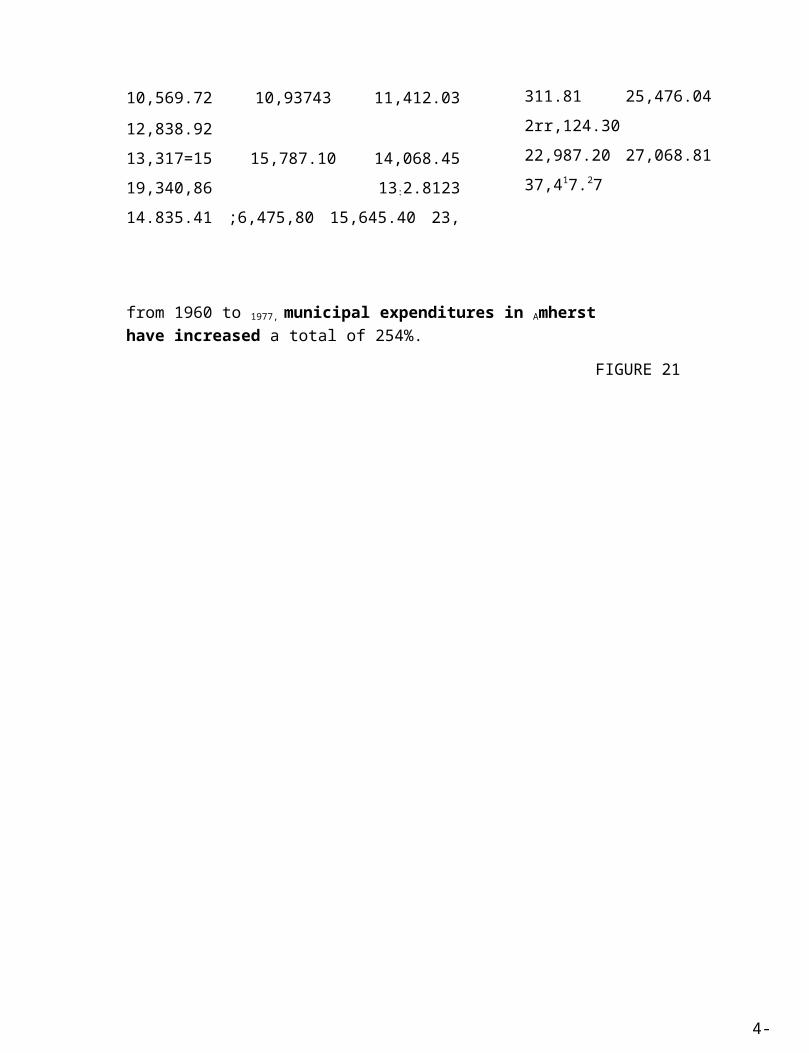
ANALYSIS of SOCIAL COHESIVENESS
TOWN OF A M L RST __________________________________
CHECK ONE BOX IN EACH GROUP.The object of this table is to attempt to analyze the extent of opportunities for residents of the
town to socially interact. If a high percentage of boxes on the left were checked, it would tend to indicate a high potential for social interaction. Conversely, many boxes checked on the right would tend to
indicate a low potential for social in te rac t ion .
1. % of labor force employed within Up to Up to Up to Lessthe town (estimate) 70% 50% 30% 10% than 5%
x
3. Presence of at l eas t one villagecenter, with the following elements:
-Several residences inclose proximity.
- General Store(s).-Post Office.- School(s).-Church(es).-Meeting hall(s).
Number of elements listed at lef
4. Presence anywhere in town of 4 3 2 1 Lessany of the l a s t four elements than 1listed in #3 above
(number per 100 population)X
5. Recreational f a c i l i t i e s in town 4 3 2 1 Less(per 100 population} than 1
x
6. Community betterment groups 4 3 2 1 Lessin town (estimated number than 1
2. Location of schools Located in town Located outside of townBoth Elem
& High
All Elem Grades
SomeElem
All Elem (SAD)
All Elem (no SAD)x
6 5 4 3
X
2 or less
per 100 population) X
7. Social clubs in town (estimated 4 3 2 1 Lessnumber per 100 population) than 1
xSource: Planning Ass is tant , 1978 FIGURE 28 59
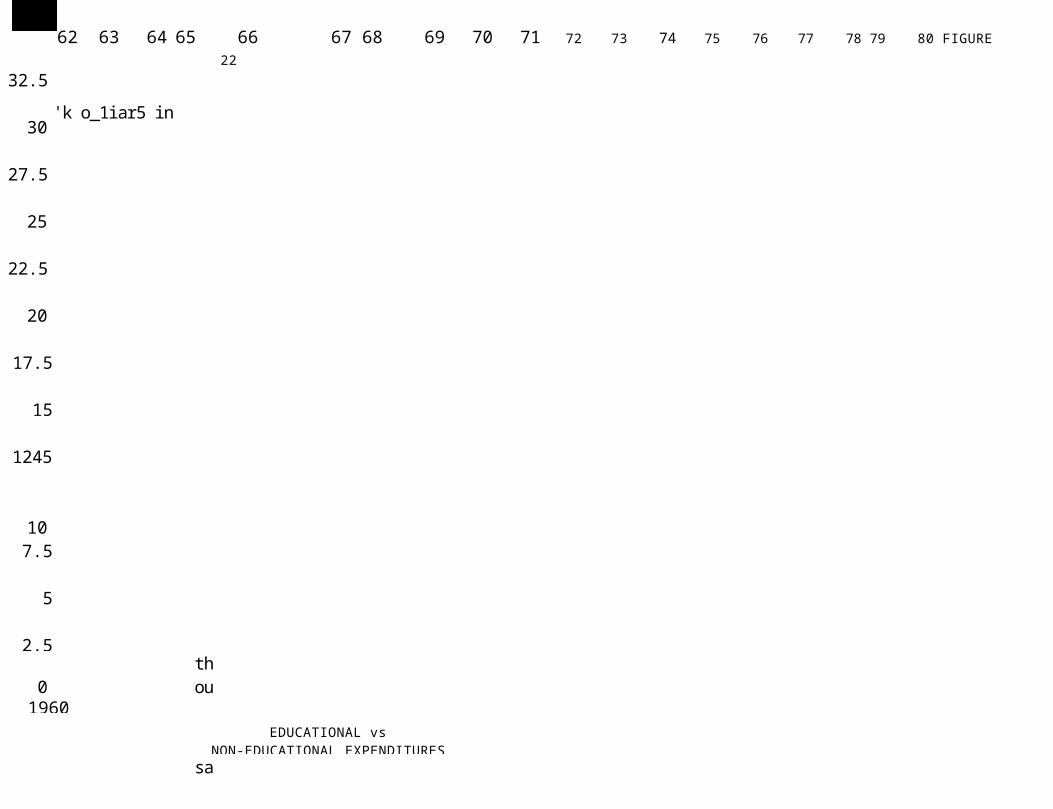
SOCIAL-RELIGIOUS-CIVIC ORGANIZATION
IN THE TOWN OF AMHERST
Numberof
Member
% MembersResidents
Frequency
of
Fac i l i t i e sAvailable
SOCIAL ORGANIZATIONSGOODWILL 47 81% Bi-monthl. Grange H a l l
SENIOR CITIZENS 55 31 Bi- Aurora Town Ha l l_
IRELIGIOUS ORGANIZATIONSLADIES AID 8 88% ku- Peomlets HomesSUNDAY SCHOOL 21 30% `Meekly ChurchAMHERST-AURORA E
CHURCH OF CHRIST
44 39% Weekly Church
CIVIC GROUPS
f
(
I

Source: Planning Ass is tant , 1978 FIGURE 29 60
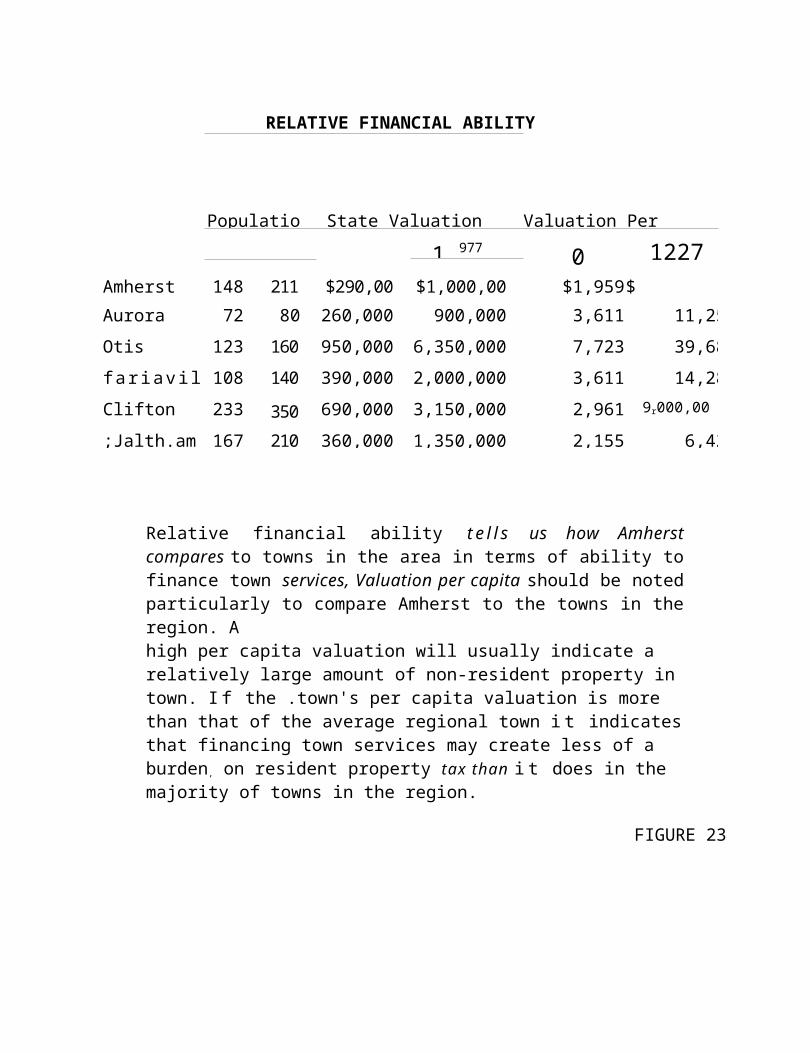
c. Recreation There is no organized recreation or recreation center in Amherst. People entertain themselves through such pursuits as hunting, fishing, hiking and various other means available to them in the counLry. The Town Hall occasionally is used for basketball, volley ball, and dances. The Grange organization (Goodwill Grange), is active and meets bi-weekly for its regular business meeting. The Grange, on occasion, sponsors a public supper, hunter's breakfast, and projects of this nature. There is also a Ladies Aid Society connected with the Amherst-Aurora United Church of Christ located in the center of Amherst. The women meet and sew articles that they sell to raise money for the Church.
d. Cemetery The town now maintains a cemetery off Tannery Loop Road. The original settlers' cemetery located next to the Town Hall is no longer in use. The town elects a sexton each year and provides him with funds for main-tenance of the cemetery. The present cemetery is approximately seven acres in area.
e. Highways Amherst is serviced by State Highway #9 which traverses the town in an east-west direction. This constitutes 7.54 miles of Route #9 within the town. State Aid Route #181 connects with Route #9 in the center of town and proceeds south to Otis where it connects with Route #180 and continues down to Ellsworth (approxi-mately 25 miles from the center of town). Route #181 is 1.47 miles long within the town before reaching the Amherst-Mariaville town line. All of Route #181 is paved. Other state aid roads in the town are Tannery Loop Road which is 2 miles long with approximately one half mile of it unpaved. The first half mile of the
88
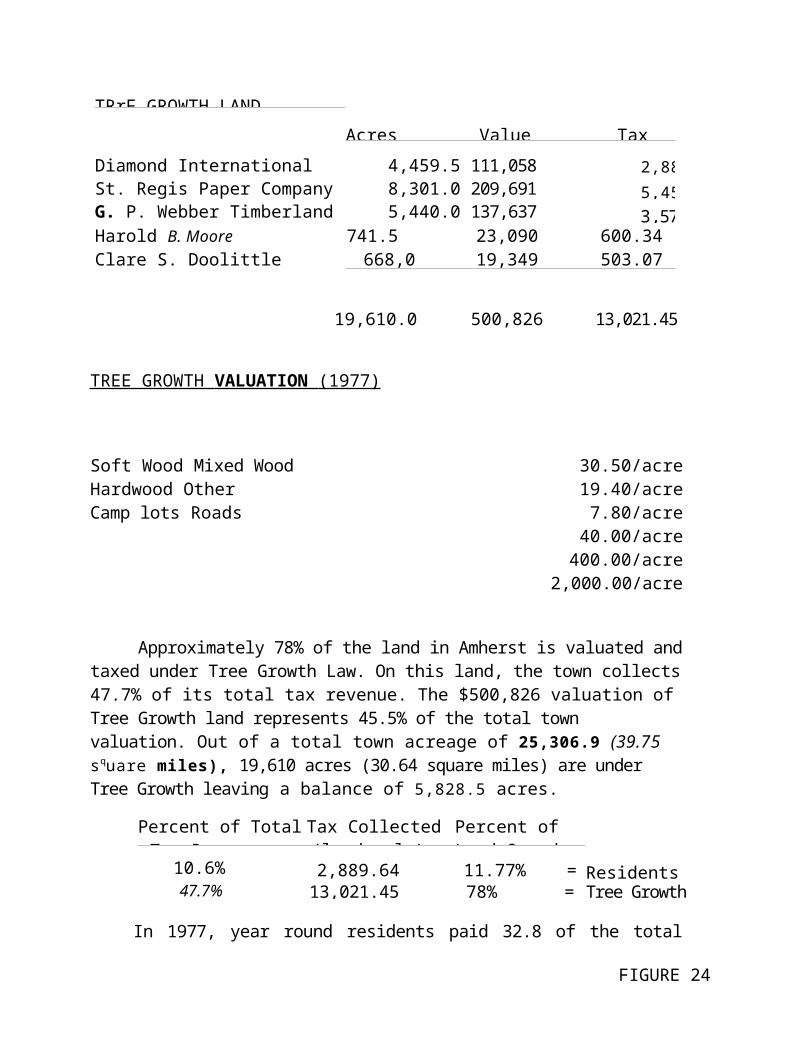
Smith Road is also state aid highway. This section of the Smith Road has been paved.
The town roads consist of the River Road (.29 miles), the Smith Road (1.46 miles), McDonald Road (.63 miles), Foster Road (.48 miles), Cemetery Road (.14 miles), and the Vachon Road (.14 miles). All of these roads are unpaved.
There are also some private woods roads that are generally single lane and graveled. All the highways and roads are shown on Map #4.
Road plowing and road maintenance are contracted by bid for the townts 3.44 miles of town road and 3.97 miles of state aid road. The town advertises for bids on this work in the Bangor Daily News. State Route #9 is plowed and maintained by the State Highway Department with crews from their garage located in Aurora.
f. Utilities The town of Amherst has no municipal sewer or water lines. Sewage disposal and water supply are provided by each house-hold for themselves, subject to state guidelines on plumbing and septic systems.
The Union River Electric Coop (located in Aurora) which was established in 1940 supplies Amherst with electric power. Before this time there was no electricity for the town. The Coop purchases its power from Bangor Hydro-Electric Co. for distribution to its customers.
g. Solid Waste Prior to 1963, solid waste disposal was an individual respon-sibility with most people maintaining a dump spot on their own property for their wastes. The present arrangement is that Aurora provides the site, and the cost of maintenance is divided among the three other towns (Amherst, Great Pond and Osborn) using the dump. The cost is determined among the towns by the tonage of waste each community generates. The tonage is derived according to the population figure of each town. Until the past year, the cost of Amherst has averaged approximately $200 per year, but with new, stricter state and
89
r r
A M H E R S TR OA D S
Federal Aid State Aid-----Town/Private
v1AP 4
I Inch ' I ' I I• FICPC 1919
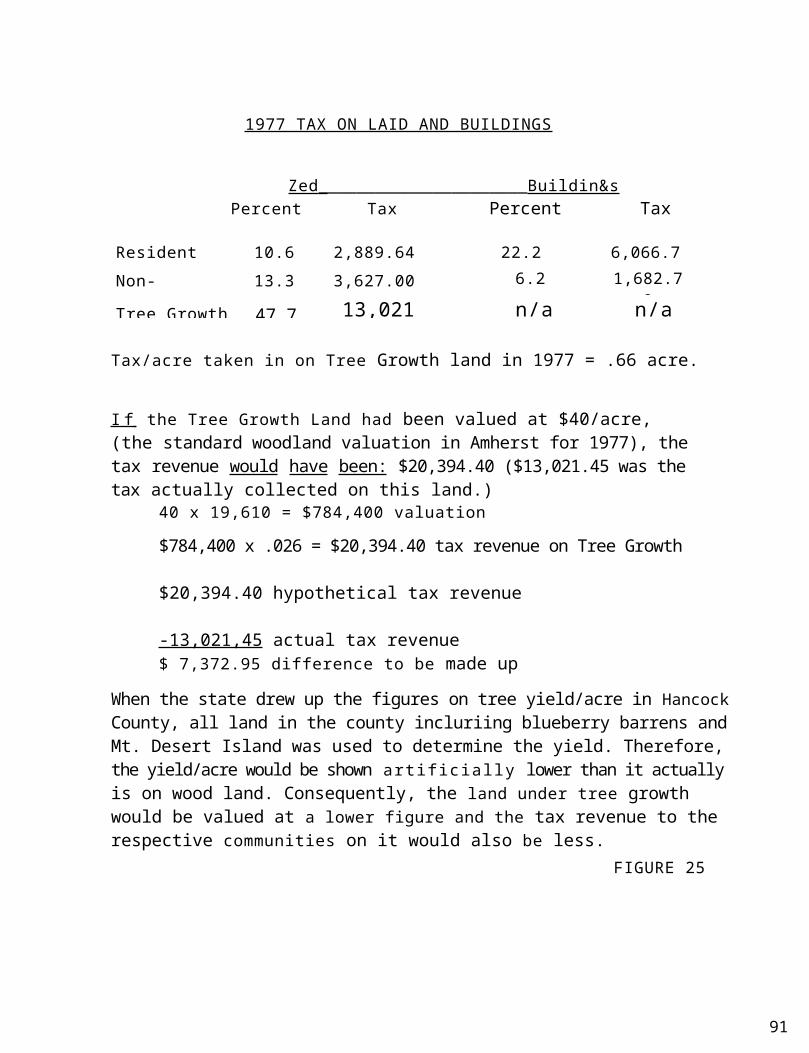
federal laws, the cost to Amherst last year (1977) rose to$1,500 (as compared to $471.80 for 1976). This dump is an open burning-land fill combination. The dump now has an attendant, a gate and established hours. The hours at pre-sent are from 10 a.m. to 5:30 p.m. on Wednesday and on Sunday from 10 a.m. to 4:00 p.m. There i s no town sponsored rubbish col lect ion.
h. Communication ServicesThe town is serviced by the Union River Telephone Co. located in Aurora. The name of the exchange is "Aurora" and Amherst has tol l - free service to the following communities: Aurora, Beddington, Otis, Deblois, Great Pond, Mariaville, Osborn and Waltham. However, there is a toll charge to call both Bangor and Ellsworth (the county seat).
The two local newspapers are the Bangor Daily News, published in Bangor and the Ellsworth American, published weekly in Ellsworth.
The town receives television broadcast from four stations, covering the three commercial networks and educational tele-vision; WYII, Channel 7 (ABC); WABI, Channel 5 (CBS); and WLBZ, Channel 2 (NBC), all broadcast from Bangor. WMEB, Channel 12 (PBS) is the education station and it broadcasts from Orono. There is no cable television available in Amherst.
A large number of radio stations, both AM and W are received in town. Almost any type of music and programing are availa-ble throughout this spectrum. These stations broadcast from many different areas, the most popular originate in Bangor, Ellsworth, Orono and Skowhegan.
Amherst Postal Service is a designated Star Route Carrier (#31) with delivery six days a week, originating out of Ells-worth. Approximately seven postal patrons west on Route #9 of where the western end of Tannery Loop Road intersects Route #9, are serviced by mail carrier from East Eddington (RFD #1). Amherst had a post office until 1968 when the post mistress retired. Amherst now utilizes the Aurora Post Office for any postal business.
91
COMMUNICATIONS SERVICES
Serv ing the Town of_________A M S T _________________________
POSTAL SERVICE
Is Post Office located in town? NoRural routes serving the town ( l i s t P.O. name and route number and
El lsworth American Ellsworth__________
NEWSPAPERS(Those which print news of the town and/or have wide circulation in
the town)NAME WHERE PUBLISHED WEEKLY DAILY
RADIO b TELEVISION(Those which cover local events of the town or which are
generally popular in the town)STATION LOCATION
(4 ,BC) WVII-TV C},an r ne l 7 B R n E p r ________________(CBS) WABI-TV Channel 5 Bangor______________(NBC) WLBZ-TV Channel 2 Bangor______________(PBS) WMEB-TV Channel 12 Bangor______________
WADI, WLBZ, WOUY--Radio Bangor______________
Is cable television service available? No
Bangor Daily News___________________Bangor
TELEPHONE
Company servicing the Town: Union River Telephone Company_______________Name of Exchange: A i t u n a ____________________________________________________Location of Central Office: Aurora_____________________________________________Toll free service to the followin9:Aurora________Beddingtgn, O t i s , Waltham,
bbloit,the o GrteatwnPiosnde, Mariyavmore illetitanone coUs*orn.NUlL: srved b m p a n y (or more than
show coverage area on a map of the town): Ellsworth Post O ffi c e
FIGURE 30
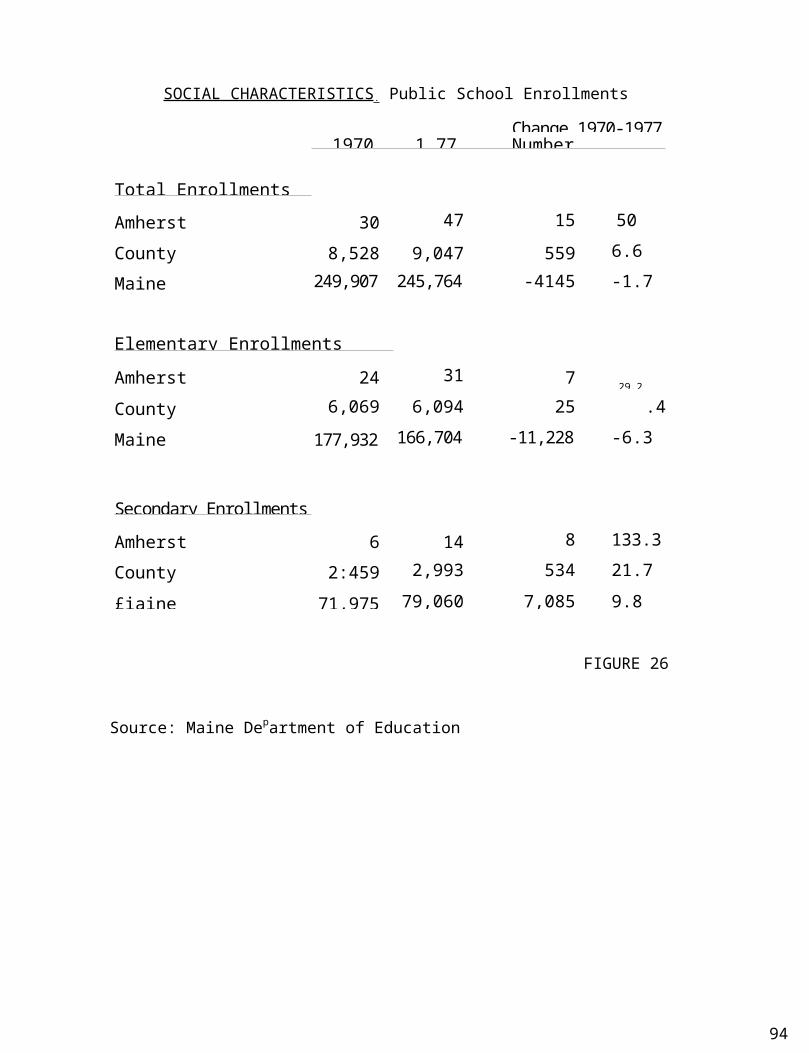
i. Commercial BusinessAmherst has a number of commercial businesses:
The Paul Bunyan Furniture Co., located in the center of town, consists of a sawmill and furniture manufac-turing operation along with a retail sales show room.
On Route #9 is the Valley High Restaurant offering full course meals, and take out service in the summer-time.
In the center of town on Route #9, Salisbury's store carries a general line of food items, some sporting equipment and hardware. Gasoline and oil are also available at the store.
A number of small businesses are located in people's homes; included in these are:
Two propane gas sales and service firms, a welding service, insurance sales, furnace oil delivery, snow plowing, construction work, and a woods operator who cuts and hauls wood for the pager companies.
Presently, there are no major timber harvesting operations in Amherst.
3. Human ServicesThere are a number of human services available in Hancock County and, therefore, for the citizens of Amherst in such areas as education, employment, health, legal (Pine Tree Legal assistance for low income) senior citizens and youth. The following are programs that are available and a brief description of their functions.
a. The Family Counselin g Service Center is located Ells-worth. The counseling center provides outpatient services for treatment of emotional and psychological problems. To accomplish their objective, the counsel-ing center provides many programs, included in thisare psychological testing and evaluation, psychotherapy (marriage counseling, alcoholic counseling and group therapy) and psychological counseltation with other agencies. Also there is a 24 hour emergency telephone
94
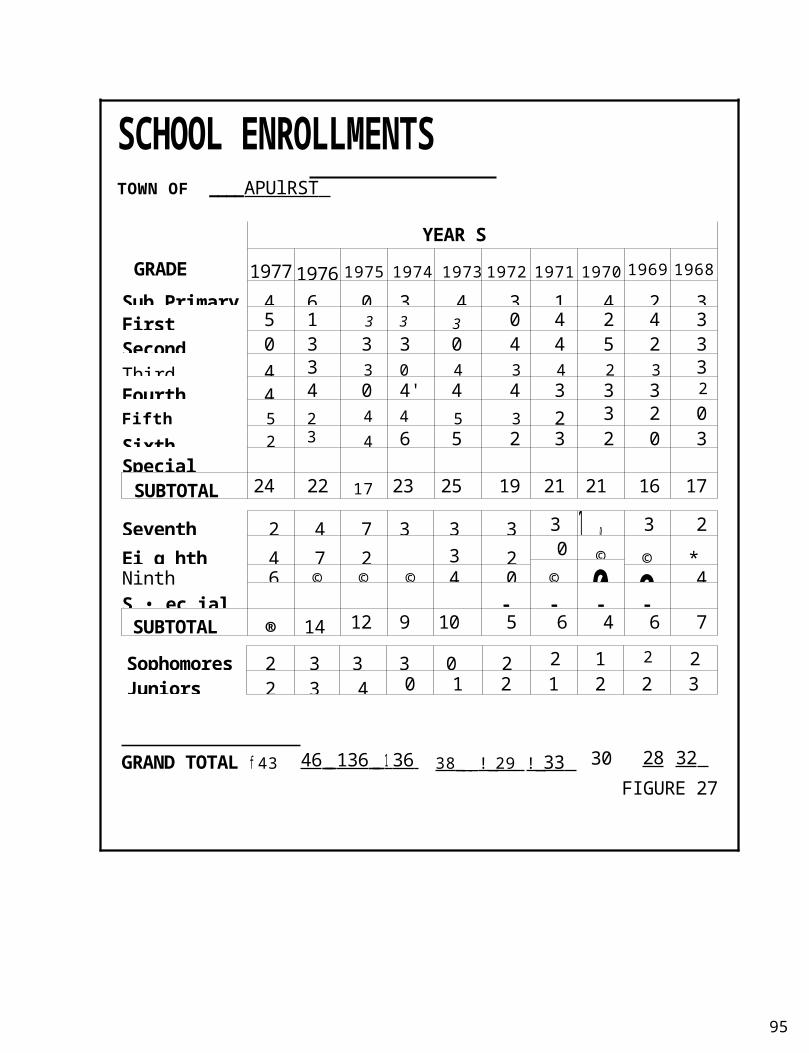
service (dial R711P), home health nursing (for those unable to get to a doctor) and a Homemaker Service which provides light housekeeping and other duties as a substitute homemaker in time of crisis,
b. The Meals for Me program is designed to provide a nutritious, low cost meal for citizens 60 years of age or older. In Bangor there is one meal provided a day, five days each week and in Ellsworth on four days a week. The menus for these meals are adver-tised in the Bangor Daily News. In both Bangor and Ellsworth, the meal will be delivered to citizens 60 years of age who are homebound and unable to prepare meals on their own. This program is not available in Amherst.
c. Maine Department of Man-sower Affairs Emmlovment Security Commission main-Wrist offices in both Bangor and Ellsworth to help people who are looking for work find employment. In order to do this, the Commission has many programs to help both employers and job seekers. They have employment counseling, aptitude testing, job analysis, skill surveys, labor market information, unemployment insurance (checks to the unemployed who qualify) and worker complaints.
d. Depa„rtment of Human Services includes child welfare, (i.e. foster care, adoption, and parent-child counseling), aid to families with dependent children (ADC), food stamps and a medical assistance program to help individuals or families in paying their medical costs.
e. Town Welfare is to provide immediate emergency financial assistance in various forms for food, shelter, clothing and medical care to individuals who meet the income guidelines of the town.
f. The Division of Public Health Nursing provides nursing services to rural areas. The Public Health Nurse works on health promotion, communicable disease control,
95
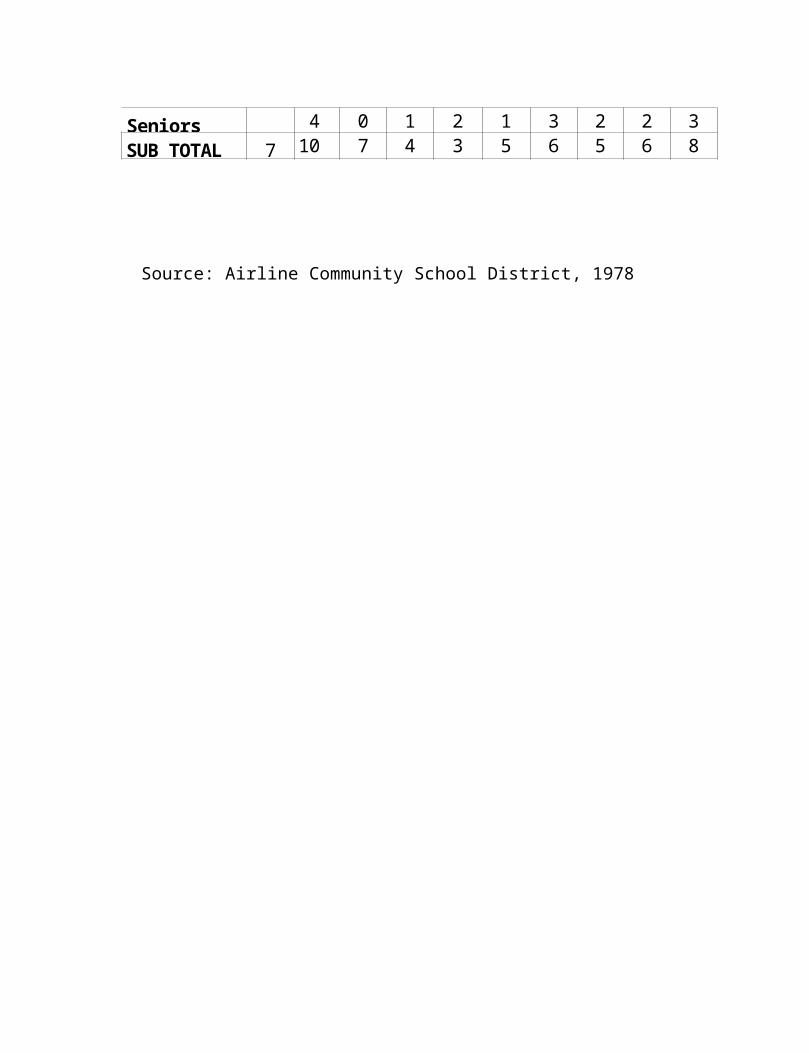
immunizations, prenatal care, school health services, and care of the sick in the community.
g. Eastern Maine Medical Center in Bangor and Maine Coast Mem orial Hos p ital in Ellsworth are both utilized by the citizens of Amherst for their medical needs. The ambulance service out of Ellsworth is also used by the people of the town for emergency transportation to medical facilities.
h. The Community Action Pro g ram (CAP) provides home improvement and winterization to the elderly and low income. For winterization, CAP will spend up to $350/house to stop the infiltration of cold. This includes insulating, banking the home and tightening around doors and windows (Including installation of storm windows). In order to be eligible for this work, the household must qualify under the low income guidelines and an application form must be filled out and presented. Also, the home must be in good enough condition to warrant the investment in materials and labor.CAP, also has a "Handyman Project" in which they will provide the labor, and the home owner buys the material for maintenance pro jec t s on households that qualify under low income.
There is also a transportation program run by CAP designed to provide regular transportation for citizens and low income, In Amherst, the people are picked up at their homes Tuesday of each week. The bus then takes the people to ? p gor and/or Ellsworth, depending on the needs of the passengers.
4. Transportation ,There are a total of 187 vehicles registered in Amherst at the present time. Of these, 119 are Class P (passenger) vehicles. This figure also includes privately owned school buses and may include pickups and vans. Fifty one vehicles are registeredas Class C (commercial). This Class is for trucks and also may include pickups and vans. There are 11 motorcycles (Class) registered in Amherst, 4 trailers {Class T), 1 tractor
(Class R) and 1 farm truck (Class F). With a population of 211 and 183 motor vehicles registered (187 minus 4 trailers), it shows how heavily dependent on private transportation the citizens of Amherst are.
96
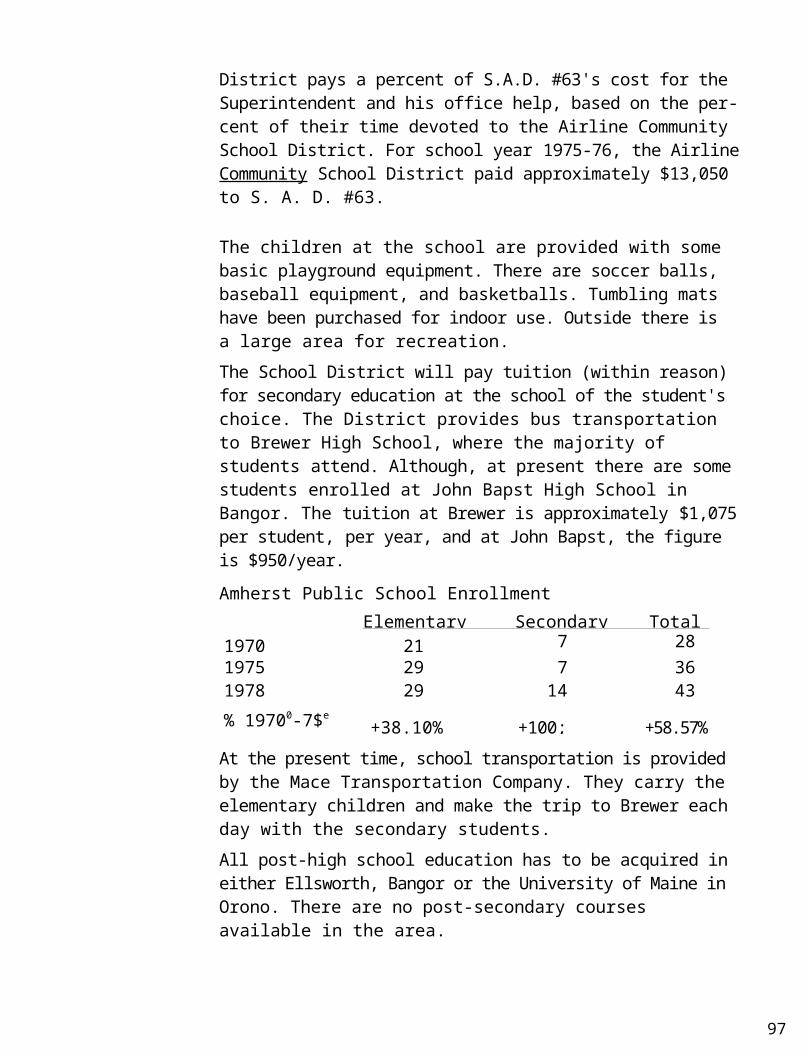
TRANSPORTATION _
TOWN OF_________AMU RST
AIR SERVICENearest scheduled a i r service: Bangor or Trenton________
97
tHIGHWAYS
Served by: Highway Numbers Mileage
Route 9 7.54Kenniston Road
Route 181, Tannery Loop & 3.97River Rd. Kenniston Rd.,McDonald R d., Arno Foster Rd 3.44Cemetery x V c o o n R d..
otal , a14.95
Name of Carrier C o l e ' s Express
U n i t e d P a r c e l S e r v i c e
P a r c e l P o s t
Bus Service
Name of Line Service to Trips DoilyWashington-rncocic CommunityAgency__Bus (Senior Citizens Bangor/Ellsworth Once a Weekhandicapped, and. low income)
Nearest bus service (if not available in town): Bangor or Ellswor
Taxi ServiceLocal Company:____Non e Out-of-town Company serving the town:_____________________________
Interstate Highway
Federal Aid Highway
State Aid Highway
Town Roads
Motor Carrier Service
RAILWAYS Served by
Maine C e n t r a l Bangor and A roos took
Nearest rail loading point:
Freight Facilities YesYes______
Bangor or Ellsworth Falls
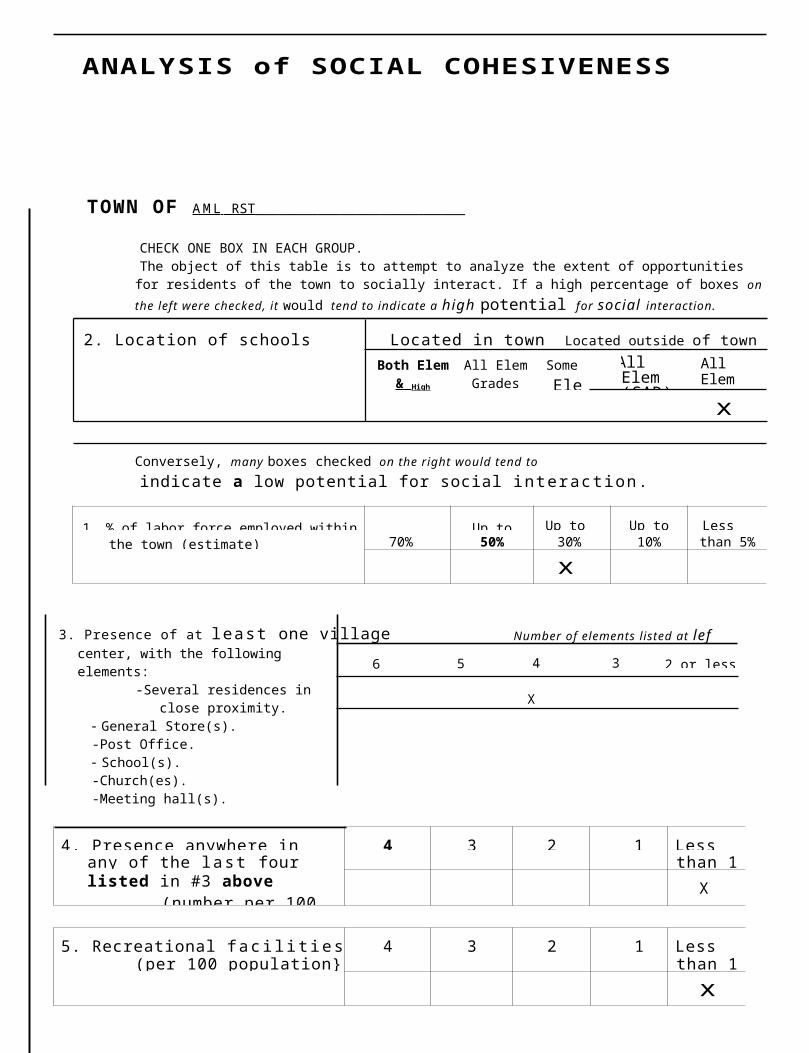
Nearest airport facility: Bangor or Trenton
FIGURE 31
98
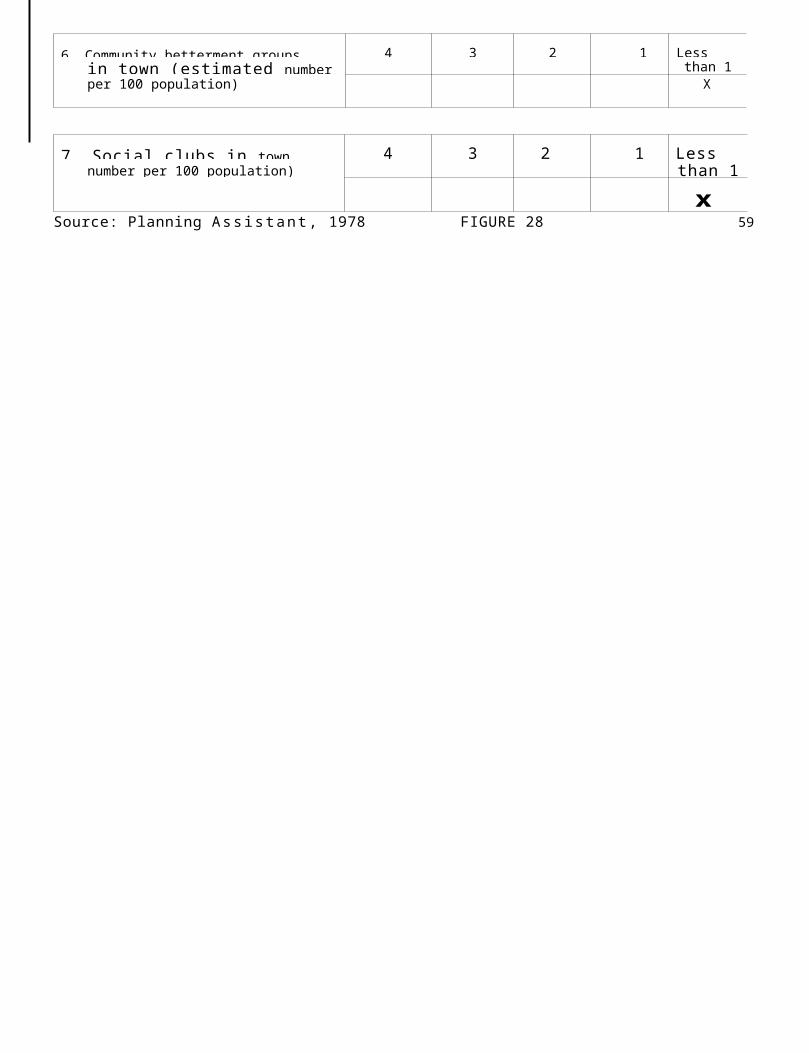
There are no commercial bus or taxi services available in Amherst. The nearest bus or taxi, service would be in either Ellsworth or Bangor. A similar situation exists for air services. The nearest airport facilities are located in Bangor (Delta Airlines) or Trenton (Bar Harbor Airlines).
5. IousingThere are 127 housing units in the town of Amherst of which 87 (69%) are year round homes, and 40 (31%) are seasonal structures. Of the 87 year round units, 63 are single family, 2 are two family units and 20 are mobile homes. Currently, of the two multi-family units, one is occupied by two fami l ies and the other has only one family. Sixty-seven year round homes are owner occupied, 11 are rentals (5 of these being mobile homes), and 8 are vacant (2 of which are for sale). One of the 11 rental units is also up for sale. Of the 87 year round units, 75 have plumbing and 12 are without it.Overall, the general condition of housing in Amherst is good. Most housing units are well kept and in good condi-tion. Eleven homes {12.6% of the total year round units) are somewhat deteriorated and one (.01%) is dilapidated and abondoned. There seems to be a small but constant supply of homes for sale in Amherst. At present, there are no rental units available in town but they do become available on occasion.Since 1965, the number of year round housing structures has increased by 29 units which is 33.3% of the total year round units in the town. This is probably the largest amount of housing construction since the end of the 1800ts when the town was at its economic and population zenith. The trend in new housing units in Amherst appears to be for mobile homes. Of the 29 new housing u n i t s since 1965, 19 (65.5%) are mobile homes.There has been one subdivision applied for and approved by the planning board in Amherst. This subdivision was in 1976
99
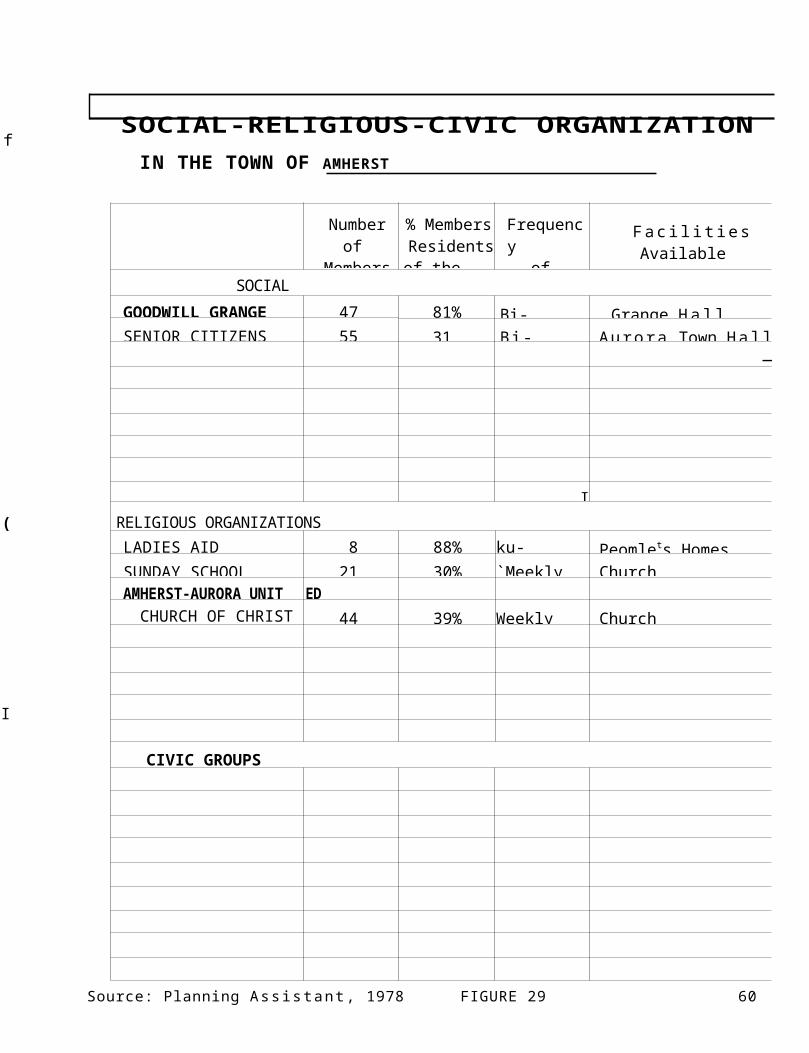
and contained 2.1 acres for one lot and one house only.For the most part the 40 seasonal structures in Amherst fall into the category of hunting and fishing camps. With the exception of a few places, it would not be practical to try and convert these seasonal units into year round homes, There are a number of different reasons why this would be impractical. Many are very inaccessible, especially in the winter months, and also the original construction is such that it would not be feasible to put either the material or labor into them.
The following charts will visually portray the figures on housing in this write up.
(
(
100
(
(
C
,
101
HOUSING COUNT - 1978TOWN of ADII RS
NUMBER of HOUSING UNITSType Number % of Total
Housing Units
Year-round units 87 69Seasonal units 40 31TOTAL HOUSING
UNITSi 2 7
YEAR-ROUND HOUSING UNITSType Number % of Total
Housing Units
102
r

Owner-occupied units 6 7 53Renter-occupied un i t s 11 9TOTAL OCCUPIED UNITS
78 62
Units for sale 3 2Units for rent
Other Vacant Units 6 5TOTAL VACANT UNITS 8 6
Source: P l a n n i n g A s s i s t a n t , 1 9 7 8FIGURE 32
(
L
103
.
104
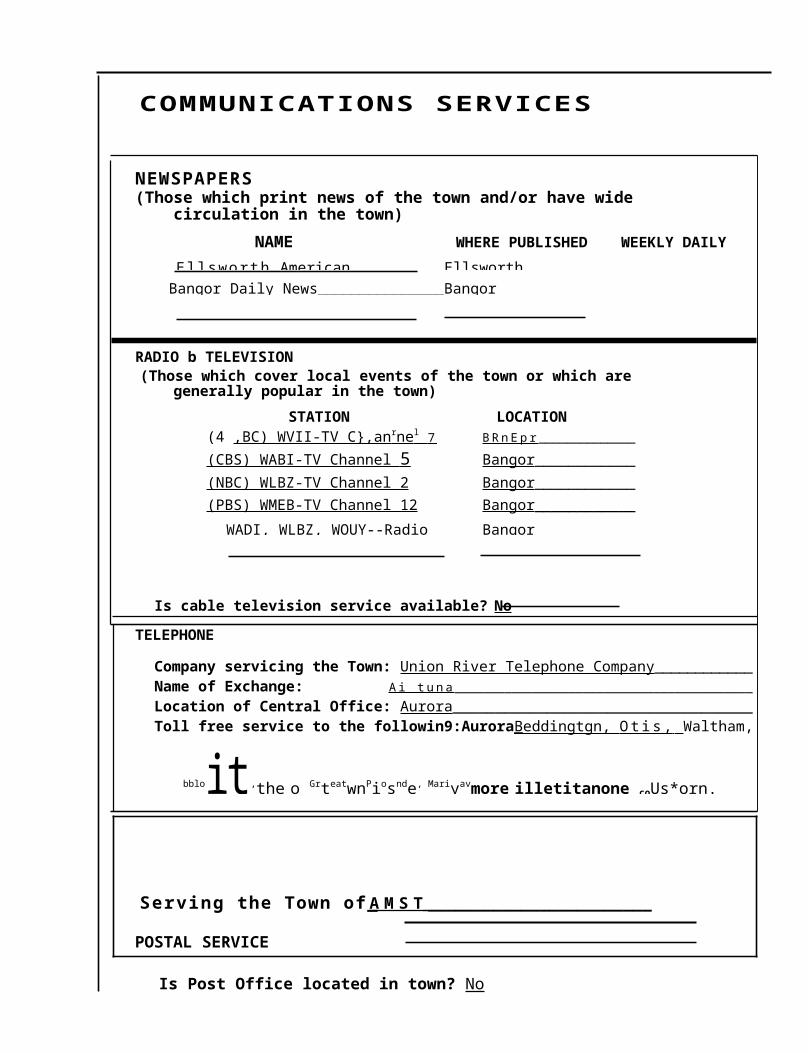
HOUSING TYPESYEAR-ROUND UNITS ONLY Town of AFII ERST
TYPE of BUILDING NUMBER of BUILDINGS %
1 Family . 63 74
2 - 4 Family 2 2
5 - 9 Family
10 + Family
Mobile Home 20 24
Source: Planning Ass i s tan t , 1978FIGURE 33
105
f

TOWN of AMMRST ___________________________________________
HOUSING SURVEY
106
Housing Count% of Total
YEAR-ROUND UNITS '87 69SEASONAL UNITS 40 --3.TOTAL HOUSING UNITS 127
TYPE of BUILDING # of Buildings % of Yr-rnd
Single family 63 74Two-Family 2 2Multi-FamilyMobile HomeTrailer 20 24Mixed Residential/Commercial
Housing ConditionCONDITION*
TYPE A B C
Single Family 51 11 1
Two-Family 2
Multi-Family
Mobile Home/Trailer 18 2
Seasonal 38 2
Mixed Residential/Commercial
_
TOTALS 109 15 1% of Total Units 87 12 1
*St ruc tu ra l Condition:A = S t r u c t u r a l l y soundB = DeterioratedC = Dilapidated FIGURE 34
Source: ___P 1 a n i n q Ass is tant , 1978
TOWN of AMMRST ___________________________________________CONDUCTED by____N i c h a e l D. Po roar DATE___3 / 7 8
107

YEAR STRUCTURE BUILT
YEAR-ROUND UNITS ONLY Town of ANB RST
1939 or earlier
Structures
49
1940- 1949 1
1950- 1959 2
1960- 1964 4
1965- 1969 6
1970- 1974 141975- 1978 9
Source: Planning Assistant, 1978
VALUE of HOUSING*
T o w n o f A M H F , R S T
% of Total Reported
# of HousesRetorted Town Region
Total
State
TotalState
less than $5,000 1 1
108
Town RegionTotal Rural
State58
1
2
s 57
16

$5,000 - $9,000 18 21
$10,000 - $14,000 10 1 12
$15,000 - $19,000 7 8
$20,000 - $24,000 32 38
' $25,000 - $34,000 17 20
$35,000 - $49,000
$50,000 and over
* is s only the value of the buildings; not setting orSource: 'la_nr i ng =assistant, 1978 FIGURE 35
109
TOWN of AMHERST
This information indicates the number of new houses bu i l t in recent years. Comparing this with the information on number of housing units, you can compute the percentage of growth.
Note: From 1950 through 1974 there was a 30% housing increase as compared to a 10.3% increase in the four year period from 1975 through 1978.
Source: Planning Ass is tant , 1978
110
HOUSING STARTS
Number of UnitsYEAR Year-round Mobile hom= % Change -
1950-1959 2 1 5.5
1960-1964 3 5.21965-1969 1 5 9.4
1970-1974 5 9 17.91975-1978 4 5 10.3
TOTALS 15 20 100.0
FIGURE 36

HOUSING NEED ANALYSISTOWN of ANlRST
Based on data from: Planning Assistant, 1978
I. HOUSING NEED(a) Number of households
(occupied housing units) 78,0 la
plus (b) 1.5% for undoubling* 1,1 lb
plus (c) 5% for vacancy** 3.9 lc
equals (d) HOUSING NEED 82.0 Id
2. HOUSING SUPPLY(a) Number of Housing Units
(all year-round units) 87 2a
minus (b) Dilapidated or unusable 1 2b
equals (c) USABLE HOUSING SUPPLY 86 2c
3. NET UNITS NEEDEDThis is the differencebetween usable housing supply2c, above) and housing need1d, above) -4 3
4. SUBSTANDARD HOUSING(a) Units with inadequate
plumbing 7
plus (b) Overcrowded units (exclud-ing units also in 4a, above) _ 0 4b
equals (c) SUBSTANDARD. HOUSING 7 4c
5. NEW HOUSING NEEDNet units needed (3, above) -k
plus Substandard Housing (4c, above) 7
equals NEW HOUSING NEED
* An estimate of housing units with more than one family (or household) living therein.
** In order to insure adequate choice in the housing market, a vacancy rate of 5% is considered desirable.
FIGURE 37
111
{
(
(
L
L,
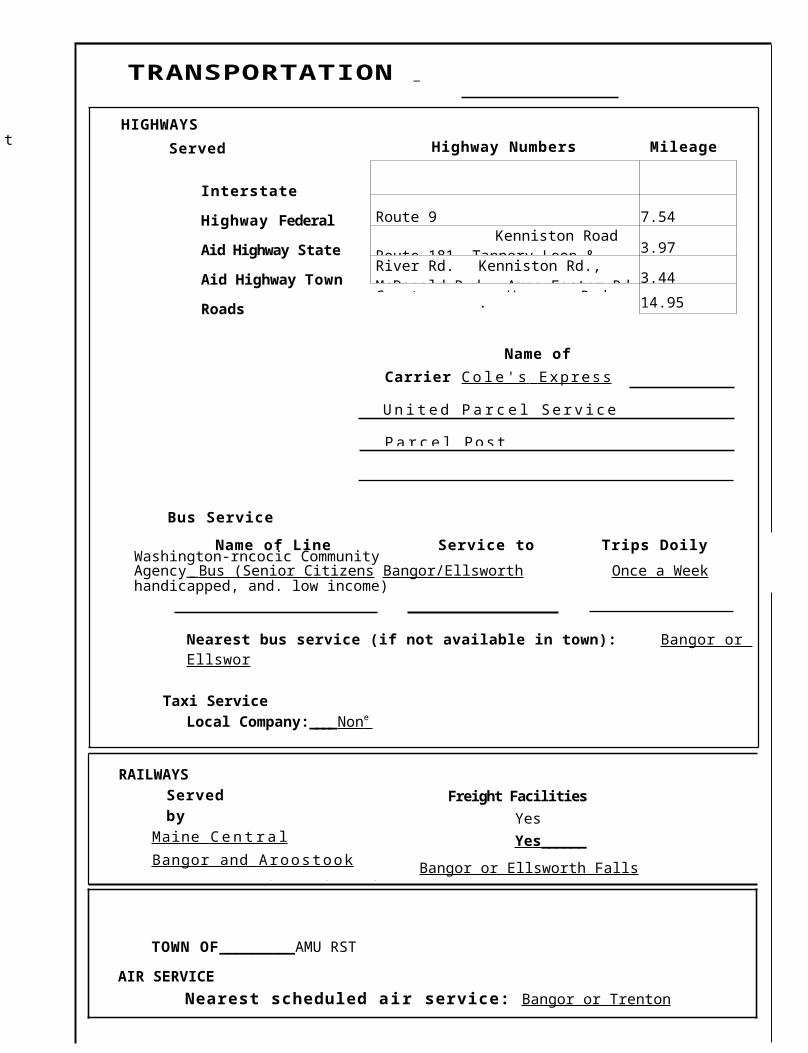
PROJECTING THE NUMBER OF DWELLING UNITS IN YOUR TOWN
The total number of dwelling units in a town in a future year can be projected by using a population projection and anestimate o the average number of persons per household. By f i l l i n g the blanks below with reasonable numbers, project thenumber of dwelling units in your town. .
Population Average Number of -Persons per Dwelling UnitTotal Without Trailers
Total Number ofDwelling UnitsTotal w/o
1975/78 211 2.43 3.15 87 67
Projected1980 226 2.43 3.15 93 72
Pro ected199 244 2.43 3.15 100 78
Pro0ected200 264 2.43 3.15 109 84
In order to find the average number of persons per dwelling unit divide population by the number of ex is t ing houses (year round).
From the projection of the to ta l number of dwelling units whichyou make for your town, it should be possible to also calculate the number of new dwelling units which will be needed. Simplysubtract from the projected t o t a l number of dwelling units the number of existing dwelling units which you expect to be habitable in the future:
Total w/o Trailers93 72 Projected Total Number of Dwelling Units in
198079 60 Total Number of Existing Dwelling Units
Expected to be Habitable in 198014 12 Projected Number of New Dwelling Units needed
by 1980To project the acreage which new housing would consume, estimate the area which will be consumed by the average new dwelling unitand mutiply bye the rojected number of new dwelling units:
Total w/o Trailers14__________12 Projected Number of New Dwelling Units
Needed by 1980one acre ___________ Acreage Consumed by Average New Dwelling Unit
14 ______________12 _______ Projected Acreage to be Consumed by New Dwelling Units by 1980
FIGURE 38 Source: Hancock County Planning Commission, 1978
112

LAND SUBDIVISION ACTIVITY
TOWN OF______AmERST ____________________________ Information for Years 1 9 _ through 19 78
Map Name or Owner of Subdivision!see location on Map L-2)
YearApproved
Total# ofLots
AverageSize of
Lots
Williamson l o t 1976 2.1+ 1
{
yf
w _
113
Source: RegisL .y of Deeds, Ellsworth FIGURE 39
114
MAP SYMBOLS
• SINGLE FAMILY
A MOBILE HOME
(i TWO-FAMILY
CD MULTI-FAMILY
/ ) MIXED RESIDENTIAL/COMMERCIAL (includes apartments't over businesses and units with home businesses)
0 COMMERCIAL
PUBLIC & SEMI-PUBLIC
f 1 INDUSTRIAL
X ABANDONED
Q SEASONAL
0 FARM
FIGURE 40
SO

LEGEND
*MIIC 11MUMCm ROAO6 1RAV[L *0A01 * L 1
AMHERSTHOUSING
T R
4 5
110 ..,MO
116
4000
fC0T
.' 110
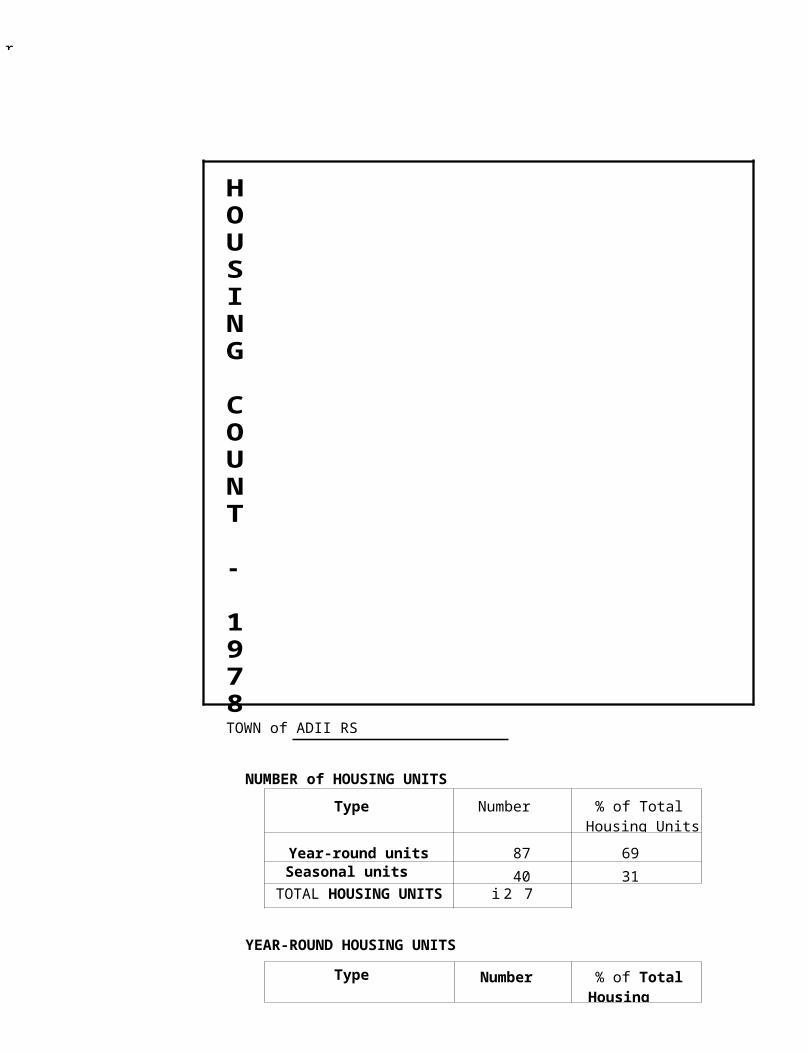
6. Xiand Ownershi p and U s Q Amherst is approximately 39.5 square miles in area, con-taining 25,127.9 acres of land (of which 2,528 acres are bog and swamp) and 179 acres of water for a total of 25,306.9 acres. This makes Amherst slightly larger than a standard township of 36 square miles conteiring 23,040 acres. The majority of this acreage, 21,060.75 (83.22% of the town) acres, is owned by non-residents (i.e. paper companies). Of this 21,060.75 acres, 19,610 is under Tree Growth Tax law. There are a total of 45 separate non-resident land owners with holdings in Amherst. Non-residents are individuals or corporations who don't have homes or camps on their property and own the land for other reasons than to live an it or for recreation. The year round residents of the community own 2,975.73 acres which is 11.75% of the total land area in Amherst. There are 70 different resident land owners in the town. Sea-sonal land owners (i.e. camp owners, etc.) have 1,107.85 acres (4.37%) in Amherst. There are 22 seasonal residents owning land here. The town itself has approximately 4 acres (.02%) of semi-public land which includes the church, grange and cemetery. Roadways (state, state aid and town) take up 119.6 acres (.47%) in Amherst. There are no county, state or federally owned lands in the community.
Industry (the sawmill) in Amherst, utilizes approximately 19 acres of land, and 11.75 acres are used commercially (the store and restaurant). There are 132 acres in agri-cultural usage at the present; all this acreage is in blueberry production. Recreation, in the form of the camping grounds on Debeck Pond, comprises 37.3 acres. The town itself has no parks or other recreational land, By far the majority of land in Amherst is used for timber -production.
mere are a total of 68 lots of one acre or less in Amherst, 60 of these have buildings on them and 21 of the 68 lots are owned by non-residents. Fifty six lots range from 1.1 to 10 acres in size. Of these, 31 have buildings and 16
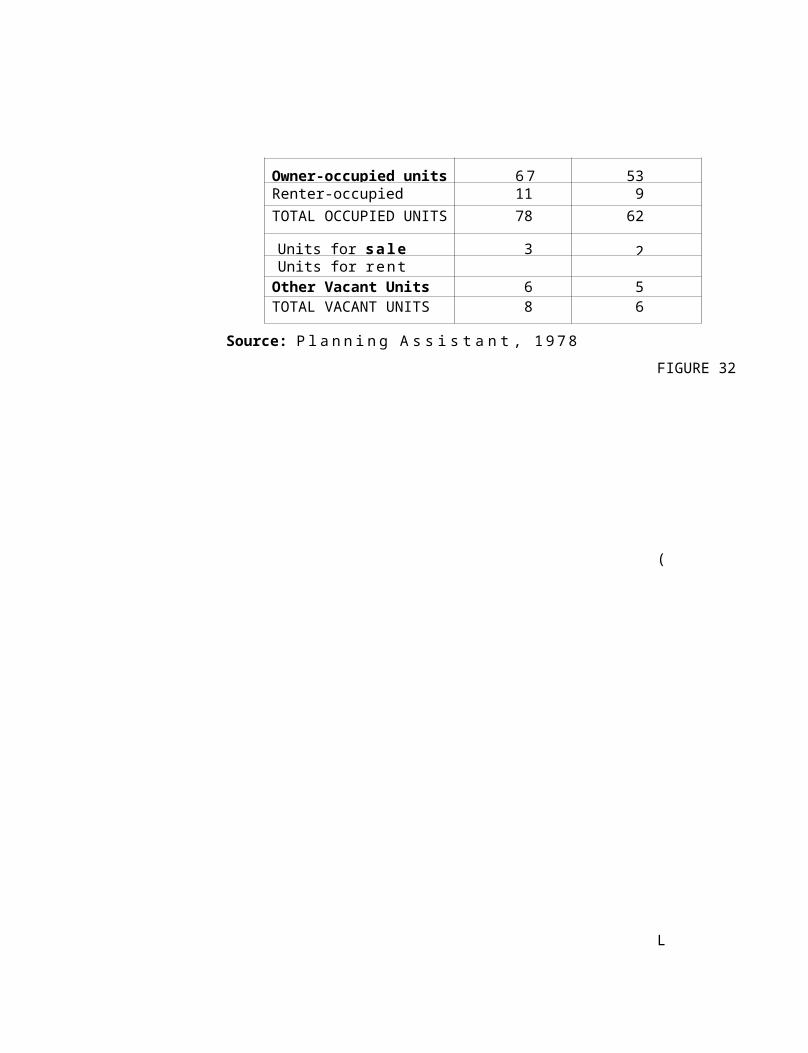
e a

lots are owned by non-residents. There are 54 lots that are 10.1 to 50 acres in size, 24 have buildings and 24 are non-resident owned. From 50.1 to 100 acres there are 43 separate lots, 11 of them have buildings and 23 of these lots are nun-resident. Lots of 100.0 to 500 acres number 25 in Amherst, only 1 has a building on it and 20 of them are owned by non-residents. There are 5 lots in excess of 500 acres in the town and none of these have buildings on them. All 5 of these lots are non-resident owned.
Shoreland zoning places a total of approximately 1,041.67 acres into resource protection zones throughout the town. The Shoreland ordinance constitutes the only zoning in Amherst at the present. State law does generally require that any subdividions in the community must go before the town p1snning board for review and approval.The following charts will visualize many of the statistics in this write-up.
C. RECOMMENDATIONSGovernment1. New po s i t i on i n town government should be created.a.. In order to implement any plarning guidelines and
ordinances, a code enforcement officer must beselected. Tentative recommendation is that suchan officer have regional (Amherst, Aurora, GreatPond, Osborn) jurisdiction rather than be limited solely to Amherst.
b. Planning Board o f A pp e a l s . E v e n i f Amherst decides not to adopt any further land use ordinances, a board is required to hear appeals concerning shore-land zoning decisions. The creation of such a board is intended to provide more citizen input into plan-ning decisions and ruleings.
c. Conservation Commission. If the town were interested in building recreational facilities, such a commission would be necessary to explore the possibility of applying for and receiving federal and state financial support.
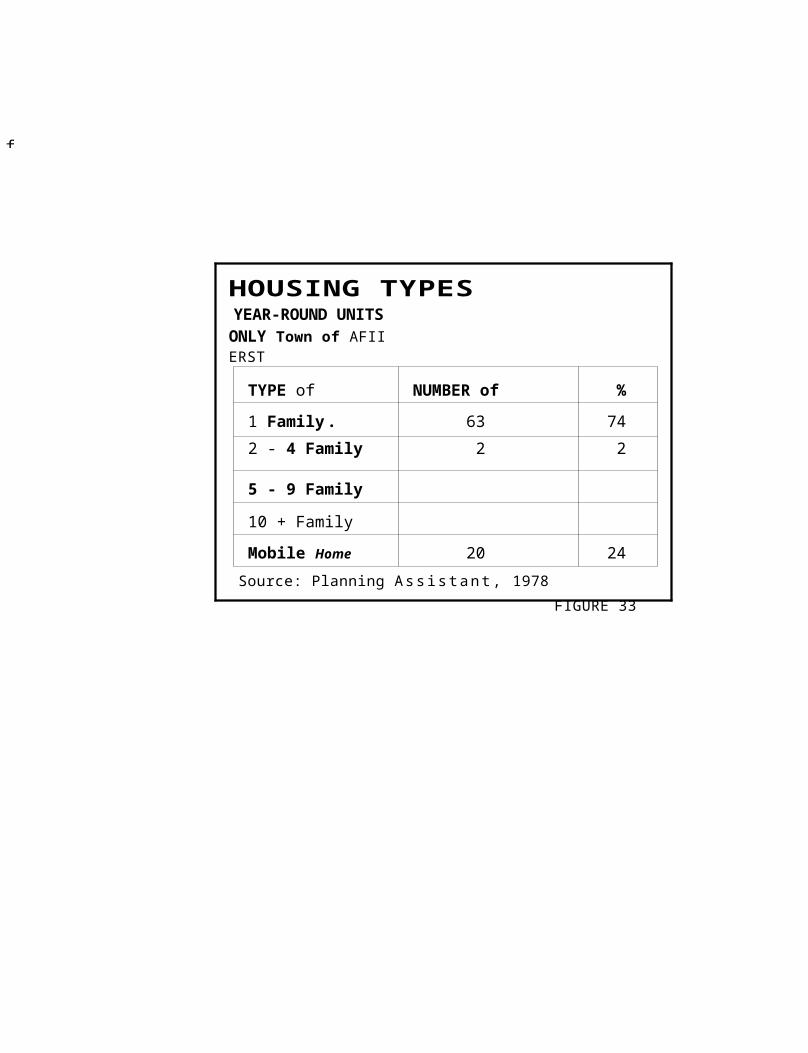
LAND OWNERSHIP PATTERNS
TOWN OF______Ar , mR.ST _________________________
TOTAL ACREAGE of the TOWN: 25,306.9__ Acres
TOTAL NUMBER of LANDOWNERS: 13 7% Resident Landowners: 51
S Non-resident Landowners: 49 %PUBLICLY OWNED LAND: 123.6 Acres
OTHER TAX-EXEMPT LAND: 8 Acres
Size of Lots LotsIofLotsw/Bldg
; ofLotsNon-res
Acreage%ofTotal TwnAcreage
One Acre or Less 68 60* 21 42.4 •1.1 - 10 Acres 56 31 16 269.1 1.110.1 - 50 Acres 54 24 24 1,501.3 5.950.1 - 100 Acres 43 11 23 3,055.7 12.2100.1 - 500 Acres 25 1 20 5,354.5 21.3Over 500 Acres 5
10 5 14,895.0 59.3
TOTALS 251 1 Z7 109 25,127.94' 1 100.0
FIGURE 41
*Th i r t y one of these 60 bu i ld ings are not in p r i v a te ownership but are on leased l o t s from the paper companies.
**Th is fi g u r e does not include 179 acres i n water. Source: Planning Ass i s tant , 1978
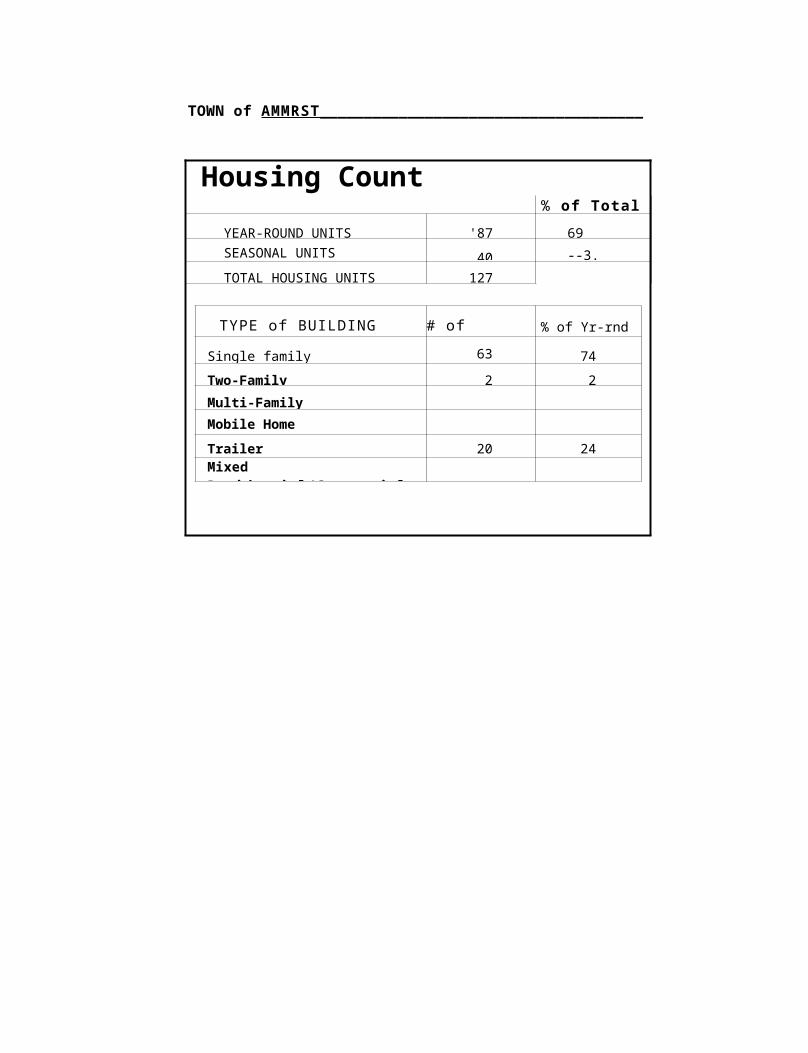
LAND USE & HOUSING SURVEY S T A T I S T I C A L S U M M A R Y SH E ET T own
of __MIH RST ________________________________
D at e___January 1978 __________Conducted by _Planning
® RURAL AREA ❑ URBAN AREA ❑ TOTAL AREA
R E S I D E N T I A L U SE S
TYPENUMBER
ofauILDINGS
NUMBERof
D ELLITG
DWEL LING UN ITS CONDITION
BldgsUnits
VACANT ABANDON-IN
OMMER-
CIAL BLDGA B C
SINGLE FAMILY 63 63 6 1 11 1TWO FAMILY 2 4 '
MULTI - FAMILY
MOBILE HOMES 20 20 2 2TOTAL YR-ROUND RES. 1S EA S ON AL B •
GROUP QUARTERS ' -
GRAND 125 127- 8 1 *
of Grand Totals: 6% 68%
N ©N • R ES ID EN TIA L U S ESDETAILED TABULATION ( for rural areas only) GENERALIZED TABULATION
STANDARDLAND USE CODE NO. USES NO.
UNITS
2510 Furniture and Fixtures 14544 Route 9 14561 Side Roads 55392 General Store 15811 Restaurant 1
. 6619 Other General Con-structian Contracts 1
7239 Town Hall . 1
7491 Debeck Pond Campground
1
839© Other PoresLLy Act iv i -t i e s Related Services 1
1
STANDARDLAND USE CODE NO.
NO.USES
1
0
2
2
4
2
1
BLIGHTCOLLAPSED SLOGS 1
JUNK CARS 3JUNK YARDS 0
Source: Planning Assistant, 1978121
Assistant
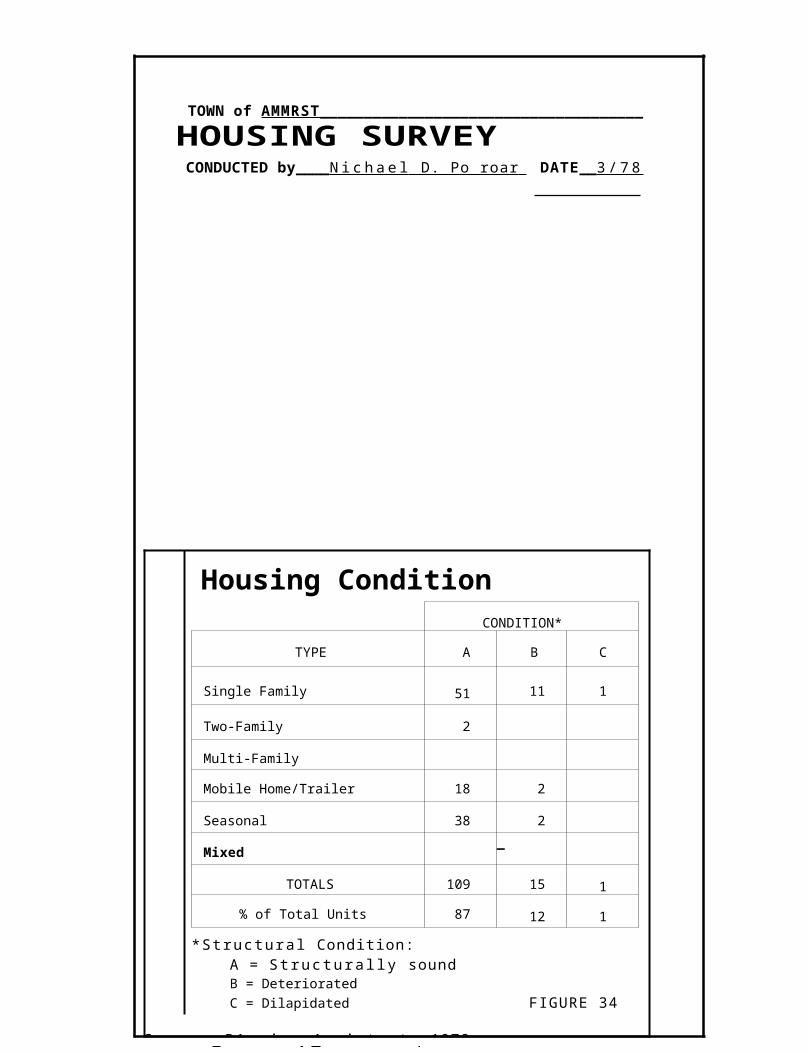
FIGURE 42
Source: Planning Assistant, 1978122
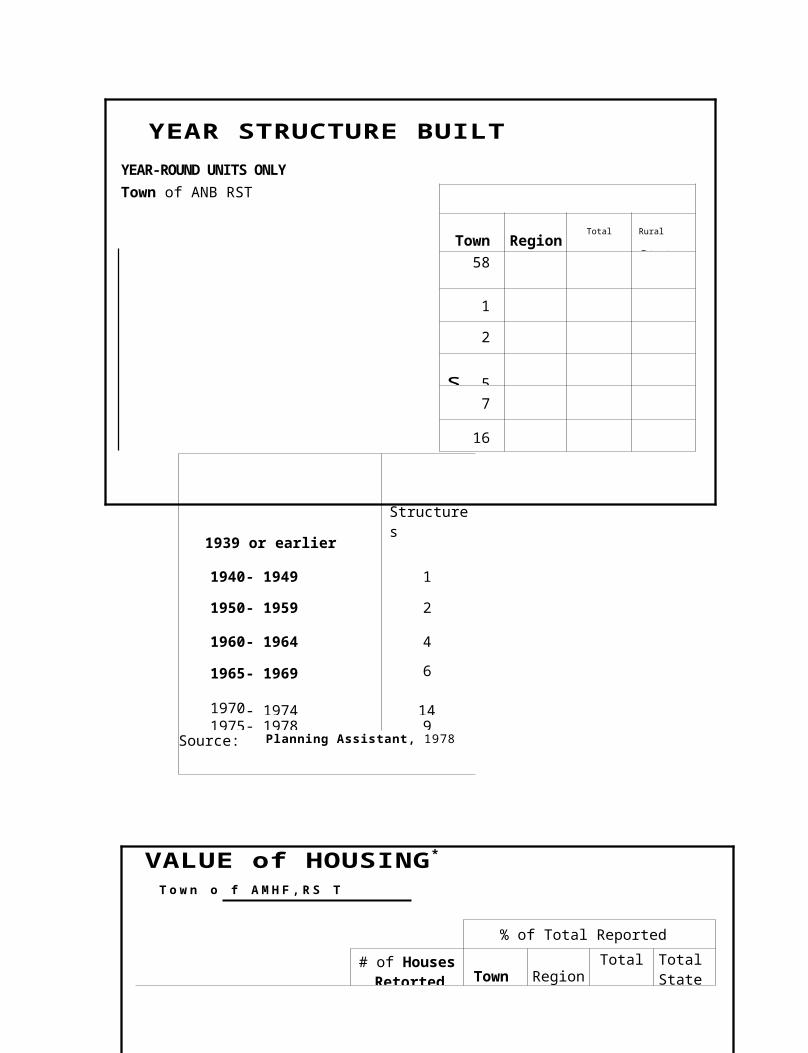
e•M■MM■MMMMMia .MM.aMMMa.M■ 1.■ i.. .■. ■R MR M ■ ■a■■aM■M■.■a■MME.M ■M■M■M RM.M RZWhJEMMMMMRMMMMMUMCM MMMR.■1a■MIIMMRM■1M.1M■■■■.a.M. MM■RMM1ai■1ai.rtM■■■aMM.■■aaMMM
M1i41UIP.1115M iF$R■UM■■RRaaaiMS5■..IERRM71MRMMMI3MM■MMMM.1MRiMM■M ARM.OMMMMMMM.AM OMMIA■MrM.IMMMMOM■ MMMa1■■1.■i1MMIMM,MMRMMMMWIIE?:RRM .YMMMOMaM■MMMI.riMIRM■MII-SiM■h KON1 icURMEMMR.IUM/ *M■1 1MZ1aa■aur.ail E1ii■a..■1■■i./.MMI'\■O i'i1►1■.■.MM AM■MMM■MIfMIMMWMM IRMNeOMM■1 ==!7 17 ■aMMM1■M■MiI.MMM■■►IRMMM■■1MMIM■■ I■■M■RM MM IM PMIOMMI■\UNM■■.■a■■■I MOMMMMM■M•ItaMaMiUMNua■MMMMMIM.■ ■\'Ma.aaai■i1aiMMMaiia.l■1.■MMMii ■MRMEMMMMMIMIMMM.■Y■M.1■MMMR■i ■■ URRM■■MMM#M1ai:Mm■MMMw.■1RMI.M MMM.M■■MMMMEMMM.rMi■M■.MM#M■MI ■■■■i■.R■Mi.■■■MN1.MMMMOMMM■.M .M■M17a■1M■MMMM■.11■MUM1auMM1uaI ■MM.rMM.MM■■■■■OMMMMM■M.MMMIZ.M LMM■■.■■M•M■M.■■uMMMr.■MMaMa1■MMMaM.Mi■■ia!MRMOR&MM■M■.M.MR M M M Ili*i■:u■1■iaal■Iuur■■MM* ;AMMla1:'4■ialIINWr.rlfili 1 16,■■■■MN■. GAIAMMI>IMAWMMYr............-#MMM..MMaAi1Ma■ir4r {Ii;l. i•IlRairai
IRMI.■■ ilM1Ma■iauia■
rMl■M■aM
Imam.11 MM............NMI..■■■
Mifw
*I M
4 * 5d IE ST. REGIS
RR.MM■
FOREST LAND OWNERSHIP
A M H E R S T 1978
I inch = I enil• HCRPC
DIAMOND INTER.
WEBBER TIMBER.
MAP 7
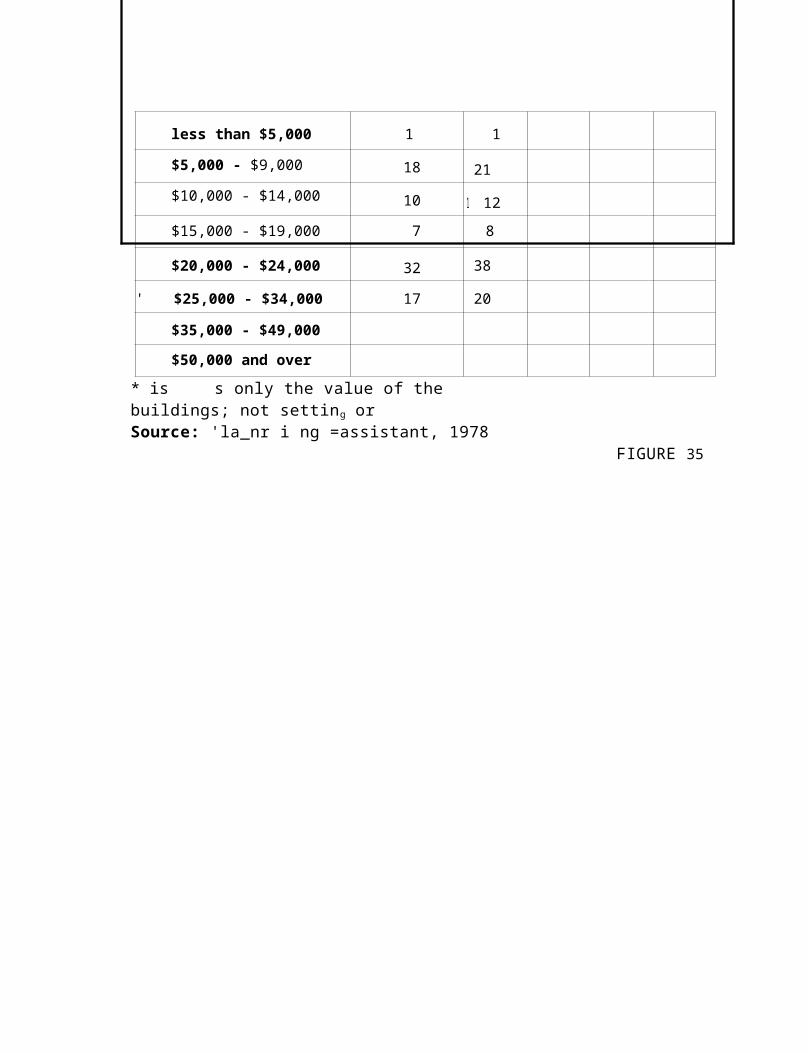
d. Historical Society. Interest has been expressed in preserving the historical structures in Amherst. The creation of such a body would organize such an effort.
2. The Amherst tax map should be brought up to date for the following reasons:a. Specification of town owned property.b. To show the location, size and ownership of all
land parcels in town.c. Increase the accuracy and equitability of
property taxation.d. Would give an up to date inventory of the town's
tax base.e. May increase tax revenue (i.e. could discover
parcels not being taxed).f. Can be used as a community planning base map for
land use, zoning, roads, highways and location of community facilities.
g. Used for population census and projection.h. The map can be used for special community projects.i. It indicates over a period of years what parts of townare growing fastest and what is being subdivided.
j. Public identification of ownership patterns.
3. Amherst should pursue a capital improvement plan in the following areas:a. Recreation facilities.b. Restoration of the town hail.c. Construction of a town hall parking lot,Funds for these improvements should be taken from the town surplus wherever possible.
4. The creation of a monthly newsletter is recommended to inform townspeople about planning board meetings, selectmen meetings, and other town events.
124
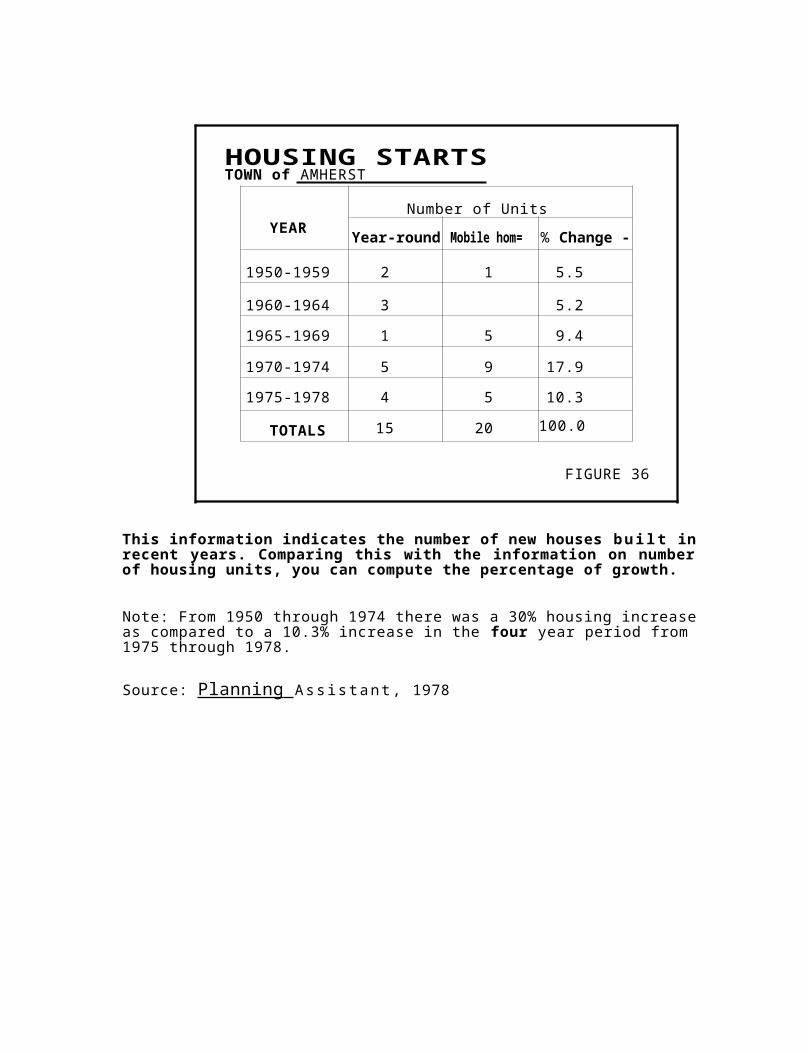
RECOMMENDATIONS (continued)Planning Board1. A site plan review ordinance should be developed to regu-
late land use and development in Amherst, This site plan would provide guidelines for commercial, residential and resource areas. The following guidelines for residential development would be incorporated in the ordinance:a. Minimum 2 acre lot size.b. Minimu m 200 foot road frontage.c. Minimum 100 foot setback from road.d. Minimum 50 foot from property line requirement
for new building.Generally, such an ordinance would insure the appropriate-
ness of new development to the rural, low density and light industrial character of Amherst.
2. Though it is unlikely that land will be subdivided to any great extent in the immediate future, a subdivision mora-torium is recommended. Such an ordinance would restrict any subdivision that is not already regulated by state guidelines, and would be in effect until the creation of a subdivision ordinance.
3. There is no intention to regulate the use of mobile homes in Amherst. However, it is recommended that action be taken to insure both the stability of the tax base and the population. Such action might include requiring concrete slabs f o r mobile homes.
4. The planning board should investigate low cost housing alternatives that would be in harmony with the rural land-scape of Amherst.
5. The Shoreland Zoning Ordinance should be revised for the following reasons:a. The Ordinance as stated is too restrictive in that all
of Amherst's shoreland was placed in the resource pro-tection district.
125
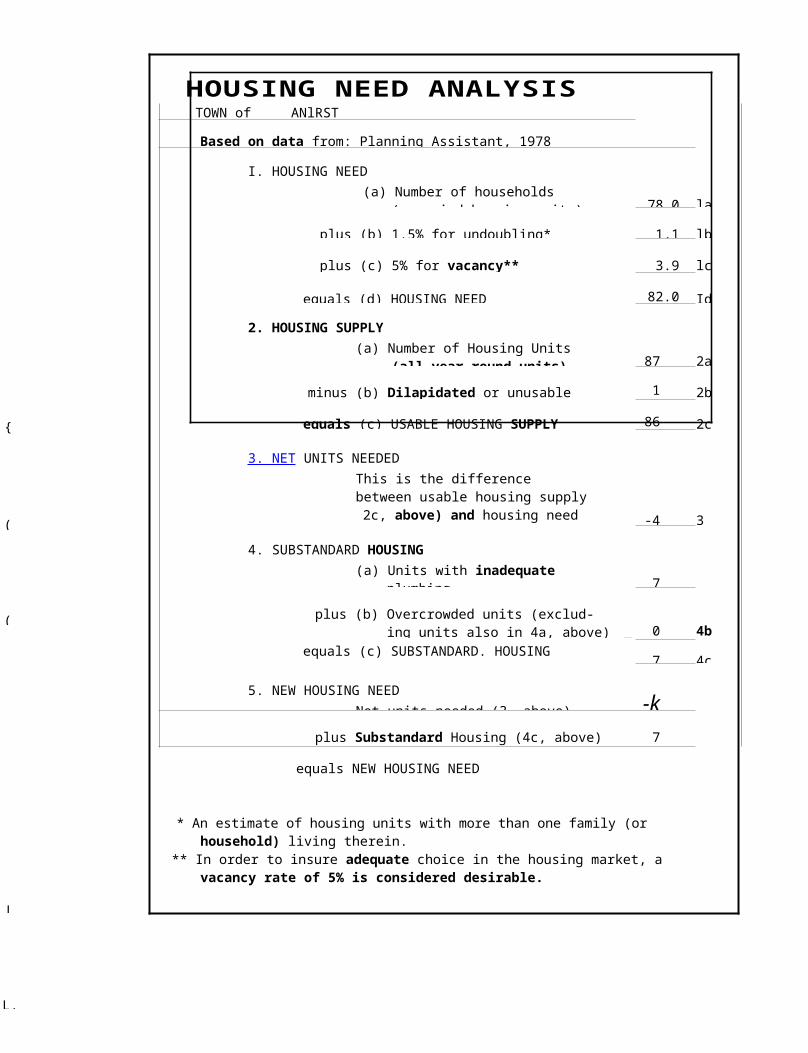
b. The applicability section was confused in the original document.
c. The document only applies to shoreland and cannot be construed as town wide zoning.
d, The following sections of the Shoreland Zoning Ordi-nance should be retained and apply as guidelines on a town wide basis. (Letters in parantheses refer to specific subsections of the Shoreland Zoning Ordinance.) Section II Land Use Standards1. (A) Agriculture2. (C)Campgrounds3. (D)Clearing4. (E)Erosion and Sedimentation Control5. (g)Mineral Exploration6. (I)Road Construction7. (J)Sanitary Standards8. (K)Signs9. (L)Soils10. (iii) Structures11. (N)Timber Harvesting12. (0) Water Quality
6. The feasibility of hydro-electric power being generated from the Union River should be explored. Federal money is available for such construction. As electricity becomes a more expensive commodity, local power generation may become a desirable alternative.
126

P H Y S I C A L E N V I R O N M E N T
VI
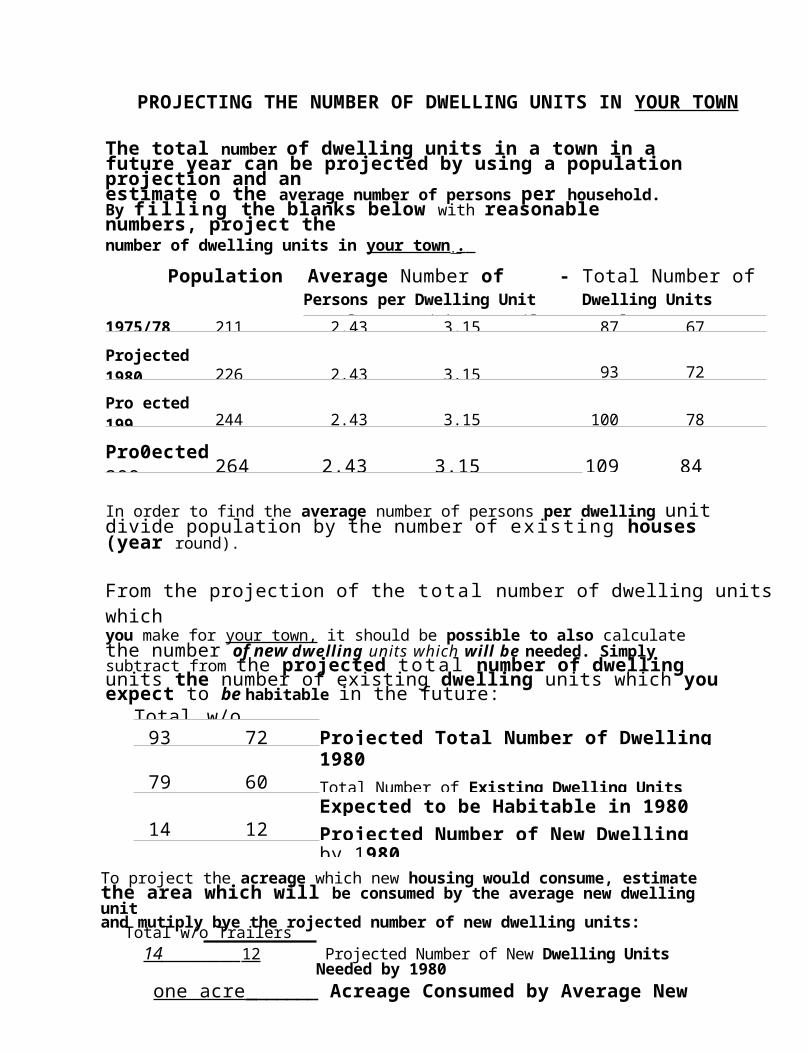
12
{
HANCOCK ANDPENOBSCOT COUNTIES
THE NUMBERS AND BARS I ND I CATE
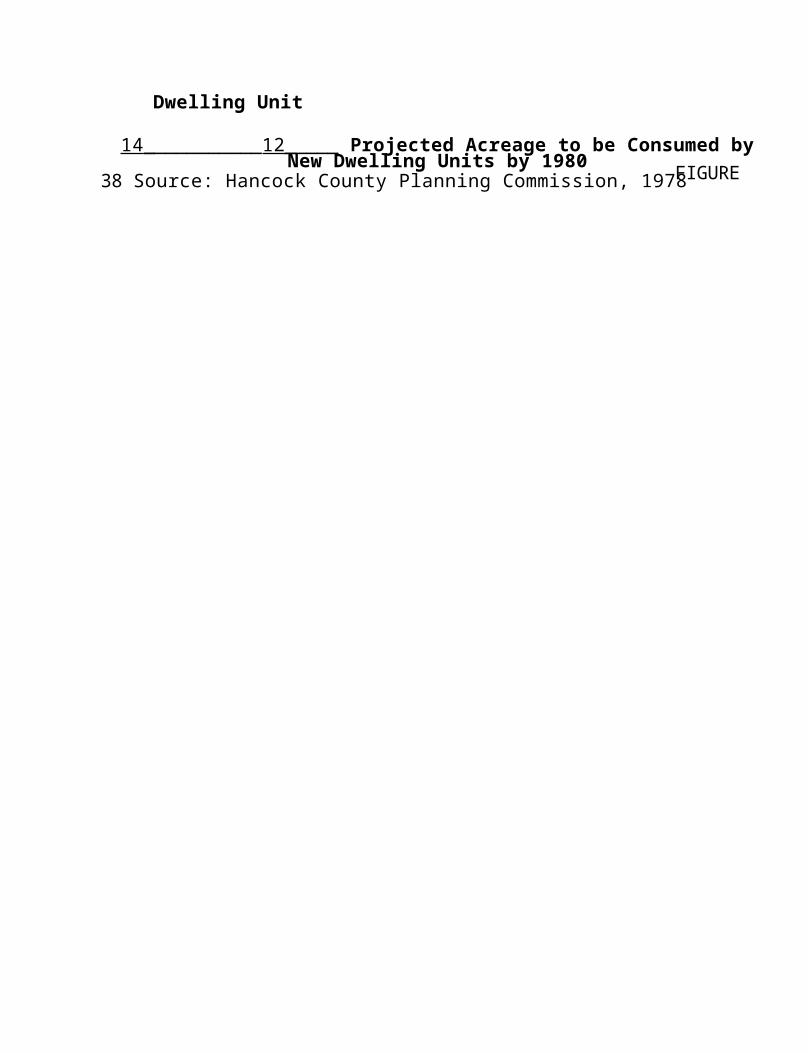
A. INTRODHCTI ON
Of the three elements that comprise a community; physical environ-ment, the human community and community infrastructure, the physical environment is both the most stable over time and the most fragile. While population and governments come and go, generally the physical surroundings remain constant. Yet the activities of even a single individual in a relatively short time can permanently impair a part of the environment and have a detrimental effect on the whole physical environment.
The study of the physical surroundings is done so as to provide a basis for intelligent manipulation of the environment while at the same time satisfying the human need for work and pleasure. Both the citizens and town officials should become aware of the physical resources in Amherst in an effort to identify environmental values as they relate to the comity's needs and wants.
B. EXISTING
SITUATION I.
ClimateHancock County's weather is characterized by five major climatic distinctions;
Sudden changes in the weather.
Large range of temperature variations.
Evenly dispersed precipitation.Concurrent climatic diversity within the County.
Great differences between the same seasons in different years.
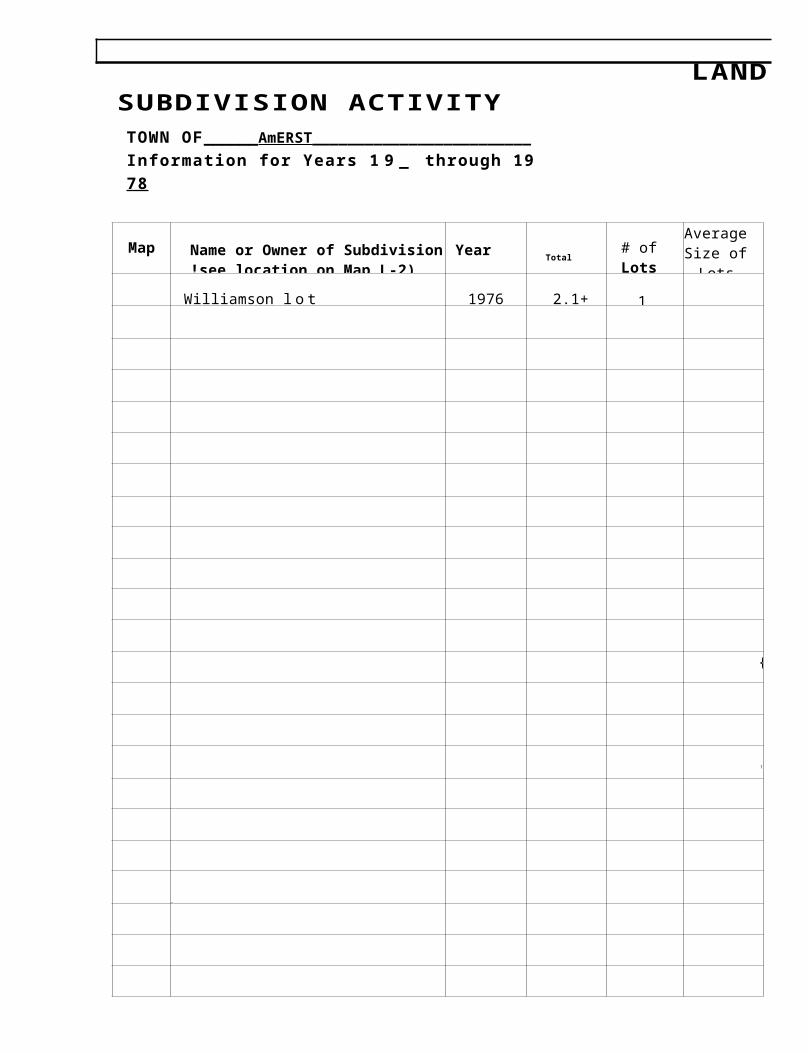
■El .MMMMIIIII

* u1 1 1111
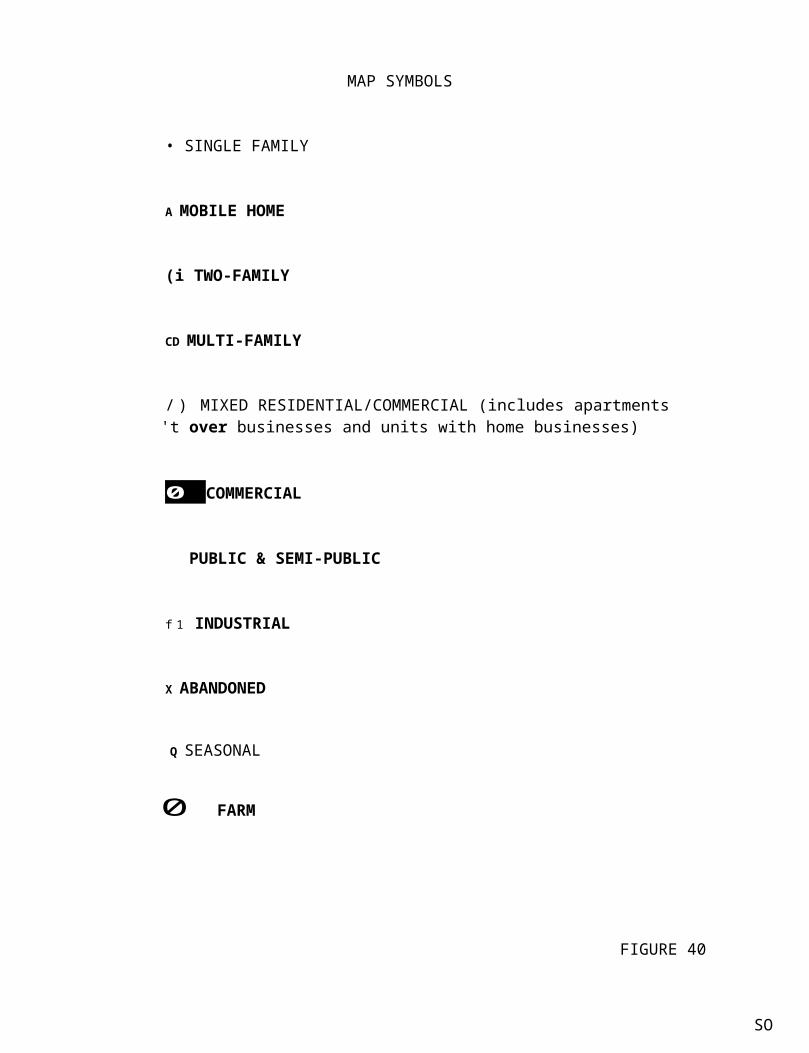
TEMPERATURE & PRECIPITATION
Jan
Feb(Averages
) March
April May June July Aug
Hancock County(Ellsworth 20.5 20.5 52.0 61.6 •• - 65.3
Stat ion) 3.59 : • 3.36 3.60 2.43 , 2.65
State o : 13.9 16.1 , • • 151.8 61.4 67.1 64.4Maine 2,73 2.92 •: 1.88 3.83 3.72
(cor.tinui j Sep t • 1 - rHancock County(EllsworthStation)
58.23.54
•
State of 56.1 190Maine 3.39 40.23
132
FIGURE .44
I. Climate (continued)
In Maine, regional climatic influences are modified by: varying distances from the ocean, elevation, and type of terrain. Han-cock County's weather is divided into two zones. The coastal division is a strip approximately 25 miles in depth, which is greatly affected by the ocean. The Northern portion of the County in which Amherst lies is less affected by the ocean and more influenced by a somewhat higher elevation and heavier land cover. The yearly temperature averages in the County fluxuate between a low of minus ten degrees to a high of 90 degrees. This fluxuation is due in part to the many differences in topography, land cover and distance from the ocean between the northern and southern portions of the county. The growing season in Amherst for vegetables subject to injury from freezing temperatures is approximately 125 days.
Precipitation in the Amherst area i s evenly distributed through-out the year. The total yearly precipitation is slightly higher along the coast due to "northeasters" in the winter and more frequent thunderstorms in the summer. The average precipitation for the coastal and inland areas are 44 inches and 40 inches respectively.
Snowfall amounts in the Amherst area average approximately 75 inches per winter. NormPl1y, each winter Amherst can expect approximately 30 days with one inch or more of snowfall. Each winter, several storms occur with over five inches of snow.
134

2. Bedrock Geology Bedrock, the underpinning of the earth's surface, is the result of internal activity approximately 550 million years ago. Sedi-ment and volcanic debris were changed to rock by pressure, heat and agents that bound the particles together.rentually as the earth's crust began to fold and uplift the bedrock, molten rock from deep within the earth pushed its way into the older bedrock, cooled, and formed massive igneous intrusions.
M e primary bedrock formation of Hancock County consists of varying types of granite, differing only in color, formation and consistency. This formation is a result of glacial activity during the last Ice Age. The largest continuous mass of bedrock called biotite muscovite, is common in the western section of the County and extends north through the whole County. This mass of granite constitues the bedrock of Amherst and the imme-diate area.
Depth to bedrock varies from exposed areas to several feet. Granite boulders, left by the glacier, abound on the land sur-face and in the loose covering of the bedrock throughout the county. One of the finest displays of granite boulders may be seen on the old Bar Harbor division of the Maine Central Rail-road, from Phillips Lake in Dedham to Ellsworth Falls. This is part of a great boulder train traceable to Clifton and Edding-ton in the North. This same display of granite boulders is evident in Amherst.
According to the U. S. Geological Survey, there are hundreds of dormant faults within the county. The most spectabular major fault identified by them is on the east balk of the Bagaduce River in Brooksville.
3. Su r ficial Geolo g y ,,
When the ice sheets of the last Ice Age advanced through this region, they left surficial deposits which covered the bedrock. These surficial deposits are important because they are the parent material of soils.
o5
f
{

BEDROCK OF AMHERST
Dg - Biotite and biotite muscovite granite and quartz monzonite.
Su - Metamorphosed gray and green siltstone, sandstone, shale, graywacke conglomerate and sedimentary iron manganese.
FIGURE 45
From U. S. Geological Survey Map 1960 Scale 1 : 500,000
136
Dg
S S T
Su
Five distinct surficial deposits exist in Hancock County. Till, the predominant surficial material found in this region, is composed of boulders, sand, silt, and clay. This amalgamation is the bedrock cover in most of the county. It is an ideal location for agriculture when combined with the proper soil mixture. This is the predominant deposit in Amherst.
The second type of deposit is marine sediment composed of sand, silt and clay. ilarine sediment that is superimposed on the bed-rock and glacial till can be found throughout the County in areas not exceeding 300 feet above sea level. Characteristically these areas are poorly drained. The only areas in Amherst containing marine sediment would be in low lying areas along the Union River.
The surficial deposits in swamps, bogs, and salt marshes con-stitute a mixture of decayed organic matter muck, silts, and sands. Such areas, unsuitable for agriculture, forestry or other human use, serve as ideal breeding sites and refuges for wildlife. The swampy areas along Chick Brook and in the Southeast corner of town are a prime example of this type deposit.
Alluvial deposits consisting of .avel, sand and silt often accompari ed by a thin layer of organic matter are found in flood-plain areas. This substance is the consequence of periodic flooding and is ideal for agricultural use, as it's. fertile and holds moisture well. Alluvial deposits are found in Amherst in low lying areas along the Union River and some of the streams in the t own s
Glacial streams, resulting from melting ice, left residues known as ice contact deposits which are most noted for their water storage potential. These deposits incorporate distinct land-forms which include eskers, kames, and deltas. The t'whalesback" on Route o in Aurora, is an outstanding example of an esker and is part of the sane formation as the "horseback" found in Township 32. Amherst has some of all five different types of

surficial deposits.
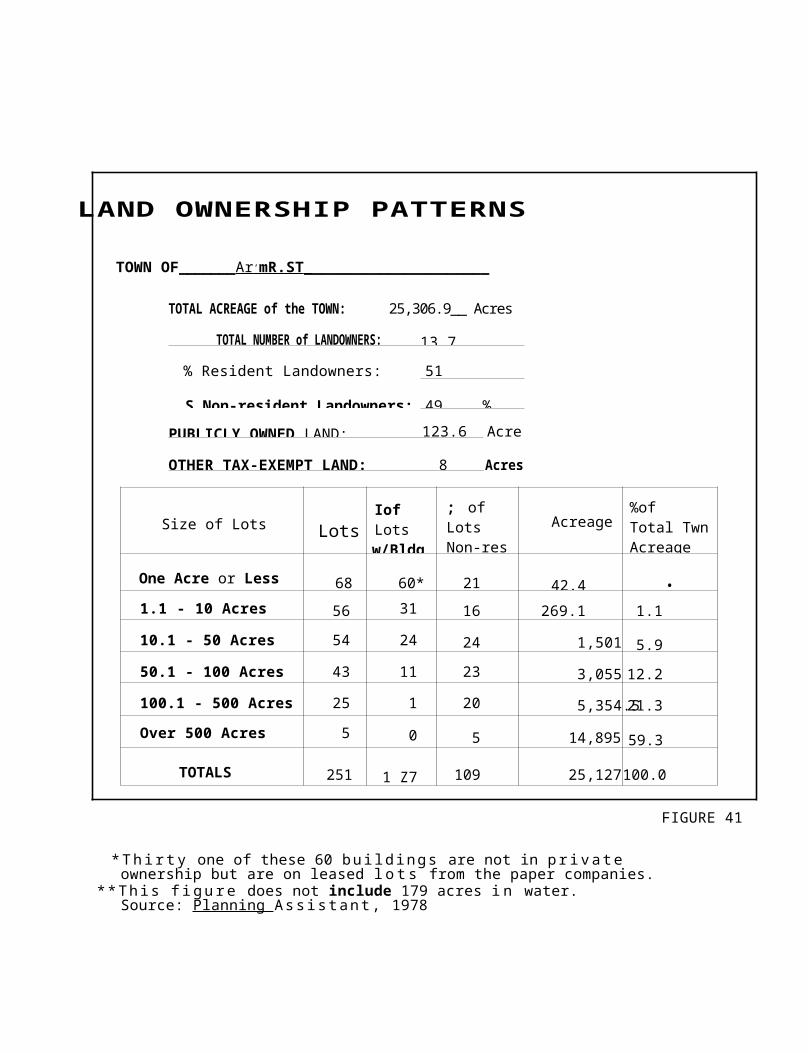
4. Kineral Resources At the present time, sand, gravel and crushed stone are the only mineral resources that are actively mined in Hancock County. Also, within the County there are substantial deposits of peat (spaghnum moss). In the summer of 1977, the College of the Atlantic surveyed six or seven boas within the County and it was estimated that these bogs could yield three to five million air dried tons of peat. Amherst has two active sand and gravel pits,
In the latter part of the 19th century many small silver mines
existed throughout the County, including one in Amherst. The"mine" in Amherst was located on the east bank of the Union River near the Anhers t-i•iariaville town line.
5. SoilsAlthough Amherst has not as yet been soil mapped, the Soil Conservation Service has suggested the following as the probable soil make up in Amherst. Low lying areas generally below 300 ft. in elevation may contain the fine textured Buxton and Scantic soils. These developed from fine textured marine sediments. Soils that developed in glacial till would be on the upland bills and ridges. These would probably be the deep moderately well drained Peru soils and the excessively drained, shallow to bed-rock- Lyman soils. This is the predominate soil in this area of the County and in general, this type of soil is very good for agriculture. Sands and clay are on the stream terraces along the Union River. The sand being from the glacial till and the clay is formed from marine sediment.
£. Tppo,trayhvThe topography of H acock County is a pleasantly varied range of elevation with mountainous areas in the north and generally low hilly relief along the coastal plain With the exception of 'the Cadillac i-iountain range. The coastline is highly irregular with numerous bays, inlets, esturaries and contains the only fjord on the United States portion of the Atlantic ocean.
r'
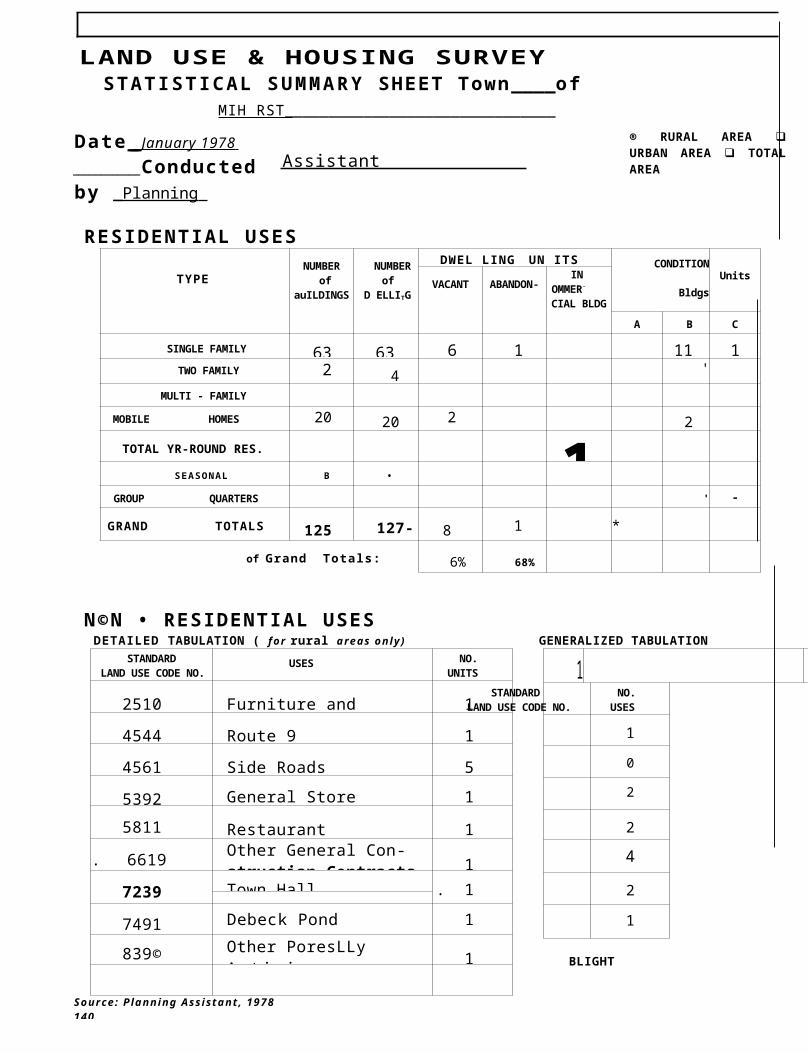
A GENERAL SOIL DDSCRIPTION OP T1 L EIGHT SOIL TYPES
FOUND IU = C O COUNTY
Hermon - Lyman - Peru association
Deep and shallow; somewhat excessively drained, well-drained, and moderately well-drained loamy soils on gently sloping to steep granitic hi l ls in the Turk lake area and in the northeastern corner of the county.
Colton - Duane association
Deep, well, and moderately well drained gravelly and sandy soils developed in coarse glacial outwash material. This association is scattered throughout the county with the major area extending in a north-south band approximately one to five riles wide from T3ID to T14SD.
Peru - Buxton - Lyman association
Deep and shallow, somewhat excessively drained and moderately well drained soils found mostly in the Ellsworth - Trenton area and on the larger offshore islands. The Peru and Lyman soils developed in glacial till and the Buxton soils developed in fine textured marine sediments.
Lyman - Buxton - Herman association
Gently sloping to steep; somewhat excessively drained, well-drained and moderately well-drained soils along the coast and offshore islands. (The Buxton soils are shallow to bedrock.)
l iarlow - Peru - Lyman association
Deep, well, and moderately well-drained soils developed in very firm glacial till. This association is on the hills and ridges in the interior of the county and is the largest association.
Rockland - Lyman associationShallow to bedrock areas that contain many areas of exposed bedrock. This association is on offshore islands and coas-tal peninsulas.
Buxton - Lyman - Peru
Somewhat excessively drained, moderately well-drained,
(
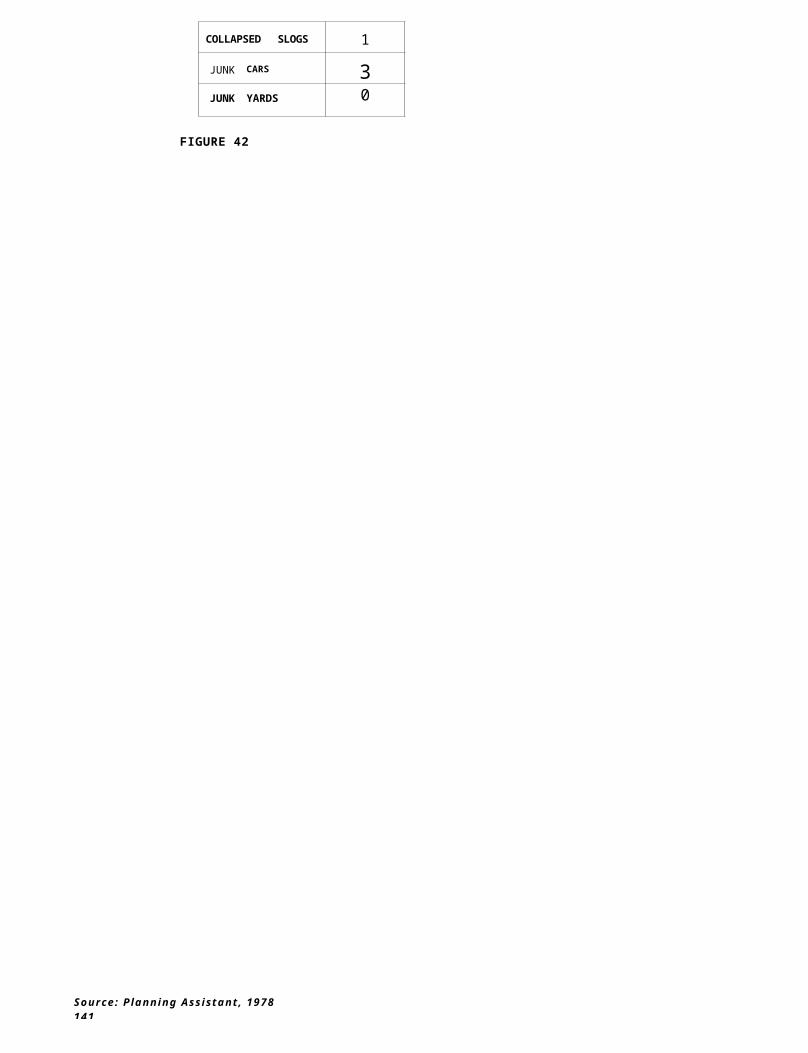
sha l low, and deep soils that formed in glacial t i l l and marine sediments in the Penobscot River valley and the Union River valley.
FIGURE 46
141
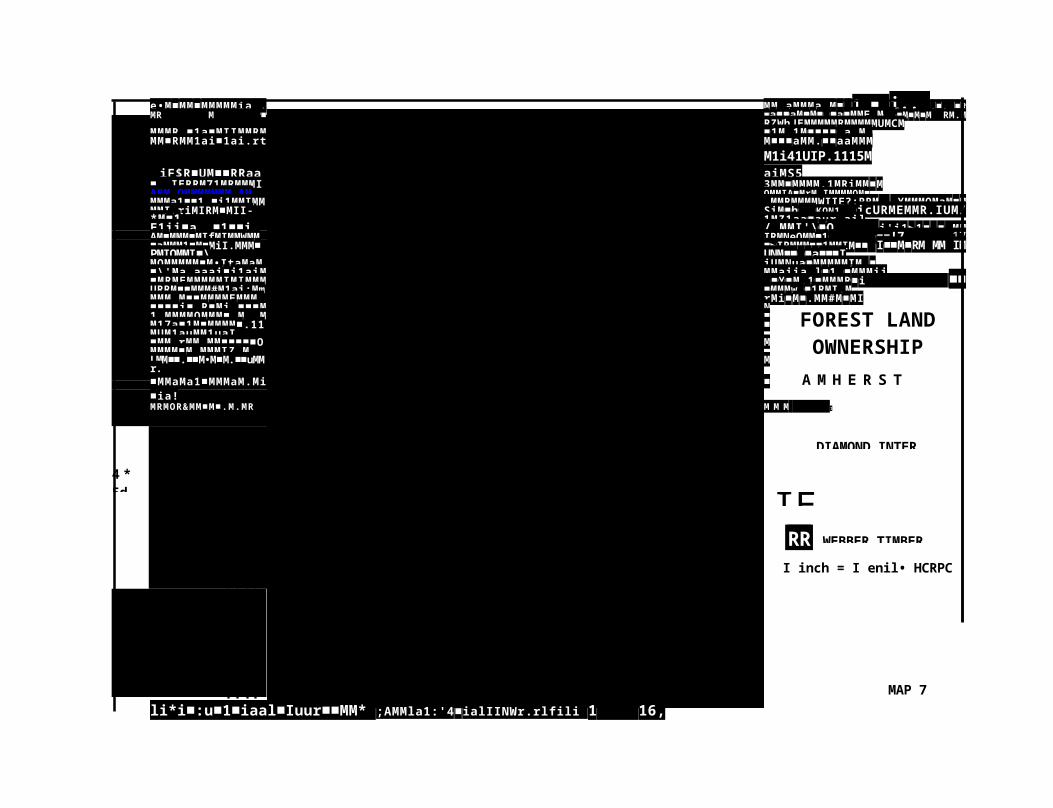
In terms of slope, !Amherst has a number of small mountains, somein excess of 1000 ft. (Bald Bluff Mt.) in-elevation. The attractive hills stretching from the northeast to the southwest corner of Amherst are known as the Sprl Brook Mountains and they form part of the western side of the Union River Valley as that river winds through Amherst. The Springy Brook fountains are part of the devide between the Union River and Penobscot River watersheds. Prom the open ledges on Jellison Hill, (940 ft.), one may look to the north and see N t. Katahadin, and then from the south face observe the Cadillac fountains, Porcupine Islands and the Blue-nose Perry coming into port, Of course, one would want a clear day and a set of binoculars to do this effectively.
The rest of the county is characterized by undulating topography with most slopes not exceeding a 15;5 to 25,5 slope range. This is primarily due to the weathering of less resistant materials such as alluvial and sedimentary deposits.Ground WaterThere are four sources of ground water in the County; these include surficial deposits, surface water, precipitation, and bedrock.
The largest supply of ground water in Hancock County comes from unconsolidated glacial till deposits and ice contact deposits such as eskers and lanes. The average precipitation in Hancock County amounts to 43.85 inches as compared with the State average of 40.23 inches. Approximately half. of this precipita-tion seeps into the ground for subsequent recharge. Surface waters, including wetlands close to groundwater aquifers, also contribute to the supply of ground water, Bedrock formations in the County are dense, and are therefore, not thought of as significant contributors as far as bedrock wells are concerned.
The quality of ground water in Amherst is generally good. The water is palateable as well as potable and at the present time there also appears to be an ample supply for household use.
I C I
7.
8. Surface MatersSurface waters include rivers, streams, lakes and ponds. There are 179 acres of surface water in Amherst, comprised of 16 ponds, numerous brooks and the west branch of the Union River. Hancock County has two major rivers which drain the northern part of the region: the Penobscot on the west, and the Union River in the east. The surface waters in Amherst are. drained by both systems with the majority of the surface water draining into the ;Jest Branch of the Union River.
Hancock County's inland waters include 179 "great ponds" cover-ing 61,184 acres. The overall quality of Hancock County's waters is good. This is a t t r i b u t e d t o the absence of large industry and the abatement of previously untreated or poorly treated municipal and industrial discharges. However, "non-point source pollution" (i.e. pesticides, herbicides sprayed aerially) a type that cannot be easily traced, can create pro-blems in the quality of surface waters. Also, Amherst should be concerned with torpidity in its surface waters brought on by woods operations. This could be aggravated in many areas (i.e. the Springy Brook Mountains) due to the slope of the land. Currently this type of pollution is under the scrutiny of Department of Environmental Protection and the Environmental Protection Agency. Nest surface waters in the County are rated B-1 by the Department of Environmental Protection (Class B-1 is acceptable for drinking purposes after treatment).
9. Ilatersheds. Drain re A r eas The term watershed in this report is defined a s " t h a t a r e a o n the ground from which all precipitation (rain, snow, etc.) flows into a single given body of water. To simplify, it is the entire region drained by a waterway or which drains into a lake or the ocean.
Amherst is drained by both the Penobscot River and the west branch of the Union River. Trout, Grassy and Great Works Pond are the headwaters for Great Works Stream which flows west to join the Penobscot at Bradley. The remaining water courses drain into the Union River and on to the sea at Ellsworth.
143
r`
The entire issue of water quality, which has recently (say in the last 10 years) been brought to the public's attention, has undergone considerable research throughout the United States and Hancock County is no'exception. Funding has been made available and a comprehensive study, dealing in part on watersheds and their functions, is forth coming.
Hancock County has excellent ground cover-and therefore, a mini-mum amount of erosion and runoff occurs as in other areas in Paine.
In summary, although there is limited data available, it appears watersheds are in a stable condition. The majority of the land area (445) is owned by paper companies which means the major disturbances to the ecosystem will be in terms of erosion, sedi-mentation and eutrophication, due to the current woods operations. The remaining area is stable (i.e. good ground cover and land use practices) with a minimum of depravation.
10. WetlandsThe term 'wetland" is defined as 'Fan area characterized by low topography, poor drainage, and standing water which occurs at least part of the yeas''. It may also be viewed as the transition zone between dry land and open water. Other terms associated with wetland areas are: swamps, bogs, marshes, and salt meadows.Uetlands within Hancock County may be further defined and divided into inland wetlands and coastal wetlands. Inland wet-lands are areas within _the normal highwater mark of non-tidal flowing water, stream channels occupied by non-tidal waters, or other areas identified on the basis of soils, and vegetation. Coastal wetlands include any swamp, marsh, bog,beach, flat or other land above extreme low water mark subject to tidal action.
The majority of wetlands are located in the northern two-thirds o f the County. Amherst has approximately 2,528 acres (3.95 square miles) of wetland scattered throughout the town. Iiuch of this wetland is isolated from the populated areas of the com-munity and therefore, the danger of depravation of these wetlands is reduced. However, timber harvesting operators must
145
{
be careful so as not to damage these delicate ecosystems. Wet-lands play a critical role in the natural cycle of life. They provide essential breeding, nesting and feeding areas for a wide variety of fish, waterfowl and other wildlife. Wetland areasare among the most productive parts of our environment. They pro-vide a IrP"gin of protection for the entire ecosystem by i in5 m i zing the impact of fluctuation within any single species. Me wetlands act as buffers in absorbing Deck flow during storms and the "winter melt" and then releasing this water during dry periods.
Coastal wetlands also play an important role in Hancock County's economy. The value of shellfish and worms harvested from these areas is often many times higher than the yield from prime agricultural land. However, in recent years, the value of this resource has d i rt7 dish ed considerably due to the closing of flats that have been polluted by men's activities.
11. F1aad 2;lahsA floodplein is the land area adjoining a stream, r iver , lake, ocean, or other body of water which may reasonably be expected to be covered at some time by floodwater. Although this sounds quite straight forward, it is sometimes difficult to determine the limits of a floodplain. Some land may be flooded each spring, while other areas are subjected to flooding only under extraordinary severe and rare conditions.
Flooding in Hancock County is a relatively rare occurance due to the numerous wetlands and excellent ground cover. Reliable figures indicate 92.3% of the land area in the County is forested with the remaining 7.7% consumed by h7omn related uses (i. e., urban builtup, gravel pits, agriculture, etc.).
The place where flooring is most prominent are the coastal areas. Since coastal stows are often accompanied by extreme tides, the combined impact of waves and tides can result in the flooding of areas far above the normal high water mark. Iiany of these areas, as indicated by the special flood hazard maps completed under the auspices of the Federal Flood Insurance Administration, are small islands which are susceptable to even minor fluxuations In water levels.
1D5
{

12. VegetationHancock County ranks eighth in land area among Maine's sixteen counties with 983,700 land acres of which 908,900 are forested. Therefore, the predominant land cover of Hancock County is tree growth accompanied with understory (weeds, bushes, grasses) vegetation. such of this understory (especially that which produces fruit, berries or nuts) provides feed and cover for a number of species of wildlife. There are approximately 10,000 acres of blueberry barrens and the remaining land is.composed.
of man-induced vegetational systems such as old fields, agri-
cultural systems, pine plantations, etc.The following forest types are the typical mixtures of trees ("Stands") found in Hancock County. Amherst has stands of each type except of course the coastal Spruce type.
Coastal SpruceConcentrations consist almost entirely of red spruce, with a minority component of white spruce. Balsam fir is found to be a component of this type, but not in sufficient quantity to determine the spruce-fir type. Scattered mature white pine and hemlock are also found in this type, with occasional small numbers of individual gravy birch trees, and a light scattering of northern white cedar.
Spruce-FirAreas in which spruce or balsam fir, make up a plurality of the stocking are designated as this type. Common associates might include northern white cedar, tamarack, red maple, gray birch, white birch, and a small number of eastern hemlock.
Upland HardwoodsSugar maple, American beech, and white and gray birch make up the majority of this composition. Forests of this type will consist also of red maple, yellow birch, elm, basswood, white pine, striped maple and some white spruce.
147
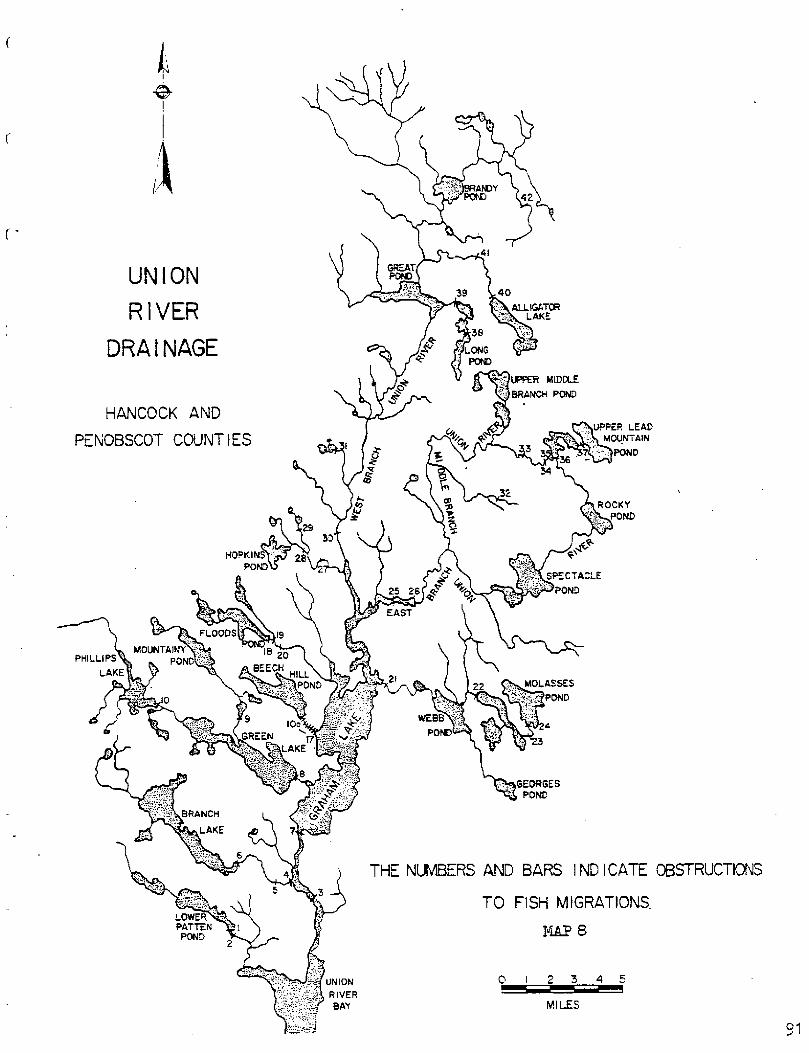
VEGETATION COVER
I I : Residential (10 acre minimum)17: Other Urban or Built-up Land32: Shrub- ushland Rangeland41: Deciduous Forest Land42: Evergreen Forest Land43: Mixed Forest land 52: 12 Lakes (10 acre minim um ) 62: Non-forested Wetland 75: Gravel P its , Strip Nines & Quarries (2)
MAP 10
148
Wetland HardwoodsAmerican elm are in the majority along with scattered fir, brown ash, hornbean and eastema larch. Unfortunately, Dutch Elm disease has practically eliminated most of the lovely stands of elm in the floodplains along the Union River in Amherst.
Mimed Wood -- UplandWhite and red pine associated with northern red oak, whitespruce, balsam fir, American beech, eastern hemlock, sugar maple, brown ash, hornbeam, and a small component of white ash, bigtooth aspen and white and gray birch mike up this composition.
Softwood •- UplandThis stocking would include white pine, white and red spruce, and eastern hemlock, with small numbers of balsam fir, a few upland northern white cedar and a scattering of gray birch, aspen and maples.
Softwood - WetlandWet swampy areas where trees grow on hummocks and consist of
northern white cedar, eastern larch, balsam fir , with smP1lamounts of scrub hardwoods allow for easy identification of this stocking.
13. Fish and-WildlifeA large number of diverse wildlife species are supported by the many habitats found within the Hancock County area. Some species are common to the area or to the State, some use the available habitat during their enrual migration, and several rare and/or endangered species are supported by unique habitat Lyres found here. The many species which inhabit this area may be classified as big game, small game-furbearers, migrating game birds, non-game b i r d s and mammals , and rare and/or endangered wildlife.The variety of habitats needed to support the wildlife population is furnished by different forest types, wetlands, mountain areas, coastal islands, and inland islands.Deer. White tailed deer are common in Amherst, but as much of the old farmland reverts to forest the deer population is not what it once was. This seems to be supported by the deer ki l l
149
(
_ . r r
. D e e r w i n t e r y a r d s i n . A m h e r s t . . 9 7 . 7 7 8 I
- airnur r 'orrop
" : *** i t - : '+Lr-
I4ffI,/prNr.,, r + t e r ' . , . : . t l ' ' rrnt r f - 1 y.' " '
Dnttrr- r r 1 ^ y SiISM : r s e . z
registration figures. In 1977, only 29 deer were registered in Amherst compared to 145 animals tagged in 1940 (the largest deer k i l l since 1939).
gAx. Amherst has a fairly stable, healthy black bear population, The bear population is believed to be somewhat self regulating but in recent years they seem more frequently around the populated areas of town as their deep woods food supply (beech nuts, acorns especially) hasn't materialized and they have had to revert to feed closer to man.J-ioose. There is a viable moose population in the town and it is expected to remain at about its present level.j • T a . P r f o w . There is a small amount of waterfowl that nest inAmherst each year but most waterfowl follow the Penobscot watershed north or stay on the coast. This is in part due to the general -decltue in waterfowl. populationw• At. onetime, -due to large populations waterfowl utilized much more habitat due to necessity brought on by crowding. Today there is no such population pressure so inland Hancock County is not considered to be very active waterfowl habitat. Ducks that may nest or pass through Amherst include black ducks, wood ducksip green winged teal and blue winged teal.;,,fi t 2.r.Le . Among this group, the beaver is the most important. In addition to the economic returns to trappers, beaver create excellent waterfowl breeding habitat and often their ponds provide good brook trout fishing (although this is of short duration, as the water in the pond warms up and siltation occurs the trout move out).The wetlands in the area also provide habitat for muskrat, mink and otter (although trapping in recent years has reduced the otter population). All of these certainly add to the natural surroundings as well as the fur resources of the town.
151
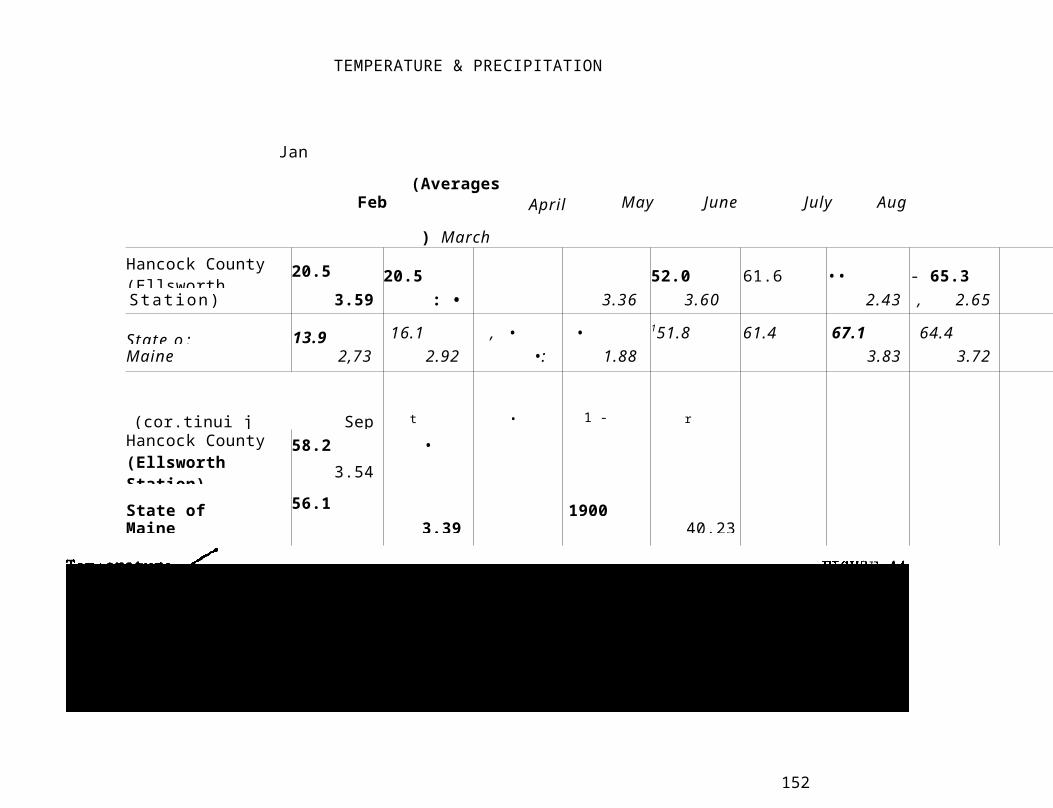
UNIQUE SCENIC OR NATURAL AREAS
The following are areas in the town which are not formally dedicated as parks, preserves, etc., although such areas are considered by many to be uniquely scenic or particularly enjoyable natural areas (such as waterfalls, scenic drives, etc.):M AP DESCRIPTION
ACREAGE(ESTIMATED)
Union RiverSpringy Brook MountainsJel l isonBald-Bluff Mountain,Fletcher BluffHalfmi l e Pond Bluff
Bald MountainDunker HillSaddleback MountainPeaked Mountain - Chick H i l l
HISTORIC SITES / BUILDINGSThe following are sites or buildings that are of historic
significance to the town (such as churches, town meeting house, old houses, old mill sites, etc.):
Amherst Town Hall
Goodwill Grange RA11
Amherst-Aurora United Church of Christ ""Original Amherst Set t lers Cemetery
Roden Smith House152

Tannery and dam s i t ePershing School - McV1r'ley SchoolAmherst Cemetery
'IGURE 4-7 Source: Attitudinal Survey, 1978
153
NATURAL AND SCENIC AREAS
MAI' 12
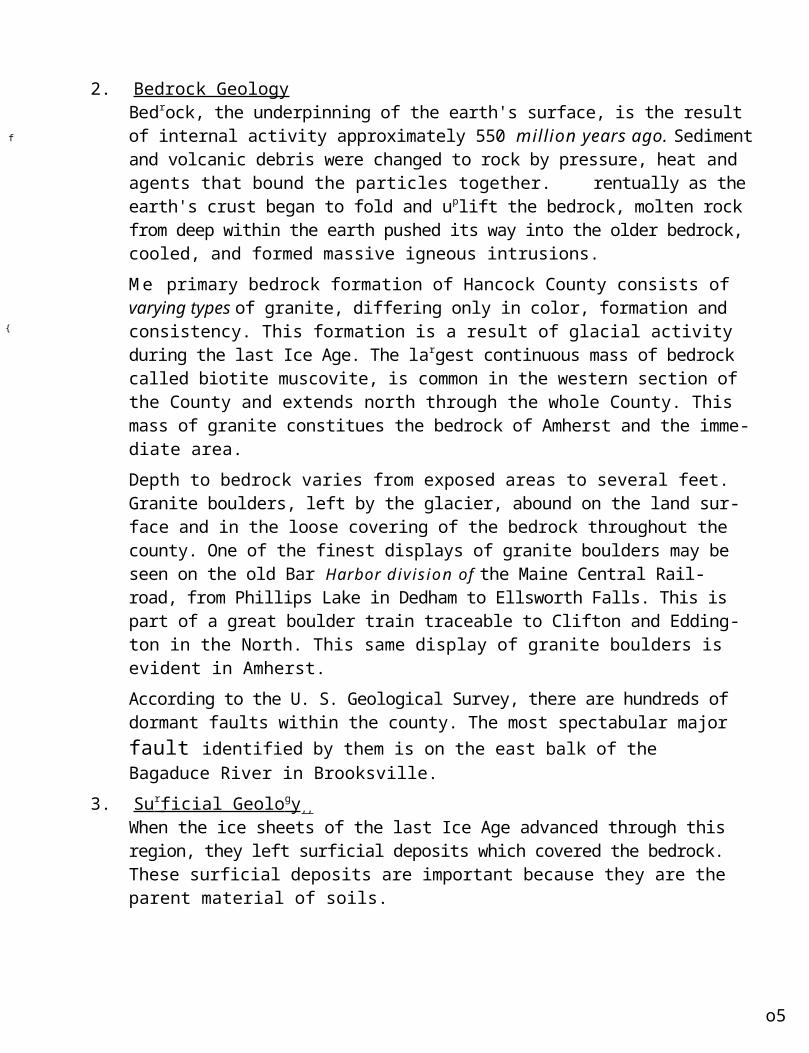
,Other Wildlife. Included in this category are such important species as ruffed grouse (partridge) snowshoe hare, woodcock, pheasants, squirrel, fisher, fox, raccoon , bobca t and l y n x .
Fresh Water Fish. The ponds and streams of Amherst support the following fish species: bass, brook trout, brown trout, white perch, yellow perch, pickerel, bnf_1head (hornpout), lake trout (togue), smelt, white sucker, eel, rinnows,. pumpkinseed sunfish, and banded killifish. The brook trout and brown trout probably are the most commonly sough fish in the town as the small ponds and the Union River are ideal habitat for trout and offer good fishing.
14. Habitats
Habitat areas, similar to wetlands, are only now being recognized as an important asset to a municipality. In fact, these areas are one in the same since wetlands are habitat offering food and protection to many different species of wi ld l i fe .Fortunately, Amherst provides excellent habitat for the mr-rly varied species of wildlife mentioned. The town has small ponds, a major river, all types of forest stands, wetlands and sheer rock bluffs. Each physical feature provides habitat for one or more species.
C. RECOMMENDATIONS
The viewpoint expressed concerning the physical environment of Amherst, is that it is of fundamental importance to the way of life of the townspeople; that it is of inestimable value, in excess of its assessa-ble economic value; and that an appropriate philosophy regarding the physical environment would be to "live with the environment, not attempt to conquer it".
1. In order to protect lands throughout Amherst where the surface of the ground is moved, as in timber harvesting and road building operations, measures should be taken to keep erosion to a m inimu m, as outlined in the 1974 Minimum Shorelands,Zoning Ordinance, under
155
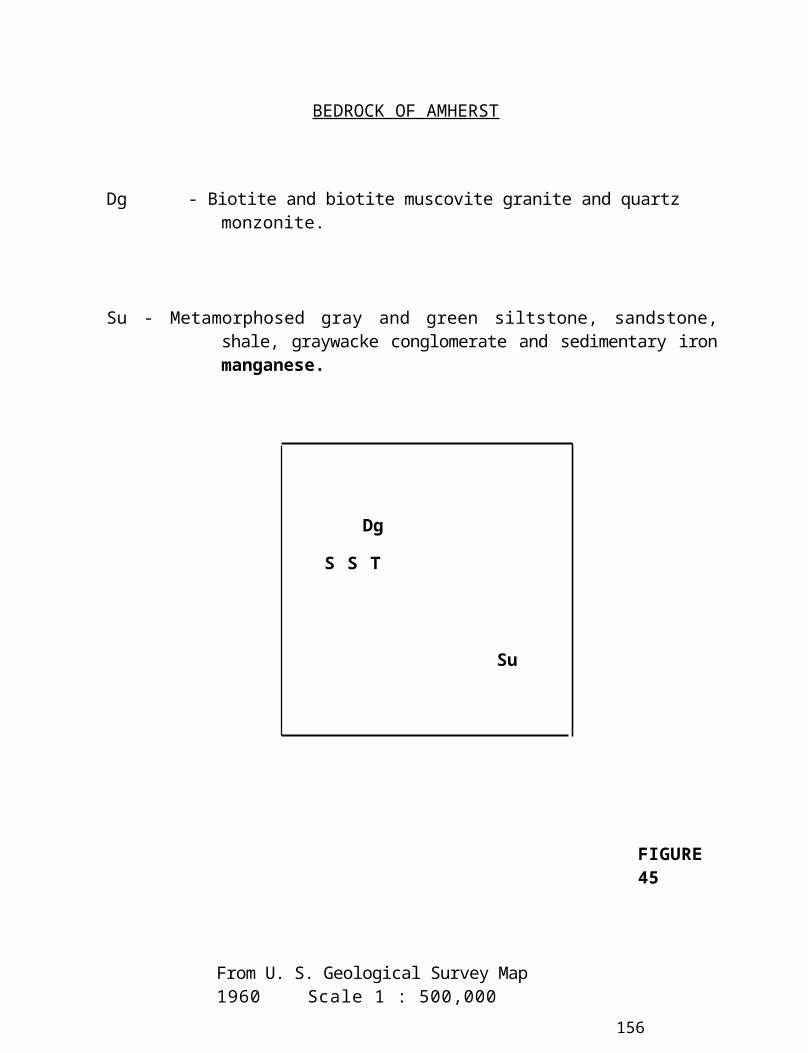
Section "1", Timber Harvesting.
156
157
( 4.5.
( 5.
(
(
C
L
2. Winter deer yards should be protected from
destruction.should be strictly regulated if not altogether banned. This should include also roadside spraying of defoliants, but should not be construed to prohibit small scale household or garden use of pesticides or herbicides, The intent of this recommendation is to prevent general environmental effects from occuring as a result of applications of noxious or toxic substances, A legitimate exception is seen in the case of blueberry spraying, where the market for unsprayed berries has virtually ceased to exist, thus cutting off the livelihood of the blueberry farmer who would refuse to spray, and, as the proportion of acreage in blueberries in Amherst is small, i t represents min im al impact in the town, (as opposed to spraying of forest, which could easily affect more than half the town).A permit should be required for any timber harvesting operation.
Ground water, which is the dr h t water source for Amherst, should be protected from contamination.Wetlands which do not fall under the Shorelands Zoning Ordinance should be protected in their functions as water recharge areas and wildlife habitat.
A C T I O N P R O G R A M
V I I
f
A. INTRODUCTIONA plan is here proposed which should insure an optimum rela-tionship between new development and the town's technical and financial abi l i ty to provide essential services. The Action Program is developed to proceed on two fronts; "Governmental Action Program", and "Planning Action Program". The duties described are to be carried out by the Selectmen and Planning Board respectively. This program is designed to assure the ongoing planning process.
3. PLANING ACTION PROGRAM,
1. Adopt Interim Comprehensive Plan.2. Planning Board should draw up a subdivision moratorium
statement and make presentation for discussion and vote at a special town meeting.A task force including the Planning Board and Selectmen should be created to formulate a site plan review ordinance. This ordinance would be based on the following:a. Popular preferences as determined by the
Attitudinal Questionn-ire.
b. Shoreland Zoning Guidelines.c. Model site plan review ordinance provided by the
Hancock County Planning Commission.
4. Presentation and adoption of the Site Plan Review Ordinance at the town meeting.
5. With the aid of the Hancock County Planning Commission, the Planning Board should formulate a subdivision ordinance and present such a statement to the town for adoption.
6. The Planning Board should revise the Shoreland Zoning of 1974.
7. The Planning Board should become aware of federal, state and county assistance programs which might be of assistance to townspeople in the following areas:a. Medical

b. Transportationc. Construction alterations (such as
insulation installations). The Planning Board should alert townspeople who may qualify for such programs
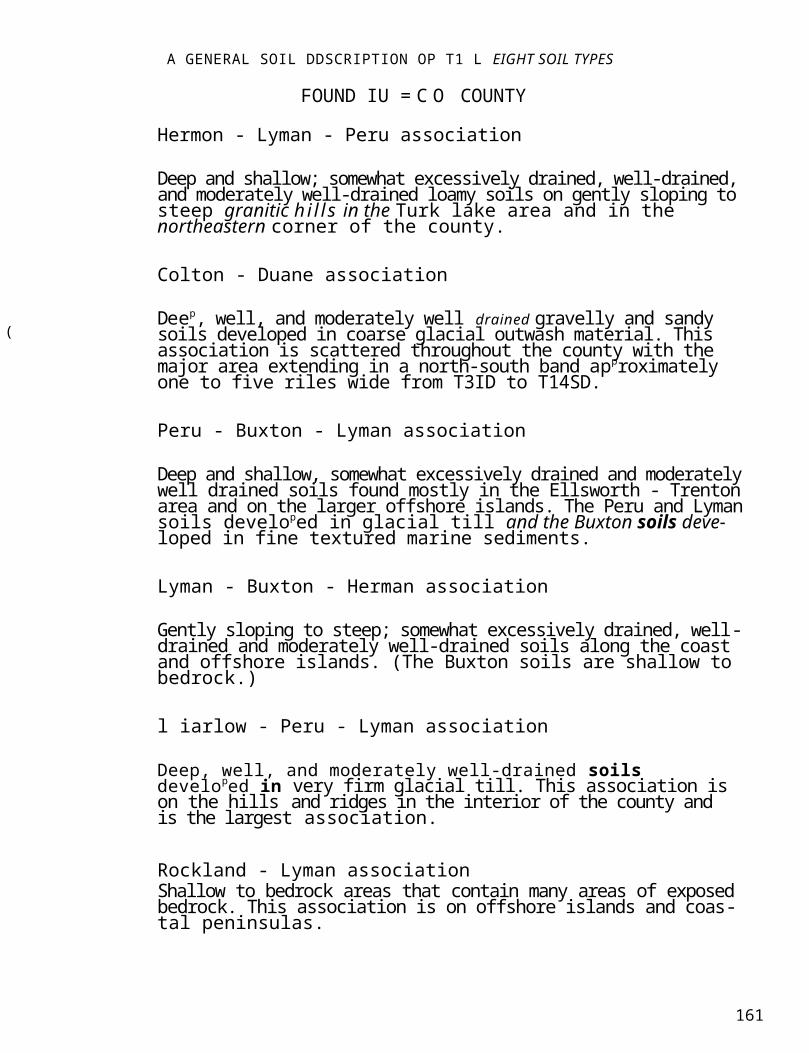
8. The Planning Board should investigate low cost housing alternatives and compile a library of housing options.
9. The Planning Board should explore the feasibility of hydroelectric, wind, and solar power generation.
10. The Comtirehensive Plan should be updated and revised on an annual basis.
C. GOVERNMENT ACTION PROGRAM1. The Selectmen should provide for the selection of
new town officia ls to create the following agencies: a, Code Enforcement Officerb. Planning Board of Appealsc. Conservation Commissiond. Historical Society
2. With the aid of the Hancock County Planning Commission, the Selectmen should update the Amherst tax map.
3, The Selectmen should join together with other regional town officers in a joint effort to eliminate the tax burden created by the Tree Growth Tax Law.
4. A capital improvement program should be implemented to provide:a. A parking lot in close proximity to the town hall.b. Restoration and/or maintainance of the town hall.c. A recreational facility (bPlU fi e l d ) .
A P P E N D I C E S .
V I I I
APPENDIX A ATTITUDINAL SURVEY RESULTS
We had a total of 111 respondents to the survey, broken down as f o l l o w :11.
12.
13.
Sex: Male FemaleOver 50 gears of age
Under 50 years of age
20
3454
ndowec,
30
Zl5717
29162622
Iiz-r-reed
16 - 25 =26 - 35 =36 - 49 =50 - 64 =65 + =
19 6
Grade Number
6 14 = 87 15 7.
8 6 16 59 9 17 2
10 5 18 211 7 19 = 112 38 20 = 2
15. Highest degree obtained:Decree Number Degree Numbe
r- - I -
MastersDoctorateGrammar School
High School2
43Degree of Education 1 Juris Doctor 1Life Cer t ificate 2 Dentist 1Bachelors 7 Bh 1Associate Degree 5 LPN 1
Yes = 54No = 45
Number of People Number of Households12 28
2
109 4 1
18.
19.
20,
21.
Number of year round and seasonal: Year Seasonal99
Two people live here 0-2 monthsTwo people live here 1-2 monthsTwo people live here 3 monthsOne person lives here 2 weeks102 people live here 12 months a year.
No
8
Lived in Amherst all your life: .Yes
22,
23.
Lived previously i n : Place60Number
47
Hancock CtyPenobscot CtyMaineOut of State
926
830
Reasons for moving/summering here:9.2,3.4.5.6.7.
County SettingObtain home - own landEmploymentRetirementSummer homeCommuting capability to Bangor/EllsworthCome back to hometownMoved to spouse's home
346833117
24. Employment:Full Time, Part TimeUnemployed
Retired.
50 11 14 29 .
25. Where employed:1. Amherst-Aurora 232. Bangor-Brewer 163. Ellsworth 54. Other Hancock County 25. Other Penobscot County 86. Washington County 37. Out of state 4
26. Occupation:I. Professional 92. Managerial - other 43. Laborer-transportation operator 134. Woods industry related 75. Retired 226. Clerical-service worker 77. Hous ewif e 158. Tradesmen-contractor 12
2

2

2 7 . T o w ns t h a t employees of local businessmen l i ve i n :1. Amherst-Aurora 62. Bangor-Brewer 13. Ellsworth4. Other - Hancock County 25. Other - Penobscot County 16. Washington County 7. Out of State 1
28. Income groups:
0-2,999 6 10,000-14,999 73,000-4,999 9 15,000-plus 115,000-7,999 198,000-9,999 9
29. Major shopping is done as follows:' Within town 0
Ellsworth 23Bangor 73Brewer 19
30. Shopping by mail order catalogs? Yes 22
31. Physician location:1. Ellsworth 122. Bangor 703. Brewer 54. Other
Boston 1Orono 1
32. Own a vehicle: Yes83
33. Telephone in home: Yes70
34. Average hours television is watched:0-2 hours 573-5 hours 336 plus " 10
35. Heating fuel: Primary
Oil 34Wood 22Gas 2Kerosene 4Electricity 1
Secondary 6
192
2
36. Own or rent home : oval Rent56 6
37. Home located elsewhere: Yes No6 52
38. Second home locations: NariavilleConnecticut 2Dedham Rhode Island 2P11 i otsvi7le VeazieAurora 2 Phippsburg EllsworthFlorida 2
3 9 . Vegetable garden: Y e s N o41 17
40. Put up vegetables: Yes No37 12
41. Raise aii'1s: Yes No12 35
42, Number of a n i mals :
Chickens 137 Ducks/Geese 23Turkeys 11 Rabbits 26Pigs 15 Beef Cattle 2GoatsHorses 12
4 3 . A ? , n 1 s raised for food production: Yes N o15 37
44. People interested in raising e'i.ir 1 s for food consumption:
Yes No22 41
45, Raising more animals than present needs:Yes No5 19
46. People interested in a farmers market:No
32 5647. Number of people who produce a craft, product or
servicethat could be marketed:
Yes No24 60
48. Description of craft, product or service:Making Wreaths Macrame Knitting Houseplants Horse t ra iv i 'g Crocheting Music lessons
Horseback riding lessons FurnitureSewingBlueberriesBraided RugsWood carving-artist
49. People that don't but would like to produce a craft, product or service: Yes No
31 43
50. What is preventing them from doing so:Outlet 13Time 21Money 15Space 3Raw Material 2
51. Reasons for staying in/coming to Amherst:
1. Low taxes 02. Low density 53. Good place to bring up children 44. Hometown 225. Employment 36. Country Setting 497. No answer 8
52. Reasons that would make you leave Amherst:
1. High taxes 42. High density 253. No Answer 134. Employment 145. I l l Health 76. Nothing 177. Restrictive codes 18. P__m 3ly situation 29. Housing 3
10. Isolation 311. Poor schooling 1
53. Importance of maintaining rural way of l i f e in Amherst:
2
22
f
Important Not Im p ortant
Native over 50 21 3Native under 50 23 1Non-native over 50 9 2Non-native under 50 33 1Non-resident - 2Total 95 9
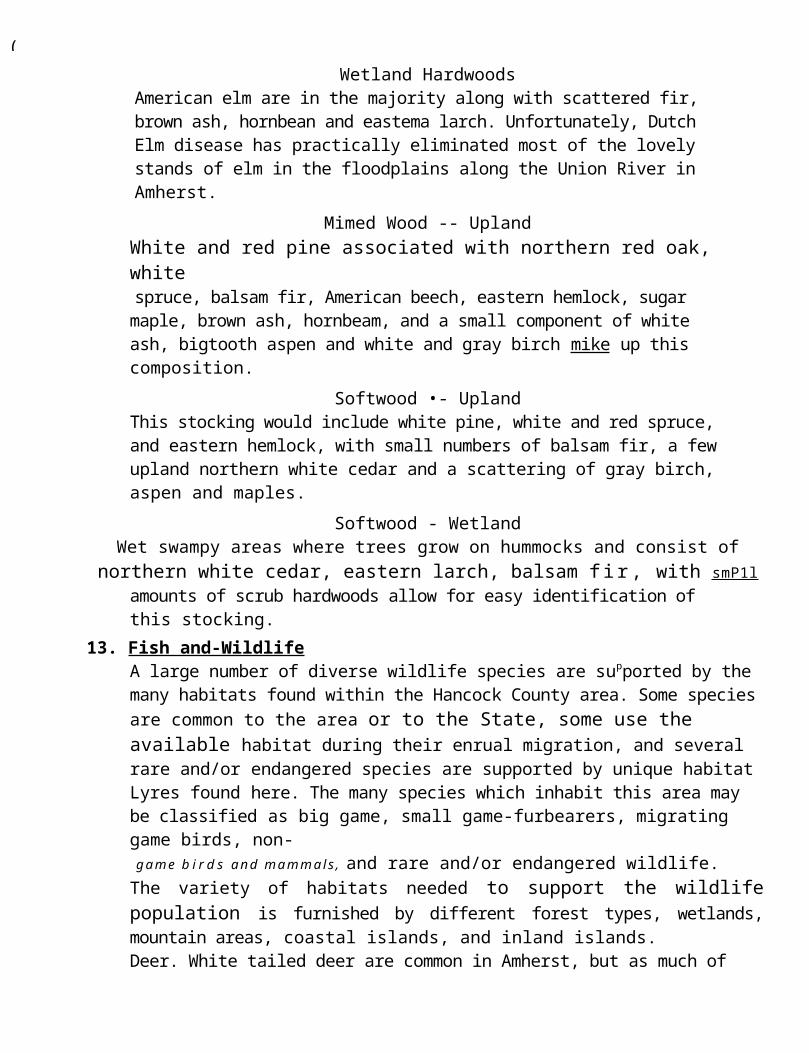
54. Answers to why it wasn't important to mai'tFin the rural way of life:
Town must grow and improve.More people mean more opportunities. No community spirit.
77. Should population increase or remain the same: Increase SameNative over 50 Native under 50 Non-Native over 50 Non-Native under 50 Non-Resident
4 192 226 74 302 10
18 88
Native over 50 2Native under 50 3 Non-Native over 50Non-Native under 50 1 Non-Resident
2 21 32 34 13
26 9 23 4
Unfavorable .vorableNo SignificanceNo Orinion
Isolation 12 64 15Lack of Jobs 51 10 34Loneliness 14 34 _, 16 28 46Lack of Entertainment 24 25 42Lack of CulturalActivity 33 16 42
Remoteness 9 83 6Clean environment 94 5Small Comm ni tY 2 90 8Scenic Beauty 92 5Lack of crime 6 88 4
Total56. Suggested ideal population:
100-150 156-200 201-350 '56-500 501 D1us 1
12
57.
58.
Good place to raise afamily 3 88 7
Good community spirit 11 70 9
59. Need for an active social center: Ye NNative over 50 6 1Native under 50 11 11Non-Native over 50 .8 5Non-Native under 50
Non-Resident
20 11
Total 48 4

60. Where should center be
located:
Separate building 12Town Fall 29Church 5G r P ' g e 13School 1
61. Feelings on a town center/stores:Native over 50 Native under 50 Non-Native over 50 Non-Native under 50Total
9 1115 712 129 665 25
62. Sufficient jobs in Amherst: Yes No Don't Know
264536
63. Sufficient economic opportunities in Amherst and surrounding communities for your children to remain in area:
YesNo
Don't Know 303928
64. Development of local traditional resources (i.e. agriculture, wood) encouraged:
YesNo8019
NoYes
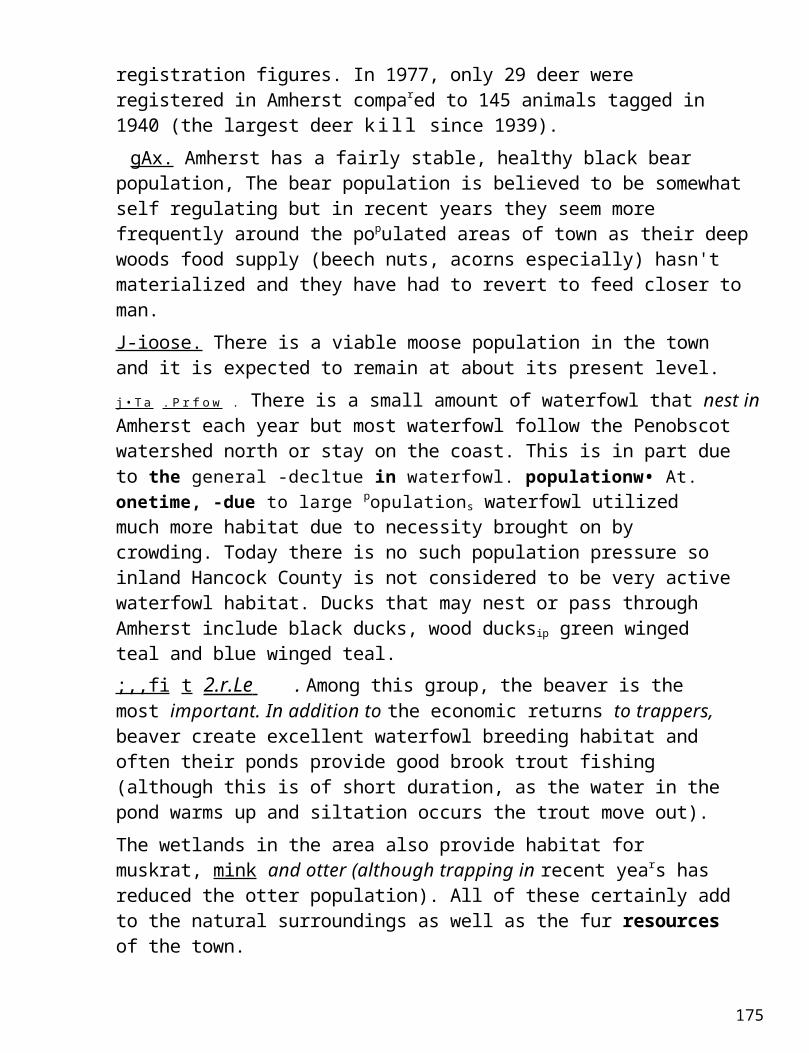
65. Would like to see Amherst encourage more tourist or recreation facilities:
YesNo1487
66. Which types
of
facilities:
Cottages
Skiing and ' F
# i k i n g trails 5Snowmobile trailsSporting CampsCampgrounds
Motels 2Outlet fOr local wares 1Outward bound type schools 1None 2
67. Would like to see Amherst develop light industry: NoNative over 50 15 9Native under 50 13 9Non-Native over 50 5 6Non-Native under 50 20 13Non-Resident 4
57 44
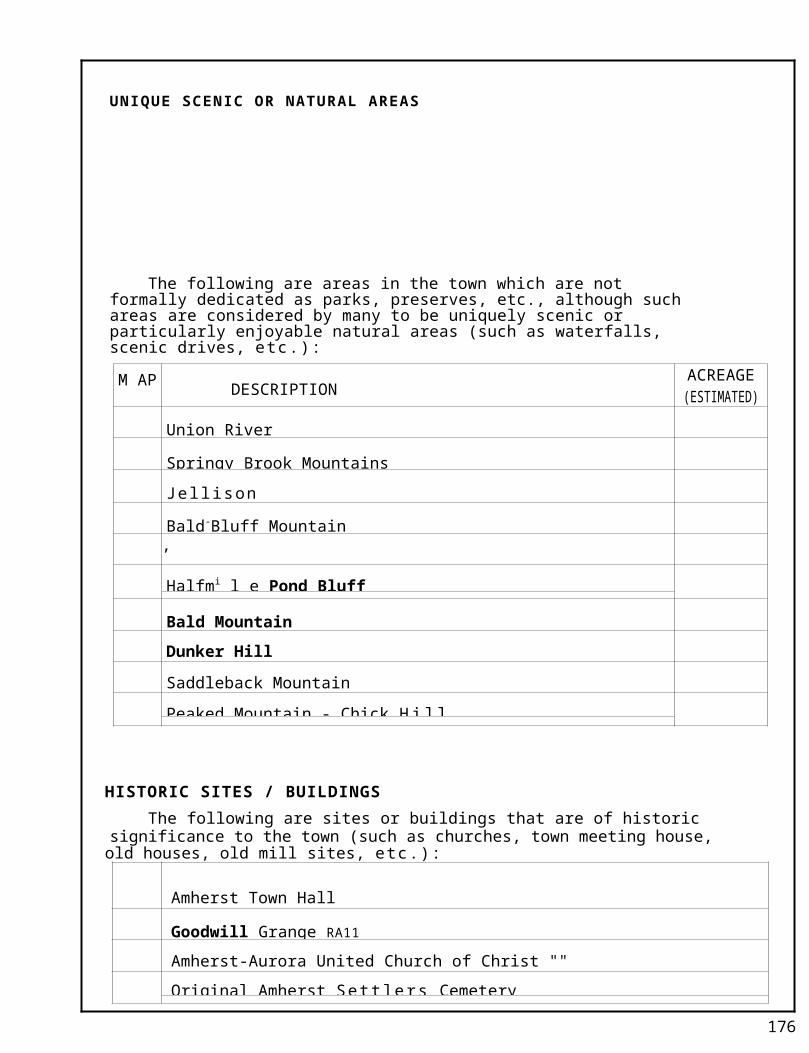
68. Would like to see Amherst attract heavy industry:Yes No
( 2 104
69. What should be done with land uses in Amherst:
Develoved axided Maintained*' -
Residential 18 9 71Commercial 30 17 38Faring 25 28 27Manufacturing sites 7 6 62Town park or parks 38 11 32Open Spaces 10 11 67Access to Union River 12 12 66Preserved Areas 14 15 59Which minimum house lot sizes:
Native Native Non-NativeOver 50 Under 50. Over 50
Non-Native NonUnder 50 :Resident
A. i acre in village 3 1 = 4
B. 1 acre townwide 9 3 7 1 4 =24C. 12 acres townwide 1 4 1 4 =10D. 2 acres townwide 11 13 3 22 =52
70.
71.
72.
Otheracre in town-,acre elsewhere
1 = 1a c r e s 1 = 1
4 acres 2 = 210 acres 1 110-20 acres 1 = 1State Specifics 1 = 1No NCi n i =s 2 = 2
Which minimum house
2 2 2 1 = 7A.frontage:
B. 200 feet frontage 11 11 5 11 6 = 44C. 250 feet frontage 2 5 3 7 1 =18D. 300 feet 6 3 2 13 2 =26E. Other
1150 feet 1 1 1 = 3No minimum 1 = 4
Which minimum house
1 2 3 3 1 =101
setback:
k. 50 feetB. 75 feet 10 9 } =35C. 100 feet 7 17 5 =41D. Other
150 feet 2 3 2 = 71200 feet 1 = 1No l Minimums 3 1 = 4

- T - -- -Native Native Non-Native Non-Native NonOver 50 Under 50Over 50 Under 50
A. 15 feet 1 2 = 3B. 20 feet 3 4 2 1 2 =12C. 30 feet 77 3 7 1 =18D. 50 feet 16 9 3 17 5 =50E. Other
100 feet 1 1 4 3 1 =10H150 feet 1 = 1
7 feet 1 = 1,mile 1 = 1
No minimums 3 = 4Placement of mobile
homes:Suitable Areas 7 9 5 15 3 =3Anywhere with rest r ic -tions 10 11 7 16 5 -49Anywhere 9 4 2 3 =1None 1 =Suggested Restrictions:Septic, water, landscaping 3Same as new homes 2Concrete slab 11Ttailer Park 7No trailer parks 3Keep inviable from tarred roads 3Set back 75 ft from road 1Skirting 1Pick up and neat 4Put lien on them if abandoned 1Establish TFTin allowed number 2Insulated and peak roofs 2Not on airline or within mile junction 1
76, Should timber harvesting and management practices be
77.
Native NativeOyer 50 Under 50 ,
Non-Native Non-Native
Under 5030
NonResid ent
BYes '13 10 6 =67No 10 2 6 4 =29No but no smraving 2Preferred Residen-tion development:MacDonald Road 2 3 = 5Rte., 9 East of River 3 3 1 =11Rte., 9 Vest of River 6 4 3 - _ 4 =2Tannery Loom Road 1 4 6 1 2 =1Route 181 1 2 7 = 10None 5 7 2 8 1 =2*Anywhere 2 = 2Anywhere with Restric-
tions 3 3
73.
74.
75.
Native Native Non-Native Non-Native NonOver 50 Under 50 Over Under 50 RSsidenL
Yes 5 3 6 4 6 =No 16 18 5 31 ='LIShould subdivisions be
more appropriatelyreviewed:
Y'PS 11 7 24 10 -52No 7 9 8 1 =2Areas for commercial
growth:Suitable Areas - 12 13 8 22 9 =6
4Anywhere with restric-tions 6 7 4 2 =2
Anywhere 2 4 7 =1Suitable areas with
restrictions 2 1 = 3Areas for industrial
growth:Suitable Areas 13 17 ' S 30 8 =76Anywhere with restr ic -
tions 5 4 4 2 2 =17Anywhere 3 1 =Suitable areas withNo Industrial Growth 2 1 =Under close supervision 1 =Areas for residential
growth:Suitable areas 7 10 6 21 6 =50Anywhere with rest r ic -
ti nns o 8 12 5 =38 Anywhere 5 1 3 .Suitable areas with
restrictions 2 - 2_T,, mi ted number of suita-
ble areas 1 = 1Preferred areas for com-
mercial development„MacDonald joad 1 = 1,Rte. 9. East of River 3 2 4 8 3 =20Rte. 9 Vest of River 6 7 5 13 4 =,5 Tarr ery Loop 3 1 1 - 5Rte. 181 1 3 1 4 4 =1 Smith Road 1 1 = --None 6 5 2 6 1 =2,Anywhere 1 = 1
78. Encouragement of seasonal home
79.
80.
81.
82.
83.

84. Suggested recreation facilities:
Indoor
Basketball Community Center/rec hall
SchoolLibraryRoller RinkMovies at town hall None
Outdoor7 Ballfield
Tennis Court2 Ice Rink1 Hiking Trails3 Snowmobile Trails2 Swimming Pool
22 Wilderness Park4 None
85. Buildings/areas wanted preserved:
Town F=', 67 Falls on River 1Grange 59 School Houses 7Church 68 Fzalaskas' House 1Old Cemetery 72 Old Houses 2Old Hearst 1 Road tarred to new cemetery 1
86. Naturally scenic areas that should be protected:
Whole town 26 Village 1Tannery Loop and river 40 Smith Road 3Mountains 16 Shorelands 3Ponds 10 None 3
87. Level at which government policies and. regulations should be made:
Federal 1State 7Regional 14Local 77All 7
88. Feel that land use policies in Amherst are being enforced:
Yes 34No 39Don't know 7
89. Alternatives for enforcement of land use policies:
(
30 104 5 4 2 2 3
(
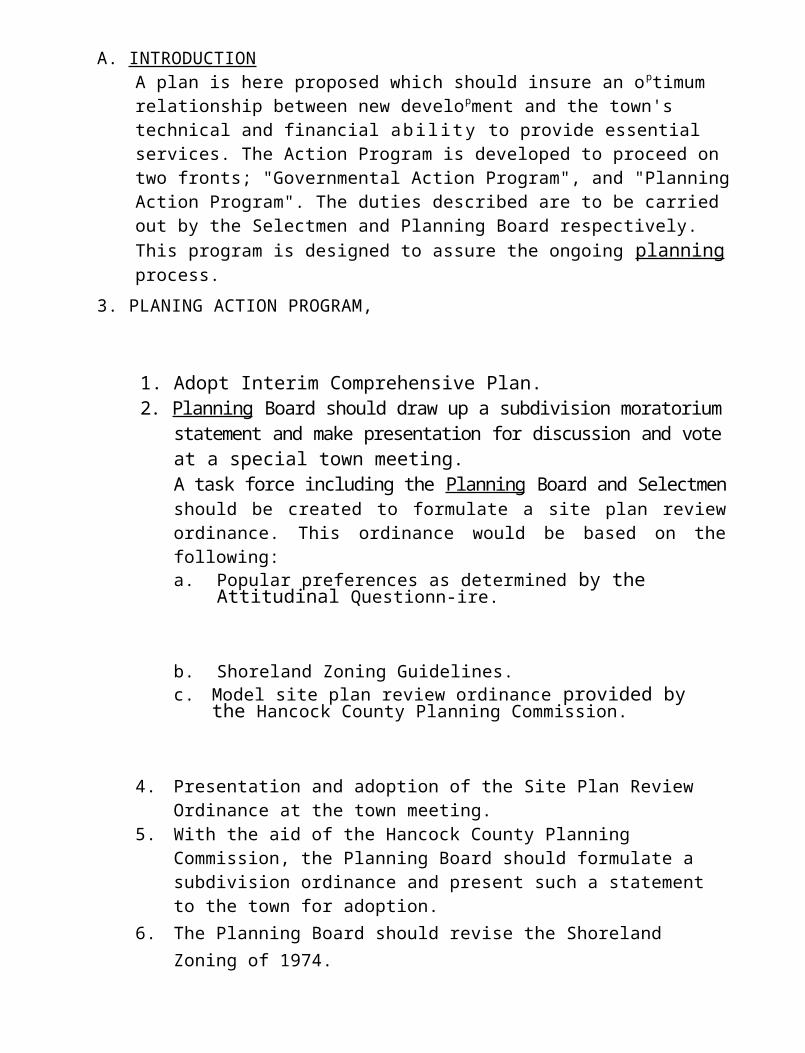
Elected Code Enforcement Officer 17Appointed Code Enforcement Officer 18Regional Code Enforcement Officer 3Selectment 3
90. Management of future commercial, Industrial and residential growth:
Native Native Non-Native Non-Dative NonOver 50 Under 50Over 50 Under 50 Resident
,Local ZontrF 4 9 4 14 7 =38Site Plan Review 15 10 4 18 5 =52State 1 2 = 3iSite Plan Review-Industrial Growth
11
= 11

91. Awareness of State's minimum, mandated, land use codes:
Yes 55No 46Some 1
92. Awareness of specifics on Shoreland Zoning ordinances;
Yes 45No 58Some 1
93. Like to see Amherst enact a townwide z o n i n g ordinance:
Native Native Non-Native
Over 50 Under 50 Over 50
Non-Native NonUnder 50 Resident
Yes 8 12 2 22 8 =52No 14 9 6 13 2 =44Like to see Amherstenact a Site Planreview ordinance:Yes 12 14 4 22 6 =58No 8 6 4 5 1 =24? 1 = 1
95. If no to questions #93 and #94, their suggestions on how to assure that future development in Amherst occurs in the manner and location that would best preserve the local way of life and m i n i m i ze the future cost to taxpayer'
I'll take that chance Vote of the peopleLocal officials State codesAs is now Treat everyone equal-especially the
elderly
96. Should town adopt a capital improvement program:
Yes 63 No 20
97. Suggested projects/improvements that should be undertaken:Town fall 27 Recreational 13Roads 12 Road to new cemetery 1Old Cemetery 3 Improve access to river 1Church 3 Services for elderly 1
t
94.
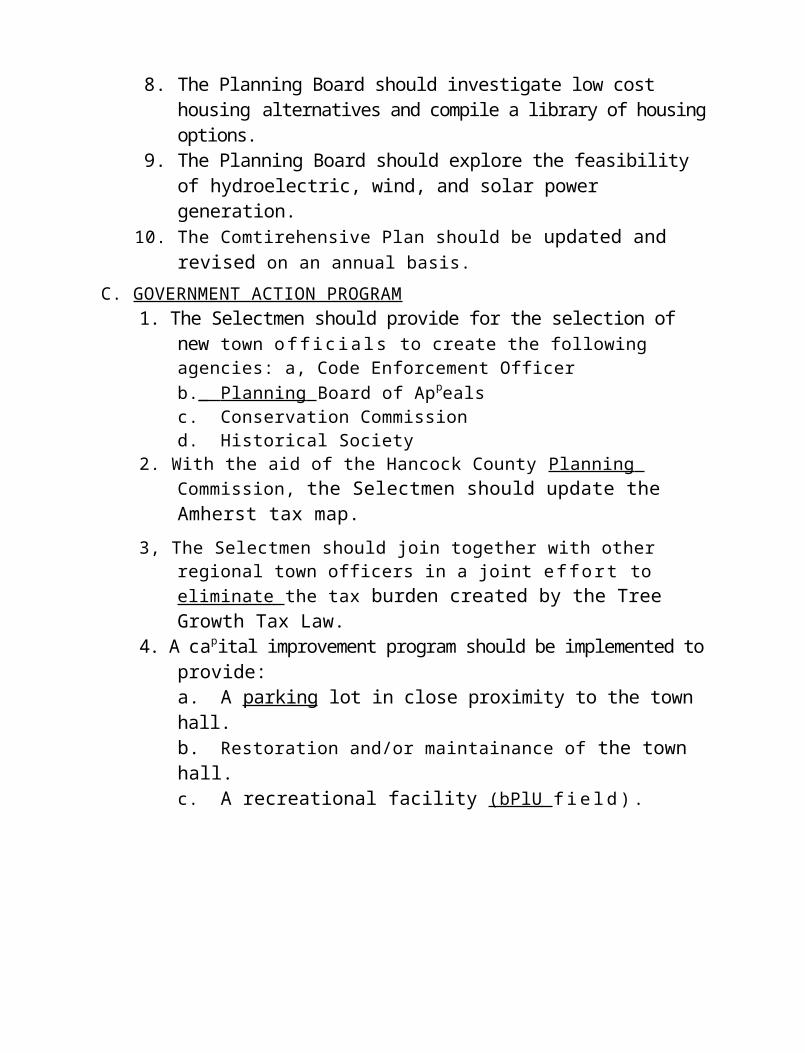
Grange 2 None 1School 4
98. Feelings on whether they get enough town services in return for taxes:
Yes 62 No 21

99ULL o own seises .Adeaaate
NeedsImprovement Undecided
Police Protection 63 20 10Fire Prqtection 63 21 11_ 35 32 20Electricity 81 8 4Shoppi n g 3 6 43 9:Education through 8th grade 50 29 12Library 25 40 20Recreation 31 45 14,Entertainment 0 29 19,Telephone 1 5 23 3Co 7 r ; ty~ Planning 22 44 23
100. Awareness of Tree Growth Tax Law:
Yes 60 No37
Native Native Non-Native Non-Native NonOver 50 Under 50 Over Under 50 Resident
Tag based on presentuse rather thanpotential use 12 9 6 20 6 =53Tax based on incomeor assets 2 2 6 1 =14
Homestead Exemption 6 5 2 8 =21No reform 1 1 2 = 4Retain present systembut grant tax refundbased on owner's 2 1
_
2 10 =15Homestead Exemption only 2 = 2Don't Know nTree Growth Tax Reform 1 2 = 3
102. Awareness of town events:
Yes 71 No26
103. If no to question 102, suggested solutions:
Monthly Newsletters 26 Electric News 4Regular Monthly Meetings 1 Quarterly Newsletter 2Quarterly Meetings 3 Bullentin Board 1Hold Seminars 1 Ellsworth American 1
.
101.
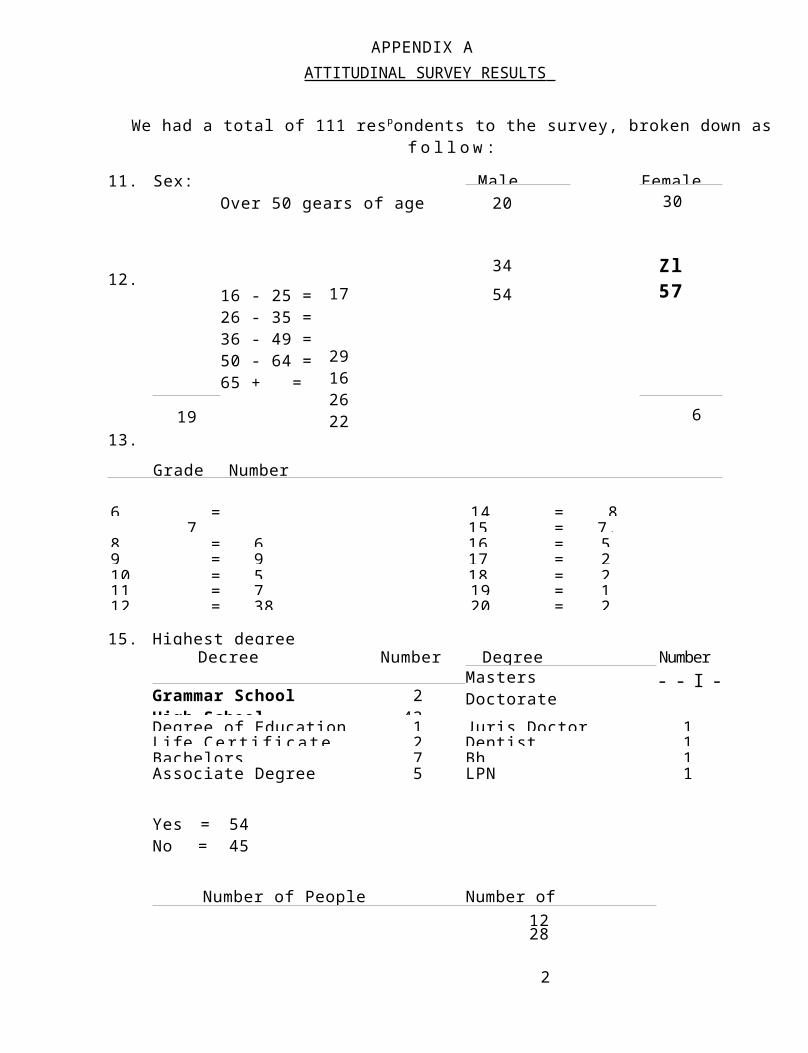

APPENDIX B
BIBLIOGRAPHY
The following is a selected list of the source materials used in the preparation of this planning document and to which this report is indebted.
Airline Community School District: Various budget and expenditure sheets.
Attitudinal Survey of the Town of Amherst: Conducted by the Planning Assistant, Amherst, Maine, 1978.
Amherst Town Reports, Valuation Books and Town Records, 1824-1978.
Amherst Shoreland Zoning Ordinance, Amherst Planning Board, 1974.
Bangor Daily Commercial: "The Amherst Tannery". August 3, 1888.
Blanchard, Fessenden: Ghost Towns of New England. Boston, 1961.
Buxton, Henry: Assignment Downeast. New Hampshire, 1938.
Caswell, W. Bradford, Ph. D.: Ground-Water Handbook for the State of Maine. Maine State ' l i n g Office. Augusta, Maine, 1978.
Chadbourne, Ava Harriet: Maine Place Names and the People of i t s Towns. Freeport, +fiaine, 1957.
Commission on Maine's Future: Final Report. Augusta, Dec-ember, 1977.
Coolidge, Philip T.: History of the Maine Woods. 1963.
Puller, John L. and Gerald P. Cooper: A Biological , Surveyof the Lakes and Ponds of fount Desert Island and the Union and Lower Penobscot River Drainage Systems. FishSurvey Report #7, June 1946.
Hancock County Planning Commission: "Housing Element." Hancock County Com-orehensive Plan, Ellsworth, June, 1976.
Haskell Associates: Isle Au Haut Interim Com p rehensive Plan.
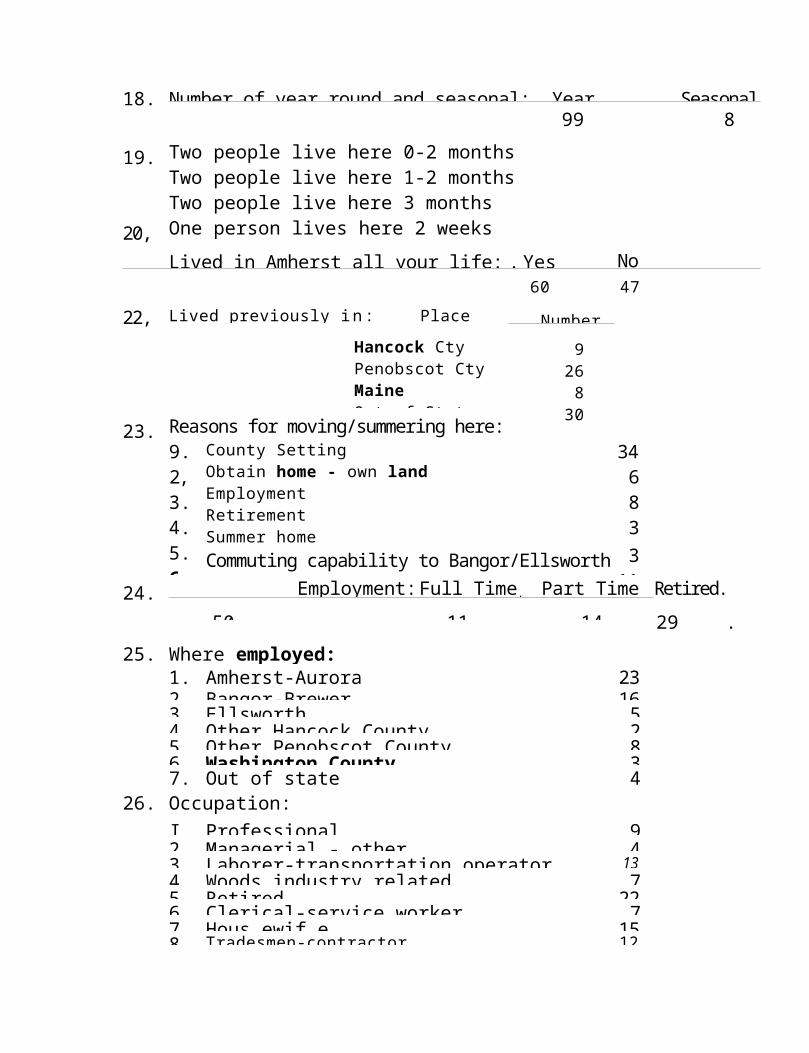
Hallowell, NaineTUct E e r , 19 5.

Havey, Keith A.: Union River Fish Management and Restoration. Maine Department of Inland Fisheries and Wildlife, Machias, Maine.
Jellison, Constance: Amherst Maine Her Settlement and People, 17.20-.1515. Bar Harbor, 1975.
Jordan, Ralph: "The Amherst Cheese Factory:.
Lautzenheiser, Robert E.: Climate oS Maine. United States Department of Commerce, National Oceanic and Atmospheric Administration, National Weather Service. May, 1972.
Maine Bureau of Taxation: State Valuations, 1968-1977 for regional communities.
Maine Bureau of Taxation: "Tree Growth Tax Law". Augusta, November, 1977.
Maine Department of Conservation: Land Use Regulation Commis-sion, "Land Use Districts and Standards" of the Commis-sion's Rules and Regulations. Augusta, January, 1977.
Maine Department of Conservation: Land Use Regulation Commis-
sion, Zoning and Land Use Control Regulations.
Maine Department of Human Services: Various publications of the services they render. Augusta.
Maine Department of Inland Fisheries and Wildlife: Survey maps of the ponds in Amherst.
Maine Department of Transpbrtation: "Accident summary report f o r Route 9 for 1972-76"and Node Map.
Maine Register: Historic population figures for Amherst and communities in the region. 1969-70, 1977-78.
Maine Secretary of State, Motor Vehicle Division: "Summary of Vehicles by Class". Augusta, March, 1977
Maine State Archives: Microfilm of the Town of Amherst's vital records from 1807-1831.
Maine State library: Amherst Town Reports, 1885-1960.
Maine State Planing Office: Maine Planning and Land Use Laws, 1977-18. Augusta, 1978.
Maine State Planning Office: NiuniciDal Characteristics - Han - cock County. 1977.
Maine State Planning Office: Standard Classification System for Land Use Coding in Maine.
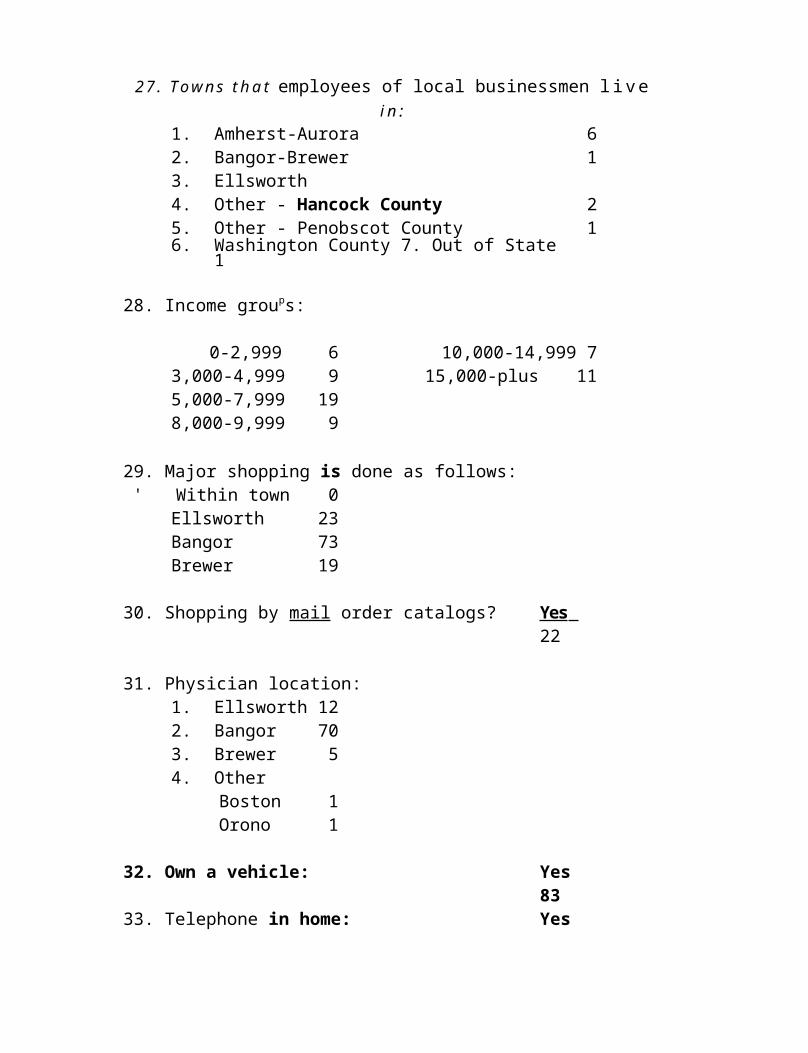
McNeish, J. Dennis: Union River Brown Trout Voluntary Creel Census. Progress Report No. 1, 1973-74.
Natural Resource Council: Sites and Areas of Outstanding Natural Significance.
New Hampshire Office of Comprehensive Planning: The Land Book.
Portland Sunday Telegram: "Fremont Nickerson - Old Time Woods Cook". August 26,1962.
Riley, George A.: A History of the Tanning Industry in the State of Maine. 1935.
School Arimrristrative District #63: Annual Report. 1975-76.
Silsby, Herbert T.: A History of Aurora. 1958.
Somerville, Town of: Preliminary Comprehensive Plan, January, 1977.
United States Bureau of the Census: "Demographic Characteris-tics of the Town of Amherst". 1977.
United States Department of Agriculture, Soil Conservation Service: Ratings for the Soils of Hancock County.
Varney, George J.: A Gazetteer of the State of Maine. Boston, 1882.
Wasson, Samuel: A Survey of Hancock County Maine. Augusta, 1878.
Works Progress Aaministration: Maine - A Guide Down East. Amerioan Guide Series. Houghlin-MiTfIlE,177
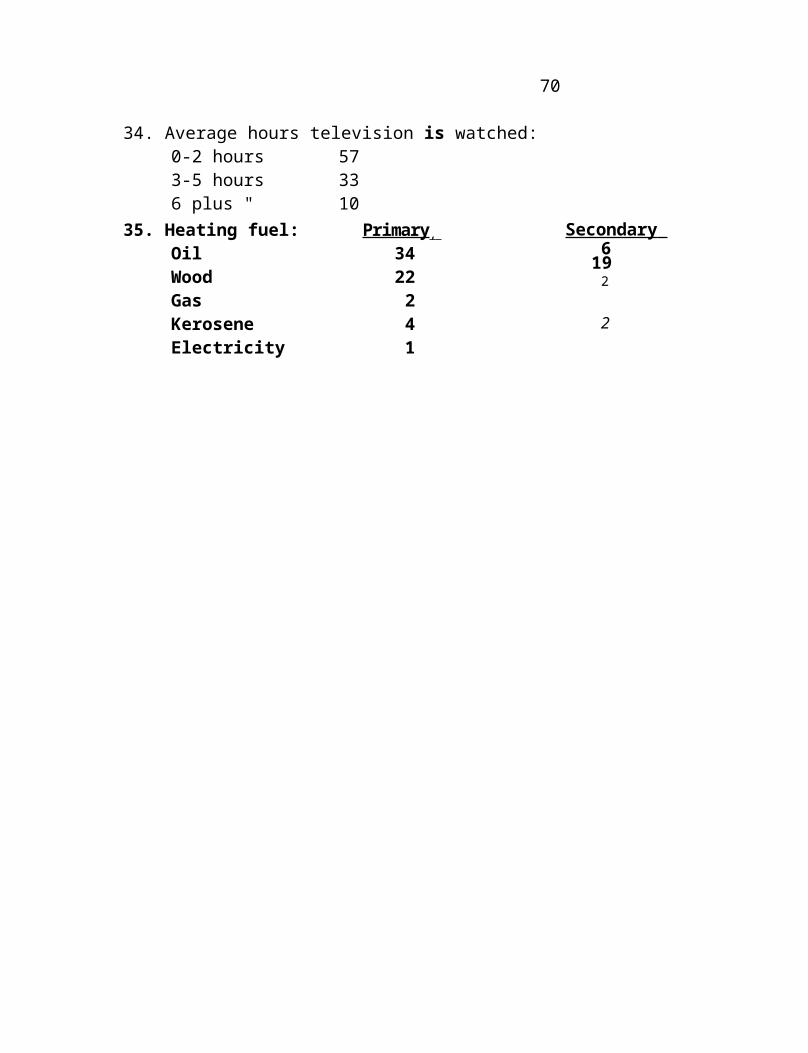
r