Embed Size (px)
Citation preview
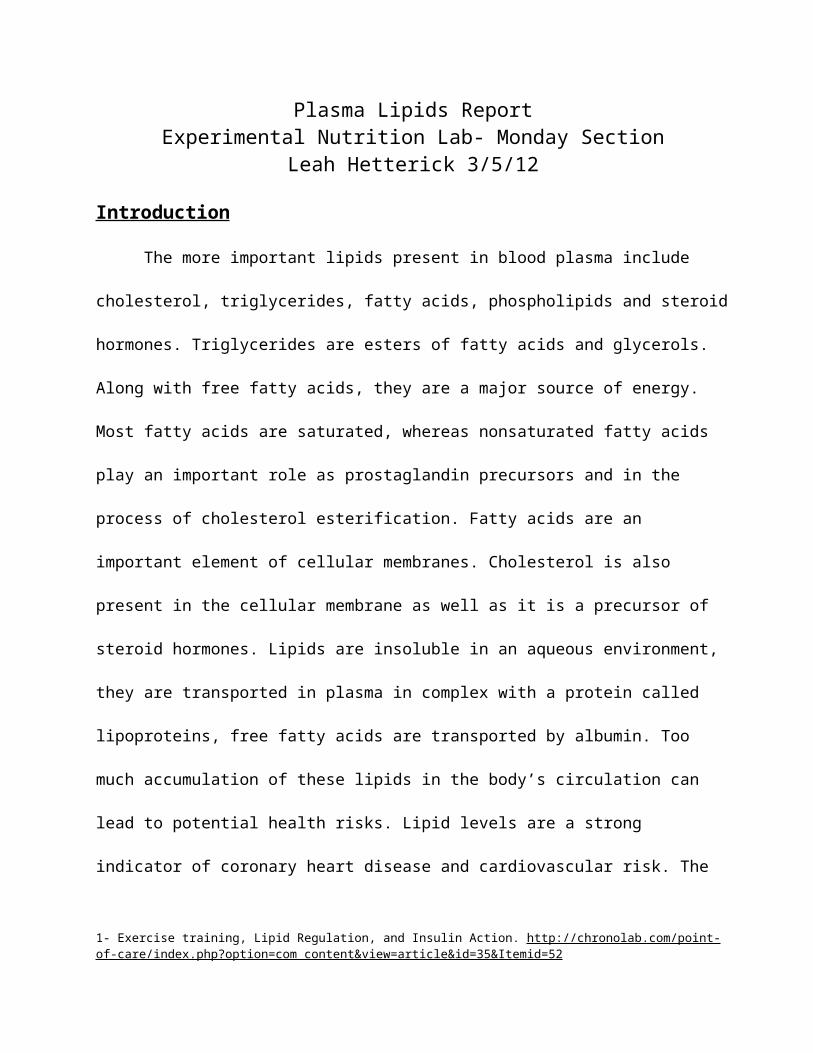
Plasma Lipids ReportExperimental Nutrition Lab- Monday Section
Leah Hetterick 3/5/12
Introduction
The more important lipids present in blood plasma include cholesterol, triglycerides, fatty
acids, phospholipids and steroid hormones. Triglycerides are esters of fatty acids and glycerols.
Along with free fatty acids, they are a major source of energy. Most fatty acids are saturated,
whereas nonsaturated fatty acids play an important role as prostaglandin precursors and in the
process of cholesterol esterification. Fatty acids are an important element of cellular membranes.
Cholesterol is also present in the cellular membrane as well as it is a precursor of steroid
hormones. Lipids are insoluble in an aqueous environment, they are transported in plasma in
complex with a protein called lipoproteins, free fatty acids are transported by albumin. Too much
accumulation of these lipids in the body’s circulation can lead to potential health risks. Lipid levels
are a strong indicator of coronary heart disease and cardiovascular risk. The majority of reduction
in cardiovascular morbidity and mortality in the United States over the past decade has been
attributed to the benefits of more effectively controlling serum cholesterol levels1. The purpose of
these labs was to measure total cholesterol, HDL, cholesterol, and triacylglycerol in our serum,
then to use these measurements to calculate LDL cholesterol. We can use this information to
evaluate our risk for cardiovascular disease. Disorders in lipid metabolism are associated with a
high risk of atherosclerosis. The assessment of lipid metabolism impairments is based on plasma
concentrations of cholesterol and triglycerides as well as data obtained by lipoprotein
electrophoresis. We extracted the lipids from our serum to prep for the separation and
identification of our serum lipids using the process of thin layer chromatography. We also
1- Exercise training, Lipid Regulation, and Insulin Action. http://chronolab.com/point-of-care/index.php?option=com_content&view=article&id=35&Itemid=52

measured our vitamin D status by extracting and measuring 25-hydroxy-vitamin D from our serum
by high performance liquid chromatography (HPLC). Vitamin D status is important to measure
because this vitamin acts to maintain normal serum calcium concentrations. Without sufficient
Vitamin D levels present in our bodies, its deficiency can cause rickets in children and
osteomalacia in adults.
Results & Calculations
Laboratory Exercise #3 – Serum Total and HDL cholesterol and Triglyceride Determination
Concentration of cholesterol calibrator: 151 mg/dL
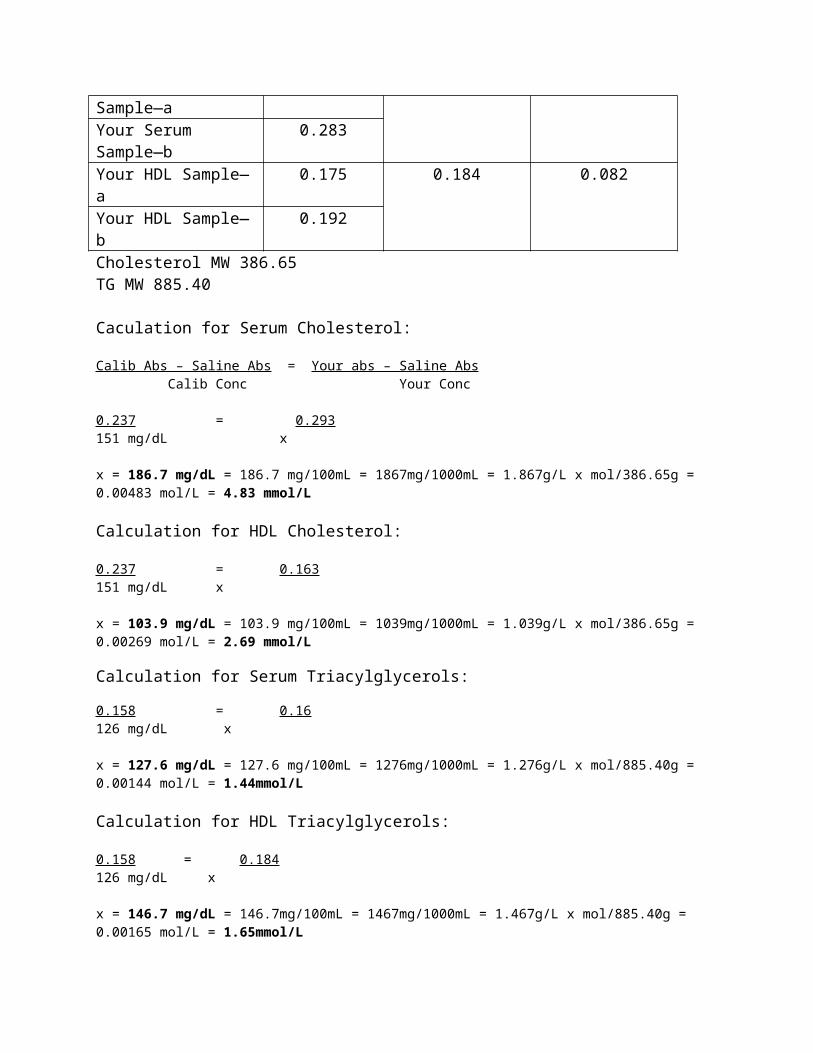
Cholesterol AssaySample Absorbance Mean Absorbance Mean Absorbance-
Reagent BlankSaline—a (Reagent blank) 0.018 0.018 0Saline—b (Reagent blank) 0.018Calibrator—a 0.256 0.255 0.237Calibrator—b 0.255Your Serum Sample—a 0.309 0.311 0.293Your Serum Sample—b 0.312Your HDL Sample—a 0.159 0.163 0.145Your HDL Sample—b 0.167
Concentration of the Triglyceride calibration: 126 mg/dL
Triacylglycerol AssaySample Absorbance Mean Absorbance Mean Absorbance –
Reagent BlankSaline—a (Reagent blank)
0.106 0.102 0
Saline—b (Reagent blank)
0.097
Calibrator—a 0.271 0.260 0.158Calibrator—b 0.248Your Serum Sample—a 0.240 0.262 0.160Your Serum Sample—b 0.283Your HDL Sample—a 0.175 0.184 0.082Your HDL Sample—b 0.192

Cholesterol MW 386.65TG MW 885.40
Caculation for Serum Cholesterol:
Calib Abs – Saline Abs = Your abs – Saline Abs Calib Conc Your Conc
0.237 = 0.293151 mg/dL x
x = 186.7 mg/dL = 186.7 mg/100mL = 1867mg/1000mL = 1.867g/L x mol/386.65g = 0.00483 mol/L = 4.83 mmol/L
Calculation for HDL Cholesterol:
0.237 = 0.163151 mg/dL x
x = 103.9 mg/dL = 103.9 mg/100mL = 1039mg/1000mL = 1.039g/L x mol/386.65g = 0.00269 mol/L = 2.69 mmol/L
Calculation for Serum Triacylglycerols:
0.158 = 0.16126 mg/dL x
x = 127.6 mg/dL = 127.6 mg/100mL = 1276mg/1000mL = 1.276g/L x mol/885.40g = 0.00144 mol/L = 1.44mmol/L
Calculation for HDL Triacylglycerols:
0.158 = 0.184126 mg/dL x
x = 146.7 mg/dL = 146.7mg/100mL = 1467mg/1000mL = 1.467g/L x mol/885.40g = 0.00165 mol/L = 1.65mmol/L
Calculation for LDL Cholesterol Concentration:
LDL Cholesterol = Total Serum - [HDL Cholesterol + (Serum TGs/5)]LDL Cholesterol = 186.7md/dL - [103.9mg/dL = (146.7mg/dL/5)]
LDL Cholesterol = 57.28 mg/dL = 57.28mg/100mL = 572.8mg/1000mL = 0.578g/L x mol/386.65g = 0.00149 mol/L = 1.49mmol/L
Laboratory Exercise #5 – Thin Layer Chromatography of Serum Lipids
Rf = Distance of spot from stating pointDistance of solvent front from starting point
Solvent Front (distance to the top) = 15.5 cm
Cholesterol Esters
TAGs
FAs
Cholesterol
Phospholipids
Cholesterol Esters 5114 5600TAGs 540 1888FAs 546 XCholesterol 3140 2948Phospholipids 3140 2431
HDL PPT LPL
Summary Table for Lipoprotein Lipid Results
Component mg/100mL mmol/L Relationship to Reference Value**
Total Cholesterol 186.7 mg/100mL 4.83 mmol/L Well belowHDL Cholesterol 103.9 mg/100mL 2.69 mmol/L HighTotal Triacylglycerol
127.6 mg/100mL 1.44 mmol/L Normal/Well below
HDL 146.7 mg/100mL 1.66 mmol/L n/a
HD
L
Stan
dard
PPT
LPL

TriacylglycerolLDL Cholesterol 57.28 mg/100mL 1.48 mmol/L Well belowVLDL Cholesterol 25.52 mg/100mL 0.66 mmol/L n/aLipid Ratios RatioLDL/HDL Cholesterol
57.28:103.9 = 0.55
HDL/Total Cholesterol
103.9:186.7 = 0.56
Laboratory #6 – Serum 25-Hydroxy Vitamin D by HPLC
Amount of serum pipetted: 1.25mLCalibrator concentration = 46.9 ng/mLCalibrator area = 69,866
Your serum concentration (ng/mL) = Your peak area x concentration of calibratorPeak area of calibrator
Your serum concentration (ng/mL) = (18207.5 uVmin x100) x (46.9 ng/mL)(69,866 uVmin x100)
Your serum concentration = 12.22 ng/mL (2mL/1.25mL) = 19.56 ng/mL x 2.496 = 48.82 nmol/L
Estimate of 10-year risk from ATP II Guidelines
Age: 20-34 = -7Total Cholesterol, Age 20-39 = 0Nonsmoker, Age 20-39 = 0HDL = -1Systolic BP = 0
Total Points = -8 < 1% 10-year risk
See also attached sheet – “Estimate of 10-Year Risk from the ATP III Guidelines”
Discussion
Evaluation of Risk
After completion of this lab, I was able to evaluate my values for serum total, HDL, and
LDL cholesterol and triglycerides. Comparing these values to the ATP III Guidelines, I concluded
that for my LDL cholesterol I was at 57.28 mg/dL which is < 100 mg/dL and is considered

optimal. My Total Cholesterol level was 186.7 mg/dL which is < 200mg/dL and is considered
desirable. As for my HDL cholesterol I calculated a 103.9 mg/dL which is > 60 mg/dL and is
considered high. As for my Triglyceride levels, I got 127.6 mg/dL which is < 150 mg/dL and is
considered normal.
Based on the values that I got, I have low levels of serum cholesterol, LDL (bad)
cholesterol, and low Triglyceride levels, while my HDL (good) cholesterol levels were very high.
Evaluating these values, they all suggest that my risk of athrogenecity is low. Because my levels of
HDL cholesterol are high, there are more HDL cholesterol levels in my blood, which can donate
lipoproteins (Apo C and E), to chylomicrons as well as VLDL, which allows these particles to
interact with LPL, specifically Apo C, for hydrolyzation. Once VLDL is hydrolyzed and loses all
apoproteins but ApoB100, it becomes LDL cholesterol. The purpose of LDL is to bring cholesterol
to tissues, because I have low levels of LDL and serum cholesterol this means than my cholesterol
levels are in a healthy range.
These values were interesting to me considering genetic factors where: both parents, at
least one aunt and both grandmothers have high cholesterol and also disregarding both my
grandfathers health histories since I never knew either of them. I would have assumed that my
cholesterol levels would have been the opposite as to the results I actually got. Not only are
cholesterol levels influenced by genetics, but also by diet and lifestyle habits. The food choices I
consume would correspond with lower levels of LDL and serum cholesterol. I tend to avoid red
meat foods and instead consume leaner meats and fat-free or reduced-fat dairy products whenever
possible. I tend to choose olive oils, which are monounsaturated fats and is know as a better fat to
consume. I also don’t take in many trans fats, I avoid fried foods and snack foods that are high in
trans fats. Of all the grains I consume, the majority of them are whole grains, which are known to

promote heart health because they have fiber. Both soluble and insoluble fibers have been
associated with a decrease in cardiovascular risk and can reduce LDL cholesterol levels. I regularly
consume fruits and vegetables, which are also rich in dietary fiber. I consume a decent amount of
fish such as salmon and especially sardines as well as almonds that are known to be foods rich in
omega-3 fatty acids that can help reduce LDL cholesterol levels. Physical activity is another part
of my lifestyle habits that can contribute to my lower levels of cholesterol. Physical activity can
help raise HDL cholesterol. These levels of cholesterol are rare but not impossible, if these values
are correct then I would continue with my current diet and physical activity patterns to continue to
maintain a healthy cholesterol level.
Lipoprotein Composition
Evaluating my lipid serum composition, the process of Thin Layer Chromatopgraphy
(TLC) was used as well as a spectrophotometic analysis. TLC is the separation of a mixture of
compounds based on the distribution between a mobile and stationary phase. The basis of TLC
separation is the compounds polarity. The least polar the molecule, the farthest the compounds will
move on the plate. Contrary to this, the more polar the molecule, the less the compound will move.
The more polar the molecule, the more hydrophilic the molecule is, concluding that the farther the
compound travels on the TLC plate, the more hydrophobic it is. In the Thin Layer
Chromatography of Serum Lipids Lab, we separated five different classes of lipids: phospholipids,
cholesterol, fatty acids, triacylglycerols, and cholesterol esters. Phospholipids are the most
hydrophilic followed by, cholesterol, fatty acids, triacylglycerols and cholesterol esters being the
most hydrophobic and the compounds that moved the farthest on the TLC plate.
Evaluating my serum levels from my TLC plate, my HDL fraction is composed more of
cholesterol than triglycerides. This is also true for my PPT LPL fraction, although PPT LPL is

composed of a higher level of cholesterol than HDL as well as TAGs. The results from the
spectrophotometric analysis from cholesterol HDL is 103.9 mg/100mL the TAG HDL is 146.7
mg/100mL while the total cholesterol and TAG are 186.7 mg/100mL and 127.6 mg/100mL.
According to this method of evaluating lipid composition, my serum HDL is composed of higher
levels of triacylglycerols than cholesterol, which is opposite of what the TLC values suggested.
Although the spectrophotometric analysis claims that total cholesterol levels are higher than total
triglyceride levels, which is consistent with the TLC values. This suggests that the
spectrophotometric and TLC lab conclusions aren’t completely consistent with each other.
Evaluating the ratio of free cholesterol and esterified cholesterol, most of the cholesterols
in my serum are esterified. The higher the levels of free cholesterol in the blood can be dangerous
in large amounts before it can settle in the arteries and form a hard plaque that can lead to heart
disease. Having a higher level of cholesterol esters than free cholesterol suggests that my risk of
developing heart disease is low since more of the free cholesterols are being esterified at a faster
rate. This also corresponds with the amount of HDL particles in my serum. Cholesterol is esterified
in HDL particles, considering I have high levels of HDL, it would make sense that more of the
cholesterol is esterified in my blood. Another interesting concept from looking at these results is
the TLC plate shows there is a difference in the quantity of fatty acids between my HDL lipids and
the PPT LPL lipids. This is expected although, because fatty acids are normally carried through the
plasma by albumin, although albumin isn’t a part of the lipoprotein composition.
Vitamin D Status
My calculated Vitamin D status was 19.56 ng/mL, which falls in the 15.0-31.9 ng/mL
category and is considered low. This value is about what I would expect, considering it’s winter

and I don’t use a tanning bed or use a supplement. However I do try to consume foods that are
fortified with Vitamin D such as milk, orange juice, tuna, sardines, and fortified cereals. These
amounts of vitamin D in the foods I eat probably don’t reach my recommended level though.
Maintaining the recommended Vitamin D status can be very challenging considering not many
common foods contain high levels of this vitamin and it is difficult to meet these recommended
levels based only on food sources. In order to improve my Vitamin D status, especially in the
winter, I should start consuming a vitamin D supplement. In the future I will try to continue to
consume and increase my diet that contains more vitamin D. I could try to use the tanning bed,
however