Embed Size (px)
Citation preview

Web Reporting auf Basis von Oracle
Primavera P6 R8.x
mittels Oracle Reports und BI
Publisher
Eva Granz (proadvise GmbH)
Udo Walter (Siemens AG)
DAOG, Berlin 10.10.2013

Agenda
1) Reporting mit Oracle Report Builder und
Oracle Discoverer (U. Walter)
2) Reporting mit BI Publisher (E. Granz)
3) Q & A
Seite 3 10.10.2013 U.Walter/ ES SF REU 6
Agenda
Workload Planning and Web Based Reporting Solution
• The Challenge
• The Approach
• The Solution & Demo
• Q & A
Seite 4 10.10.2013 U.Walter/ ES SF REU 6
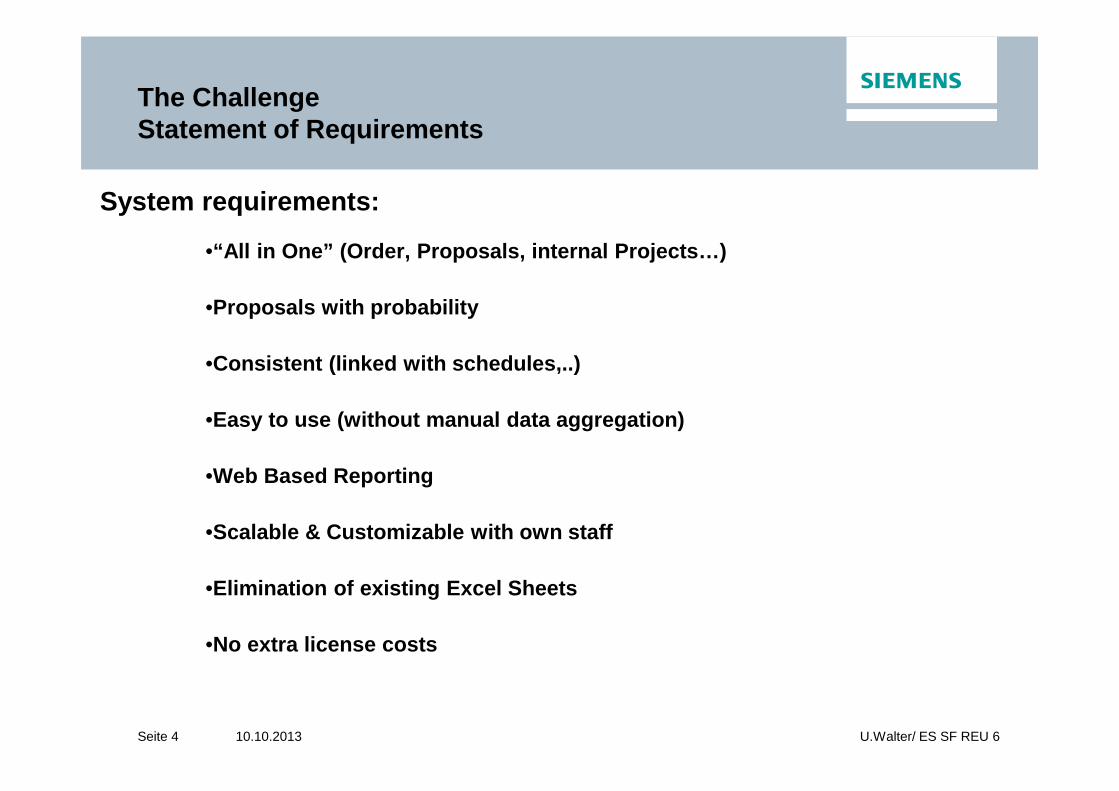
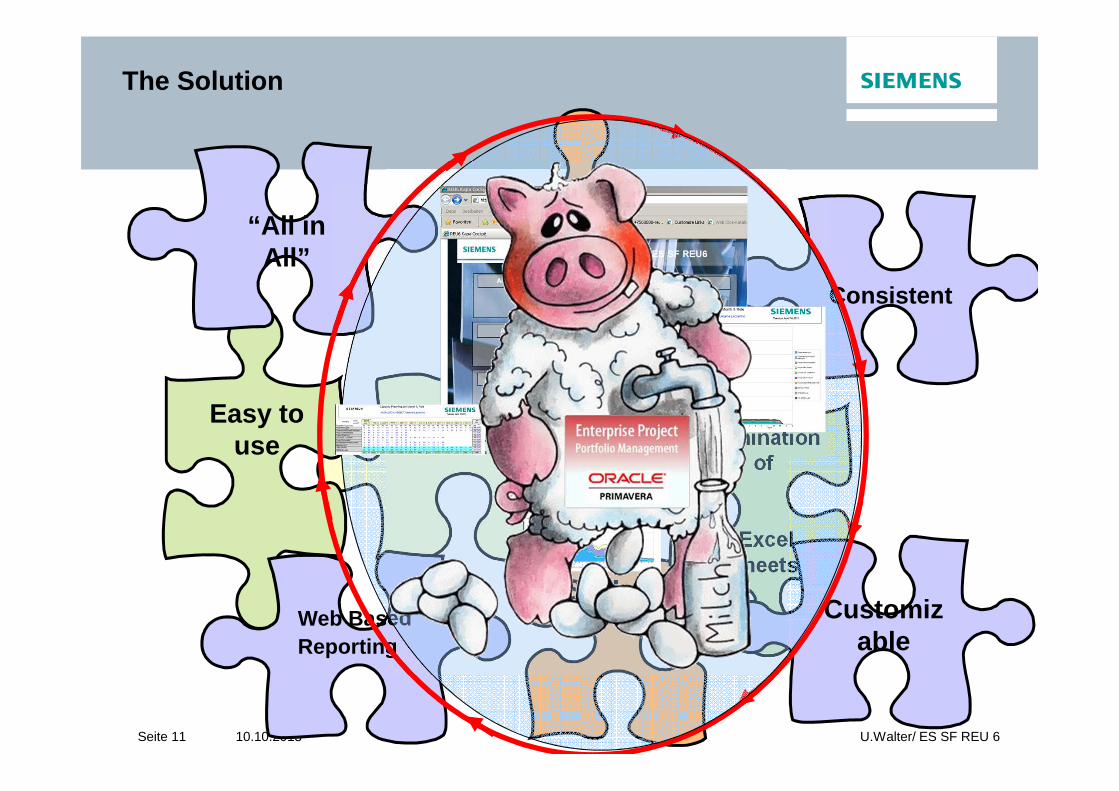
The Challenge Statement of Requirements
•“All in One” (Order, Proposals, internal Projects…)
•Proposals with probability
•Consistent (linked with schedules,..)
•Easy to use (without manual data aggregation)
•Web Based Reporting
•Scalable & Customizable with own staff
•Elimination of existing Excel Sheets
•No extra license costs
System requirements:
Seite 5 10.10.2013 U.Walter/ ES SF REU 6
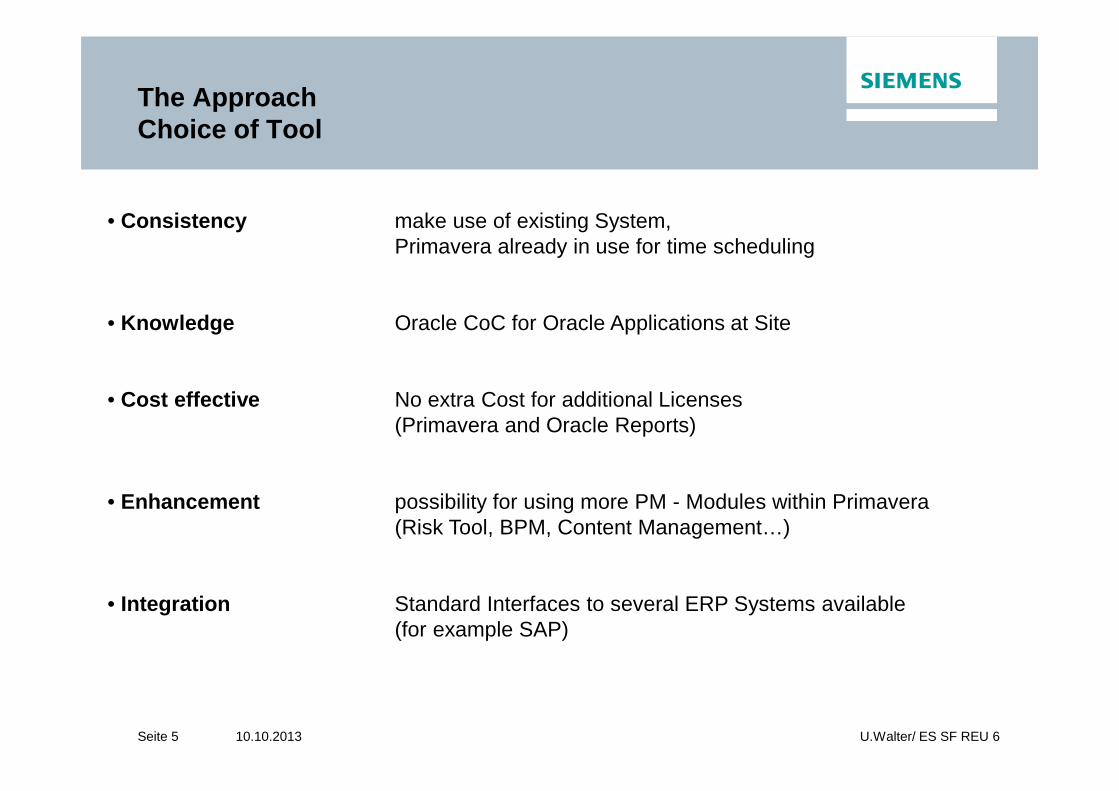
The ApproachChoice of Tool
• Consistency make use of existing System, Primavera already in use for time scheduling
• Knowledge Oracle CoC for Oracle Applications at Site
• Cost effective No extra Cost for additional Licenses (Primavera and Oracle Reports)
• Enhancement possibility for using more PM - Modules within Primavera (Risk Tool, BPM, Content Management…)
• Integration Standard Interfaces to several ERP Systems available (for example SAP)
Seite 6 10.10.2013 U.Walter/ ES SF REU 6
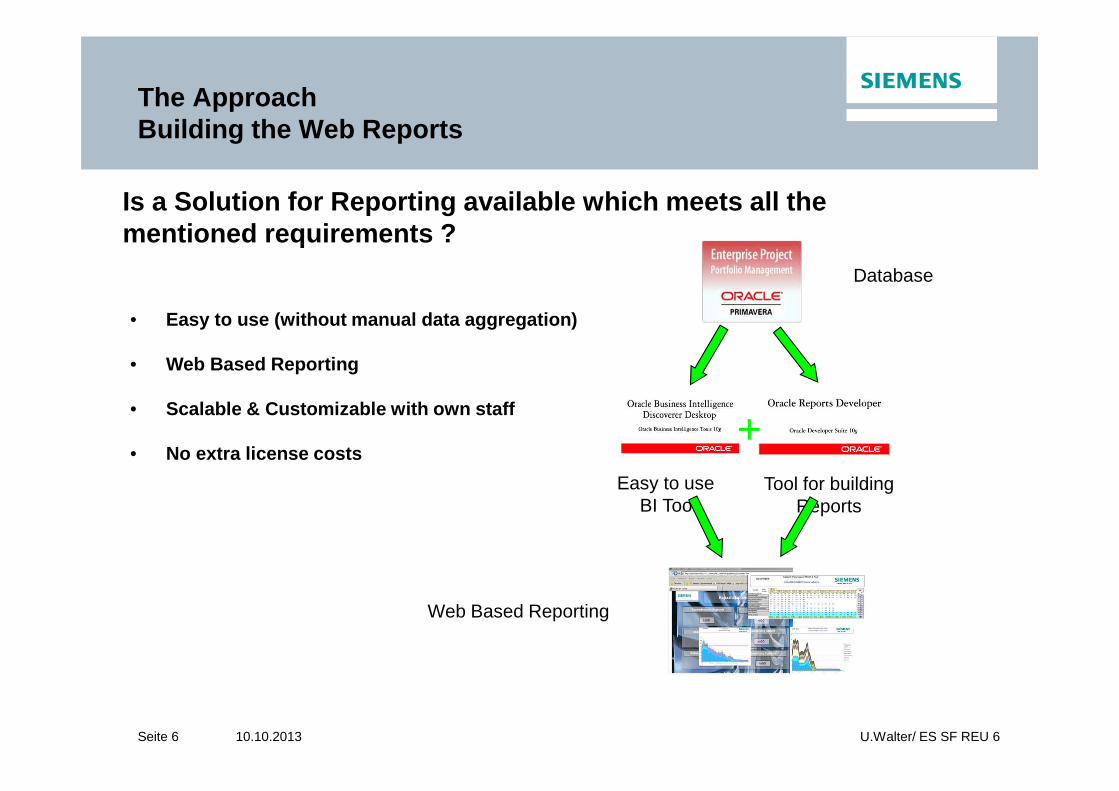
The ApproachBuilding the Web Reports
Is a Solution for Reporting available which meets a ll the mentioned requirements ?
• Easy to use (without manual data aggregation)
• Web Based Reporting
• Scalable & Customizable with own staff
• No extra license costs
Easy to useBI Tool
Database
Tool for building Reports
+
Web Based Reporting
Seite 7 10.10.2013 U.Walter/ ES SF REU 6
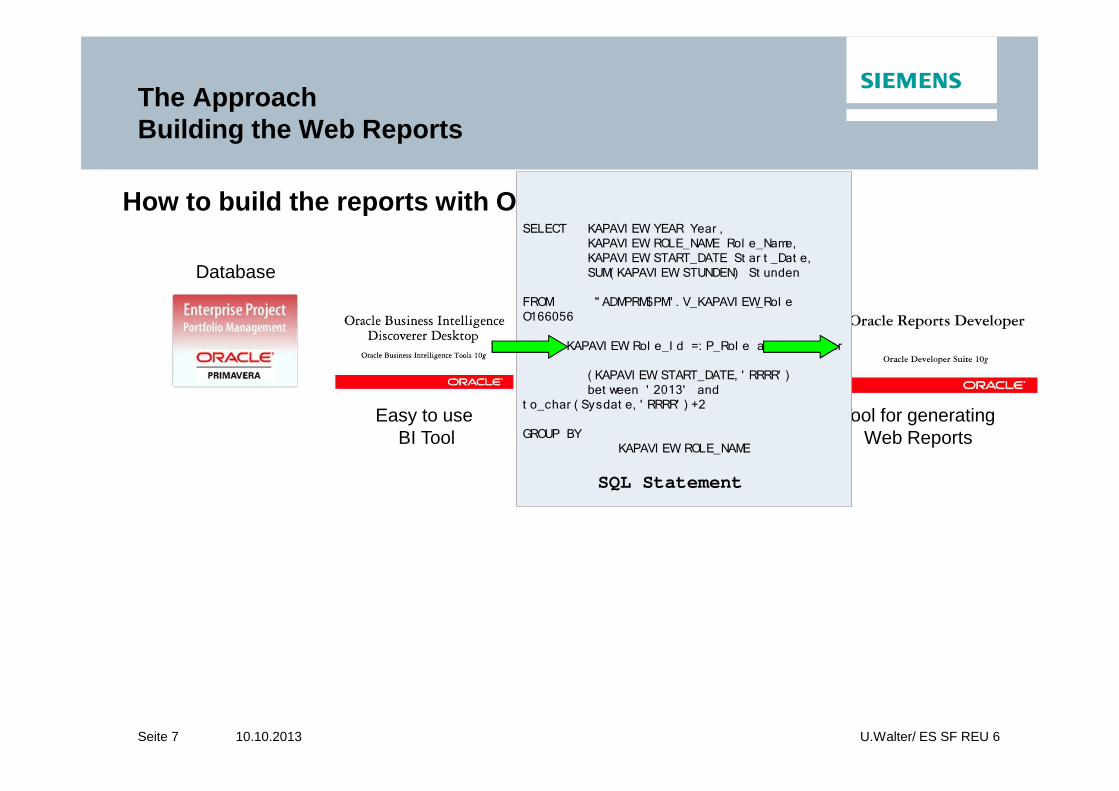
The ApproachBuilding the Web Reports
How to build the reports with Oracle Developer ?
Database
Easy to useBI Tool
Tool for generating Web Reports
SELECT KAPAVI EW. YEAR Year ,KAPAVI EW. ROLE_NAME Rol e_Name, KAPAVI EW. START_DATE St ar t _Dat e,SUM( KAPAVI EW. STUNDEN) St unden
FROM " ADMPRM$PM" . V_KAPAVI EW_Rol e O166056
wher e KAPAVI EW. Rol e_I d =: P_Rol e and t o_char
( KAPAVI EW. START_DATE, ' RRRR' ) bet ween ' 2013' and
t o_char ( Sysdat e, ' RRRR' ) +2
GROUP BY KAPAVI EW. ROLE_NAME
SQL Statement
Seite 8 10.10.2013 U.Walter/ ES SF REU 6
The ApproachBuilding the Web Reports
1. Building the SQL Statement using Oracle BI Disco verer
Seite 9 10.10.2013 U.Walter/ ES SF REU 6
The ApproachBuilding the Web Reports
Using the SQL Statement within Oracle Reports to bu ild the WEB Reports
Seite 10 10.10.2013 U.Walter/ ES SF REU 6
2008-04-01
Agenda
For internal use
• The Challenge
• The Approach
• The Solution & Demo
• Q & A
Workload Planning and Web Based Reporting Solution at E S SF REU 6
Seite 11 10.10.2013 U.Walter/ ES SF REU 6
Proposals
Cost effective
Easy to use
“All in All”
Web Based Reporting
Scalable
Elimination of
Excel Sheets
Consistent
Customizable
The Solution
Seite 12 10.10.2013 U.Walter/ ES SF REU 6
The Solution
Key Data
• 6 different Standard Reports available via Web Interface
• collection of pre-built BI Discoverer Data Queries for additional analyses
• Proposal preparation within Oracle Primavera
• Handling time for one Project/Proposalapprox. 15 min before 2,5 h ���� improved by factor 10
•Kein Extra Aufwand für Berichterstellung da automatisch .
Seite 13 10.10.2013 U.Walter/ ES SF REU 6
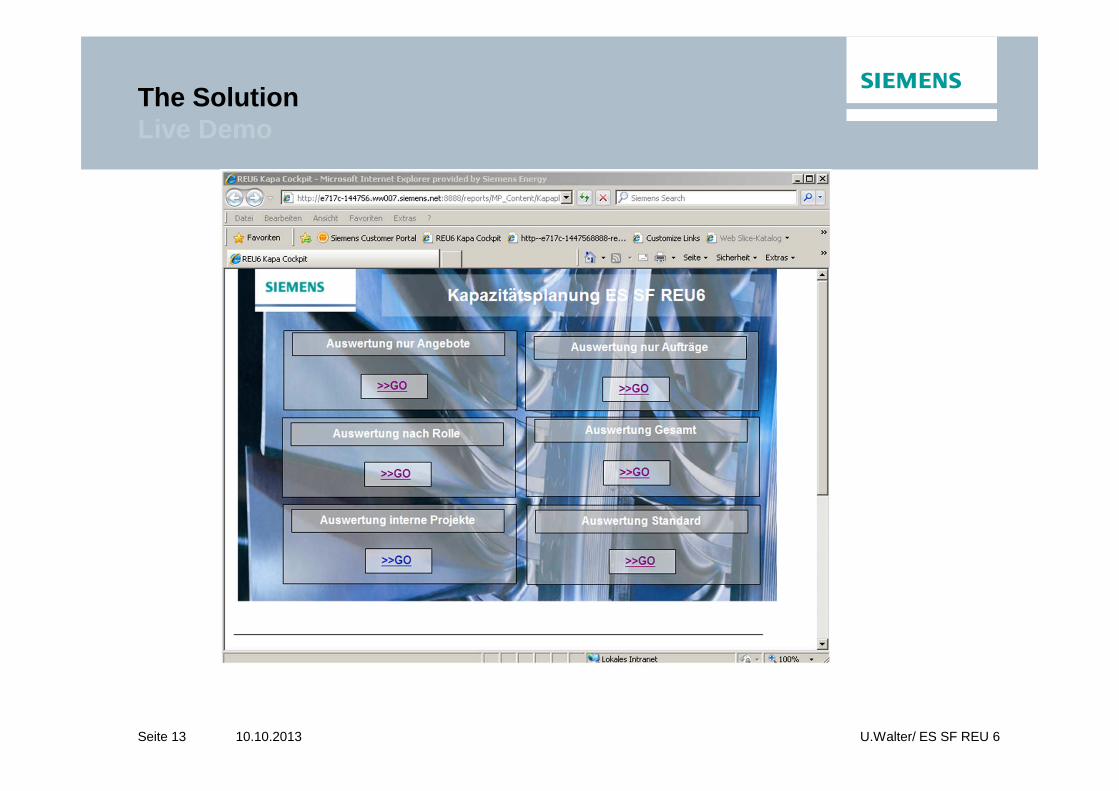
The SolutionLive Demo

Seite 14 10.10.2013 U.Walter/ ES SF REU 6
The SolutionLive Demo
Auswertung nur Angebote
Seite 15 10.10.2013 U.Walter/ ES SF REU 6
The SolutionLive Demo
Auswertung Gesamt

Seite 16 10.10.2013 U.Walter/ ES SF REU 6
2008-04-01
Agenda
For internal use
• About E S SF REU 6
• The Challenge
• The Approach
• The Solution & Demo
• Q & A
Workload Planning and Web Based Reporting Solution at E S SF REU 6
Seite 17 10.10.2013 U.Walter/ ES SF REU 6
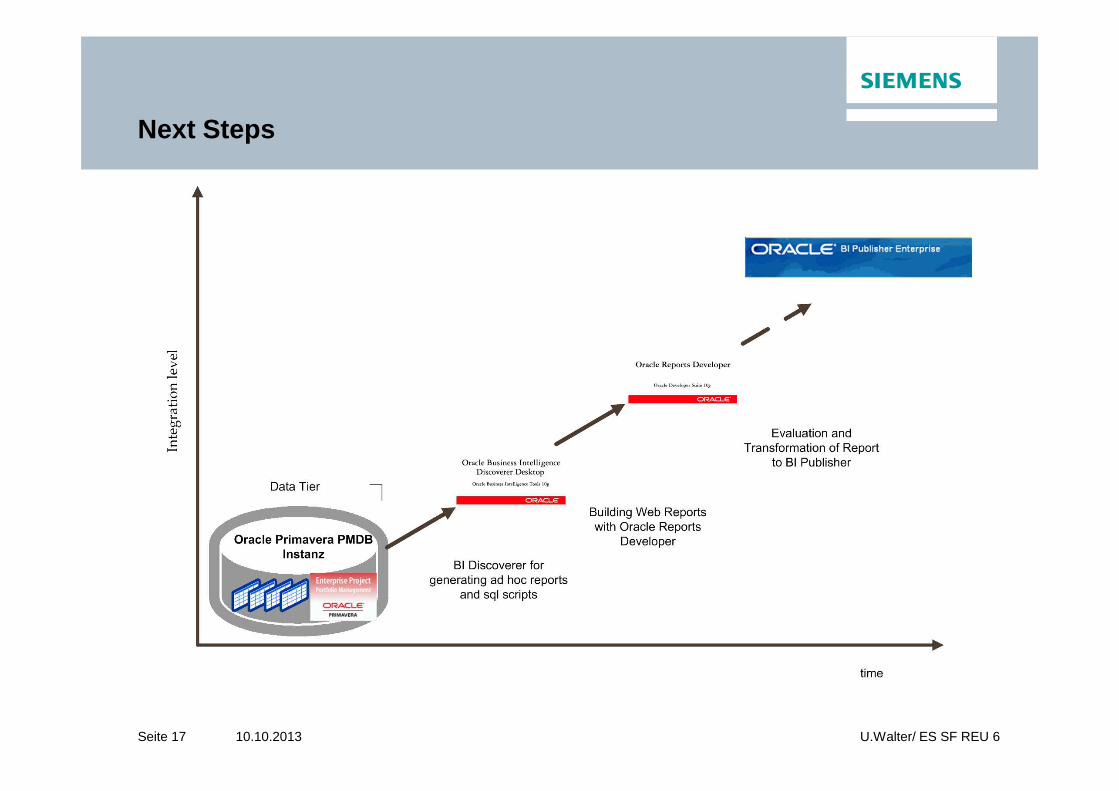
Next Steps
Seite 18 10.10.2013 U.Walter/ ES SF REU 6
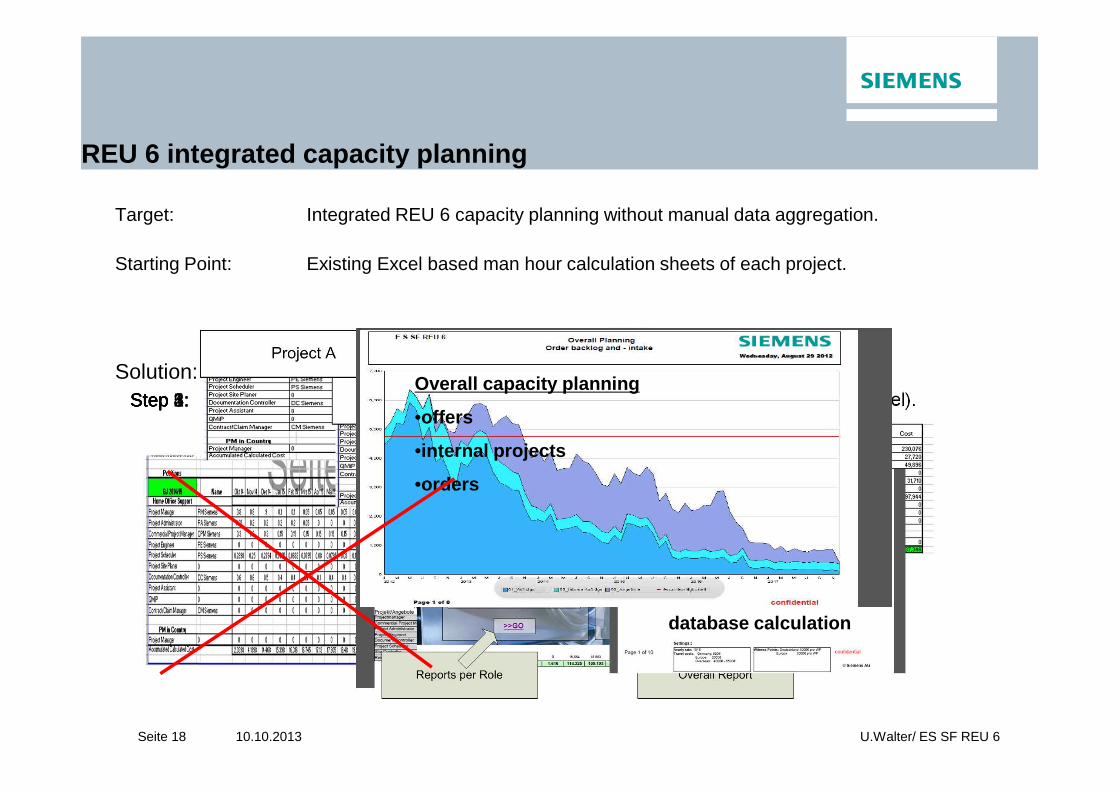
REU 6 integrated capacity planning
Target: Integrated REU 6 capacity planning without manual data aggregation.
Starting Point: Existing Excel based man hour calculation sheets of each project.
Solution:Step 1: Transfer of Excel into Primavera Oracle database, already in use within REU 6.Step 2: Prepare new offers for PM costs directly in the database.Step 3: Creation of standard reports analog to the exisisting Excelsheets (same look & feel).Step 4: Deduct overall REU6 reports, based of information in database.Step 5: Provide an easy to use web-access: „4 Button Management Cockpit“.
database calculation
Overall capacity planning
•offers
•internal projects
•orders
Seite 19 10.10.2013 U.Walter/ ES SF REU 6
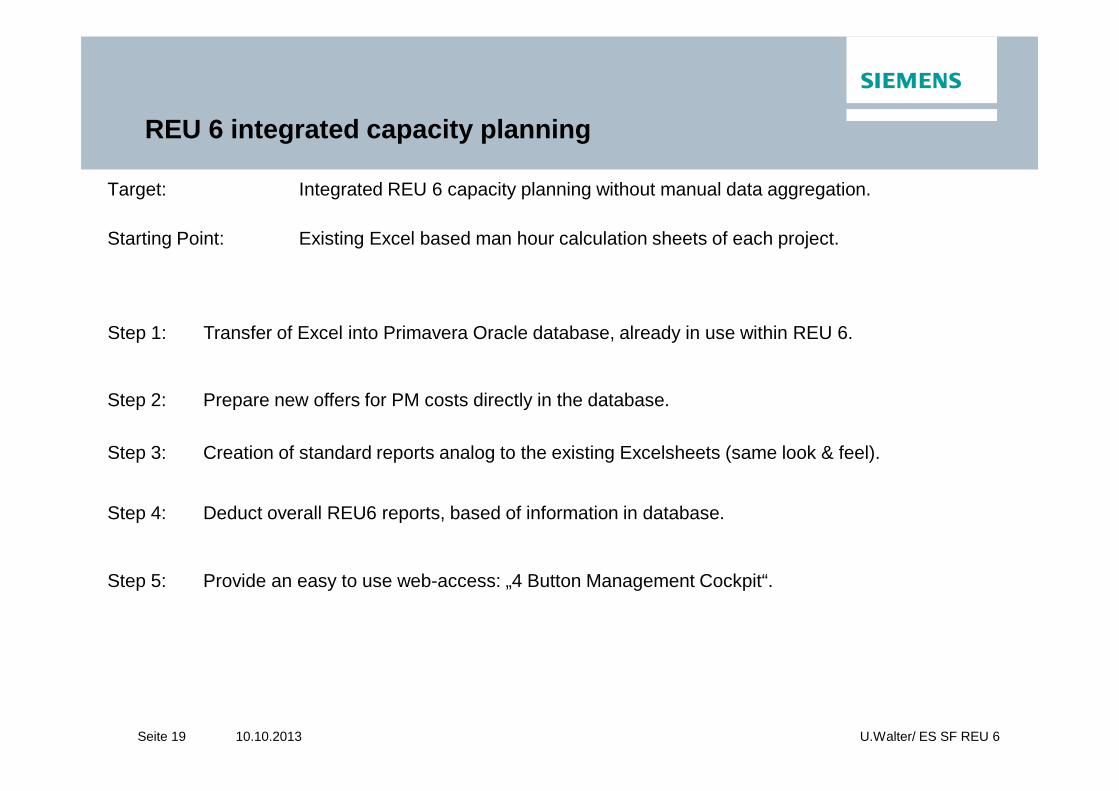
REU 6 integrated capacity planning
Step 5: Provide an easy to use web-access: „4 Button Management Cockpit“.
Step 4: Deduct overall REU6 reports, based of information in database.
Step 3: Creation of standard reports analog to the existing Excelsheets (same look & feel).
Step 2: Prepare new offers for PM costs directly in the database.
Step 1: Transfer of Excel into Primavera Oracle database, already in use within REU 6.
Target: Integrated REU 6 capacity planning without manual data aggregation.
Starting Point: Existing Excel based man hour calculation sheets of each project.
Seite 20 10.10.2013 U.Walter/ ES SF REU 6
REU 6 integrated capacity planning
Back Up Folien
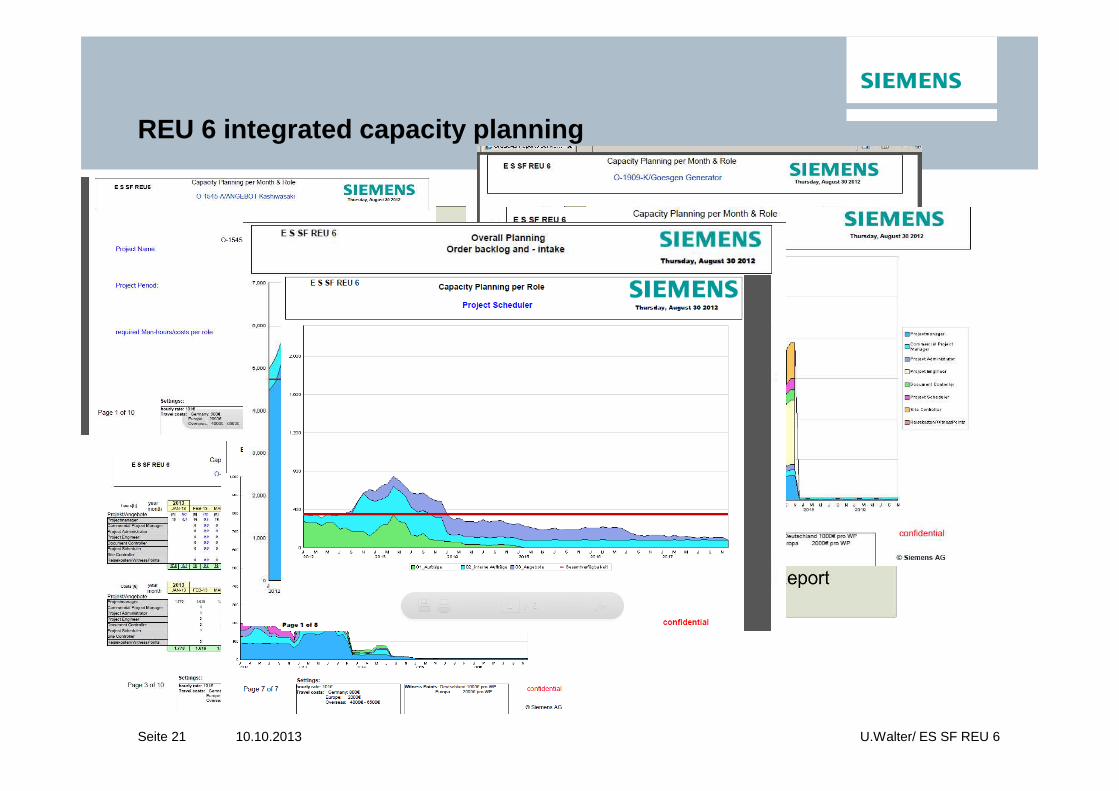
Seite 21 10.10.2013 U.Walter/ ES SF REU 6
REU 6 integrated capacity planning
Seite 22 10.10.2013 U.Walter/ ES SF REU 6
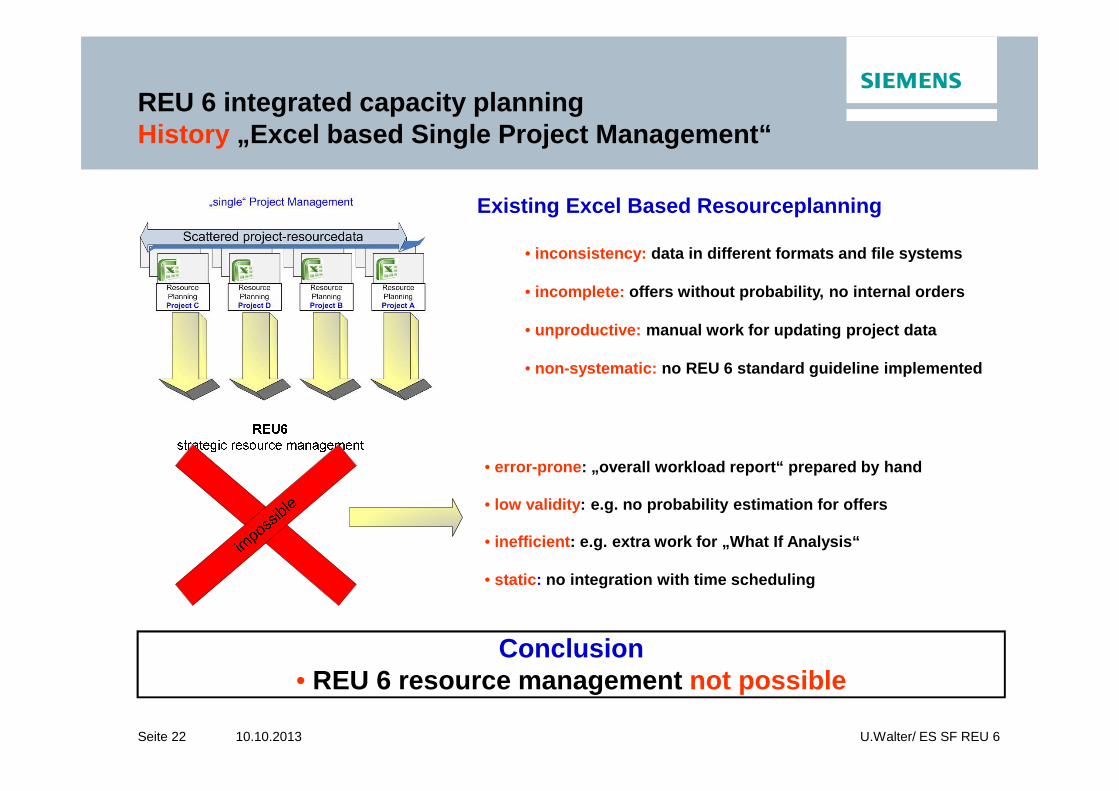
REU 6 integrated capacity planning History „Excel based Single Project Management“
Existing Excel Based Resourceplanning
• inconsistency: data in different formats and file systems
• incomplete: offers without probability, no internal orders
• unproductive: manual work for updating project data
• non-systematic: no REU 6 standard guideline implemented
• error-prone : „overall workload report“ prepared by hand
• low validity : e.g. no probability estimation for offers
• inefficient : e.g. extra work for „What If Analysis“
• static : no integration with time scheduling
Conclusion• REU 6 resource management not possible
Seite 23 10.10.2013 U.Walter/ ES SF REU 6
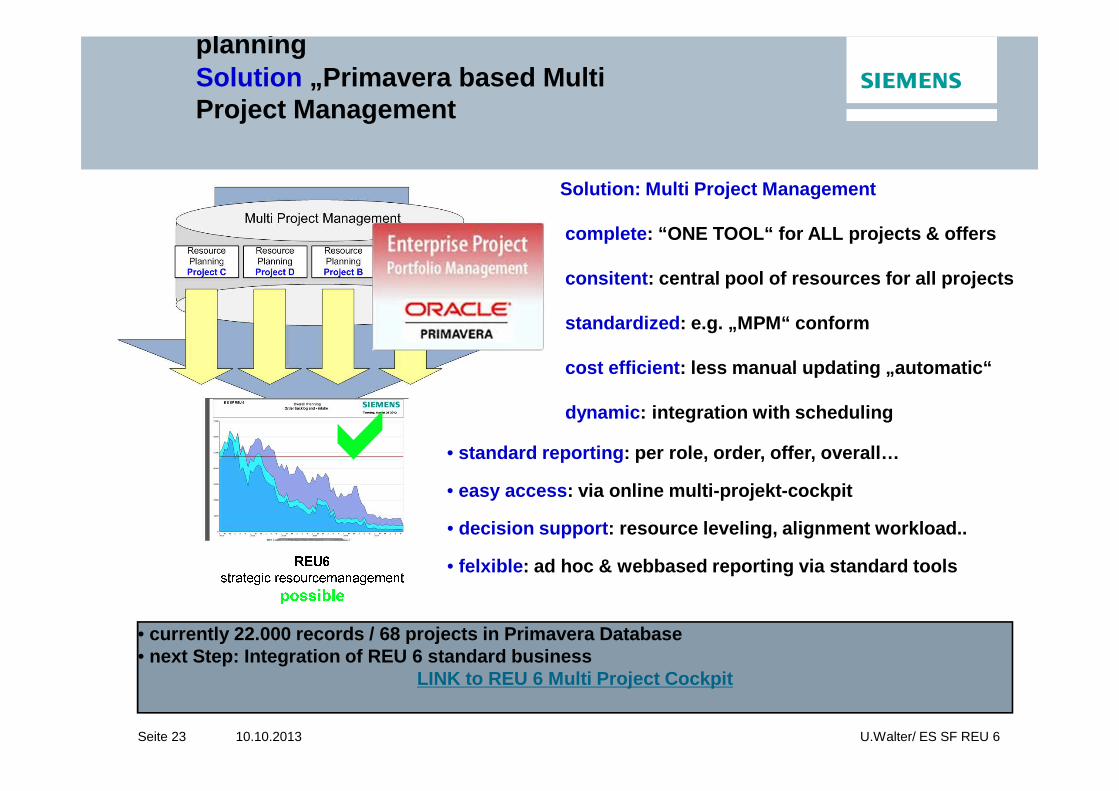
planningSolution „Primavera based Multi Project Management
Solution: Multi Project Management
complete : “ONE TOOL“ for ALL projects & offers
consitent : central pool of resources for all projects
standardized : e.g. „MPM“ conform
cost efficient : less manual updating „ automatic“
dynamic : integration with scheduling
• decision support : resource leveling, alignment workload..
• easy access : via online multi-projekt-cockpit
• felxible : ad hoc & webbased reporting via standard tools
• currently 22.000 records / 68 projects in Primavera Database• next Step: Integration of REU 6 standard business
LINK to REU 6 Multi Project Cockpit
• standard reporting : per role, order, offer, overall…
Seite 24 10.10.2013 U.Walter/ ES SF REU 6
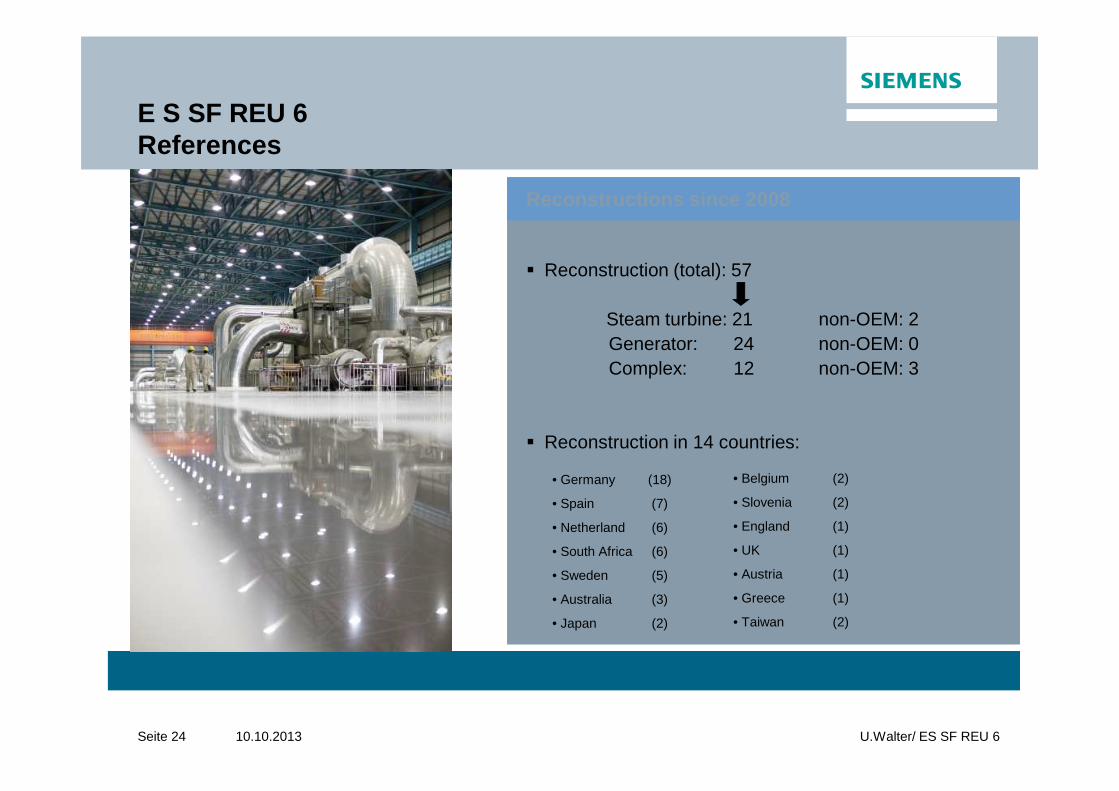
� Reconstruction (total): 57
Steam turbine: 21 non-OEM: 2Generator: 24 non-OEM: 0Complex: 12 non-OEM: 3
� Reconstruction in 14 countries:
E S SF REU 6References
Reconstructions since 2008
• Germany (18)
• Spain (7)
• Netherland (6)
• South Africa (6)
• Sweden (5)
• Australia (3)
• Japan (2)
• Belgium (2)
• Slovenia (2)
• England (1)
• UK (1)
• Austria (1)
• Greece (1)
• Taiwan (2)
Agenda
1. Why BI Publisher?
2. Created Reports
3. General Set Up of Reports
Q & A
Live Demo 4.
5.
27.09.2013 (c) proadvise GmbH – Eva Granz Seite 26
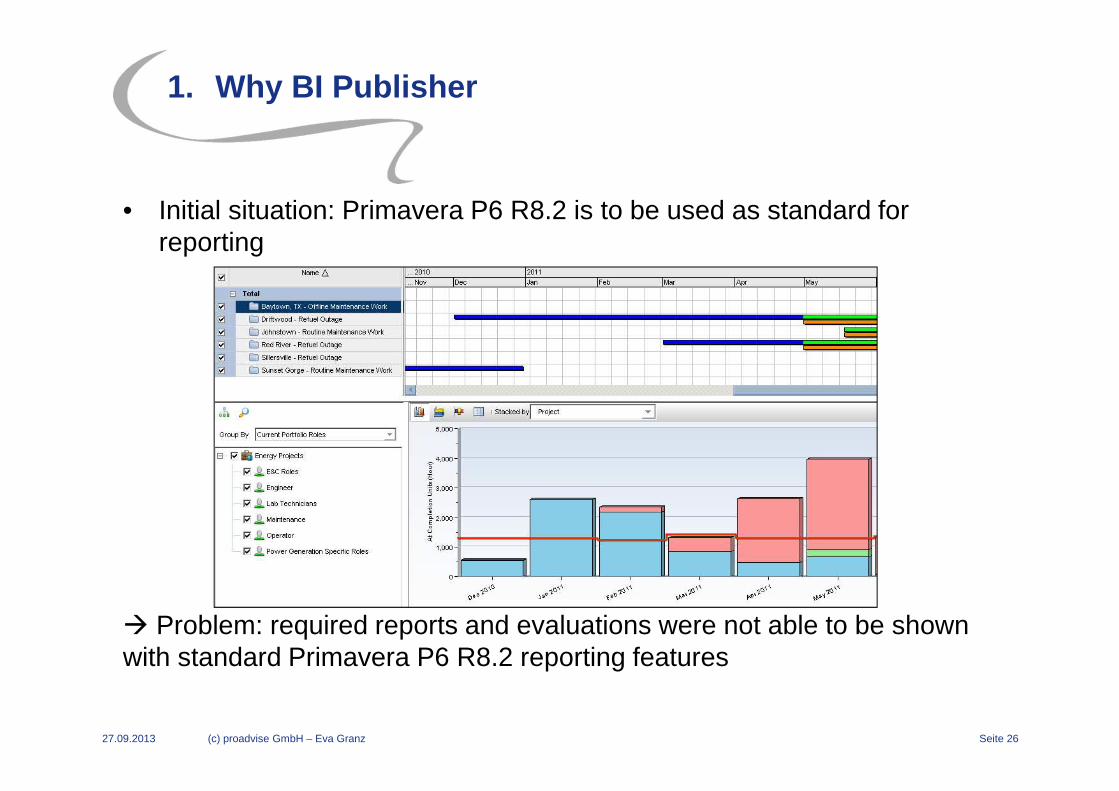
1. Why BI Publisher
• Initial situation: Primavera P6 R8.2 is to be used as standard forreporting
� Problem: required reports and evaluations were not able to be shownwith standard Primavera P6 R8.2 reporting features
27.09.2013 (c) proadvise GmbH – Eva Granz Seite 27
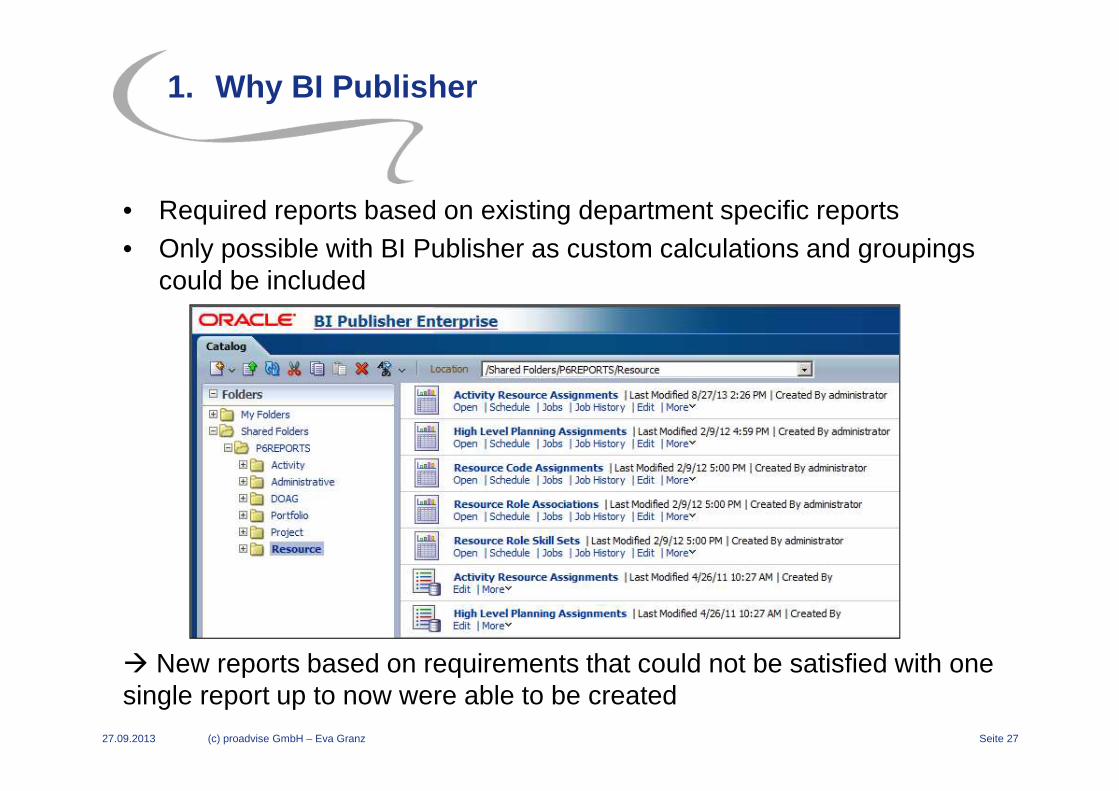
1. Why BI Publisher
• Required reports based on existing department specific reports• Only possible with BI Publisher as custom calculations and groupings
could be included
� New reports based on requirements that could not be satisfied with onesingle report up to now were able to be created
27.09.2013 (c) proadvise GmbH – Eva Granz Seite 28
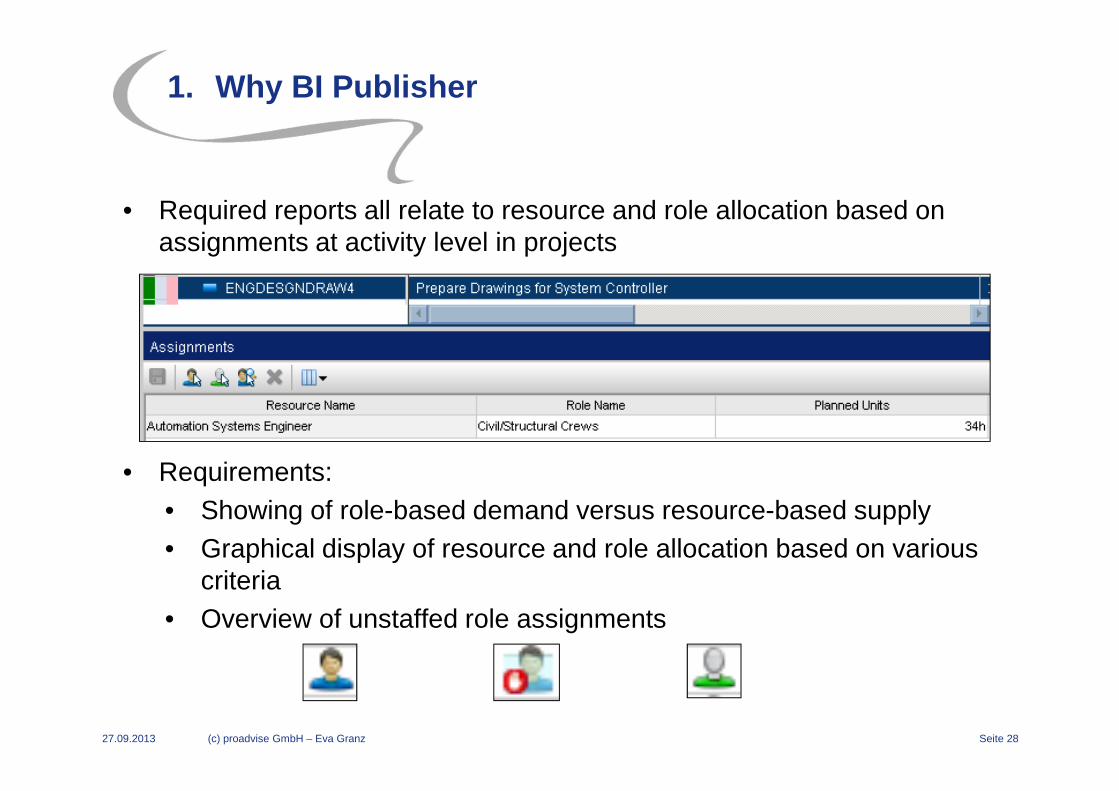
1. Why BI Publisher
• Required reports all relate to resource and role allocation based on assignments at activity level in projects
• Requirements:• Showing of role-based demand versus resource-based supply• Graphical display of resource and role allocation based on various
criteria• Overview of unstaffed role assignments
27.09.2013 (c) proadvise GmbH – Eva Granz Seite 29
2. Created Reports
• General information and requirements:• Data is based on hours to which resources and roles are assigned
to (staffed) or only roles are assigned to (unstaffed)
• Demand = staffed and unstaffed assignments• Supply = staffed assignements and remaining availability of
resources with relevant primary role• Remaining availability = monthly availability – planned assignments
with remaining availabitliy >= 0• Demand is grouped based on various criteria
27.09.2013 (c) proadvise GmbH – Eva Granz Seite 30
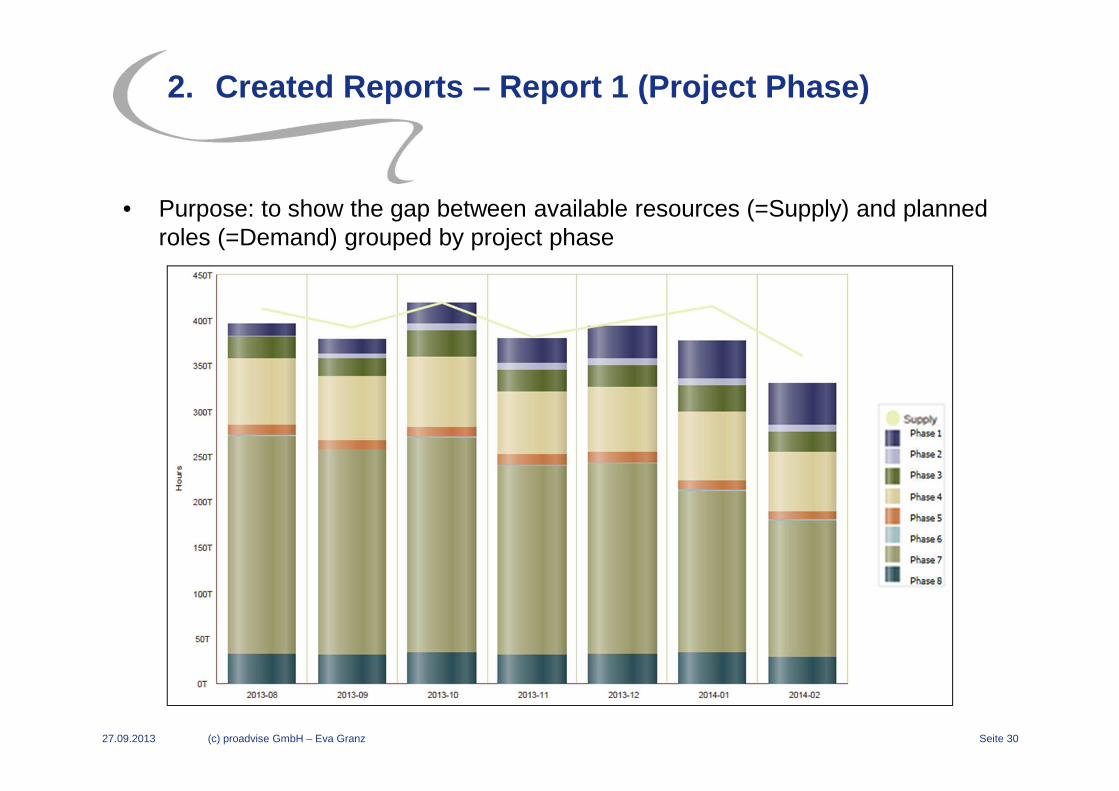
2. Created Reports – Report 1 (Project Phase)
• Purpose: to show the gap between available resources (=Supply) and planned roles (=Demand) grouped by project phase
27.09.2013 (c) proadvise GmbH – Eva Granz Seite 31
2. Created Reports – Report 1 (Project Phase)
• Filter options: Start, End, Role, Role Team, Project Code, 2 Activity Codes, Resource Code, Active Resource Flag
• Output: pdf, ppt 2007, Excel 2007• Set up: Graphic; table; selected parameters
• Note:• Basis for all created reports
27.09.2013 (c) proadvise GmbH – Eva Granz Seite 32
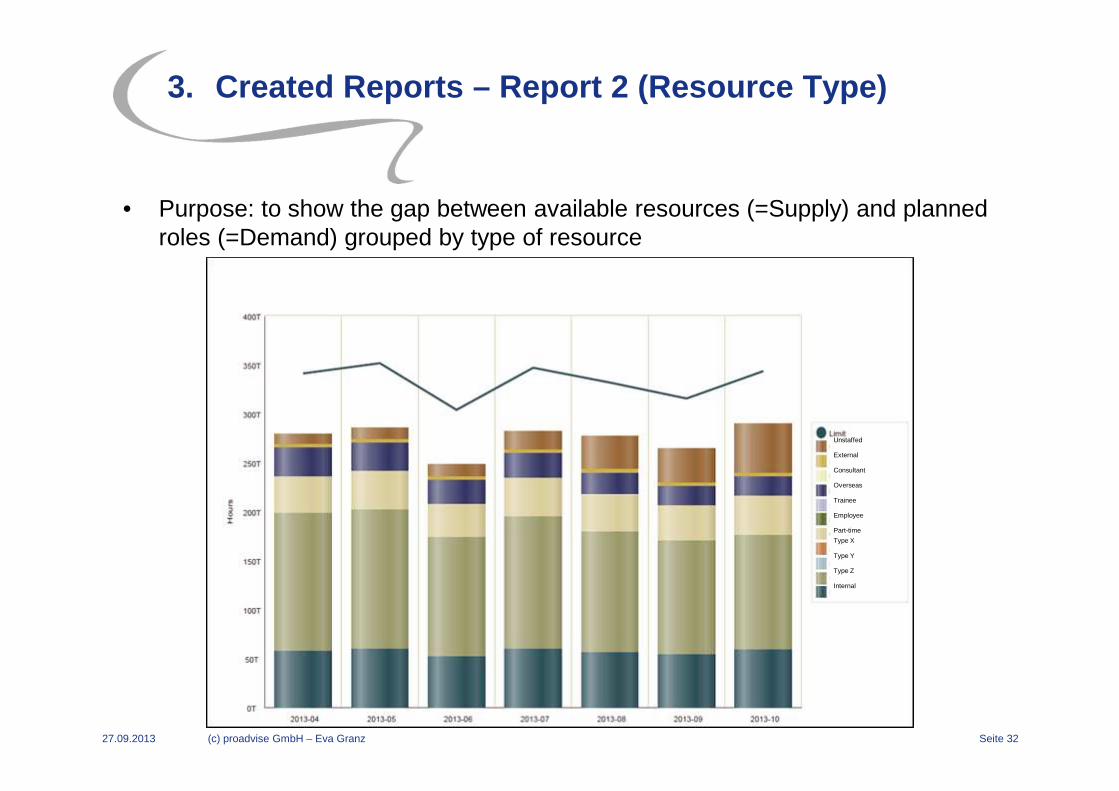
3. Created Reports – Report 2 (Resource Type)
• Purpose: to show the gap between available resources (=Supply) and planned roles (=Demand) grouped by type of resource
Unstaffed
External
Consultant
Overseas
Trainee
Employee
Part-time
Type X
Type Y
Type Z
Internal
27.09.2013 (c) proadvise GmbH – Eva Granz Seite 33
2. Created Reports – Report 2 (Resource Type)
• Filter options: Start, End, Role, Role Team, Project Code, 2 Activity Codes, Resource Code, Active Resource Flag
• Output: pdf, ppt 2007, Excel 2007• Set up: Graphic; table; selected parameters
• Note:• Resource type is combination of 2 resource codes
27.09.2013 (c) proadvise GmbH – Eva Granz Seite 34
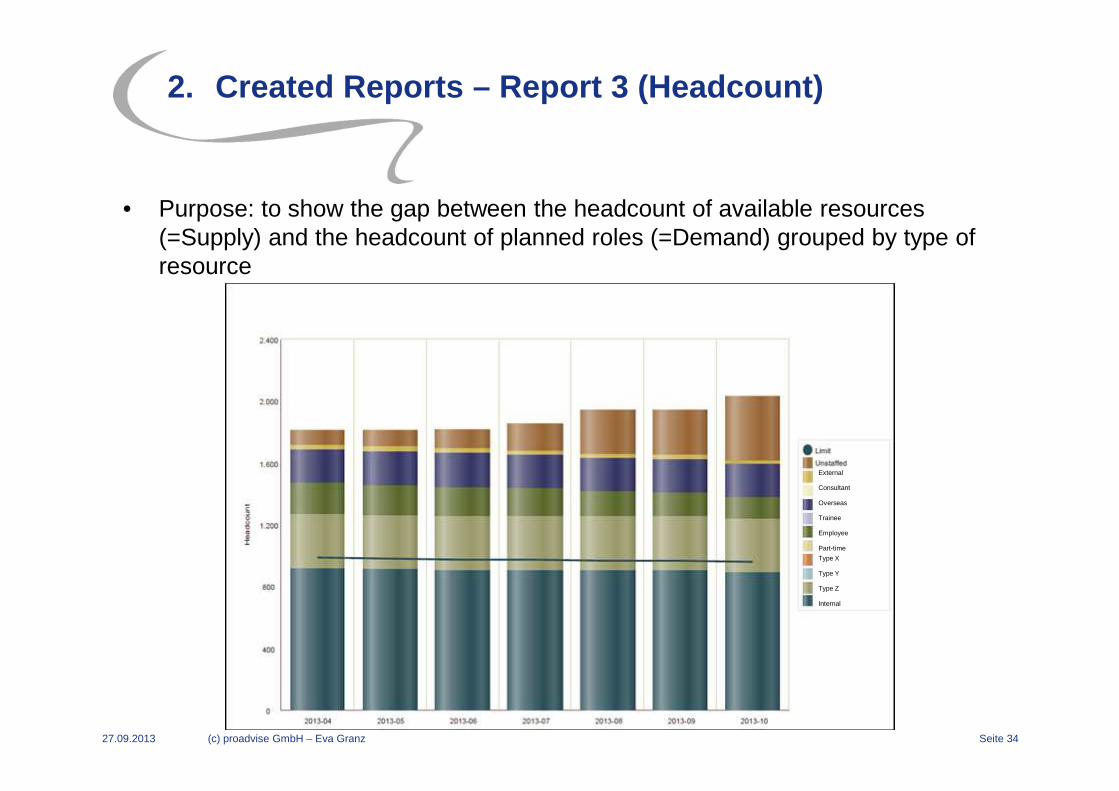
2. Created Reports – Report 3 (Headcount)
• Purpose: to show the gap between the headcount of available resources (=Supply) and the headcount of planned roles (=Demand) grouped by type of resource
External
Consultant
Overseas
Trainee
Employee
Part-time
Type X
Type Y
Type Z
Internal
27.09.2013 (c) proadvise GmbH – Eva Granz Seite 35
2. Created Reports – Report 3 (Headcount)
• Filter options: Start, End, Role, Role Team, Project Code, 2 Activity Codes, Resource Code, Active Resource Flag, My Resources
• Output: pdf, ppt 2007, Excel 2007• Set up: Graphic; table; selected parameters
• Note:• Resource type is combination of 2 resource codes
27.09.2013 (c) proadvise GmbH – Eva Granz Seite 36
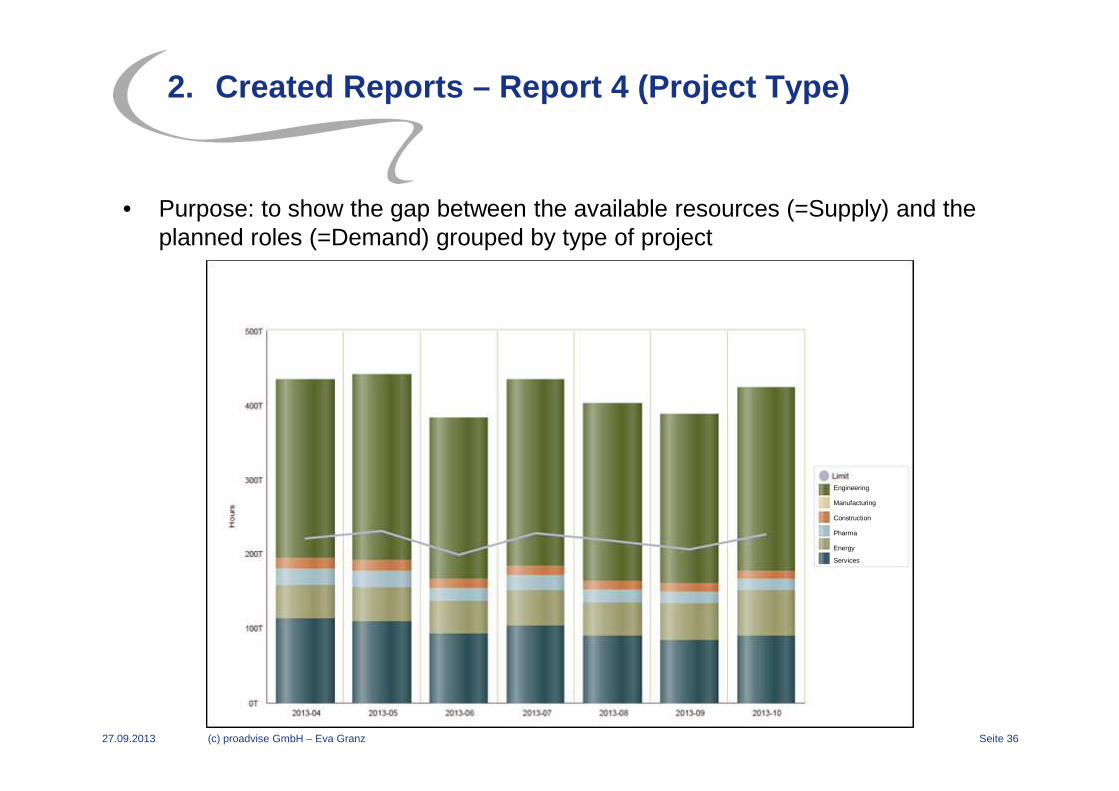
2. Created Reports – Report 4 (Project Type)
• Purpose: to show the gap between the available resources (=Supply) and the planned roles (=Demand) grouped by type of project
Engineering
Manufacturing
Construction
Pharma
Energy
Services
27.09.2013 (c) proadvise GmbH – Eva Granz Seite 37
2. Created Reports – Report 4 (Project Type)
• Filter options: Start, End, Role, Role Team, Project Code, 2 Activity Codes, Resource Code, Active Resource Flag
• Output: pdf, ppt 2007, Excel 2007• Set up: Graphic; table; selected parameters
27.09.2013 (c) proadvise GmbH – Eva Granz Seite 38
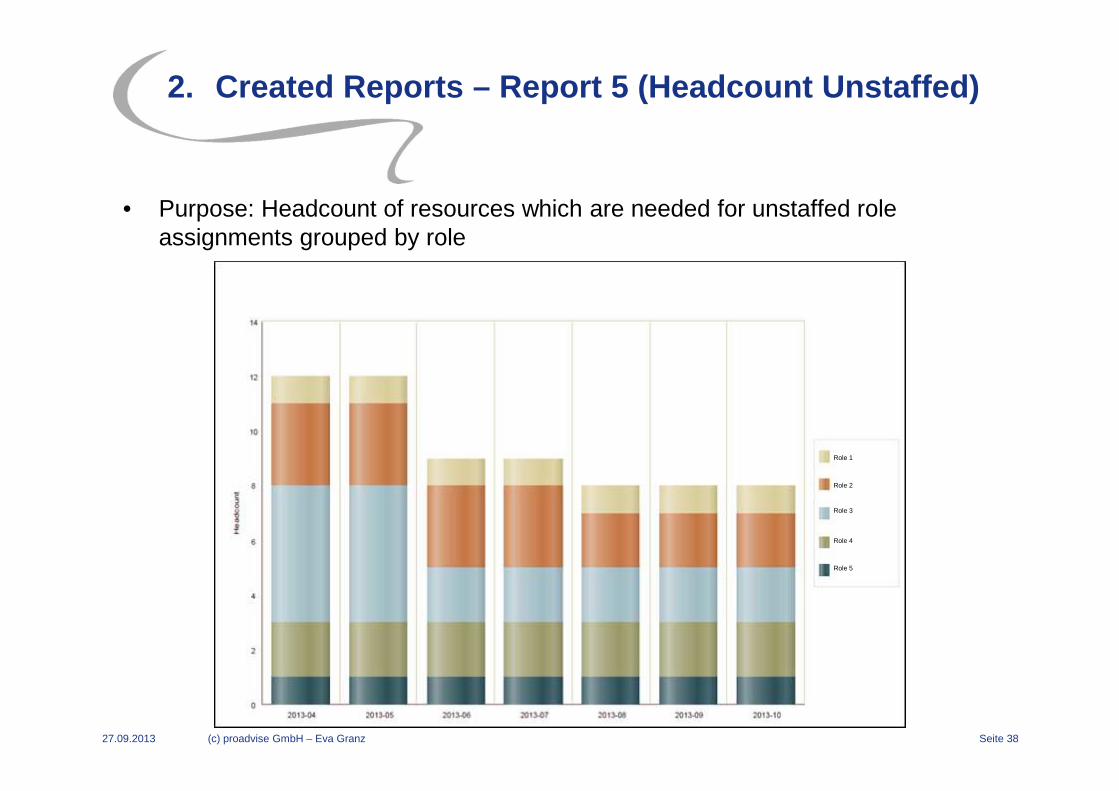
2. Created Reports – Report 5 (Headcount Unstaffed)
• Purpose: Headcount of resources which are needed for unstaffed role assignments grouped by role
Role 1
Role 2
Role 3
Role 4
Role 5
27.09.2013 (c) proadvise GmbH – Eva Granz Seite 39
2. Created Reports – Report 6 Unstaffed Headcount
• Filter options: Start, End, Role, Role Team, Project Code, 2 Activity Codes, Resource Code, Active Resource Flag
• Output: pdf, ppt 2007, Excel 2007• Set up: Graphic; table; selected parameters
• Note:• Various levels in role hierarchy can be selected
27.09.2013 (c) proadvise GmbH – Eva Granz Seite 40
2. Created Reports – Drill Down Reports
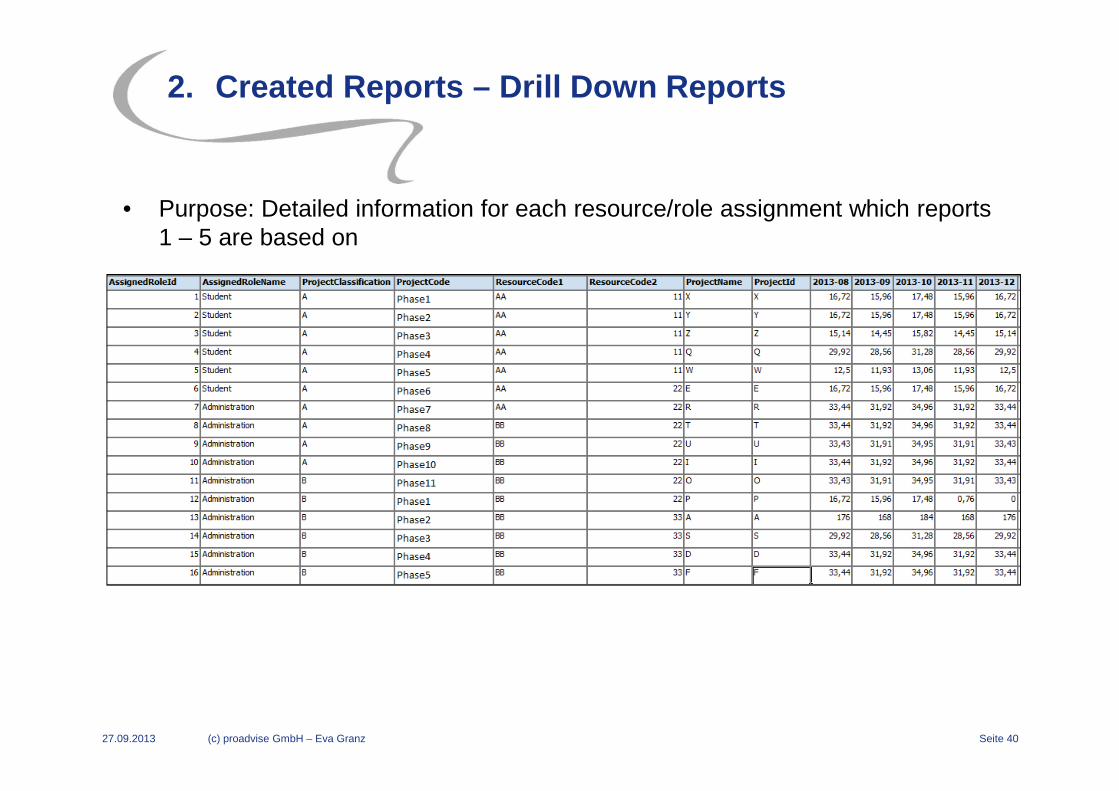
• Purpose: Detailed information for each resource/role assignment which reports 1 – 5 are based on
27.09.2013 (c) proadvise GmbH – Eva Granz Seite 41
2. Created Reports – Drill Down Reports
• Filter options: Start, Project Code, Role, Role Team, 2 Activity Codes, Resource Code, Resource Active Flag
• Output: Excel 2007• Set up: table; selected parameters
• Note:• Drill down reports were created for Reports 1 – 5• Drill Down Staffed Assignments• Drill Down Unstaffed Assignments• Drill Down Remaining Resource Availability
27.09.2013 (c) proadvise GmbH – Eva Granz Seite 42
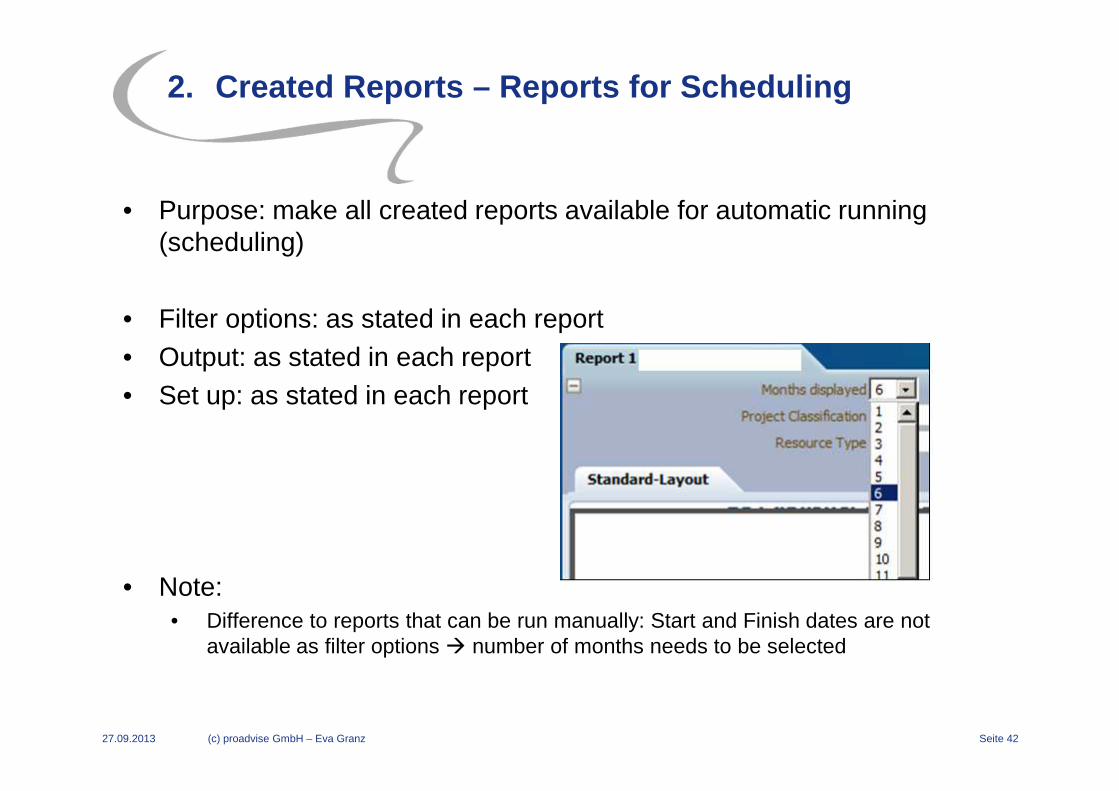
2. Created Reports – Reports for Scheduling
• Purpose: make all created reports available for automatic running(scheduling)
• Filter options: as stated in each report• Output: as stated in each report• Set up: as stated in each report
• Note:• Difference to reports that can be run manually: Start and Finish dates are not
available as filter options � number of months needs to be selected
27.09.2013 (c) proadvise GmbH – Eva Granz Seite 43
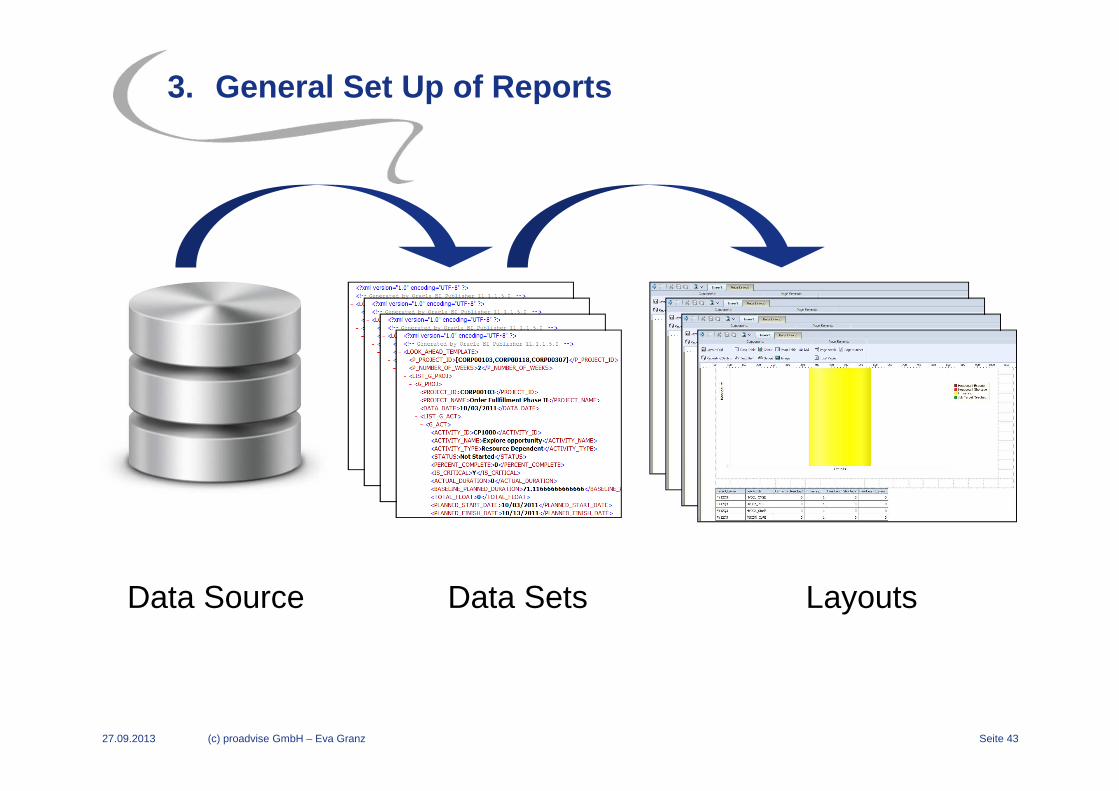
3. General Set Up of Reports
Data Source Data Sets Layouts
27.09.2013 (c) proadvise GmbH – Eva Granz Seite 44
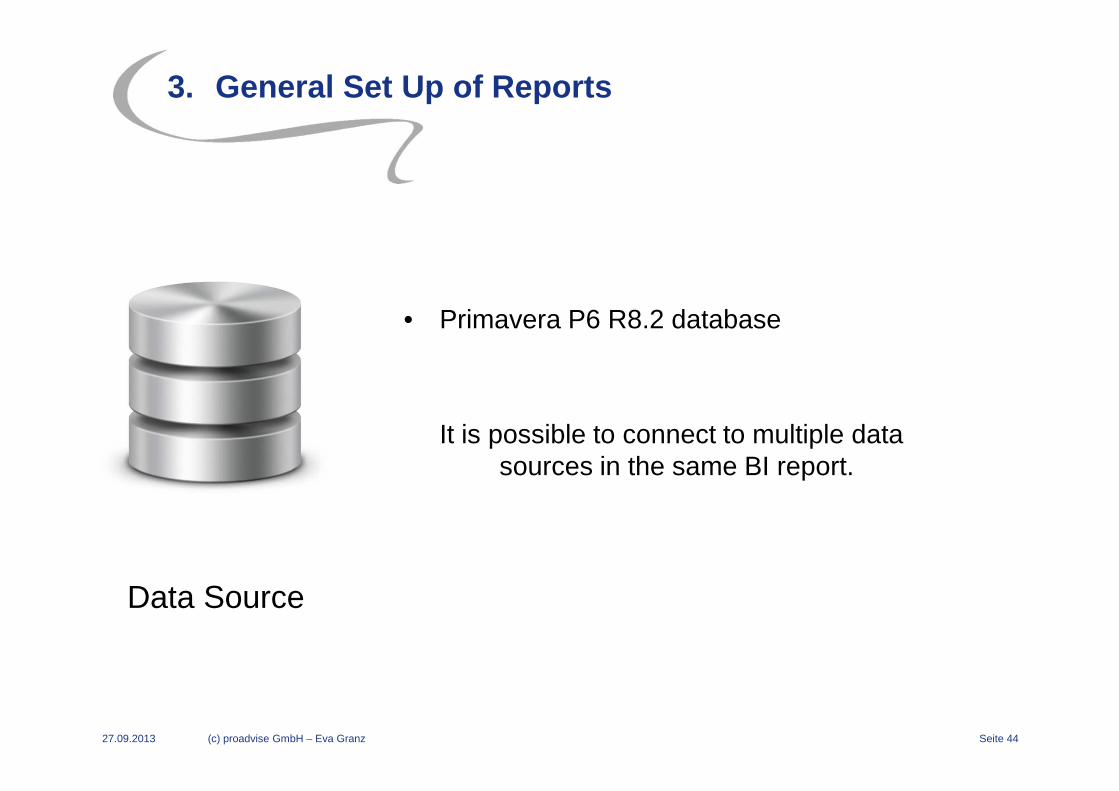
3. General Set Up of Reports
Data Source
• Primavera P6 R8.2 database
It is possible to connect to multiple data sources in the same BI report.
27.09.2013 (c) proadvise GmbH – Eva Granz Seite 45
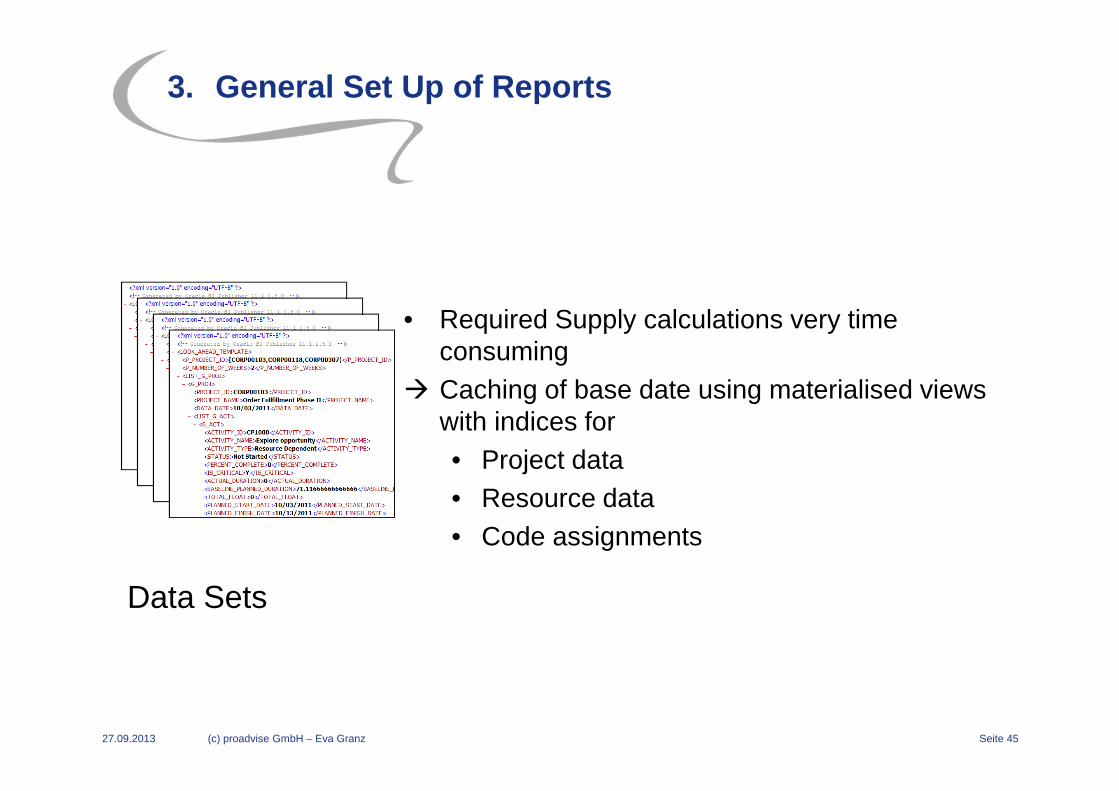
3. General Set Up of Reports
Data Sets
• Required Supply calculations very time consuming
� Caching of base date using materialised views with indices for • Project data• Resource data• Code assignments
27.09.2013 (c) proadvise GmbH – Eva Granz Seite 46
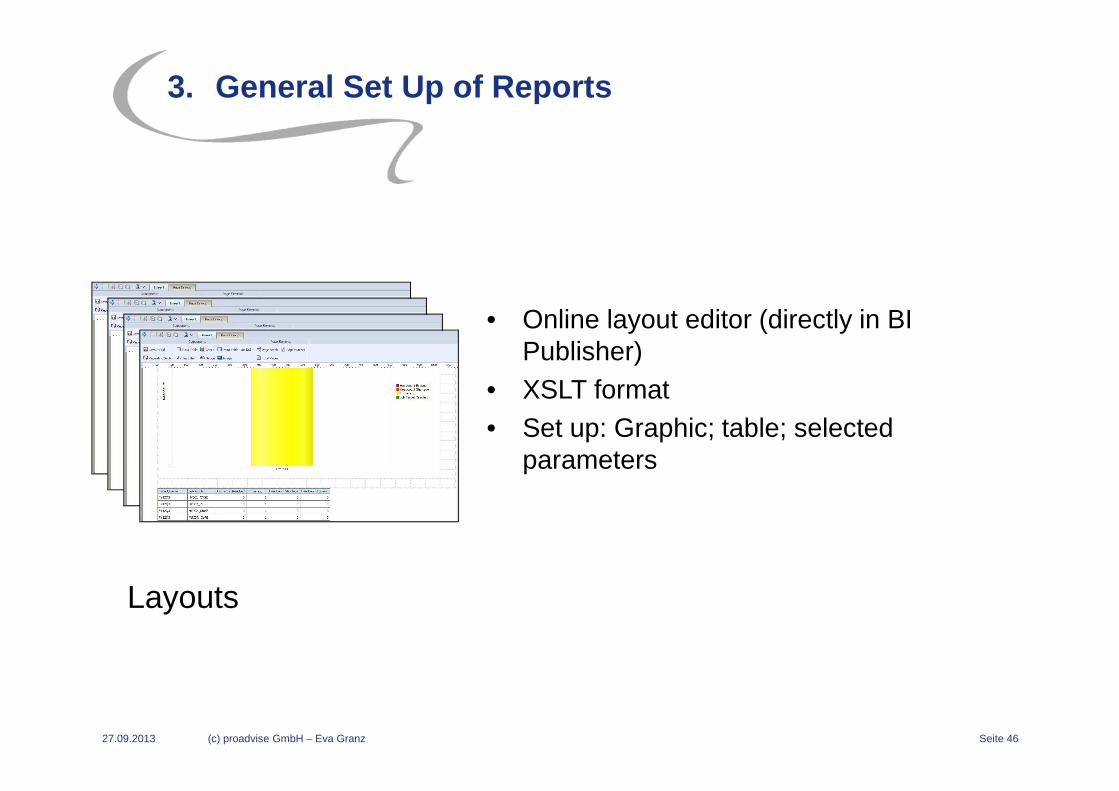
3. General Set Up of Reports
Layouts
• Online layout editor (directly in BI Publisher)
• XSLT format• Set up: Graphic; table; selected
parameters
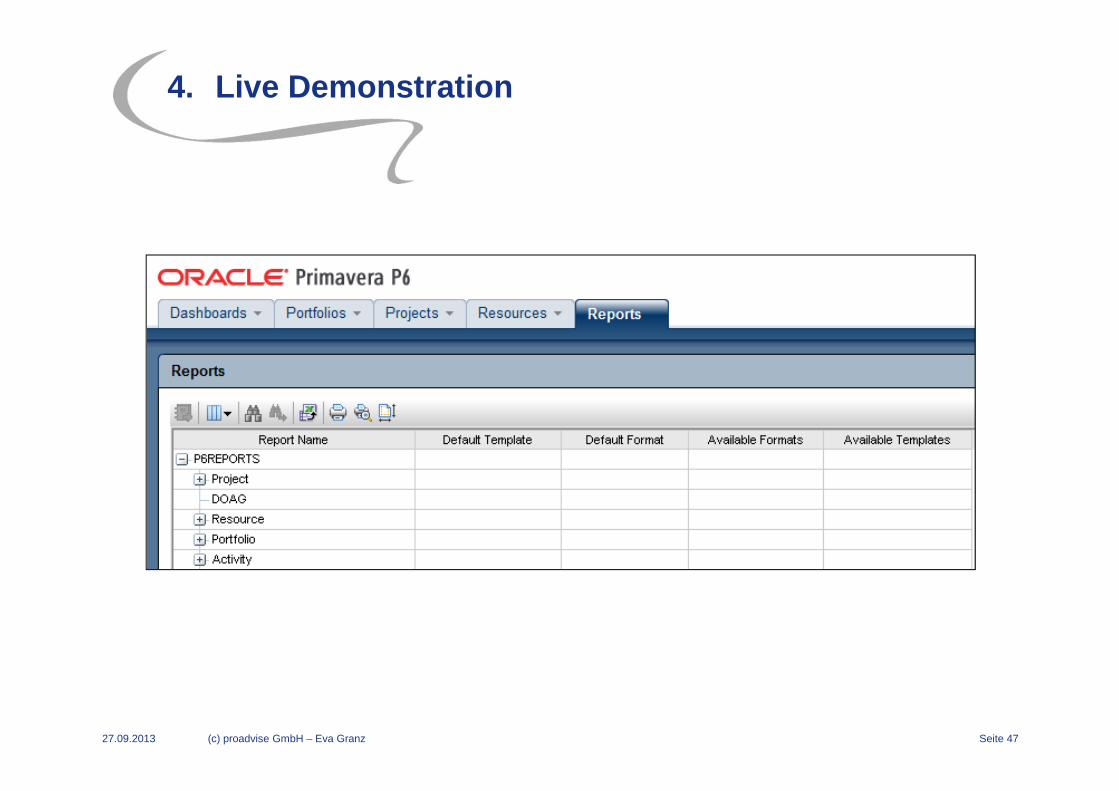
4. Live Demonstration
27.09.2013 (c) proadvise GmbH – Eva Granz Seite 47

Seite 48