Embed Size (px)
Citation preview

BioMed Central
International Journal of Health Geographics
ss
Open AcceEditorialWeb GIS in practice VI: a demo playlist of geo-mashups for public health neogeographersMaged N Kamel Boulos*1, Matthew Scotch2, Kei-Hoi Cheung2,3 and David Burden4Address: 1Faculty of Health and Social Work, University of Plymouth, Drake Circus, Plymouth, Devon, PL4 8AA, UK, 2Center for Medical Informatics, School of Medicine, Yale University, New Haven, CT, USA, 3Departments of Anesthesiology and Genetics, School of Medicine, and Department of Computer Science, Yale University, New Haven, CT, USA and 4Daden Limited, 103 Oxford Rd, Moseley, Birmingham, B13 9SG, UK
Email: Maged N Kamel Boulos* - [email protected]; Matthew Scotch - [email protected]; Kei-Hoi Cheung - [email protected]; David Burden - [email protected]
* Corresponding author
Abstract'Mashup' was originally used to describe the mixing together of musical tracks to create a new pieceof music. The term now refers to Web sites or services that weave data from different sourcesinto a new data source or service. Using a musical metaphor that builds on the origin of the word'mashup', this paper presents a demonstration "playlist" of four geo-mashup vignettes that make useof a range of Web 2.0, Semantic Web, and 3-D Internet methods, with outputs/end-user interfacesspanning the flat Web (two-dimensional – 2-D maps), a three-dimensional – 3-D mirror world(Google Earth) and a 3-D virtual world (Second Life ®). The four geo-mashup "songs" in this"playlist" are: 'Web 2.0 and GIS (Geographic Information Systems) for infectious diseasesurveillance', 'Web 2.0 and GIS for molecular epidemiology', 'Semantic Web for GIS mashup', and'From Yahoo! Pipes to 3-D, avatar-inhabited geo-mashups'. It is hoped that this showcase ofexamples and ideas, and the pointers we are providing to the many online tools that are freelyavailable today for creating, sharing and reusing geo-mashups with minimal or no coding, willultimately spark the imagination of many public health practitioners and stimulate them to startexploring the use of these methods and tools in their day-to-day practice. The paper also discusseshow today's Web is rapidly evolving into a much more intensely immersive, mixed-reality andubiquitous socio-experiential Metaverse that is heavily interconnected through various kinds ofuser-created mashups.
BackgroundGIS (Geographic Information Systems and Science) havealways shared many of the foundational ethea (plural ofethos) of Web 2.0 [1], (even before the latter becameknown as a distinct entity), namely data sharing, remixingand repurposing, and collaboration. GIS enable remixingand repurposing of data by "mashing-up" various data
and map layers or themes from multiple sources into onestudy/map (with multiple layers covering same locationssuperimposed like onion's skin). And now with theadvent of Web 2.0 technologies, the democratization andparticipatory nature of GIS have never been more possibleor powerful. Neogeography and the GeoWeb 2.0 havebeen born and unleashed for use by the masses [2,3]!
Published: 18 July 2008
International Journal of Health Geographics 2008, 7:38 doi:10.1186/1476-072X-7-38
Received: 6 July 2008Accepted: 18 July 2008
This article is available from: http://www.ij-healthgeographics.com/content/7/1/38
© 2008 Boulos et al; licensee BioMed Central Ltd. This is an Open Access article distributed under the terms of the Creative Commons Attribution License (http://creativecommons.org/licenses/by/2.0), which permits unrestricted use, distribution, and reproduction in any medium, provided the original work is properly cited.
Page 1 of 16(page number not for citation purposes)

International Journal of Health Geographics 2008, 7:38 http://www.ij-healthgeographics.com/content/7/1/38
On mashups and their growing popularity and importance'Mashup' was originally used to describe the mixingtogether of musical tracks to create a new piece of music[4]. The term now refers to Web sites or services that weavedata from different sources into a new data source or serv-ice. Mashups are becoming increasingly widespread, espe-cially in the context of combining geographic data anddisplaying such integrated data on maps. Web-basedmapping applications like Google Maps [5] and GoogleEarth [6] allow multiple independently generated datasetsencoded using the Keyhole Markup Language (KML) for-mat to be mixed and displayed via a two-dimensional – 2-D map (or three-dimentional – 3-D globe in the case ofGoogle Earth) [7]. The latest offerings from Google Maps,namely My Maps [8] and Mapplets [9], have made it pos-sible for anyone to create and share their own interactiveonline maps with just a few mouse clicks and no (oralmost no) coding at all! (With Google Mapplets, anyonecan tap into, remix and reuse third-party mini-applica-tions for Google Maps (known as Mapplets) from a rap-idly expanding catalogue maintained by Google, to createand share even more powerful personal maps.)
Many scientists have also utilized these technologies forresearch purposes [10]. For example, Nature has created itsown geo-mashup using Google Earth for tracking avian-flu outbreaks [11], and HealthMap [12], developed by theChildren's Hospital Informatics Program in Boston,brings together disparate data sources within GoogleMaps to achieve a unified and comprehensive view of thecurrent global state of infectious diseases and their effecton human and animal health. This freely available Website integrates outbreak data of varying reliability, rangingfrom news sources (e.g., Google News [13]) to curatedpersonal accounts (e.g., ProMED [14]) to more valid alerts(e.g., World Health Organization [15]). Other publichealth mashup work can be browsed at [16]. These exam-ples represent a class of Web-based neogeography applica-tions that combine the complex techniques ofcartography and Geographic Information Systems (GIS)and place them within reach of users [17]. The benefit ofsuch easy-to-use GIS applications is evident in an increas-ing diversity and quantity of publicly available geocodedhealth data and a growing interest in using GIS and otherWeb-based tools for mashup of public health data.
It is therefore not surprising but rather commendable thatthe UK government has recently launched a data mashupcompetition to find innovative ways of using the massesof data it collects [18]. The government is hoping to findnew uses for public information in the areas of criminaljustice, health and education, and is opening up gigabytesof information for this purpose from a variety of sourceslike mapping information from Britain's Ordnance Sur-vey, medical information from the NHS (National Health
Service), and neighbourhood statistics from the Office forNational Statistics. (None of the data is personal informa-tion.)
How mashups work – the basic principlesOver the last few years, the complexity and magnitude ofresearch data with advances in genomic sequencing andtranslational science have increased the need for complexmashup applications. One possible solution is Web 2.0, aterm that describes the rising global trend in use of WorldWide Web technology and Web design in the past fewyears, and represents applications that aim to enhance cre-ativity, information sharing, and collaboration amongusers. Web 2.0 comprises online services that promoteinteraction between users and cooperative developmentof Web resources [1,19]. These technologies, tools, andsites can be broadly categorized as follows:
• Data formatterThe contents provided by different Web sites are organ-ized and displayed in many different ways. The traditionalapproach to extracting Web content and reformatting it isto write specific screen-scraping programs to extract con-tent from specific sites. This approach is not scalable giventhe high degree of heterogeneity involved. Also, it requiresa significant amount of programming effort. To addressthis, tools such as Dapper [20] provide the user with theability to visually map the Web content to a particularstructure. In addition, these tools allow the extracted con-tent to be output in different formats such as RSS (ReallySimple Syndication – described in [2]). These tools easethe effort of content extraction and formatting over theWeb [21].
• Data connectorTo facilitate mashup of data provided by different sites indifferent formats, tools such as Yahoo! Pipes [22] havebeen developed to allow users to graphically create a Pipeor workflow to connect data including those generated byother tools like Dapper. Such tools can directly accept datain different formats and integrate them. The integrateddata can be formatted in different ways for analysis pur-poses [21].
• Data visualizationOnce multiple datasets are parsed or integrated in a com-mon format, tools are available for visualizing data in anintegrated fashion. For example, Yahoo! Pipes can be usedto integrate and format geo-referenced data into the KMLformat for visualization by Google Maps or Google Earth[23].
• Data sharingOne important aspect of Web 2.0 is data sharing and com-munity collaboration. For example, Dapper and Yahoo!
Page 2 of 16(page number not for citation purposes)

International Journal of Health Geographics 2008, 7:38 http://www.ij-healthgeographics.com/content/7/1/38
Pipes both contain collaboration forums in which userscan view and utilize the work of others. In the context ofGIS, Web 2.0 sites such as GeoCommons [24] allow geo-referenced data (e.g., KML files) to be tagged, shared,reused, and remixed [21].
• Web APIAnother key part of the Web 2.0 trend features the grow-ing use of various Web Application Programming Inter-faces (APIs) for developers to build rich clientapplications that can programmatically access online serv-ices such as Google Maps and GeoCommons. Such WebAPIs allow existing functionalities to be reused. For exam-ple, using the GeoIQ JavaScript API provided by GeoCom-mons [25], one can develop client applications thatinclude content such as heat maps, concentration indices,or intersection indices in custom data [21].
These Web 2.0 technologies, tools, and services, in con-junction with neogeography applications such as GoogleMaps and Google Earth, can support public healthresearch, including infectious disease surveillance andmolecular epidemiology. They reduce the onus of thepublic health expert to write complex programming codeto perform data integration. They also promote data shar-ing and community collaboration. Whether the purposeis to analyze historical trends of data over time or to detectdisease anomalies in real-time, Web 2.0 technology caneasily integrate numerical and spatial data for publichealth decision support.
Using a musical metaphor that builds on the origin of theword 'mashup', this paper will present a demonstration"playlist" of four practical geo-mashup example and ideasets that make use of a range of Web 2.0, Semantic Web,and 3-D Internet methods, with outputs/end-user inter-faces spanning the flat Web (2-D maps), a 3-D mirrorworld (Google Earth) and a 3-D virtual world (SecondLife ®).
A demo "playlist"Mashup song #1: Web 2.0 and GIS for infectious disease surveillanceWeb 2.0 can be utilized along with GIS for infectious dis-ease surveillance. Figure 1 shows a flow diagram for devel-opment of a Web 2.0 mashup application for West NileVirus (WNV) surveillance. The first step involves the use ofDapper [20] to obtain WNV data from the United StatesGeological Survey (USGS) Web site [26]. The data con-tains the number of WNV cases per each state for animals(such as horses and birds), humans, and mosquitoes. Thesecond step involves geo-referencing the data by usingYahoo! Pipes [22] to mashup the WNV case data withGeoCommons [24], a Web 2.0 mapping service.
The ability to mashup and integrate Web-based surveil-lance data lies with the fact that Yahoo! Pipes containsfunctions to retrieve data streams, store them locally as alist, perform iterative loops, string functions, regularexpressions, Web services, and geo-referencing. Figure 2shows the corresponding Yahoo! Pipe for the mashup ofWNV surveillance data.
Finally, a Web 2.0 mashup can support complex calcula-tions that are often required in epidemiology and infec-tious disease surveillance. For example, temperature is asignificant factor in the transmission of many vector-borne diseases. In our West Nile Virus example, highertemperatures enable for the Extrinsic Incubation Period(EIP) to be completed within the mosquito, which indi-cates that the virus reaches infectivity and can be transmit-ted to a susceptible host such as a human, bird, or horse[27]. Scientists need to track temperature data and calcu-late measures such as 'degree days' [28] to determinewhether the temperature supports virus transmission.
Web 2.0 for public health researchFigure 1Web 2.0 for public health research.
Page 3 of 16(page number not for citation purposes)

International Journal of Health Geographics 2008, 7:38 http://www.ij-healthgeographics.com/content/7/1/38
Degree days can be calculated using sine methods [28]and may be too difficult to compute using GIS. Web 2.0supports the integration of Web resources to perform suchcalculations and combine the results with geo-referenceddata for WNV surveillance. Our Yahoo! Pipe (Figure 2)fetches temperature data from the National Climate DataCenter Web site [29]. The output of Yahoo! Pipes can be aKML file for display in Google Earth (Figure 3) or GoogleMaps. In this example, weather stations are shown with '+'to indicate that the 2005 summer temperature in the areasupports the risk of West Nile Virus transmission. Num-bers of positive bird and human WNV cases in 2005 arealso shown.
Mashup song #2: Web 2.0 and GIS for molecular epidemiologyWeb 2.0 can also support the mashup of molecular infor-mation in GIS. For example, phylogenetic analysis
through the use of tree generation software has recentlybeen integrated in Google Earth [30]. The project calledTreeBASE II enables for scientists to analyze genetic dis-tances across different isolates and subtypes, and har-nesses Google Earth to deliver biological informationwith a geographic component [31] (Figure 4).
Another resource for mashup of molecular data is theMesquite Project [32]. The modular system promotes col-laboration among scientists to develop their own pro-grams or modules and then upload the modules for otherprogrammers to utilize and enhance. This mashupapproach enables modules to be attached to other mod-ules for creation of a hybrid module. There is great poten-tial for GIS to be included as a module for Mesquite in asmuch the same way that TreeBase II presents trees withinGIS.
The mashup of WNV surveillance data in Yahoo! PipesFigure 2The mashup of WNV surveillance data in Yahoo! Pipes.
Page 4 of 16(page number not for citation purposes)

International Journal of Health Geographics 2008, 7:38 http://www.ij-healthgeographics.com/content/7/1/38
Since our demo "playlist" was created based on the origi-nal concept of "musical mashup", it is also very possiblefor these separately-composed "songs" to be remixed; forexample, different species of mosquitoes carrying theWNV (see "Mashup song #1" above) can be queriedsemantically (ontologically – see "Mashup song #3"below), studied using the geo-phylogenetic tree ("Mashupsong #2"), and visualized/interacted with in an avatar-inhabited 3-D virtual world environment (see "Mashupsong #4" below).
Mashup song #3: Semantic Web for GIS mashupDespite the emergence of Web 2.0 tools like Yahoo! Pipesand standard geo-data formats like KML, the task of iden-tifying and integrating datasets of interest must be manu-ally done by people. 'Semantic mashup' is a conception inwhich computers help humans discover and integratedata. A semantically-enriched machine readable format isneeded for implementing the vision of semantic mashup.GeoRSS (an extension of RSS) is a step in this direction[2]. While a regular RSS feed is used to describe feeds(channels) of Web content such as news articles, Web con-tent consisting of geographical elements such as latitudesand longitudes can be described using GeoRSS. Like RSSfeeds that are consumed by feed readers and aggregators,GeoRSS feeds are designed to be consumed by geographicsoftware such as map generators.
GeoRSS can be viewed as an application of RDF (ResourceDescription Framework), since RSS 1.0 is a language ofRDF. RDF is part of a broader technology called 'SemanticWeb' [33-35], which is a set of recommendations andspecifications supported by the World Wide Web Consor-tium (W3C) [36]. The Semantic Web emphasizes com-mon formats and languages for semantic interoperability.For example, RDF enables for the integration and combi-nation of data drawn from diverse sources. This is anenhancement from the original Web which emphasizedthe interchange of documents. The Semantic Web alsosupports languages such as SPARQL (a recursive acronymthat stands for SPARQL Protocol and RDF Query Lan-guage), which can be used to express queries acrossdiverse data sources, whether the data are stored nativelyas RDF or viewed as RDF via middleware. SPARQL ismuch suited for recording how Web content relates to realworld objects. This allows a Web reference, such as a per-son, or a machine, to start off in one database, and thenmove through an unending set of databases which areconnected not by wires but by relationships.
The use of ontologies, or formal representations of con-cepts and their relationships, has been a popular methodfor supporting complex knowledge representation in theSemantic Web [34,35]. For example, an expressive ontol-ogy language called the Web Ontology Language (OWL)is now a W3C recommendation [37]. OWL-based ontolo-gies can support sophisticated queries as well as machinereasoning and inferencing. The GeoNames Ontology [38]is an example of geo-ontology available in OWL format. Itis part of GeoNames [39], which is a database integratinggeographical data such as names of places in various lan-guages, elevation, population and other features from var-ious sources. The GeoNames Ontology makes it possibleto add geospatial semantic information to the Web. Theontology distinguishes the 'Concept' from the 'Docu-ment'. For example, the town Embrun in France is associ-ated with two URIs (Uniform Resource Identifiers): [40]and [41]. The first URI [40] identifies the town Embrun inFrance. The second URI [41] is the RDF document withthe information GeoNames has about Embrun. TheGeoNames Web server is configured to redirect requestsfor the first URI to the second URI. The redirection tellsSemantic Web Agents that Embrun is not residing on theGeoNames server but that GeoNames has informationabout it instead.
The elements in the GeoNames ontology are semanticallyinterlinked with each other in the following ways:
• ChildrenThese include countries for a continent, subdivisions, etc.For example, the children of France include Auvergne(province) and Lorraine (administrative region).
GIS display of Web 2.0 mashup for West Nile Virus surveil-lance using Google EarthFigure 3GIS display of Web 2.0 mashup for West Nile Virus surveil-lance using Google Earth.
Page 5 of 16(page number not for citation purposes)

International Journal of Health Geographics 2008, 7:38 http://www.ij-healthgeographics.com/content/7/1/38
• NeighboursThese are neighbouring countries for a given country. Forexample, Switzerland and Germany are neighbours ofFrance.
• Nearby featuresFor example, nearby the Eiffel Tower are Champ de Marsand Trocadéro – Palais de Chaillot.
Given such an expressive geo-ontology, location-basedinferencing may be performed when mashing up geo-datacorresponding to different levels of granularity. For exam-ple, given the parent-child relationship, data correspond-ing to a city can be integrated with the state/province inwhich it is located. In addition to geo-data mashup,semantic mashup can occur between different types ofontologies, including geo-ontologies and bio-ontologies(e.g., Gene Ontology [42] and Sequence Ontology [43]),and others (Figure 5 – [34,35]).
While machine-readable/machine-understandable dataare essential to semantic mashup, most current Web con-
tent is only human readable. To bridge the gap betweenhuman readability and machine readability, RDFa (RDFattributes) [44] has been proposed to incorporate Seman-tic Web methods (RDF) into Web pages (i.e., into HTML– the HyperText Markup Language). RDFa provides a setof HTML attributes to augment visual data with machine-readable contexts. In addition to RDFa, the GRDDL(Gleaning Resource Descriptions from Dialects of Lan-guages) specification [45] introduces markup based onexisting standards for declaring that an XML (eXtensibleMarkup Language) document includes data compatiblewith RDF and for linking to algorithms (typically repre-sented in XSLT – eXtensible Stylesheet Language Transfor-mations [46]).
Mashup song #4: from Yahoo! Pipes to 3-D, avatar-inhabited geo-mashupsLike the first "song" in this "playlist", this "song" alsostarts in Yahoo! Pipes [22]. Yahoo! Pipes offers thousandsof ready and free-to-use Pipes like the 'RSS 2 Geo' Pipe[47], which we were able to use to geo-encode and mapthe 'Latest articles' RSS feed from the International Journal
Geographic visualization of the spread of avian influenza (H5N1) in Google EarthFigure 4Geographic visualization of the spread of avian influenza (H5N1) in Google Earth. Screenshot of the freely available Google Earth file by Daniel Janies and colleagues, which they describe in their paper [31].
Page 6 of 16(page number not for citation purposes)

International Journal of Health Geographics 2008, 7:38 http://www.ij-healthgeographics.com/content/7/1/38
of Health Geographics [48] as shown in Figure 6, withoutdoing any coding or modification to the Pipe or to ourRSS feed. Pipes can also be 'cloned', i.e., imported to one'saccount in Yahoo! Pipes, and then edited or remixed (assub-pipes) in an intuitive, Web-based visual Pipe editor(Figures 2 and 7), to create and publish modified or morecomplex Pipes and mashups [49,50].
We cloned two publicly available, community-user-con-tributed Pipes originally created to map the latest newsstories from Yahoo! and Reuters, with the goal of editingthem to make them more specialized, so that they onlymap the latest health news items from Yahoo! and Reuters.The modified Pipes are available at [51]. They use theGeoNames RSS-to-GeoRSS Web service [39] to add loca-tion information to Yahoo! and Reuters' 'health' RSSnewsfeeds (Figure 7). The results are then displayed usingthe Yahoo! Maps AJAX (Asynchronous JavaScript andXML) API [52], thanks to Yahoo! Pipes' Location Extractormodule [53].
The Location Extractor module processes the GeoRSS out-put from GeoNames to map it in 2-D using Yahoo! Maps.The GeoRSS output from GeoNames is a URI [54], as canbe seen in Figure 7. This URI can also be used outsideYahoo! Pipes, e.g., to map the GeoRSS feed on GoogleMaps instead of Yahoo! Maps [55], so we thought of feed-ing it into a "port" (by Daden Ltd [56]) of Google Maps inthe 3-D virtual world of Second Life (SL) [57]. Figure 8shows how the final output looks in Second Life. The
remaining part of this geo-mashup "song" will providesome details about Daden's "port" of Google Maps intoSecond Life.
In March 2008, Linden Lab released a new version of Sec-ond Life, which for the first time let users display a Webpage on the side of an object (or 'prim' as it is called in SL)within the world [58]. This was done using the samemedia channel that SL currently uses to display imagesand videos, and so was still restricted to one "page" perparcel, but it was at least a step forward. (A 'parcel' hererefers to a circumscribed plot of virtual land in SL, with itsown owner-customisable characteristics and settings.)However, the implementation does have two significantdrawbacks:
• The page is not interactive, i.e., you cannot click on linksin it; and
• You cannot scroll down or across the page.
Given our earlier work with maps in SL [2], we were inter-ested to see how effective this new feature would be withGoogle Maps. Placing the URI of any Web page showingGoogle Maps rendered well within Second Life, but onecould not zoom or pan on the map since the page was notinteractive.
In order to achieve this interactivity we built a small 'con-troller' within Second Life, and a simple Google Mapspage generator on the Web. When first touched the con-troller sets the parcel URI to the URI of the page generator.The page generator, (effectively being called by SL to pro-duce a Web page), generates a plain Web page consistingof a default whole-Earth map, and this is then rendered bythe new SL Web page functionality on an object (a 10 m ×10 m square prim was used initially, but we also success-fully used a 20 m diameter mega-prim). The controllersets variables for a default latitude/longitude of 0 degrees,and a default zoom of 15 (the further out that GoogleMaps goes). If the user then presses the 'zoom in' buttonon the controller (not on the Google Map), then the con-troller changes the CGI (Common Gateway Interface)parameter list on the URI to the new zoom value, whichthe generator script then uses with the Google Maps APIto create a new zoomed-in page. In this way, all the stand-ard Google Maps functionality of zoom in/out, pan andeven 'Map', 'Satellite' and 'Hybrid' overlays was imple-mented in-world (Figure 9), with the controller trackingthe state of the parameters and then sending them as CGIparameters to the page generator to create the relevantpage.
The next challenge was how to represent data on GoogleMaps. Using our Newsglobe application [2], we could eas-
Geo-ontology-aided semantic search of Web resources (Kamel Boulos, 2002)Figure 5Geo-ontology-aided semantic search of Web resources (Kamel Boulos, 2002). Metadata alone are not enough for successful retrieval of the Web resource/page shown in this figure. In this example, even though the resource and its metadata do not mention 'exposure risk to Borrelia Burgdorferi in north-eastern United States', a multiple ontology (geo-ontology and disease ontology)-assisted search for 'exposure risk to Borrelia Burgdorferi in north-east-ern United States' would be able to find the resource [34].
Page 7 of 16(page number not for citation purposes)

International Journal of Health Geographics 2008, 7:38 http://www.ij-healthgeographics.com/content/7/1/38
ily produce Google Maps with geocoded RSS or KML dataoverlaid as markers using the Google Maps API. However,although we could bring the map with markers image intoSL using the process above, we could not then click on themarkers to interrogate them (e.g., link out to the relevantnews story or data reading). The solution was to bring thedata itself into SL alongside the map (in a similar way toour Los Angeles aircraft visualisation described in [2]).Now, when a map with data is requested, the controllerand page generator create the map in the standard way –with or without markers – but the controller also directlyrequests the data feed via a Web proxy which captures
(and if necessary geocodes) the data from the RSS/KMLfeed and then passes them back into SL in a simple textformat. The controller then uses these data to rez (SL termfor 'resolve') a Second Life object (e.g., a map pin) at eachlocation, and with each map pin hyperlinked back to theWeb page containing the relevant item/story. If the userthen zooms or pans the map, the controller de-rezzes thepins and then re-rezzes them in their new spatial positionto reflect the zoom/pan, without having to re-request thedata. A bounding box is applied to ensure that markers arenot plotted well beyond the map. Given the 2048-bytelimit on data coming in to SL, we typically also restrict the
Mapping the 'Latest articles' RSS feed from the International Journal of Health Geographics using the 'RSS 2 Geo' PipeFigure 6Mapping the 'Latest articles' RSS feed from the International Journal of Health Geographics using the 'RSS 2 Geo' Pipe. The screenshot shows one of the articles published by the International Journal of Health Geographics in June 2008 correctly mapped to Indonesia, the country name that appears in the article's title.
Page 8 of 16(page number not for citation purposes)
International Journal of Health Geographics 2008, 7:38 http://www.ij-healthgeographics.com/content/7/1/38
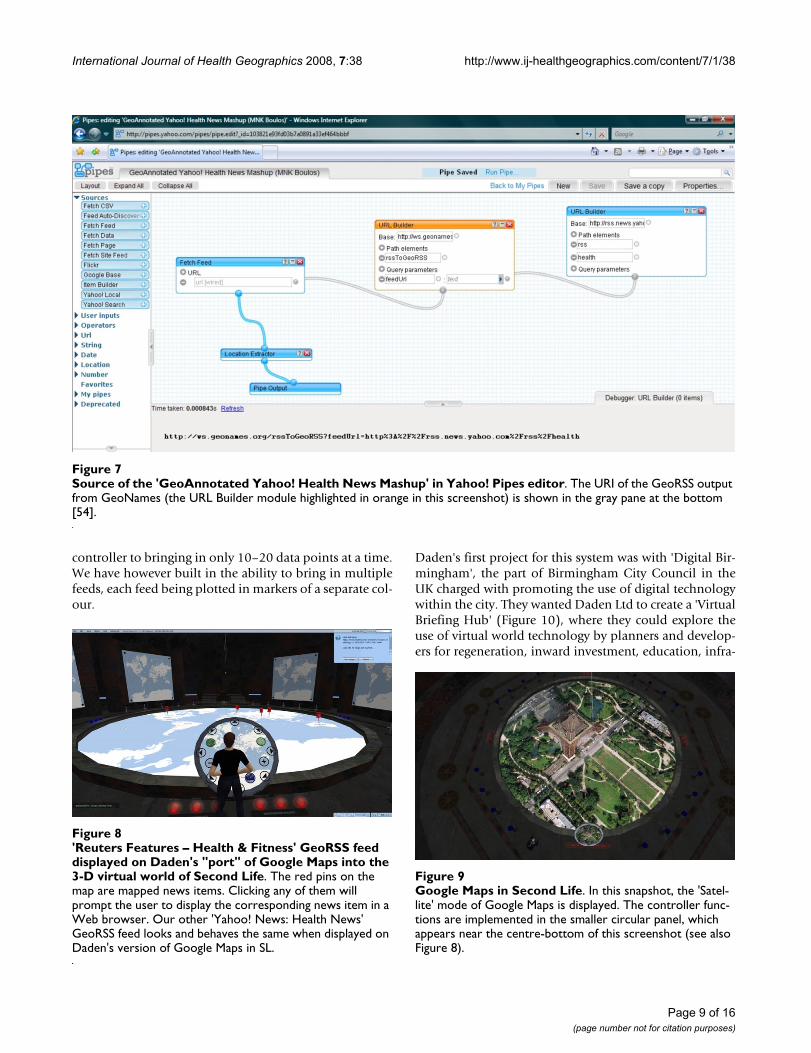
controller to bringing in only 10–20 data points at a time.We have however built in the ability to bring in multiplefeeds, each feed being plotted in markers of a separate col-our.
Daden's first project for this system was with 'Digital Bir-mingham', the part of Birmingham City Council in theUK charged with promoting the use of digital technologywithin the city. They wanted Daden Ltd to create a 'VirtualBriefing Hub' (Figure 10), where they could explore theuse of virtual world technology by planners and develop-ers for regeneration, inward investment, education, infra-
Source of the 'GeoAnnotated Yahoo! Health News Mashup' in Yahoo! Pipes editorFigure 7Source of the 'GeoAnnotated Yahoo! Health News Mashup' in Yahoo! Pipes editor. The URI of the GeoRSS output from GeoNames (the URL Builder module highlighted in orange in this screenshot) is shown in the gray pane at the bottom [54].
'Reuters Features – Health & Fitness' GeoRSS feed displayed on Daden's "port" of Google Maps into the 3-D virtual world of Second LifeFigure 8'Reuters Features – Health & Fitness' GeoRSS feed displayed on Daden's "port" of Google Maps into the 3-D virtual world of Second Life. The red pins on the map are mapped news items. Clicking any of them will prompt the user to display the corresponding news item in a Web browser. Our other 'Yahoo! News: Health News' GeoRSS feed looks and behaves the same when displayed on Daden's version of Google Maps in SL.
Google Maps in Second LifeFigure 9Google Maps in Second Life. In this snapshot, the 'Satel-lite' mode of Google Maps is displayed. The controller func-tions are implemented in the smaller circular panel, which appears near the centre-bottom of this screenshot (see also Figure 8).
Page 9 of 16(page number not for citation purposes)

International Journal of Health Geographics 2008, 7:38 http://www.ij-healthgeographics.com/content/7/1/38
structure management, health and other fields. Using theabove-mentioned Google Maps system in SL, it was rela-tively easy to zoom in on the city, augment the view with2-D photos brought in by the Flickr API [59], news storiesand Web sites from geocoded RSS feeds, and even somebespoke 360 degree panoramas keyed to particular loca-tions on the map (Figure 11).
However, Daden also wanted to give a sense of the city in3-D. They used two techniques to achieve this:
• For landmark buildings in the city (e.g., the BT Tower,Selfridges, Radisson SAS Hotel, Mailbox, MillenniumPoint) they created small scale models of each buildingand placed them on the right point of the map whenzoomed in the central city area (Figure 10). The buildingsmatch in horizontal and vertical scale at this zoom, butare disabled at other zooms.
• For the rest of the city they took the map image and usedan image editor to make all the road and open spacestransparent. They then mapped this image onto a trans-parent object of the same size as the map in Second Life.They then stacked 5–7 layers of this on top of the map.The result was a pseudo-3-D effect, where the buildingsshow as if rising above the main map, but the open spacesare left at "ground" level (Figure 10).
For us this is just an initial step towards better 3-D map-ping in Second Life – and better Web integration. OnceLinden Lab release a full Web browser in Second Life(probably in 2009) then Daden's current approach willnot necessarily be needed, although it does create a 3-Drepresentation of the markers (pins), which no browser-only solution can easily achieve. It also certainly will notcreate the 3-D building models (without proper in-worldsupport of specialist Web-browser plug-ins), so we thinkDaden's system will have significant longevity. Particularareas for enhancement, which Daden might wish to workon, include:
• Moving and scaling the 3-D objects as one zooms;
• Creating a separate and unique 3-D "layer" for eachheight "slice" within the city, enabling a truer representa-tion of the city height profile to be obtained; and
• Importing Google Earth COLLADA models [60] for theindividual 3-D buildings (COLLADA stands for COLLAb-orative Design Activity, an interchange file format forinteractive 3-D applications).
DiscussionOther toolsIn addition to the above-mentioned tools like Yahoo!Pipes [22] and Google Mapplets [9], which can be usedfor creating and publishing geo-mashups with little or nocoding at all, there exist other equally effective ones worthexploring by interested readers to find out which tool (orcombination of tools – or "instruments", to keep themusical metaphor going) works best for them and betterserves their particular settings and purposes. For example,Google is now also providing Google Mashup Editor [61],an AJAX development framework and a set of tools thatenable developers to quickly and easily create simple Webapplications and mashups with Google services like
Google Maps in Second LifeFigure 10Google Maps in Second Life. The co-presence power of a 3-D virtual world: Besides feeling immersed in the data, the two humans/avatars in this snapshot can easily become aware of, and appreciate the presence of one another, get some sense of what the other can and cannot see, interact/chat while looking at the objects together, and even collaborate on modifying them and see the changes made by each other in real time.
Google Maps in Second LifeFigure 11Google Maps in Second Life. Snapshot showing bespoke 360 degree panoramas keyed to particular locations on the map for an added sense of realism, immersiveness and of 'being there'.
Page 10 of 16(page number not for citation purposes)

International Journal of Health Geographics 2008, 7:38 http://www.ij-healthgeographics.com/content/7/1/38
Google Maps. Similarly, Microsoft has an interestingoffering related to Yahoo! Pipes, which they call MicrosoftPopfly [62,63].
Popfly allows users to create and publish Web pages, pro-gram snippets, and mashups using the Microsoft Silver-light rich Internet applications (RIAs) runtime [64,65]along with many pre-built 'Blocks' and data sources/serv-ices contributed by Microsoft and the user community,including a Virtual Earth Block for map display based onMicrosoft Virtual Earth [66,67]. Blocks can be configuredand visually linked to other Blocks in Popfly's intuitiveWeb-based editor, much like the visual "plumbing" inYahoo! Pipes (Figure 12 – [68]). User-friendly errornotices are given to users when incompatible data arepassed between Blocks. There is also an advanced view forBlocks, which allows users to modify the underlying code
in JavaScript, if they wish. Silverlight has been ported toWindows Mobile, and Nokia are to support it across arange of devices. Also, in a rare move, Microsoftannounced Silverlight for Linux [69]. Adobe on the otherhand is pushing its cross-platform AIR (Adobe IntegratedRuntime) environment [70], which uses Adobe Flash,Adobe Flex, HTML, and AJAX to build RIAs.
What's next: beyond Web 2.0 and the Semantic Web and towards the 3-D Internet and the ultimate MetaverseThe 'Google Maps/Earth in SL' tool described in "Mashupsong #4" above, with its ability to visualize GeoRSS newsand data feeds in the 3-D virtual world, is perhaps the firstrealization of the futuristic vision described by WadeRoush in [71]. However, Google Earth (the 3-D mirrorworld application) remains, to this date, far more power-ful than its "port" in Second Life, like many other special-
The visual editor of Microsoft Popfly (using Microsoft Silverlight)Figure 12The visual editor of Microsoft Popfly (using Microsoft Silverlight). This screenshot shows a very basic geo-mashup example using only two connected Blocks, Flickr [59] and Microsoft Virtual Earth, to search for and map geo-tagged Flickr images that match a given keyword. The output of this geo-mashup can be seen at [68].
Page 11 of 16(page number not for citation purposes)

International Journal of Health Geographics 2008, 7:38 http://www.ij-healthgeographics.com/content/7/1/38
ist data visualization tools, a fact echoed in a recentdiscussion of the topic by Paul Bourke [72]. For example,Google Earth has COLLADA support but not SL [2,60].But despite this, there continues to be something very spe-cial or "magical" about the current avatar-inhabitedGoogle Maps/Earth SL version by Daden (even with themedium's many current limitations)!
Miklos Sarvary, Director of the Centre for Learning Inno-vation at INSEAD, has drawn parallels between the lifecycle of broadcasting and the Internet [73]: just as radiogave way to the more immersive experience of TV, today'sflat Web sites will morph into more interactive, immersivemulti-user experiences in which users can see and interactwith each other in much more natural ways.
It is predicted that, within 5 to 7 years, the dominantInternet interface is likely to be the 3-D 'Metaverse', a new3-D Web that will gradually "absorb", and seamlesslyintegrate with (not fully replace), today's World WideWeb and its applications like Google Earth [2,74].(Today's 3-D virtual worlds are still rather early-stage tech-nology and are yet to mature in order to fully realize thisvision of a new 3-D Web.)
Today's flat Web allows us to call up "flat" information; a3-D virtual environment allows us to more naturally expe-rience and visualize this information in real-time withothers, and also to appreciate their presence around us.Virtual worlds are such an appealing concept to users pri-marily because of the social 'co-presence' of others inthese worlds in a very realistic manner (Figure 10).
When people are browsing the flat Web shop of Ama-zon.com, for example, they cannot see, chat with, andbenefit from the experiences/opinions of, other peoplelooking for the same items in real time, as they would doin a supermarket's aisle in the physical world. But with 3-D virtual worlds this is very possible.
Although there are some very early flat Web co-browsingsolutions under development like Weblin ([75] – flatinterface) and YOOWALK ([76] – two-and-a-half dimen-sional – 2.5-D interface) that have attempted to bridgethis gap, they are not without their limitations, and it isexpected that they will only achieve their full potentialwithin 3-D online social/virtual worlds or the Metaverseover the coming few years. But this can only happen afterthe full 'HTML-on-a-prim' roadmap and vision [58], andmany other currently missing or seriously lacking key fea-tures and qualities (e.g., better usability, scalability andcross-world interoperability) are properly developed andfully realized in these 3-D worlds.
In their introductory description of their MPK20 3-D Vir-tual Workplace [77], Sun Microsystems wrote under a par-agraph entitled 'Why 3-D for Collaboration' at [78]: "Onequestion we are frequently asked is why use 3-D for a collabo-ration environment? While it might be possible to build a 2-Dtool with functionality similar to MPK20, the spatial layout ofthe 3-D world coupled with the immersive audio providesstrong cognitive cues that enhance collaboration. (...) In termsof data sharing, looking at objects together is a natural activity.With the 3-D spatial cues, each person can get an immediatesense of what the other collaborators can and cannot see". (Forother compelling arguments about the value of data visu-alization and collaboration in 3-D virtual worlds, pleasesee [2,79,80].)
Humans are spatial beings by nature, inhabiting feature-rich 3-D analogue spaces, so a 3-D synthetic space shouldnot be more cognitively demanding from a human-com-puter interface viewpoint compared to conventional flatinterfaces, if it is properly designed with usability in mind.In fact, it could even make some presentations that areoverly complex in 2-D version much less complicated tounderstand when ported to a more native 3-D environ-ment.
Andrew Hudson-Smith and his team at the Centre forAdvanced Spatial Analysis (CASA), University CollegeLondon, have an extensive portfolio of GIS-relatedprojects in Second Life, including: (i) Virtual London, (ii)a new approach to importing geographic terrains into Sec-ond Life as tabletops, and (iii) an Arc (ESRI) to SecondLife project. In their popular 'Digital Urban' blog wherethese projects are described in detail [81], they frequentlyrefer to Google Earth and Second Life as 'Three Dimen-sional Collaborative (Multi-User) Geographic Informa-tion Systems'. Second Life and Google Earth (and therelated platforms that will definitely follow in the nearfuture, as 3-D mirror and virtual worlds merge [2]) areindeed promising environments for public participationand collaboration type outreach activities, providing agood basis for a 'layered 3-D Wikipedia of the planet thatanyone can edit and add to' or what can be referred to as'The People's Atlas'. (Participatory GIS (PGIS) or PublicParticipation GIS (PPGIS) are terms that have been coinedto express the adoption of GIS to broaden public involve-ment in policymaking, and thus empower local commu-nities, especially the less privileged groups in society, whoare often ignored in traditional government-oriented andrun GIS applications.)
The 3-D Internet is also rapidly becoming a strategic Euro-pean Commission (EC) research direction, with, forexample, the recent establishment of three WorkingGroups (WGs) within a User Centric Media (UCM) clusterof 15 ongoing EC-funded projects in the area of Net-
Page 12 of 16(page number not for citation purposes)
International Journal of Health Geographics 2008, 7:38 http://www.ij-healthgeographics.com/content/7/1/38
worked Media Systems: the Personalized & CreativeMedia WG, the 3D & Immersive Media WG, and theFuture Media Internet WG [82].
However, we do appreciate that, for some (especially inthe corporate domain), the public nature of a world likeSecond Life may be a barrier to adoption; despite the pro-tection that one can put in place, the core data still goesthrough a third party server. However, IBM and LindenLab are currently closely working on suitable solutions forthis [83]. Moreover, recent months have seen significantdevelopments in the OpenSim/Open Source SL-"compat-ible" platform and grids [84]. OpenSim lets users buildworlds (and visualizations) on their own PC (PersonalComputer) and servers, opened up only to the peoplethey want and allow to access their worlds. In fact, one cannow develop one's own spaces offline, publish them onany suitable offline digital storage medium, or host one'sown live region/server on the Internet. These Open Sourcedevelopments, coupled with recent work on an emerging'MPEG-V for Virtual Worlds' ISO standard [85], can onlylead to wider penetration of 3-D virtual worlds amongonline users and speed-up the development of interoper-ability specifications and protocols between these worlds[86].
Google's recent entry into the 3-D virtual worlds market-place [87], as well as the availability of 3-D virtual worldslike Second Life on 3G (third generation) and WiFi ena-bled mobile phones and other small mobile devices,which is a reality today, thanks to an amazing and verywell executed technology from Israel-based Vollee Ltd[88-90], and the novel and more natural 3-D world navi-gation devices and modalities that are emerging thesedays [91,92], will also serve to further expedite the masspenetration of 3-D virtual worlds among Internet usersand the development of the next-generation 3-D Internetor Metaverse.
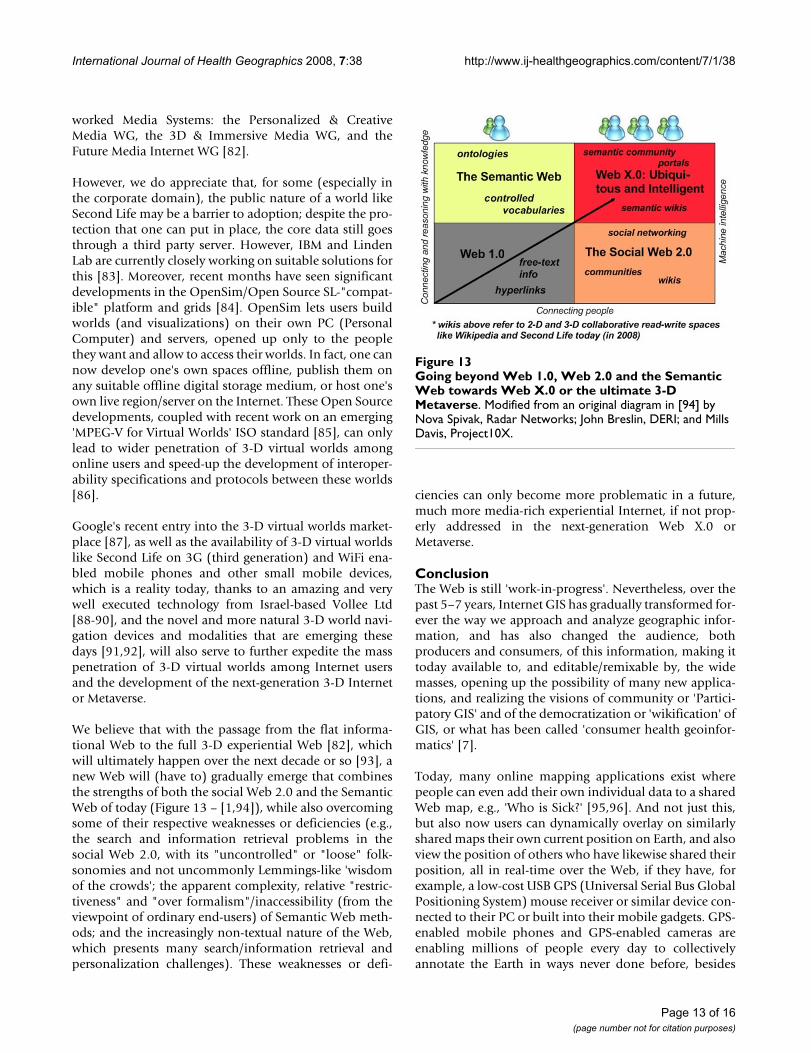
We believe that with the passage from the flat informa-tional Web to the full 3-D experiential Web [82], whichwill ultimately happen over the next decade or so [93], anew Web will (have to) gradually emerge that combinesthe strengths of both the social Web 2.0 and the SemanticWeb of today (Figure 13 – [1,94]), while also overcomingsome of their respective weaknesses or deficiencies (e.g.,the search and information retrieval problems in thesocial Web 2.0, with its "uncontrolled" or "loose" folk-sonomies and not uncommonly Lemmings-like 'wisdomof the crowds'; the apparent complexity, relative "restric-tiveness" and "over formalism"/inaccessibility (from theviewpoint of ordinary end-users) of Semantic Web meth-ods; and the increasingly non-textual nature of the Web,which presents many search/information retrieval andpersonalization challenges). These weaknesses or defi-
ciencies can only become more problematic in a future,much more media-rich experiential Internet, if not prop-erly addressed in the next-generation Web X.0 orMetaverse.
ConclusionThe Web is still 'work-in-progress'. Nevertheless, over thepast 5–7 years, Internet GIS has gradually transformed for-ever the way we approach and analyze geographic infor-mation, and has also changed the audience, bothproducers and consumers, of this information, making ittoday available to, and editable/remixable by, the widemasses, opening up the possibility of many new applica-tions, and realizing the visions of community or 'Partici-patory GIS' and of the democratization or 'wikification' ofGIS, or what has been called 'consumer health geoinfor-matics' [7].
Today, many online mapping applications exist wherepeople can even add their own individual data to a sharedWeb map, e.g., 'Who is Sick?' [95,96]. And not just this,but also now users can dynamically overlay on similarlyshared maps their own current position on Earth, and alsoview the position of others who have likewise shared theirposition, all in real-time over the Web, if they have, forexample, a low-cost USB GPS (Universal Serial Bus GlobalPositioning System) mouse receiver or similar device con-nected to their PC or built into their mobile gadgets. GPS-enabled mobile phones and GPS-enabled cameras areenabling millions of people every day to collectivelyannotate the Earth in ways never done before, besides
Going beyond Web 1.0, Web 2.0 and the Semantic Web towards Web X.0 or the ultimate 3-D MetaverseFigure 13Going beyond Web 1.0, Web 2.0 and the Semantic Web towards Web X.0 or the ultimate 3-D Metaverse. Modified from an original diagram in [94] by Nova Spivak, Radar Networks; John Breslin, DERI; and Mills Davis, Project10X.
Page 13 of 16(page number not for citation purposes)

International Journal of Health Geographics 2008, 7:38 http://www.ij-healthgeographics.com/content/7/1/38
opening up many mobile location-based service possibil-ities and opportunities.
All of this is now possible and accessible like never before,thanks to the latest breed of 'neogeography' and 'GeoWeb2.0' technologies and online services like Google Earth (a3-D mirror world) and Yahoo! Pipes (a visual mashup cre-ation and publishing service), but also not without itsown newly introduced "problems" like copyright, individ-ual privacy and even national security issues, all of whichwere not much the case when GIS was once very 'closed'and only the realm of big organizations and an elite ofexperts. We have previously discussed these side-effectissues and others in [2,7,21,74,79], but there is one morethat seems very suitable for closing an article about geo-mashups.
The many easy-to-use online interfaces and visual mashupeditors that are now available have increased the risks ofwrong selection, manipulation and interpretation of datain some scenarios. As discussed in [97], the ideal con-sumer tools of the future need to be fault-tolerant andcapable of analysing and presenting assembled data inways that facilitate only appropriate interpretations ofintegrated or mashed-up data. This can be achieved byusing some form of "intelligent", goal-oriented onlinehealth GIS wizards and mashup editors that are based onrobust statistical, epidemiological and other methods, sothat only valid results, maps and visualizations areallowed and produced, even when unlearned usersattempt to select inappropriate settings or data for a par-ticular analysis or geo-mashup.
Competing interestsDB is Managing Director of Daden Limited, an Informa-tion 2.0 consultancy and full service Virtual Worlds/Sec-ond Life development agency. MNKB, MS, and KHC haveno competing interests to declare.
Authors' contributionsMNKB conceived and drafted the manuscript, and con-tributed parts of the Background, most of "Mashup song#4", all of the Discussion and Conclusions sections, aswell as Figures 4, 5, 6, 7, 8, 10, 12 and 13. MS (with helpfrom, and under KHC's supervision) contributed parts ofthe Background, Figures 1, 2, 3, and most of "Mashupsongs #1-3", with the following exceptions: Figures 4 and5, and some of the literature examples/pointers used inthese sections, which were contributed by MNKB. DB con-tributed insider information/text (used in "Mashup song#4") about Daden's 'Google Maps in SL' tool, and also Fig-ures 9 and 11. He also kindly allowed us to use the tool torender "Mashup song #4" in SL. All authors read andapproved the final manuscript. Linden Lab, Second Life,SL, and SLurl are trademarks of Linden Research, Inc.
References1. Kamel Boulos MN, Wheeler S: The emerging Web 2.0 social
software: an enabling suite of sociable technologies in healthand health care education. Health Information and Libraries Journal2007, 24(1):2-23.
2. Kamel Boulos MN, Burden D: Web GIS in practice V: 3-D inter-active and real-time mapping in Second Life. International Jour-nal of Health Geographics 2007, 6:51.
3. McFedries P: The new geographers. IEEE Spectrum 2007, 44(12-INT64 [http://www.spectrum.ieee.org/dec07/5738].
4. Mashup (web application hybrid) – Wikipedia [http://en.wikipedia.org/w/index.php?title=Mashup_%28web_application_hybrid%29&oldid=222992456]
5. Google maps [http://maps.google.com/]6. Google earth [http://earth.google.com/]7. Kamel Boulos MN: Web GIS in practice III: creating a simple
interactive map of England's strategic health Authoritiesusing Google maps API, Google earth KML, and MSN virtualearth map control. International Journal of Health Geographics 2005,4:22.
8. My maps – google maps user guide [http://local.google.com/support/bin/answer.py?hl=en&answer=68480]
9. Google Mapplets API [http://code.google.com/apis/maps/documentation/mapplets/]
10. Wood J, Dykes J, Slingsby A, Clarke K: Interactive visual explora-tion of a large spatio-temporal dataset: reflections on a geo-visualization mashup. IEEE Trans Vis Comput Graph 2007,13(6):1176-83.
11. Butler D: Mashups mix data into global service. Nature 2006,439:6-7 [http://declanbutler.info/blog/?p=58].
12. HealthMap [http://www.healthmap.org/]13. Google News [http://news.google.com/]14. International society for infectious diseases, ProMED-mail
[http://www.promedmail.org/]15. World Health Organization (WHO) [http://www.who.int/]16. Google earth outreach – showcase public health [http://
earth.google.com/outreach/p_health.html]17. Turner A: Introduction to Neogeography. O'Reilly 2006 [http://
oreilly.com/catalog/9780596529956/].18. Show us a better way [http://www.showusabetterway.co.uk/call/]19. O'Reilly T: What is Web 2.0: Design patterns and business
models for the next generation of software. [http://www.oreillynet.com/pub/a/oreilly/tim/news/2005/09/30/what-is-web-20.html].
20. Dapper [http://www.dapper.net/]21. Cheung KH, Yip KY, Townsend JP, Scotch M: HCLS 2.0/3.0: Health
care and life sciences data mashup using Web 2.0/3.0. JBiomed Inform in press. 2008 Apr 11, http://www.ncbi.nlm.nih.gov/pubmed/18487092
22. Yahoo! Pipes: Rewire the web [http://pipes.yahoo.com/pipes/]23. Official google maps API blog: Introduction and yahoo! pipes
[http://googlemapsapi.blogspot.com/2007/04/introduction-and-yahoo-pipes.html]
24. FortiusOne GeoCommons [http://www.geocommons.com/]25. GeoIQ Javascript API documentation [http://geoiq.earthinfo
mark.com/docs/geoiq_api_doc.pdf]26. USGS, CDC ArboNet [http://diseasemaps.usgs.gov/]27. Zou L, Miller SN, Schmidtmann ET: A GIS tool to estimate West
Nile virus risk based on a degree-day model. Environ MonitAssess 2007, 129(1–3):413-20.
28. Allen J: A modified sine wave method for calculating degreedays. Environmental Entomology 1976, 5:388-396.
29. NOAA NCDC: National climate data center [http://www.ncdc.noaa.gov/oa/ncdc.html]
30. CIPRES TreeBASE II: experimental google earth phyloge-netic tree server [http://www.treebase.org/getrees/]
31. Janies D, Hill AW, Guralnick R, Habib F, Waltari E, Wheeler WC:Genomic analysis and geographic visualization of the spreadof avian influenza (H5N1). Syst Biol 2007, 56(2321-9 [http://systbio.org/?q=node/184].
32. Mesquite Project: A modular system for evolutionary analy-sis [http://mesquiteproject.org/mesquite/mesquite.html]
33. Semantic web activity statement [http://www.w3.org/2001/sw/Activity.html]
34. Kamel Boulos MN, Roudsari AV, Carson ER: Towards a semanticmedical Web: HealthCyberMap's tool for building an RDF
Page 14 of 16(page number not for citation purposes)

International Journal of Health Geographics 2008, 7:38 http://www.ij-healthgeographics.com/content/7/1/38
metadata base of health information resources based on theQualified Dublin Core Metadata Set. Medical Science Monitor2002, 8(7):MT124-36.
35. Kamel Boulos MN: A first look at HealthCyberMap medicalsemantic subject search engine. Technology and Health Care2004, 12(1):33-41.
36. W3C Semantic web activity [http://www.w3.org/2001/sw/]37. OWL web ontology language overview [http://www.w3.org/
TR/owl-features/]38. GeoNames ontology – Geo semantic Web [http://www.geon
ames.org/ontology/]39. GeoNames [http://www.geonames.org/]40. Embrun, France [http://sws.geonames.org/3020251/]41. Embrun, France (RDF) [http://sws.geonames.org/3020251/
about.rdf]42. Ashburner M, Ball CA, Blake JA, Botstein D, Butler H, Cherry JM,
Davis AP, Dolinski K, Dwight SS, Eppig JT, Harris MA, Hill DP, Issel-Tarver L, Kasarskis A, Lewis S, Matese JC, Richardson JE, Ringwald M,Rubin GM, Sherlock G: Gene Ontology: tool for the unificationof biology. Nature Genetics 2000, 25(1):25-29.
43. Eilbeck K, Lewis SE, Mungall CJ, Yandell M, Stein L, Durbin R, Ash-burner M: The Sequence Ontology: a tool for the unificationof genome annotations. Genome Biol 2005, 6(5):R44.
44. RDFa Primer: Bridging the human and data webs – W3Cworking draft 20 June 2008 [http://www.w3.org/TR/xhtml-rdfa-primer/]
45. Gleaning resource descriptions from dialects of languages(GRDDL) [http://www.w3.org/2004/01/rdxh/spec]
46. XSL Transformations (XSLT) version 1.0 – W3C recom-mendation 16 November 1999 [http://www.w3.org/TR/xslt]
47. Pipes: RSS 2 Geo [http://pipes.yahoo.com/premasagar/rss2geo]48. International journal of health geographics – latest articles
(RSS feed) [http://www.ij-healthgeographics.com/rss/]49. Loton T: Working with Yahoo! Pipes, No Programming Required 2008
[http://www.lotontech.com/]. Cheshire: LOTONtech Limited50. Pruett M: Yahoo! Pipes. O'Reilly Safari Books Online 2007 [http://
safari.oreilly.com/9780596514532].51. GeoAnnotated health news mashups [http://pipes.yahoo.com/
mnk_boulos]52. Yahoo! maps ajax web services [http://developer.yahoo.com/
maps/ajax/]53. Yahoo! Pipes – operator modules: Location extractor mod-
ule [http://pipes.yahoo.com/pipes/docs?doc=operators#LocationExtractor]
54. URI of the GeoRSS output from GeoNames for 'Yahoo!News: Health News' [http://ws.geonames.org/rssToGeoRSS?feedUrl=http%3A%2F%2Frss.news.yahoo.com%2Frss%2Fhealth]
55. 'Yahoo! News: Health news' GeoRSS feed displayed onGoogle maps using ACME GeoRSS Map viewer[http:www.acme.com/GeoRSS/?xmlsrc=http%3A%2F%2Fws.geonames.org%2FrssToGeoRSS%3FfeedUrl%3Dhttp%253A%252F%252Frss.news.yahoo.com%252Frss%252Fhealth]
56. Daden Limited [http://www.daden.co.uk/]57. Daden brings Google Maps into second life (Second Life loca-
tion SLurl) [http://slurl.com/secondlife/Daden%20Prime/228/19/400]
58. Reuters/Second Life Ŭ The last big feature "HTML on aprim" [http://secondlife.reuters.com/stories/2008/03/27/the-last-big-feature-html-on-a-prim/]
59. Flickr services [http://www.flickr.com/services/api/]60. Google Earth – Collada [http://www.collada.org/mediawiki/
index.php/Google_Earth]61. Google Mashup editor [http://code.google.com/gme/]62. Microsoft popfly [http://www.popfly.com/]63. Griffin E: Foundations of Popfly: Rapid Mashup Development Berkeley,
CA: Apress; 2008. 64. The Official microsoft silverlight site [http://silverlight.net/]65. Map example from Silverlight Showcase [http://silverlight.net/
world/]66. Microsoft Virtual Earth [http://www.microsoft.com/VirtualEarth/
]67. Silverlight example using Microsoft Virtual Earth [http://sil
verlight.idvsolutions.com/]68. Popfly example using Flickr and Microsoft virtual earth
blocks [http://www.popfly.com/users/mnkboulos/Flickr-Virtual%20Earth%20Mashup__Church]
69. Microsoft Delivers Silverlight 1.0, Extends Support to Linux[http://www.microsoft.com/presspass/press/2007/sep07/09-04SilverlightPR.mspx]
70. Adobe strikes back at Silverlight with RIA [http://www.telecomseurope.net/article.php?id_article=5834]
71. Roush W: Second Earth: The World Wide Web will soon beabsorbed into the World Wide Sim: an environment com-bining elements of Second Life and Google Earth. MIT Tech-nology Review 2007 [http://www.technologyreview.com/Infotech/18911/].
72. Bourke PD: Evaluating Second Life as a tool for collaborativescientific visualisation. Proceedings of Computer Games & AlliedTechnology 08: International Conference & Symposium on ComputerGames, Animation, Multimedia, Security, IPTV & Edutainment: 28–30 April2008; Singapore .
73. Sarvary M: Breakthrough ideas for 2008: The metaverse – TVof the future? Harvard Business Review 2008, 86(2):17-45.
74. Kamel Boulos MN, Hetherington L, Wheeler S: Second Life: anoverview of the potential of 3-D virtual worlds in medical andhealth education. Health Information and Libraries Journal 2007,24(4):233-245.
75. Weblin [http://www.weblin.com/]76. YOOWALK [http://www.yoowalk.com/]77. MPK20 (video) [http://www.youtube.com/
watch?v=BJS8DGjeGvM]78. MPK20: Sun's 3-D Virtual Workplace [http://research.sun.com/
projects/mc/mpk20.html]79. Huang ST, Kamel Boulos MN, Dellavalle RP: Scientific Discourse
2.0. Will Your Next Poster Session Be in Second Life ®?EMBO Reports 2008, 9(6496-499 [http://www.nature.com/embor/journal/v9/n6/pdf/embor200886.pdf].
80. McConaghy T: Using second life for knowledge transfer andcollaboration. Presented at International Workshop on ManagingKnowledge for Space Missions: 17–19 July 2007; CalTech, Pasadena, Cali-fornia, USA [http://km.nasa.gov/pdf/182785main_McConaghy_Second_Life.pdf].
81. Digital urban [http://digitalurban.blogspot.com/]82. UCM cluster research input for the future internet research
programme: Research on future media internet in a globalcontext (March 2008) [ftp://ftp.cordis.europa.eu/pub/fp7/ict/docs/netmedia/UCM-Position-paper.pdf]
83. IBM and Linden lab to explore enterprise-class solution forvirtual world creation and collaboration (3 April 2008)[http://www.businesswire.com/portal/site/google/?ndmViewId=news_view&newsId=20080402006512&newsLang=en]
84. OpenSim [http://www.opensimulator.org/]85. International organization for standardization (ISO)/
metaverse1 consortium: Draft requirements for the 'MPEG-V for 3-D virtual worlds' emerging standard (May 2008)[http://www.virtualworldsnews.com/files/w9902_draft_requirements_for_mpegv.doc]
86. Linden Lab publishes draft Open Grid Protocol [http://wiki.secondlife.com/wiki/SLGOGP_Draft_1]
87. Lively by Google [http://www.lively.com/html/landing.html]88. Vollee mobile access to world of second life [http://www.vol
lee.com/secondlife]89. YouTube – second life streaming to your mobile phone by
vollee [http://www.youtube.com/watch?v=XwRnjbkljnc]90. YouTube – Vollee SL Client [http://www.youtube.com/
watch?v=0Z2kXAbTn2c]91. 3Dconnexion 3D mouse navigation enhances Second Life
experience [http://www.3dconnexion.com/solutions/secondlife.php]
92. Handsfree 3D [http://www.handsfree3d.com/]93. Virtual Worlds – A Roadmap to the Future? [http://
www.daden.co.uk/downloads/Virtual%20Worlds%20-%20A%20Road%20Map.pdf]
94. Project10X's Semantic Wave 2008 Report: Industry Road-map to Web 3.0 & Multibillion Dollar Market Opportunities[http://www.isoco.com/pdf/Semantic_Wave_2008-Executive_summary.pdf]
95. Who is Sick? [http://whoissick.org/sickness/]96. Clark J: The New Cartographers. What does it mean to map
everything all the time? In These Times 2008, 32(3): [http://www.inthesetimes.com/article/3524/the_new_cartographers/].
Page 15 of 16(page number not for citation purposes)

International Journal of Health Geographics 2008, 7:38 http://www.ij-healthgeographics.com/content/7/1/38
Publish with BioMed Central and every scientist can read your work free of charge
"BioMed Central will be the most significant development for disseminating the results of biomedical research in our lifetime."
Sir Paul Nurse, Cancer Research UK
Your research papers will be:
available free of charge to the entire biomedical community
peer reviewed and published immediately upon acceptance
cited in PubMed and archived on PubMed Central
yours — you keep the copyright
Submit your manuscript here:http://www.biomedcentral.com/info/publishing_adv.asp
BioMedcentral
97. Kamel Boulos MN: Research protocol: EB-GIS4HEALTH UK –foundation evidence base and ontology-based framework ofmodular, reusable models for UK/NHS health and health-care GIS applications. International Journal of Health Geographics2005, 4:2.
Page 16 of 16(page number not for citation purposes)