Embed Size (px)
Citation preview

Web-based Interspecies
Correlation Estimation (Web-ICE) for Acute Toxicity
http://www.epa.gov/ceampubl/fchain/webice/
Sandy Raimondo
USEPA/ORD/NHEERL/GED
12 February 2014

2
Web-ICE Team (past & present)USEPA/NHEERL/ORD/NHEERL
Mace Barron
Crystal Jackson
Deborah Vivian
Jill Awkerman
Larisa Lee
Julie Krzykwa
Chris Russom
Sonny Mayer
Marion Marchetto
Anthony DiGirolamo
Brandon Jarvis
Christel Chancy
Nathan Lemoine
USEPA/Regions
Candice Bauer
Edward Hammer
Burt Shepard
USEPA/Program Offices
Kris Garber (OPP)
Elizabeth Riley (OPP)
Thomas Steeger (OPP)
Brian Montague (OPP)
Don Rodier (OPPT)
Vince Nabholz (OPPT)
Wade Lehman (OW)
USGS
Christopher Ingersoll
Ning Wang
John Besser
US Fish & Wildlife Service
Tom Augspurger
Proctor & Gamble
Scott Dyer
Scott Belanger
Jessica Brill
Don Versteeg
Joel Chaney
Environment Canada
Pierre Mineau
Alain Baril
Brian Collins
Computer Sciences Corporation
Wally Schwab
Derek Lane

3
What is Web-ICE?http://www.epa.gov/ceampubl/fchain/webice/
• An internet application developed by the US Environmental Protection Agency, Office of Research and Development, Gulf Ecology Division.
• Uses interspecies correlation estimation (ICE) models to estimate acute toxicity to a species, genus, or family from the known toxicity of a surrogate species.
• Contains modules to derive acute hazard levels (e.g., HC5) and endangered species toxicity useful to chemical hazard assessment and Ecological Risk Assessment (ERA).

4
Estimates acute toxicity (LC/EC50) for a species, genus or family from a surrogate species
ICE in ERA
- Populates toxicity database
- Direct toxicity estimation for endangered species
- Allows for species sensitivity comparisons and development of SSDs
Rainbow trout Atlantic salmon
How can Web-ICE valuable to ERA?

5
Discussion Outline
1) Technical Basis of ICE models– Database & model development
– Validation and uncertainty analysis
– User guidelines / Rules of Thumb
2) Applications in SSDs
10:30 – 12:00 Web-ICE Demonstrations

6
-2
-1
0
1
2
3
4
5
-2 0 2 4 6
Rainbow trout (log LC50)
Atl
anti
c sa
lmon
(lo
g LC
50)
Log-linear least squares regressions of the relationship between the acute toxicity (LC50/LD50) of chemicals tested in two species.
Log(Toxicitypredicted) = a + b*Log(Toxicitysurrogate)
chemicals tested
in trout and salmon
Interspecies Correlation Estimation (ICE)

7
ICE Models – the basics
1. ICE models start with large database of acute toxicity– e.g. ICE v3.1 aquatic invert/fish database = 5487 LC50 values; 1258
chemicals; 180 species
2. All possible pairings of species by common chemical– e.g. 180*180 = 32400 potential pairings
3. ICE model = Log-linear least squares regression of common chemicals tested in two species– some pairings will not yield any ICE model
– some models will not be significant (p>0.05)
4. Suite of ICE models dependent on toxicity
database
-2
-1
0
1
2
3
4
5
-2 0 2 4 6
Rainbow trout (log LC50)
Atl
anti
c sa
lmon (
log L
C50)

8
Aquatic (fish and invertebrates):
– US EPA Office of Pesticide Programs Ecotoxicity Database
– US EPA Office of Pollution Prevention & Toxics PMN, HPV
– US/EPA/ Office of Research and Development
• Ecotox
• e.g. Mayer 1987
– Ambient Water Quality Criteria
– US Geologic Survey
– Mayer and Ellersieck 1986
– Open literature sources
• endangered species
• mollusks
Web-ICE Databases

9
NEW Aquatic (algae):– Procter & Gamble (CRADA)– EPA Office of Pesticide Program– Open literature searches– Ecotox
Wildlife (birds and mammals):– US EPA Office of Pesticide Programs Ecotoxicity Database– Environment Canada (Baril et al. 1994)– Hudson et al. 1984 – Schafer et al. 1983 – Shafer and Bowles 1985– Safer and Bowles 2004– Smith 1987
Web-ICE Databases

10
Data StandardizationAll Databases • cas/name consistency• single compound tested• a.i. > 90%• chemical & element specific AWQC normalizations (e.g. ammonia, metals)
Aquatic animal• no sediment, dietary, mixed dose exposures or phototoxicity results • ASTM/OPPTS standards• endpoint = mortality/immobilization• 48h EC/LC50 - daphnids, midges and mosquitoes • 96h EC/LC50 - fish and other invertebrates• juvenile only: fish, amphibians, insects, molluscs, decapods • other groups: all life stages
Aquatic plants (algae)• 72 or 96 hour EC50, growth rate or biomass
Wildlife• Single oral dose LD50 (mg/kg), adults only

11
Taxa # Records # Chemicals # Species
Aquatic animal 5487 1258 180
Algae 1647 457 57
Wildlife 4329 951 156
Web-ICE Databases

Model Development
• All species/taxa are paired with each other by common chemical within single database
• Geometric means for more than one toxicity value per species/chemical pair
• Excluded species/chemical pairs where the minimum and maximum tox values were greater than 10-fold
• Three or more common chemicals per pair are required to develop a model
• Only models with a significant relationship (p-value < 0.05) are included in Web-ICE
Models are only developed for species within the same database (e.g., no algae to fish models)
Log10(predicted toxicity) = a + b*Log10(surrogate toxicity)
Taxa Species Genus Family
Aquatic animal 780 289 374
Algae 58 44 0
Wildlife 560 0 292

13
Model Validation & Uncertainty Analysis
• Only included models significant at the p<0.05 level
• Leave-1-out cross-validation performed on models N > 4
leave-1-out cross-validationEach data point is removed, one at a time, and the model is rebuilt with remaining data. Removed surrogate data are used to estimate
removed predicted data from rebuilt model.

14
Model Validation: Leave-1-Out
y = 1.11x + 0.04
R2 = 0.97
0
1
2
3
4
0 1 2 3 4
Rainbow trout (Log LC50)
Raz
erb
ack
suck
er (
log
LC5
0)
data removed
4-Nonylphenol
x value = 2.28
y value = 2.26

15
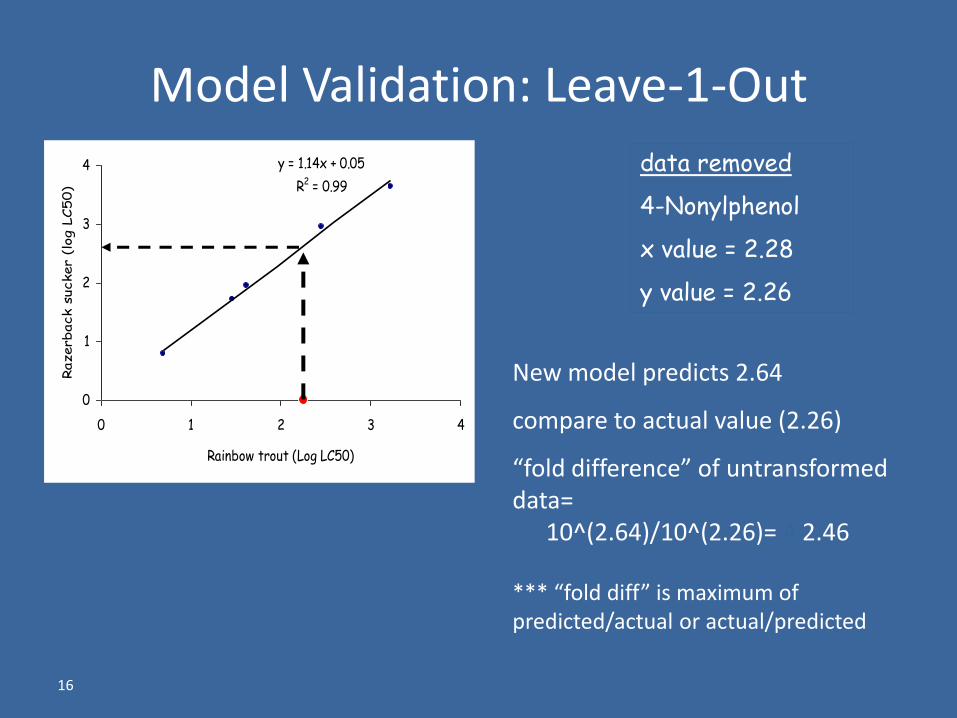
Model Validation: Leave-1-Out
y = 1.14x + 0.05
R2 = 0.99
0
1
2
3
4
0 1 2 3 4
Rainbow trout (Log LC50)
Raz
erb
ack
suck
er (
log
LC5
0)
New model developed w/o
removeddata
data removed
4-Nonylphenol
x value = 2.28
y value = 2.26
Removedx value
into new model
16
New model predicts 2.64
compare to actual value (2.26)
“fold difference” of untransformed data=
*** “fold diff” is maximum of predicted/actual or actual/predicted
Model Validation: Leave-1-Out
data removed
4-Nonylphenol
x value = 2.28
y value = 2.26
y = 1.14x + 0.05
R2 = 0.99
0
1
2
3
4
0 1 2 3 4
Rainbow trout (Log LC50)
Razerb
ack s
ucker
(log L
C5
0)
10^(2.64)/10^(2.26)= 4 2.46

17
Model Uncertainty Analyses
• Used “fold difference” of cross-validation to identify areas of model uncertainty
• Species level models– Aquatic: 10914 data points removed and validated from 696 models– Wildlife: 11846 data points from 538 models
• Model “Cross-validation success rate” = % removed data within 5-fold
• Taxonomic Distance• Model parameters• Mode of Action

18
Cutthroat trout (Oncorynchus clarki)
Atlantic salmon (Salmo salar)
‘
Sheepshead minnow (Cyprinodon variegatus)
S. leopard frog (Rana sphenocephala)
Daphnid (Daphnia magna)
Taxonomic Distance
Measures the taxonomic relatedness of the surrogate and predicted taxa
Surrogate:Rainbow trout
1 – genus
2 - family
3 - order
4 - class
5 - phylum
6 - kingdom
– shared taxonomic levelTaxonomic
distance

19
Model uncertainty & taxonomic distance
Aquatic animals in same family ~ 90% within 5-fold, 95% within 10-fold
Shared taxonomic
level
Significant models
(N)
Percentage within predicted range
5-fold 10-fold 50-fold > 50-fold
Genus (1) 254 94 2 3 1
Family (2) 700 91 5 3 1
Order (3) 208 86 10 3 0
Class (4) 4432 80 9 8 3
Phylum (5) 764 61 14 17 8
Kingdom (6) 4556 56 15 19 10
Raimondo et al. 2010 Environmental Science and Technology

20
Common level
Number datapoints 5-fold 10-fold 50-fold > 50 fold
Genus (1) 48 100 0 0 0
Family (2) 1452 92 6 2 0
Order (3) 2238 90 7 3 0.3
Class (4) 5706 85 10 5 0.2
Phylum (5) 2402 76 13 9 1.5
Percentage of all datapoints in cross-validation category
Raimondo et al. 2007 Environmental Science and Technology
Wildlife in same order ~ 90% within 5-fold, 97% within 10-fold
Model uncertainty & taxonomic distance

21
Regression Tree:Is “fold difference” predicted by:
intercept
slope
R2
df
MSE
taxonomic distance
input value relative to model x range
Uncertainty and Model ParametersAquatic

22
Regression Tree - Aquatic(Decision Tree, Pattern Recognition)
all data
taxonomic distance1,2,3,4 5,6
model x rangeoutside inside
MSE<0.22 >0.22
N= 2628; ave = 4.4 N = 2542; ave = 10
N = 4849; ave = 25
N = 11; ave = 107
N = 10030; ave = 16
Raimondo et al. 2010 Environmental Science and Technology
23
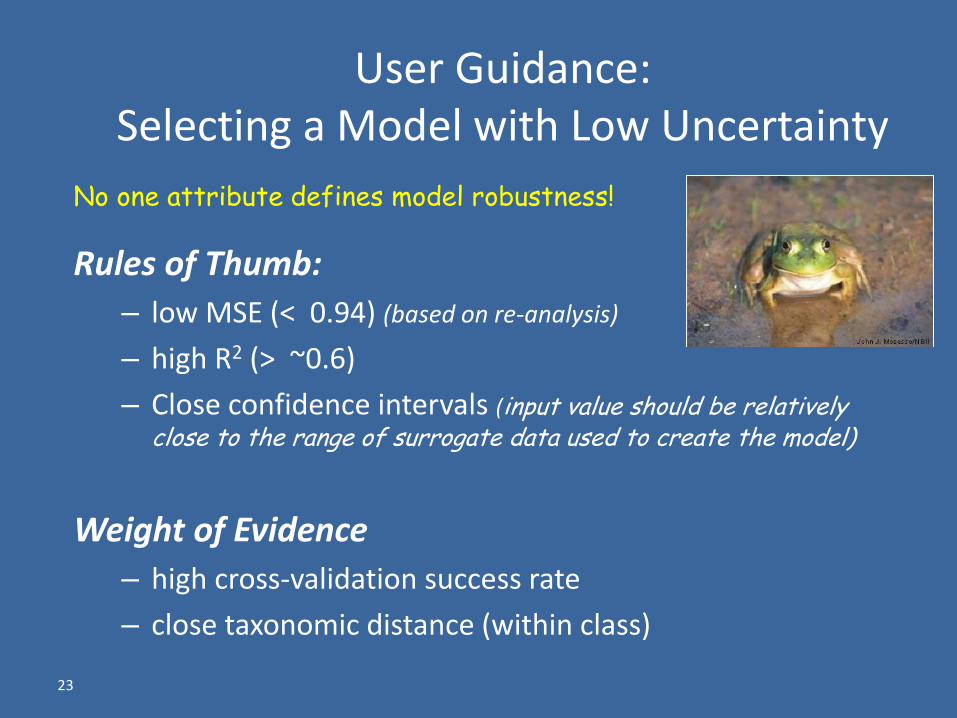
User Guidance:Selecting a Model with Low Uncertainty
No one attribute defines model robustness!
Rules of Thumb:
– low MSE (< 0.94) (based on re-analysis)
– high R2 (> ~0.6)
– Close confidence intervals (input value should be relatively close to the range of surrogate data used to create the model)
Weight of Evidence
– high cross-validation success rate
– close taxonomic distance (within class)

24
Applications: Ecological Risk Assessment
25
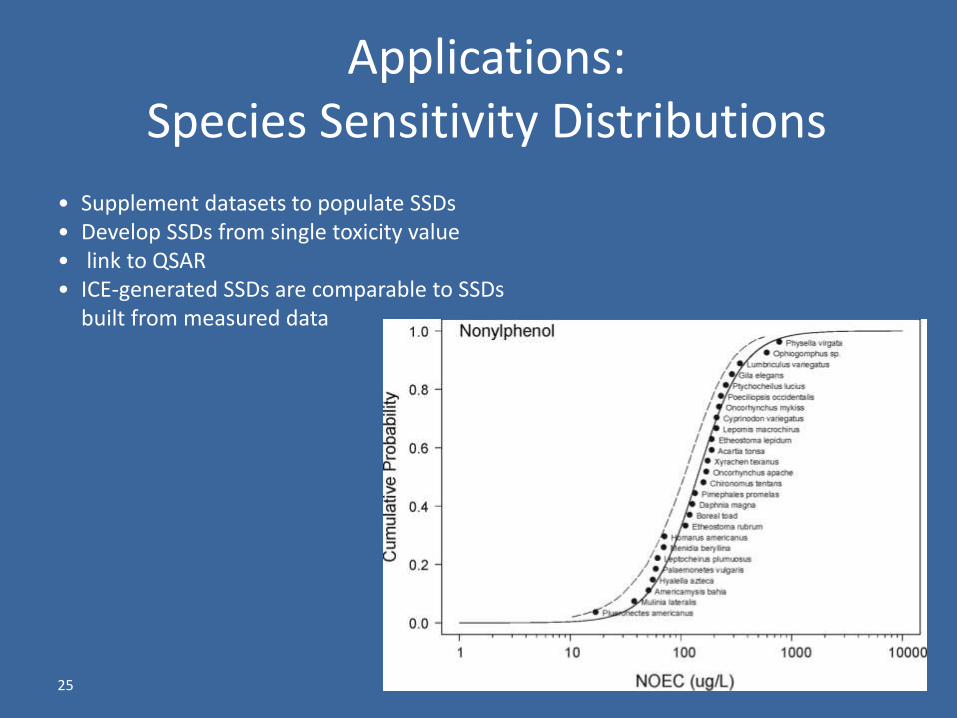
• Supplement datasets to populate SSDs• Develop SSDs from single toxicity value• link to QSAR• ICE-generated SSDs are comparable to SSDs
built from measured data
Applications: Species Sensitivity Distributions

26
NOEC (ug/L)
Cu
mula
tive
Pro
bab
ilit
y
10^-2 10^-1 10^0 10^1 10^2 10^3 10^4
0.0
0.2
0.4
0.6
0.8
1.0 Dieldrin
Pink shrimp (Panaeus dourarum) American eel (Anguilla rostrata)
Shiner perch (Cymatogaster aggregata) Rainbow trout (Oncorhynchus mykiss)
Chinook salmon (Oncorhynchus tshawytscha) Dwarf perch (Micrometrus minimus)
Guppy (Poecilia reticulata) Mysid (Americamysis bahia) Atlantic silverside (Menidia menidia) Isopod (Asellus brevicaudus) Striped killifish (Fundulus majalis)
Bluehead (Thalassoma bifasciatum) Sand shrimp (Crangon septemspinosa)
Mayfly (Ephemerella grandis) Green sunfish (Lepomis cyanellus) Grass shrimp (Palaemonetes pugio) Mummichog (Fundulus heteroclitus) Sheepshead minnow (Cyprinodon variegatus) Coho salmon (Oncorhynchus kisutch) Korean shrimp (Palaemon macrodactylus)
Threespine stickleback (Gasterosteus aculeatus) Bluegill (Lepomis macrochirus )
Hermit crab (Pagurus longicarpus) Striped bass (Morone saxatilis) Grass shrimp (Palaemonetes kadiakensis) Fathead minnow (Pimephales promelas) Striped mullet (Mugil cephalus) Stonefly (Pteronacys californica)
Eastern oyster (Crassostrea virginica) Northern puffer (Sphaeroides maculatus)
Stonefly (Pteronacys californica) Goldfish (Carassius auratus)
Grass shrimp (Palaemonetes vulgaris) Water flea (Daphnia carinata)
Water flea (Simocephalus serrulatus) Water flea (Daphnia pulex)
Scud (Gammarus lacustris) Scud (Gammarus faciatus)
Crayfish (Orconectes nais)
Mysid (Americamysis bahia) Scud (Gammarus faciatus)
Stonefly (Pteronarcella badia) Brown trout (Salmo trutta)
Stonefly (Pteronacys californica) Shortnose sturgeon (Acipenser brevirostrum)
Brook trout (Salvelinus fontinalis) Atlantic salmon (Salmo salar)
Coho salmon (Oncorhynchus kisutch) Chinook salmon (Oncorhynchus tshawytscha)
Lahonatan cutthroat trout (Oncorhynchus clarki henshawi) Largemouth bass (Micropterus salmoides)
Midge (Chironomus tentans) Apache trout (Oncorhynchus apache) Cutthroat trout (Oncorhynchus clarki) Fountain darter (Etheostoma rubrum)
Lake trout (Salvelinus namaycush) Spotfin chub (Cyprinella monacha)
Aquatic sowbug (Asellus brevicaudus) Water flea (Daphnia magna)
Rainbow trout (Oncorhynchus mykiss) Cape fear shiner (Notropis mekistocholas)
Greenback cutthroat trout (Oncorhynchus clarki stomais) Greenthroat darter (Etheostoma lepidum)
Yellow perch (Perca flavescens) Bluegill (Lepomis macrochirus )
Razorback sucker (Xyrachen texanus) Common carp (Cyprinus carpio)
Eastern oyster (Crassostrea virginica) Mosquitofish (Gambusia affinis)
Green sunfish (Lepomis cyanellus) Southern leopard frog (Rana sphenocephala)
Channel catfish (Ictalurus punctatus) Goldfish (Carassius auratus)
Sheepshead minnow (Cyprinodon variegatus) Black bullhead (Ameiurus melas)
5th percentile:
Measured: 0.91
ICE: 1.7 ug/L
all measuredLC50s
LC50 (ug/L)
Cu
mu
lati
ve P
rob
abili
ty
ICE(one LC50measured;
22 ug/L)
ICE and Measured SSDs

27
How Do ICE and Measured SSDs Compare for Aquatic Organisms?
• Aquatic Species Proof of Concept (Dyer et al. 2006)
– ICE-based SSDs had HC5s within an order of magnitude of measured HC5s
• Aquatic Species, Expanded Study (Dyer et al. 2008)
– 55 AWQC chemicals, 4 surrogate species (P. promelas, O. mykiss, C. varigatus, D. magna)
– Using fish surrogate to predict fish and invertebrate surrogate to predict invertebrates yielded HC5s similar to measured (average factor of 3.0 ± 6.7 over 7 orders of toxic magnitude)

28
Augmenting Datasets with ICE-Generated Data
• Limited measured data augmented with ICE toxicity values (49 chemicals with > 10 species)
• SSD sensitivity analysis
• ICE prediction uncertainty contributed less to HC5 variability than species composition
• ICE prediction variability influence on HC5 dependent on location in SSD

Influence of SSD data variability on HC5

Web-ICE and QSAR
QSAR tox estimate used as input into ICE SSD generator

QSAR Web-ICE SSD
31
• in silico approach• 10 chems/4 MOAs; daphnid, fathead
• Compared measured SSD HC5 to in silico HC5– Results variability with MOA & QSAR uncertainty– Variability reduced with identical species composition
• 80% HC5s within 5-fold of measured using ECOSAR QSAR value

32
How Do ICE and Measured SSDs Compare for Wildlife?
• Used ICE database of acute toxicity (23 chemicals with > 15 species)
• For each chemical, removed records from database to generate independent ICE models
• Created SSDs1. measured data
2. ICE data – 5 surrogates (Japanese Quail, Mallard, Northern bobwhite, red-winged blackbird, Norway rat)
• 100% HC5s within a factor of 5 using bird & mammal surrogates

33
Can we use only rodent data and ICE to develop reliable wildlife SSDs?
Rodent Wildlife ICE SSD study
• Database of rodent oral dose LD50 data (Hazardous Substances Data Bank)
• Mouse: 109 chemicals; Rat: 175 chemicals– Rodents most often in least sensitive quartile; not great
surrogates
• Created measured and surrogate ICE SSDs:– rat (53 chems) and mouse (32 chems)
• Compared HD5s– 78% of HD5 values within 5x of measured

34
Defensibility– cross-validation of models provides user with
estimate of model performance
– all models significant
User guidance• clearly outlined
• uncertainty analyses identify “Rules of Thumb” (Aquatic complete in 2008)
• Web-ICE alerts users to potentially ill-fitting data
Demonstration of use in SSDs• Aquatic and wildlife
• Species composition
• Taxonomic distance of surrogate and predicted
Application of Web-ICE

http://www.epa.gov/ceampubl/fchain/webice/