Embed Size (px)
Citation preview

CHAPTER 12
WEATHER RADAR
This chapter will be devoted to the discussion ofvarious types of radar, their characteristics, principles,and elements.
The first portion of our discussion will deal withcharacteristics and principles of nondoppler radar,followed by a discussion of principles, characteristics,and phenomena associated with doppler radar. Finally,we will look at the Next Generation Weather Radar(NEXRAD) system, principally the WSR-88D.
NONDOPPLER RADAR
LEARNING OBJECTIVES: Interpret theeffects of wavelength on nondoppler radar.Recognize principles of wavelength onnondoppler weather radars. Evaluatenondoppler radar beam characteristics.
Now let’s begin our discussion of nondoppler radar.For additional information, refer to the FederalMeteorological Handbook No. 7, Weather RadarObservations, Part B, NAVAIR 50-1D-7.
EFFECTS OF WAVELENGTH ANDFREQUENCY ON RADAR PERFORMANCE
The concept of energy moving as waves through amedium such as water is easily understood because wecan observe the oscillation of the material. Both
electrical and magnetic energy are transmitted by thesewaves. Viewed along the direction of transmission, theenvelope containing vectors representing anelectromagnetic field appears in wave form. Figure12-1 shows the common method for representingwaves. The radio energy waves have some semblanceto water waves in that they retain their size while alltraveling at the same speed. Therefore, they could alsobe represented as concentric circles about the generatingdevice, as seen in figure 12-2. In this case, we could saythat the circles represent wave fronts that move awayfrom the source. In the case of focused waves, such aswe have with weather radars, we could show the wavefronts moving along the beam path, as in figure 12-3. Inall three illustrations, the distance from wave front towave front, and from any part of a wave to thecorresponding part of the next wave, remains constant.This distance is determined by two factors, the speedwith which the waves move and the rapidity with whichthe generating device operates. The generating deviceis said to oscillate, and could be thought of as movingup and down, or back and forth. Each completeoscillation produces one complete wave. The wavesmove away from the oscillator as they are beinggenerated so that the wave front will be 1 wavelengthaway from the oscillator when the next wave front is justbeing formed. Because the speed of wave travelremains constant, there is a constant, inverserelationship between the frequency of the oscillationand the length of the wave; the faster the oscillation(higher frequency), the shorter the wavelength.
Figure 12-1.-Energy wave represented as oscillations. These are 5 cm long.
12-1

Figure 12-2.-Flve 1-cm energy waves represented asconcentric circles around the wave emitttcr.
Thus, radar waves can be described either in termsof frequency or wavelength. The two are related by thefollowing equation:
FREQUENCY =
where is the wavelength and c is the speed of light(300,000,000 meters per second or 3 x 10⁸).
Wavelengths for Weather Radars
All the wavelengths commonly used for radars willbe reflected by large objects such as buildings andairplanes, but some waves are so large they are notaffected significantly by small objects such as raindrops,and, therefore, do not effectively detect their presence.Other waves are so small that they are completelyscattered and absorbed by raindrops and, therefore,cannot penetrate beyond the first drops to detect others
far away. Any object that is easily detected by aparticular wave is one that reflects, absorbs, or scattersthat wave, decreasing its potential to detect more distantobjects. The target for weather surveillance radars is theraindrop, with a diameter usually less than 5 mm. Wemust select a wavelength small enough to detect theraindrop, but large enough not to be completelyreflected and absorbed by a large number of drops. Thechoice usually comes to either 5- or 10-cm waves.
Wavelength for Cloud Detection Radars
Wavelengths shorter than 3 cm will detect mostcloud particles. The optimum wavelength for clouddetection is about 1 cm (anything shorter is too greatlyattenuated).
RADAR BEAM CHARACTERISTICS
In the following section we will deal with some ofthe characteristics of the radar beam.
Beam Height and Width
Although we must always keep in mind that theradar energy discussed here is emitted in short pulsesrather than in a steady stream, it is useful to think of thepath of the pulses as a beam much like a flashlight beam,Each pulse has three dimensions within thebeam-height, width, and length-and each pulse iscomposed of a number of waves of energy. The beamis created when the energy waves are directed onto thereflector, which focuses them in a desired direction anda predetermined shape. The height and width of eachradar pulse is determined by the radar beam shape andsize, and the beam, in turn, is determined by the shapeand size of the antenna reflector. For weather radars, wealmost always use a narrow cone, or “pencil beam,” sothat we can concentrate the energy in a small spot andmake both vertical and horizontal measurements of the
Figure 12-3.-Energy waves represented as concentric arcs inn a radar beam.
12-2
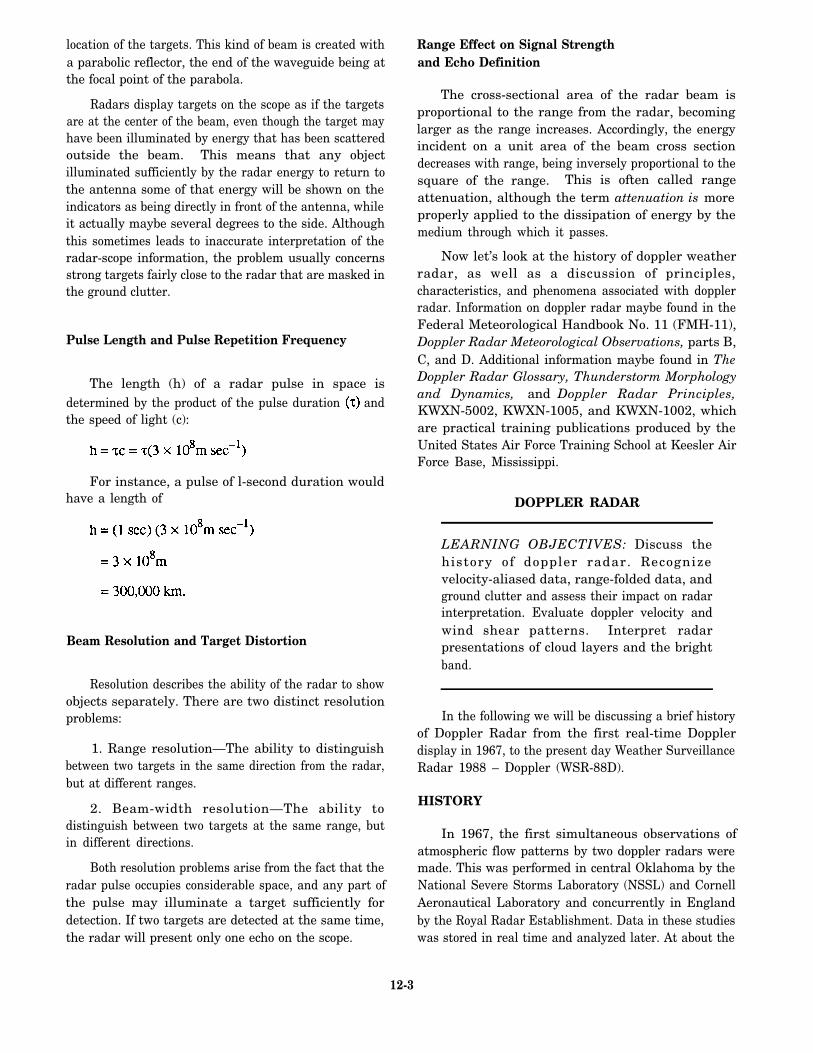
location of the targets. This kind of beam is created witha parabolic reflector, the end of the waveguide being atthe focal point of the parabola.
Radars display targets on the scope as if the targetsare at the center of the beam, even though the target mayhave been illuminated by energy that has been scatteredoutside the beam. This means that any objectilluminated sufficiently by the radar energy to return tothe antenna some of that energy will be shown on theindicators as being directly in front of the antenna, whileit actually maybe several degrees to the side. Althoughthis sometimes leads to inaccurate interpretation of theradar-scope information, the problem usually concernsstrong targets fairly close to the radar that are masked inthe ground clutter.
Pulse Length and Pulse Repetition Frequency
The length (h) of a radar pulse in space isdetermined by the product of the pulse duration andthe speed of light (c):
For instance, a pulse of l-second duration wouldhave a length of
Beam Resolution and Target Distortion
Resolution describes the ability of the radar to showobjects separately. There are two distinct resolutionproblems:
1. Range resolution—The ability to distinguishbetween two targets in the same direction from the radar,but at different ranges.
2. Beam-width resolution—The ability todistinguish between two targets at the same range, butin different directions.
Both resolution problems arise from the fact that theradar pulse occupies considerable space, and any part ofthe pulse may illuminate a target sufficiently fordetection. If two targets are detected at the same time,the radar will present only one echo on the scope.
Range Effect on Signal Strengthand Echo Definition
The cross-sectional area of the radar beam isproportional to the range from the radar, becominglarger as the range increases. Accordingly, the energyincident on a unit area of the beam cross sectiondecreases with range, being inversely proportional to thesquare of the range. This is often called rangeattenuation, although the term attenuation is moreproperly applied to the dissipation of energy by themedium through which it passes.
Now let’s look at the history of doppler weatherradar, as well as a discussion of principles,characteristics, and phenomena associated with dopplerradar. Information on doppler radar maybe found in theFederal Meteorological Handbook No. 11 (FMH-11),Doppler Radar Meteorological Observations, parts B,C, and D. Additional information maybe found in TheDoppler Radar Glossary, Thunderstorm Morphologyand Dynamics, and Doppler Radar Principles,KWXN-5002, KWXN-1005, and KWXN-1002, whichare practical training publications produced by theUnited States Air Force Training School at Keesler AirForce Base, Mississippi.
DOPPLER RADAR
LEARNING OBJECTIVES: Discuss thehistory of doppler radar. Recognizevelocity-aliased data, range-folded data, andground clutter and assess their impact on radarinterpretation. Evaluate doppler velocity andwind shear patterns. Interpret radarpresentations of cloud layers and the brightband.
In the following we will be discussing a brief historyof Doppler Radar from the first real-time Dopplerdisplay in 1967, to the present day Weather SurveillanceRadar 1988 – Doppler (WSR-88D).
HISTORY
In 1967, the first simultaneous observations ofatmospheric flow patterns by two doppler radars weremade. This was performed in central Oklahoma by theNational Severe Storms Laboratory (NSSL) and CornellAeronautical Laboratory and concurrently in Englandby the Royal Radar Establishment. Data in these studieswas stored in real time and analyzed later. At about the
12-3

same time, the first real-time doppler radar display, ThePlan Shear Indicator, was developed by the Air ForceCambridge Research Laboratories.
In the early 1970s, a unique new class ofhigh-powered, sophisticated S-band doppler weatherradar appeared, incorporating integrated circuitry andadvanced computer processing. Two were built by theNSSL. Others were built by the National Center forAtmospheric Research and by the University of Chicagoin cooperation with the Illinois State Water Survey inChampaign, Illinois. By the mid 1970s, technologicaladvances allowed real-time processors to be linked tocolor displays.
Joint Doppler Operations Project (JDOP)
Studies conducted by NOAA EnvironmentalResearch Laboratories for the National Weather Service(NWS) during 1975 and 1976 showed that it was notfeasible to convert existing network radars to suitabledoppler systems. As a result, the historic Joint DopplerOperations Project (JDOP) was conducted from 1977 to1979 at the NSSL by the Air Force, the Federal AviationAdministration (FAA), and the NWS. This was the truebirthplace of the WSR-88D.
JDOP demonstrated the meteorological utility ofoperational doppler radars and also benchmarked theengineering requirements for the NEXRAD. TheNEXRAD program formally began with theestablishment of the Joint System Program Office(JSPO) at NWS headquarters in 1979. Since this time,NEXRAD has been officially renamed the (WSR-88D).
A detailed discussion of the WSR-88D PUP and itscapabilities is beyond the scope of this text. For adetailed discussion of capabilities and proceduresrefer to the technical manual, Operation InstructionsPrinc ipal User Processor (PUP) Group/Doppler Meteoro log ical Radar WSR-88D,NAV EM400-AF-OPI-010/WSR-88D.
We will now discuss velocity-aliased data, followedby a discussion on it’s recognition.
VELOCITY ALIASED DATA
Doppler radar uses the change in frequency betweenthe outgoing signal and the returning signal (dopplershift) to determine radar velocities. However,limitations in velocity measurements do exist. We nowwill take a look at an example to see what can go wrong.
Trains are designed to go as fast forward as inreverse. The speedometer shows both forward andreverse speed. Refer to figure 12-4 throughout thisdiscussion. Direct reading of speeds between 0-49 mph,whether forward or reverse is quite easy. As with atrain’s speedometer, radar has limits to speeds that it canmeasure without error. These speeds that can bemeasured without error are known as UnambiguousVelocities.
In part (a), the train is traveling at 40 mph in aforward direction. The speedometer indicates thecorrect speed. In part (b), the speed of the train hasincreased by 20 mph, so that the train is now travelingat 60 mph, but, the speedometer indicates 40 mph inreverse. The maximum forward speed was exceeded on
Figure 12-4.-Speedometer.
12-4

the speedometer, therefore, speeds of 0-49 mph areunambiguous. Radar speeds that exceed the maximumunambiguous velocity are said to be aliased, andreferred to as aliased velocities.
Velocity aliasing occurs when frequencies too highto be analyzed with the given sampling interval appearas a frequency less than the Nyquist frequency (thehighest frequency that can be determined in data that hasbeen sampled). In other words, wind speed greater thanthe unambiguous velocity (Nyquist co-interval [theentire range of detectable velocities]) for the currentpulse repetition frequency (PRF) are wrapped aroundinto the incorrect Nyquist co-interval. A sophisticatedvelocity-dealiasing technique is implemented in theWSR-88D (referenced in part D of the FMH-11),However, it is expected that improperly dealiased datawill occasionally occur.
Recognition of Velocity-Aliased Data
Data that are incorrectly dealiased can be difficultto ascertain. However, understanding the limitations ofthe algorithm should help to recognize improperlydealiased data.
If the suspected data is in an area isolated from otherdata and there is a large variation in the subsynoptic ormesoscale wind field, the algorithm may not be able toinitially assign the correct velocity. Other instances ofincorrect dealiasing may occur when there are shifts inthe inward- and outward-bound velocities along theradials of data that do not fit those allowed by thealgorithm. In these cases, the actual values maybe offby a factor of twice the unambiguous velocity of the PRFin use at the time. Typical unambiguous velocities forthe WSR-88D, in the Precipitation mode, range from 40to 60 kts. Occasionally, groupings of data appear alonga small set of ranges that could not be successfullydealiased. These should be obvious.
Assessing Impacts of Velocity Aliasing
Incorrectly dealiased velocity data can seriouslyimpact certain WSR-88D algorithms and products.Mean Radial Velocity products will be difficult toanalyze when contaminated with incorrectly dealiaseddata. To determine the extent of the dealiasing problem,it is recommended that earlier displays of these productsbe examined to determine if there is time or spacecontinuity. In addition, other elevation angles of theMean Radial Velocity products may be used todetermine if there is vertical continuity.
Algorithms and products that ingest mean radialvelocity data can output incorrect results when such dataare used. In the case of the mesocyclone detectionalgorithm, there will likely be a lack of verticalcontinuity of incorrectly dealiased data. Consequently,only uncorrelated shears should result from usingaliased data. In the rare event of a tornadic vortexsignature being output in the vicinity of an identifiedmesocyclone because of vertical continuity ofincorrectly dealiased data, other products should beexamined to verify the existence of a severethunderstorm.
It is expected that incorrectly dealiased data will nothave a large impact on Combined Shear productsbecause of the amount of averaging of data done by thealgorithm.
RANGE-FOLDED DATA
Second trip echoes (range folding) occurs when theradar hears a previous pulse, while listening for the mostrecent pulse.
Due to the sensitivity and narrow beam width of theWSR-88D, precipitation echoes beyond 250 nmi willoccasional y appear in closer range due to range folding.However, far more significant are the range ambiguitiesin the doppler velocity and width fields caused by theWSR-88D’S pulsed doppler sampling interval(referenced in part B of the FMH-11). For any pulseddoppler system, the product of the unambiguous rangeand the doppler Nyquist interval is a constant functionof the wavelength of the radar and the speed of light.Decreasing the PRF allows for a longer listening time,thus increasing the unambiguous range, but, this lowerPRF creates a problem in determining radial velocities.
THE DOPPLER DILEMMA
High PRFs are required for high velocitymeasurements and low PRFs are required for longranges. The solution to this dilemma lies in finding abalance between the effects of velocity aliasing andrange folding. This dilemma is caused by physicalrestrictions based on the laws of nature. To solve thisdilemma, the WSR-88D will use several methods towork around these restrictions. One method is tooperate at variable PRFs; the second is to collectrefractivity information at low PRFs and velocityinformation at high PRFs. The two sets of informationcollected are compared, then processed to estimate trueradial velocities and ranges.
12-5

The radar interprets velocity and spectrum widthreturns from beyond the ambiguous range as occurringwithin the range. Range dealiasing software has beenimplemented in the Radar Data Acquisition (RDA)component preprocessor. The purpose is to attempt toreplace range-folded doppler data to its proper range.This software compares radar power returns from thepossible ranges of doppler velocity and spectrum widthdata, If the power at one possible range is more than thepower at the other ranges, the data are assigned to thatrange and the doppler data from the other ranges areconsidered ambiguous. If the power from the differentcringes is within 10 dB, the doppler data at all thoseranges are considered unambiguous. Ambiguousdoppler data are flagged as range folded, treated asmissing by all algorithms, and are displayed as purple(adaptable) at the principal user processor (PUP).
Recognition of Range-Folded Data
Range-folded data should be easily recognized in aReflectivity product. Range-folded data have a “spiky”appearance in the radials where they appear. Inaddition, the reflectivity values where the data arefolded will not be similar to those surrounding them.
Range-folded data are detectable by comparingReflectivity and Mean Radial Velocity products, as wellas comparing current displays with previous productsfor time and space continuity.
Range folding may occur under conditions ofanomalous propagation where the radar beam isconstrained to follow a path close to the Earth’s surface,or when strong convection occurs beyond the first trip(250 nmi).
When possible, the range dealiasing software willplace the doppler velocity and spectrum width data atthe proper range. When this software cannot determinethe proper range, the data will be flagged and displayedas range folded.
Assessing the Impact of Range-Folded Data
Range-folded data can impact products andalgorithms that use reflectivity data. Whenrange-folded data are present, corrupted data aredisplayed with valid data. Products using multiplereflectivity scans may be affected as well.
The impact of doppler velocity and spectrum widthrange folding is significant, both in the radar’sunambiguous range limits and in areas of significantvelocity data lost due to ambiguous returns. In addition,
range ambiguous values are treated as missing by thevelocity-based algorithms and can, therefore, seriouslyimpact those algorithms.
Assessing Impacts of Range-Folded Data onVelocity Products
The presence of range-folded (overlaid) data onMean Radial Velocity products is inevitable. Theinability to determine velocity estimates for the samplevolumes results from the inability of the range unfoldingalgorithm to distinguish between power returns fromtwo or more sample volumes at the same relativelocation within different trips. Therefore, valid velocityestimates can be derived for only one correspondingsample volume along each radial, The ring ofrange-folded (overlaid) data at the beginning of thesecond and subsequent trips is caused by the first tripground clutter and is a common result of this rangeunfolding limitation.
NON-METEOROLOGICAL RADARECHOES
This section will briefly describe methods ofidentifying and assessing the impacts of ground clutter,anomalous propagation, sidelobes, and solar effects.
Ground Clutter
Prior to calculation of reflectivity, velocity, orspectrum width, return signals from ranges within theradar’s normal ground clutter pattern are processed toremove most of the signal returned from targets that arestationary (part B of the FMH-11). The portion of signalnot removed, called residual clutter, will remain as partof many of the products.
RECOGNITION OF RESIDUAL GROUNDCLUTTER.— A low-elevation Reflectivity productwill show ground clutter close to the radar or distantmountainous terrain, It will normally appear as a clusterof points (having a speckled nature) or as a large area ofcontiguous returns. Errors are recognizable as wedgeshaving sharp radial discontinuities from adjacentregions and whose predominant colors differ markedly.Errors may also appear as radial spikes several volumesamples in length, whose velocities are shifted towardhigh positive or negative values. A time lapse ofReflectivity products will show no movement of thesereturns. With increasing antenna elevations, groundclutter returns will disappear. Generally, meanvelocities will be near zero and spectrum widths will bevery narrow.
12-6
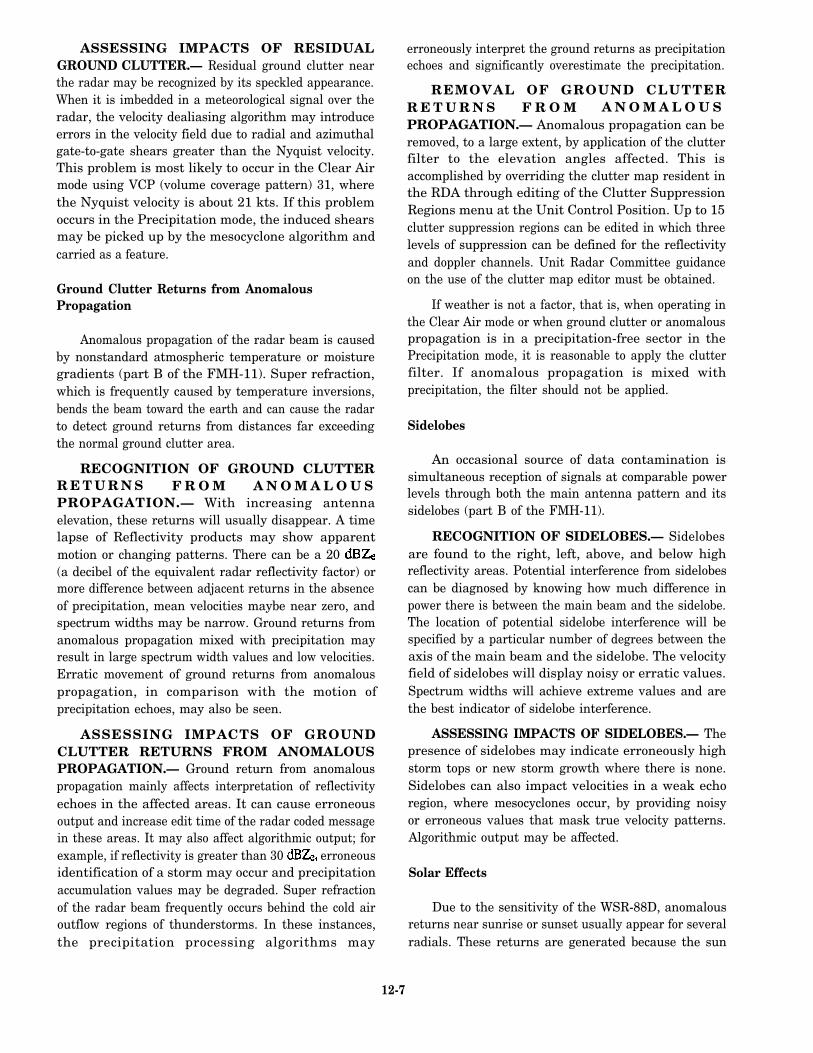
ASSESSING IMPACTS OF RESIDUALGROUND CLUTTER.— Residual ground clutter nearthe radar may be recognized by its speckled appearance.When it is imbedded in a meteorological signal over theradar, the velocity dealiasing algorithm may introduceerrors in the velocity field due to radial and azimuthalgate-to-gate shears greater than the Nyquist velocity.This problem is most likely to occur in the Clear Airmode using VCP (volume coverage pattern) 31, wherethe Nyquist velocity is about 21 kts. If this problemoccurs in the Precipitation mode, the induced shearsmay be picked up by the mesocyclone algorithm andcarried as a feature.
Ground Clutter Returns from AnomalousPropagation
Anomalous propagation of the radar beam is causedby nonstandard atmospheric temperature or moisturegradients (part B of the FMH-11). Super refraction,which is frequently caused by temperature inversions,bends the beam toward the earth and can cause the radarto detect ground returns from distances far exceedingthe normal ground clutter area.
RECOGNITION OF GROUND CLUTTERR E T U R N S F R O M A N O M A L O U SPROPAGATION.— With increasing antennaelevation, these returns will usually disappear. A timelapse of Reflectivity products may show apparentmotion or changing patterns. There can be a 20(a decibel of the equivalent radar reflectivity factor) ormore difference between adjacent returns in the absenceof precipitation, mean velocities maybe near zero, andspectrum widths may be narrow. Ground returns fromanomalous propagation mixed with precipitation mayresult in large spectrum width values and low velocities.Erratic movement of ground returns from anomalouspropagation, in comparison with the motion ofprecipitation echoes, may also be seen.
ASSESSING IMPACTS OF GROUNDCLUTTER RETURNS FROM ANOMALOUSPROPAGATION.— Ground return from anomalouspropagation mainly affects interpretation of reflectivityechoes in the affected areas. It can cause erroneousoutput and increase edit time of the radar coded messagein these areas. It may also affect algorithmic output; forexample, if reflectivity is greater than 30 erroneousidentification of a storm may occur and precipitationaccumulation values may be degraded. Super refractionof the radar beam frequently occurs behind the cold airoutflow regions of thunderstorms. In these instances,the precipitation processing algorithms may
erroneously interpret the ground returns as precipitationechoes and significantly overestimate the precipitation.
REMOVAL OF GROUND CLUTTERR E T U R N S F R O M A N O M A L O U SPROPAGATION.— Anomalous propagation can beremoved, to a large extent, by application of the clutterfilter to the elevation angles affected. This isaccomplished by overriding the clutter map resident inthe RDA through editing of the Clutter SuppressionRegions menu at the Unit Control Position. Up to 15clutter suppression regions can be edited in which threelevels of suppression can be defined for the reflectivityand doppler channels. Unit Radar Committee guidanceon the use of the clutter map editor must be obtained.
If weather is not a factor, that is, when operating inthe Clear Air mode or when ground clutter or anomalouspropagation is in a precipitation-free sector in thePrecipitation mode, it is reasonable to apply the clutterfilter. If anomalous propagation is mixed withprecipitation, the filter should not be applied.
Sidelobes
An occasional source of data contamination issimultaneous reception of signals at comparable powerlevels through both the main antenna pattern and itssidelobes (part B of the FMH-11).
RECOGNITION OF SIDELOBES.— Sidelobesare found to the right, left, above, and below highreflectivity areas. Potential interference from sidelobescan be diagnosed by knowing how much difference inpower there is between the main beam and the sidelobe.The location of potential sidelobe interference will bespecified by a particular number of degrees between theaxis of the main beam and the sidelobe. The velocityfield of sidelobes will display noisy or erratic values.Spectrum widths will achieve extreme values and arethe best indicator of sidelobe interference.
ASSESSING IMPACTS OF SIDELOBES.— Thepresence of sidelobes may indicate erroneously highstorm tops or new storm growth where there is none.Sidelobes can also impact velocities in a weak echoregion, where mesocyclones occur, by providing noisyor erroneous values that mask true velocity patterns.Algorithmic output may be affected.
Solar Effects
Due to the sensitivity of the WSR-88D, anomalousreturns near sunrise or sunset usually appear for severalradials. These returns are generated because the sun
12-7

radiates energy in the same microwave region of theelectromagnetic spectrum that is used by the WSR-88D.
RECOGNITION OF SOLAR EFFECTS.— Theseechoes may be expected to appear as continuousreturns, in a narrow “baseball bat” shape, out one ortwo radials at the solar attitude. Reflectivity valuesgenerally range between 10 and 20 dBZe. See figure12-5. Solar effects will appear for one or two volumescans at a single elevation of the Reflectivity, MeanRadial Velocity, or Spectrum Width product and up to30 min on a Composite Reflectivity product.
ASSESSING IMPACTS OF SOLAREFFECTS.— In the absence of other echoes, typicalreflectivity values from solar effects are from near zerodBZe in close to the radar, to 20 dBZe or higher at 250nmi. The apparent reduction in the sun’s signal nearerthe radar is due to the range normalization correctionapplied to reflectivity. The velocity and spectrum widthfields indicate range-aliased data out to the maximumrange of these products, that is, 124 nmi. OtherReflectivity-derived products that will show this
contamination are the Echo Tops, CompositeReflectivity, and Layer Composite Reflectivity. TheStorm Series algorithms will generally not be affectedsince the reflectivity values are below the thresholdsused to detect storms.
Velocity-derived products that will be contaminatedare the Storm Relative Mean Radial Velocity Map, andRegion. At longer ranges, the contaminated radial maydisrupt pattern vectors used to identify circulations inthe mesocyclone algorithm, where the sun’s signal isstronger than the corresponding storm echo. At close-inranges, the sun’s signal is too weak to impact theTornadic Vortex Signature algorithm.
The solar effects can also cause erroneous outputand increase edit time of the radar-coded message inthese areas.
INTERPRETATION OF DOPPLERVELOCITY PATTERNS
Although a single doppler radar observes only thecomponent of the wind in a radial direction from the
Figure 12-5.-Streaks of low reflectivity extending outward for two radials to the northeast of the radarcaused by solar effects.
12-8

radar, a wide variety of weather features of greatimportance can be identified. It is beyond the scope ofthis manual to describe the interpretation of dopplervelocity patterns. For a detailed explanation of theinterpretation of doppler velocity patterns refer to theFMH-11 (part B).
MESOCYCLONE SIGNATURE DETECTION
Mesocyclones have been found to be precursors tomany tornadoes. They generally have a core diameterof 1.5 to 5 nmi, maximum tangential velocities of 40 ktsor greater, and time and height continuity. Previousdoppler experiments have found that weak mesocyclonesignatures generally result in severe thunderstorms.Stronger signatures generally produce tornadoes,especially if a tornadic vortex signature is present.
If an alert is received that a mesocyclone exists, orif there is no alert, but a mesocyclone is suspected, thereare several products that can be used to confirm itspresence. These products and how they might be usedare discussed in the following paragraphs.
Recognition of a Mesocyclone Signature
A mesocyclone typically will develop at themidlevels of a tomadic storm and build down to lowerlevels as the storm matures. It may be possible tomonitor development of storm rotation or amesocyclone in the velocity field. The time lapsecapability with continuous update may be useful inmonitoring this development. In the velocity field, thefeature will appear as two velocity peaks of oppositesigns, separated azimuthally.
Interrogation of different elevation scans of theMean Radial Velocity product (at 2000 ft intervalsbetween 15,000 and 19,000 ft) can aid in determiningthe height continuity of a mesocyclone. The QuarterScreen mode can be useful for this purpose.
If correctly oriented through the storm, stormrotation (cyclonic or anticyclonic) or a well-developedmesocyclone may be evident in the Mean RadialVelocity Cross Section product. The cross sectionshould be generated perpendicular to the mean flow. Ifa mesocyclone is not evident in the Mean RadialVelocity product or the Severe Weather Analysis MeanRadial Velocity product, the Storm Relative MeanRadial Velocity Map or Region products may displaythis feature (part C of the FMH-11).
Removing the storm motion may aid in the detectionof a mesocyclone, but the mesocyclone circulation
pattern will exist in the velocity field even if the stormmotion is not removed.
In the presence of a strong rotational signature, theCombined Moment product can be very useful indetermining the existence of a mesocyclone. In such acase, rotational phenomena should be clearly evidentdue to the relative position of the arrows in a given area.In addition, high reflectivity core and high spectrumwidth values may be evident in the area.
In a tornadic supercell, doppler data have indicatedthat a separation of the mesocyclone core from thebounded weak echo region occurs prior to or during thecollapse of the bounded weak echo region. With thedevelopment of severe weather possible at this stage, theseparation of the mesocyclone core from the boundedweak echo region may be monitored by displaying anappropriate Reflectivity product on one graphic screenand a Storm Relative Mean Radial Velocity Map producton the other. A time lapse of the Mean Radial Velocityor Storm Relative Mean Radial Velocity Map product,magnified on the storm under investigation, may provevery useful in determining the separation of themesocyclone core from the bounded weak echo region.If a mesocyclone is evident in the Mean Radial Velocityproduct, this separation may be monitored using thetime lapse capability with continuous update for theMean Radial Velocity and Reflectivity products.
Considerations
The mesocyclone algorithm provides the positionof the feature reflected onto the lowest elevation anglein which the feature was detected. This is due to the factthat mesocyclones are often tilted and are, therefore,displaced at higher elevations. Mesocyclones may notalways be identified by the algorithm for highreflectivity core storms, for storms that producedownbursts, or for weak tornadoes produced as a resultof convergence boundaries. Since there is no trackingalgorithm for mesocyclone features, time continuitymust be established. In addition, the Storm RelativeMean Radial Velocity Map and Region products displaythe maximum velocity sampled over four 0.13 nmirange bins. The peak velocity values, and thus the peakshear associated with a mesocyclone feature, are morelikely to be displayed on these products than on theMean Radial Velocity product, which simply displaysevery fourth 0.13 nmi range bin at the same resolution.
Depending upon selection of storm motion removal,the existence of a mesocyclone may be more evident inthe Storm Relative Mean Radial Velocity Map and
12-9

Region products than in the Mean Radial Velocityproduct.
Due to beam broadening and an averagemesocyclone size of 2.7 nmi, the range of detection isgenerally limited to about 124 nmi. Mesocyclonesformed in vertical wind shear may not be detectedbeyond 38 nmi due to the small size vorticity maximumfound at low levels, and initial formation in aprecipitation-free environment.
Multiple mesocyclone cores can form within astorm complex, but not in the same cell.
WIND SHEAR
A major hazard to aviation is the presence oflow-level wind shear. Wind shear may result from avariety of phenomena such as synoptic fronts,boundaries associated with thunderstorms, terrain, andnocturnal inversions.
Recognition of Wind Shear
Wind shear will appear as a discontinuity in thedoppler velocity field and is frequently associated withwide spectrum widths. Monitoring changes in thevelocity field over time is likely the best approach torecognition of wind shear phenomena. Low-level windshear can be detected close to the radar in the MeanRadial Velocity product. An indication of extreme shearwill show up in a narrow band in the velocity field. Thisnarrow band will likely not be identified in the VelocityAzimuth Display Wind Profile product. However, thisproduct can be useful in keeping track of significantwind speed and direction changes within about 16 nmiof the radar and provide an indication of shear in thevertical.
Variations in the spectrum width field are related tothe mean wind shear across the radar beam; therefore, ashear layer(s) will usually show up as an enhanced areain the Spectrum Width product. Values of 14 kts, orhigher, are usually associated with significant windshear or turbulence, or both.
Considerations
The Combined Shear product could be useful forthe detection of areas affected by strong wind shear. Theproduct, however, tends to be “noisy” and, in theabsence of strong signatures, may be of little use. Theproduct does not take vertical shear into account. Forindications of shear in the vertical, the Mean Radial
Velocity or Spectrum Width Cross Section products maybe useful.
CLOUD LAYERS
The sensitivity of the WSR-88D provides the userthe capability of detecting cloud layers. Thisinformation has application to such things as aviationforecasting and forecasting the evolution ofprecipitation.
The WSR-88D can detect large ice crystals that arepresent in middle and high-level clouds. Thesereflectivities may range as high as plus 20 TheVelocity Azimuth Display algorithm will use dopplervelocity measurements from middle and high levelclouds to generate profiles into the middle atmosphere.These wind profiles allow the operator to monitor themovement of synoptic and smaller scale waves andtroughs.
Recognition of Cloud Layers
With the high sensitivity of the WSR-88D, it ispossible to obtain reflectivity estimates of elevatedclouds, which generally reflect at levels between minus12 to plus 5
The depth of cloud layers maybe inferred from twoprocesses. A four-panel display of the Reflectivityproduct for successively higher elevation scans canprovide information on the depth as well as the structureof a layer. The top of a cloud layer and its depth can alsobe inferred from a Reflectivity Cross Section product,depending on the distance from the radar and theviewing angle. However, resolution is better with theReflectivity product than the Cross Section productsince the cross section integrates returns from thesurface to 70,000 ft.
The following is a technique that will allow thedetermination of the top, base, and depth of a cloudlayer. Using the Reflectivity product for the elevationthat intersects the cloud layer, place the cursor at thepoint where the base appears to be and get a readout onthe screen of azimuth, range, elevation, and height.Then, place the cursor at the apparent top of the cloudlayer and get the same information. The depth can becomputed from the difference in heights. If the cloudbase or top is not uniform, this technique will have to berepeated several times to get average heights andthicknesses. This will also help ensure that the trueradar cloud top and base are being observed.
12-10
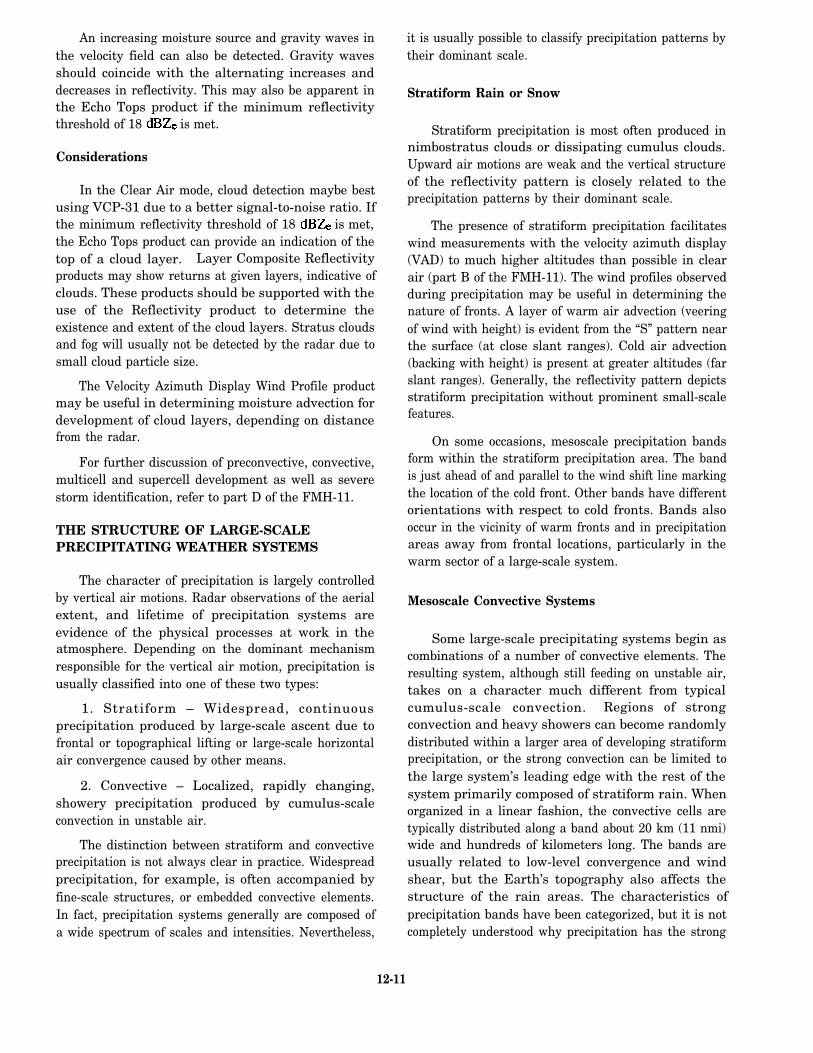
An increasing moisture source and gravity waves inthe velocity field can also be detected. Gravity wavesshould coincide with the alternating increases anddecreases in reflectivity. This may also be apparent inthe Echo Tops product if the minimum reflectivitythreshold of 18 is met.
Considerations
In the Clear Air mode, cloud detection maybe bestusing VCP-31 due to a better signal-to-noise ratio. Ifthe minimum reflectivity threshold of 18 is met,the Echo Tops product can provide an indication of thetop of a cloud layer. Layer Composite Reflectivityproducts may show returns at given layers, indicative ofclouds. These products should be supported with theuse of the Reflectivity product to determine theexistence and extent of the cloud layers. Stratus cloudsand fog will usually not be detected by the radar due tosmall cloud particle size.
The Velocity Azimuth Display Wind Profile productmay be useful in determining moisture advection fordevelopment of cloud layers, depending on distancefrom the radar.
For further discussion of preconvective, convective,multicell and supercell development as well as severestorm identification, refer to part D of the FMH-11.
THE STRUCTURE OF LARGE-SCALEPRECIPITATING WEATHER SYSTEMS
The character of precipitation is largely controlledby vertical air motions. Radar observations of the aerialextent, and lifetime of precipitation systems areevidence of the physical processes at work in theatmosphere. Depending on the dominant mechanismresponsible for the vertical air motion, precipitation isusually classified into one of these two types:
1. Stratiform – Widespread, continuousprecipitation produced by large-scale ascent due tofrontal or topographical lifting or large-scale horizontalair convergence caused by other means.
2. Convective – Localized, rapidly changing,showery precipitation produced by cumulus-scaleconvection in unstable air.
The distinction between stratiform and convectiveprecipitation is not always clear in practice. Widespreadprecipitation, for example, is often accompanied byfine-scale structures, or embedded convective elements.In fact, precipitation systems generally are composed ofa wide spectrum of scales and intensities. Nevertheless,
it is usually possible to classify precipitation patterns bytheir dominant scale.
Stratiform Rain or Snow
Stratiform precipitation is most often produced innimbostratus clouds or dissipating cumulus clouds.Upward air motions are weak and the vertical structureof the reflectivity pattern is closely related to theprecipitation patterns by their dominant scale.
The presence of stratiform precipitation facilitateswind measurements with the velocity azimuth display(VAD) to much higher altitudes than possible in clearair (part B of the FMH-11). The wind profiles observedduring precipitation may be useful in determining thenature of fronts. A layer of warm air advection (veeringof wind with height) is evident from the “S” pattern nearthe surface (at close slant ranges). Cold air advection(backing with height) is present at greater altitudes (farslant ranges). Generally, the reflectivity pattern depictsstratiform precipitation without prominent small-scalefeatures.
On some occasions, mesoscale precipitation bandsform within the stratiform precipitation area. The bandis just ahead of and parallel to the wind shift line markingthe location of the cold front. Other bands have differentorientations with respect to cold fronts. Bands alsooccur in the vicinity of warm fronts and in precipitationareas away from frontal locations, particularly in thewarm sector of a large-scale system.
Mesoscale Convective Systems
Some large-scale precipitating systems begin ascombinations of a number of convective elements. Theresulting system, although still feeding on unstable air,takes on a character much different from typicalcumulus-scale convection. Regions of strongconvection and heavy showers can become randomlydistributed within a larger area of developing stratiformprecipitation, or the strong convection can be limited tothe large system’s leading edge with the rest of thesystem primarily composed of stratiform rain. Whenorganized in a linear fashion, the convective cells aretypically distributed along a band about 20 km (11 nmi)wide and hundreds of kilometers long. The bands areusually related to low-level convergence and windshear, but the Earth’s topography also affects thestructure of the rain areas. The characteristics ofprecipitation bands have been categorized, but it is notcompletely understood why precipitation has the strong
12-11

tendency to become organized into the characteristicscales and patterns that are observed.
Precipitation areas can be grouped into categories
of size and lifetime. Observations show that synopticareas that are larger than 29,000 have lifetimes ofone day or longer; large mesoscale areas that range from2,900 to 29,000 last several hours; small mesoscaleareas that cover 54 to 216 last about an hour; andelements that are about 5.4 in size usually last nolonger than half an hour. Although the smallestelements have the highest rain rates, the majorcontribution to the total rainfall over large areas comesfrom the small and large mesoscale features.
The Mesoscale Convective System (MCS) includesall precipitation systems 11 to 270 nmi wide that containdeep convection. Examples in middle-latitudes arelarge isolated thunderstorms, squall lines, MesoscaleConvective Complexes (MCCs), and rainbands. Theaerial extent of these systems is generally too large tobe covered by a single radar. Examinations ofcomposite maps from a network of radars is required tocapture the full extent of most MCSs.
Refer to part B of the FMH-11 for further discussion
of mesoscale convective systems.
THE BRIGHT BAND
In stratiform precipitation where lower portions ofthe echo are at above freezing temperatures, a thin layerof relatively high reflectivity (bright band) is oftenobserved just below the level of 0°C. As snowflakesdescend into this layer, they begin to melt and sticktogether. The radar reflectivity of the large wetsnowflakes is higher, principally because of their largesize and because the dielectric constant of water exceedsthat of ice by a factor of five. Descending further belowthe bright band, the snowflakes become more compact,break up, and become raindrops. The raindrops fallfaster than snowflakes so their concentration in space isdiminished. This decrease in size and number densityof hydrometers accounts for the lower reflectivity justbelow the bright band.
The last section of this chapter will deal with theNext Generation Weather Radar (NEXRAD)program.
WEATHER SURVEILLANCE RADAR1988-DOPPLER (WSR-88D)
LEARNING OBJECTIVES: Recognize criteriafor the three groups of alert thresholds.Understand data access procedures for theWSR-88D. Be familiar with the various userfunctions, as well as archiving procedures.
The following discussion will deal with weatherradar alert areas and thresholds, the editing and sendingof data, and the various user functions of the WSR-88D.
ALERT AREAS AND THRESHOLDS
Radar product generators (RPGs) can automaticallyissue alerts upon detection of user-specifiedmeteorological phenomena. Automated alerts relievethe operator ffom constantly monitoring the PrincipleUser Processor (PUP) for significant meteorologicalphenomena and allow automatic generation of pairedproducts when a particular phenomena occurs. Theforecaster determines various thresholds formeteorological phenomena. The PUP operator thenselects which phenomena and associated thresholdvalues to use, based upon local watch/warning criteria.
Alert Thresholds
Alert thresholds allow several individual PUPs toselect agency unique alert threshold criteria. Alertthreshold criteria are broken down into three groupspreset at the Unit Control Positions (UCPs):
1. Grid Group- Alert areas based on geographicalpoints or grid boxes that occur within a user-definedalert area. The first grid box within a defined alert areathat meets or exceeds a phenomena threshold triggersthe alert.
2. Volume Group – These are alerts occurringwithin a user-defined area requiring completion of avolume scan. Detection is based on meteorologicalphenomena meeting or exceeding an assigned thresholdor algorithm output. If there is more than one stormexceeding a category threshold in the same alert area,the alert triggers on the stronger storm.
3. Forecast Group – Alert categories with thisgroup are storm based only and are triggered whenphenomena is located in or forecast to enter an activealert area. This group is storm oriented (based on the
12-12
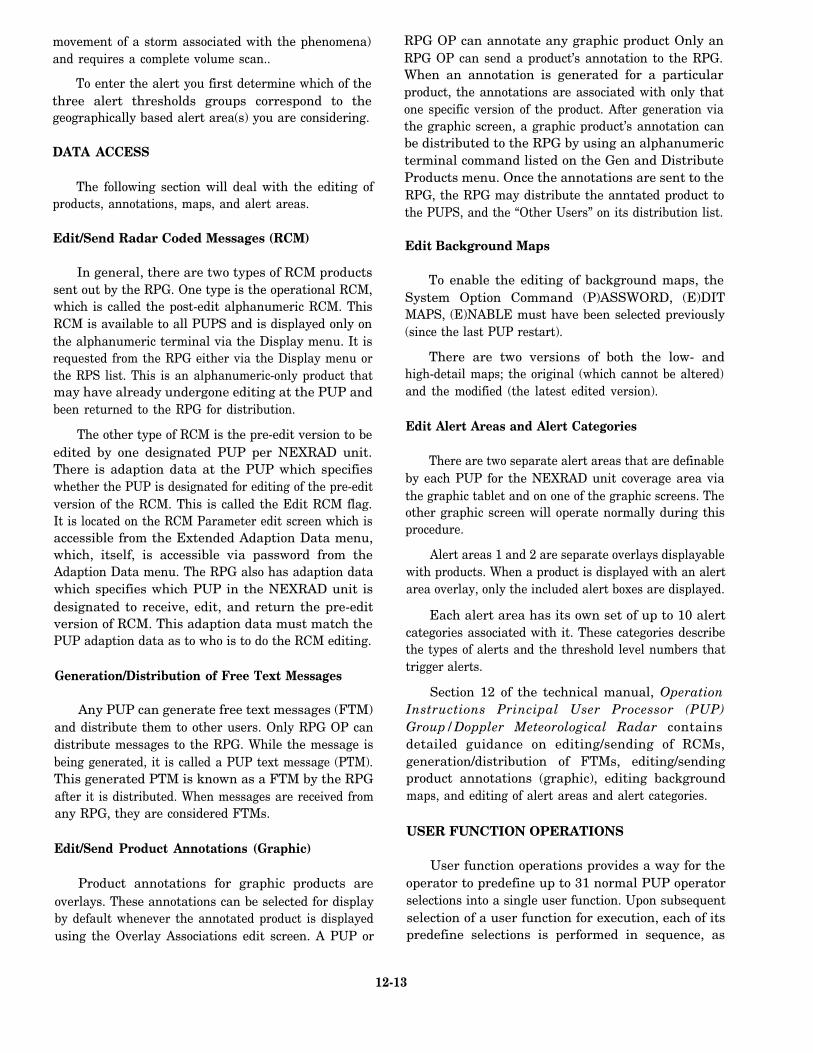
movement of a storm associated with the phenomena)and requires a complete volume scan..
To enter the alert you first determine which of thethree alert thresholds groups correspond to thegeographically based alert area(s) you are considering.
DATA ACCESS
The following section will deal with the editing ofproducts, annotations, maps, and alert areas.
Edit/Send Radar Coded Messages (RCM)
In general, there are two types of RCM productssent out by the RPG. One type is the operational RCM,which is called the post-edit alphanumeric RCM. ThisRCM is available to all PUPS and is displayed only onthe alphanumeric terminal via the Display menu. It isrequested from the RPG either via the Display menu orthe RPS list. This is an alphanumeric-only product thatmay have already undergone editing at the PUP andbeen returned to the RPG for distribution.
The other type of RCM is the pre-edit version to beedited by one designated PUP per NEXRAD unit.There is adaption data at the PUP which specifieswhether the PUP is designated for editing of the pre-editversion of the RCM. This is called the Edit RCM flag.It is located on the RCM Parameter edit screen which isaccessible from the Extended Adaption Data menu,which, itself, is accessible via password from theAdaption Data menu. The RPG also has adaption datawhich specifies which PUP in the NEXRAD unit isdesignated to receive, edit, and return the pre-editversion of RCM. This adaption data must match thePUP adaption data as to who is to do the RCM editing.
Generation/Distribution of Free Text Messages
Any PUP can generate free text messages (FTM)and distribute them to other users. Only RPG OP candistribute messages to the RPG. While the message isbeing generated, it is called a PUP text message (PTM).This generated PTM is known as a FTM by the RPGafter it is distributed. When messages are received fromany RPG, they are considered FTMs.
Edit/Send Product Annotations (Graphic)
Product annotations for graphic products areoverlays. These annotations can be selected for displayby default whenever the annotated product is displayedusing the Overlay Associations edit screen. A PUP or
RPG OP can annotate any graphic product Only anRPG OP can send a product’s annotation to the RPG.When an annotation is generated for a particularproduct, the annotations are associated with only thatone specific version of the product. After generation viathe graphic screen, a graphic product’s annotation canbe distributed to the RPG by using an alphanumericterminal command listed on the Gen and DistributeProducts menu. Once the annotations are sent to theRPG, the RPG may distribute the anntated product tothe PUPS, and the “Other Users” on its distribution list.
Edit Background Maps
To enable the editing of background maps, theSystem Option Command (P)ASSWORD, (E)DITMAPS, (E)NABLE must have been selected previously(since the last PUP restart).
There are two versions of both the low- andhigh-detail maps; the original (which cannot be altered)and the modified (the latest edited version).
Edit Alert Areas and Alert Categories
There are two separate alert areas that are definableby each PUP for the NEXRAD unit coverage area viathe graphic tablet and on one of the graphic screens. Theother graphic screen will operate normally during thisprocedure.
Alert areas 1 and 2 are separate overlays displayablewith products. When a product is displayed with an alertarea overlay, only the included alert boxes are displayed.
Each alert area has its own set of up to 10 alertcategories associated with it. These categories describethe types of alerts and the threshold level numbers thattrigger alerts.
Section 12 of the technical manual, OperationInstructions Principal User Processor (PUP)Group/Doppler Meteorological Radar containsdetailed guidance on editing/sending of RCMs,generation/distribution of FTMs, editing/sendingproduct annotations (graphic), editing backgroundmaps, and editing of alert areas and alert categories.
USER FUNCTION OPERATIONS
User function operations provides a way for theoperator to predefine up to 31 normal PUP operatorselections into a single user function. Upon subsequentselection of a user function for execution, each of itspredefine selections is performed in sequence, as
12-13

though they had been individually selected by theoperator. This feature is particularly useful for functionsequences that are time consuming and frequentlyperformed.
User functions may be linked to other user functionsat any sequence, or into a loop, so that they may runcontinuously until canceled. Time delays may be builtinto user functions to allow time for correct execution,operator observations, or prescheduled sequences.
Discussion of all PUP user functions are beyond thescope of this text. For a detailed discussion of userfunctions, time delays within user functions, end userfunction definitions, examining/editing user functions,executing user functions, and the canceling of userfunctions, refer to section 11 of the technical manual,Operation Instructions Principal User Processor(PUP) Group/Doppler Meteorological Radar.
STATUS AND ALERTS
There are two types of status and alerts: those thatare selected and those that are automatically displayed.
The 11 operator selected status options are asfollows:
1. NEXRAD Unit Status (operator selected andautomatic display)
2.
3.
4.
5.
6.
7.
8.
9.
10.
11.
Types of Products Available in PUP Data Base
Products in PUP Data Base (by ID number)
Earliest lime in PUP Data Base
RPG Products Available
Monitor Performance Display
System Status
Status of Archive
Communications Line Status
Status of Background Maps
Alert Status Display
All of these may be selected via the alphanumeric(S)TATUS or (M)ONITOR PERFORMANCEcommands. The NEXRAD unit status is also availableas a graphic display, selected from the graphic tablet.
Discussion of PUP status and alert functions arebeyond the scope of this text. For a detailed discussionof status and alert functions, refer to section 8 of thetechnical manual, Operation Instructions Principal
User Processor (PUP) Group/Doppler MeteorologicalRadar.
ARCHIVING DATA
All archive functions may be selected via thealphanumeric (A)RCHIVE menu. The archivefunctions are used to record to optical disk and recallfrom optical disk: products, received background maps,and status message data. Only one non-auto archivefunction may be performed at a time per archive device.Monitor performance data is recorded onto a streamertape rather than an optical disk.
PUP archived optical disks or RPG archived opticaldisks may be used at any PUP location. However, at aPUP or RPG, created optical disks can only be read, notwritten to. If archived products are to be read in byanother PUP associated with a different RPG, it ispossible to archive background maps with them. Thebackground maps must be requested from the RPG overthe dial-up communications line or read in from anoptical disk in order to be able to archive them.Optionally, the other PUP may have the necessary set ofmaps prestored on optical disk. When reading anarchive optical disk with products from another RPG,you must read the correct set of background maps offthis or another optical disk before the products can bedisplayed with maps. Maps for the associated RPG canbe read from optical disk into the associated backgroundmap file. Additionally, maps from up to threenon-associated RPGs can be read from optical disk andbe stored in auxiliary map files where they remain untilthey are replaced by retrieval of a selected map set fromoptical disk to a specified auxiliary map file.
Optical disks used in the Training mode are createdusing the write archive functions. If an optical disk isto be used for training, and the training is to beperformed at a different PUP site than where the opticaldisk was made, follow the instructions in the previousparagraph on using optical disks at other locations.
There are two types of archive devices associatedwith a PUP system, optical disk and streamer tape. Theoptical disk is the main archive device and is used forwriting to and retrieval from optical disk, backgroundmaps (received from an RPG over a dial-up line), statusmessages, and associated/auxiliary map sets. Thestreamer tape device is used only for the archive ofmonitor performance file data.
Discussion of archiving optical disk and tape usageis beyond the scope of this text. For a detaileddiscussion of archiving optical disk and tape usage, refer
12-14

to section 10 of the technical manual, OperationInstructions Principal User Processor (PUP)Group/Doppler Meteorological Radar.
SUMMARY
In this chapter, we first discussed nondoppler radarand the effects of wavelength and frequency on radarperformance. Next we looked at wavelengths forweather and cloud detection radars followed by anexamination of radar beam characteristics. A discussionof the development of Doppler radar was then presented,followed by an overview of the system’s characteristicsand many benefits. Some problems associated with
Doppler radar were also discussed. The last section of
this chapter dealt with principles of the WeatherSurveillance Radar (WSR-88D), including alert areasand thresholds, data access, user functions, status andalerts, and the archiving of data.
The practical training publications, The WSR-88DSystem Concepts, KWXN-1003, and WSR-88DProducts, KWXN-1004, produced by the United StatesAir Force Training School, Keesler Air Force Base,Mississippi, offer additional guidance and technicalreference for the WSR-88D system, concepts, andproducts.
12-15


![NEXRAD or WSR-88D [Next Generation Radar] [Weather Surveillance Radar, 1988, Doppler]](https://img.pdfslide.us/doc/110x75/56649caf5503460f9497246a/nexrad-or-wsr-88d-next-generation-radar-weather-surveillance-radar-1988.jpg)

