Embed Size (px)
Citation preview
N93-ISession IX. Terminal Doppler Weather Radar 485 t
The Orlando TDWR Testbed and Airborne Wind Shear Data Comparison Results
Dr. Steven Campbell, MIT Lincoln Laboratory
Anthony Berke, MIT Lincoln Laboratory
Michael Matthews, MIT Lincoln Laboratory
PRSGEDING _AC, E _I.ANK i"..'OT P!LMED.
811
https://ntrs.nasa.gov/search.jsp?R=19930005662 2018-07-01T22:57:09+00:00Z

zO,¢
,,o,,'_°rr_, >-n"
_ _o
On':EzOO._m o
rrnr---0 _
>_<_<_<_o_
m
TM
o)t.D
0aOr)
oOCOCO
CO 0
0_4"-'
812

Fourth Combined Manufacturers' and Technologists'
Airborne Wind Shear Review Meeting
April 14-16, 1992
Williamsburg, Virginia
"Orlando TDWR Testbed and Airborne Wind Shear Data Comparison Results"
Steven D. Campbell, Anthony J. Bcrke and Michael P. Matthews
Lincoln Laboratory
Massachusetts Institute of Technology
Lexington, Massachusetts, U.S.A.
Telephone: 617/981-3386, E-mail: [email protected]
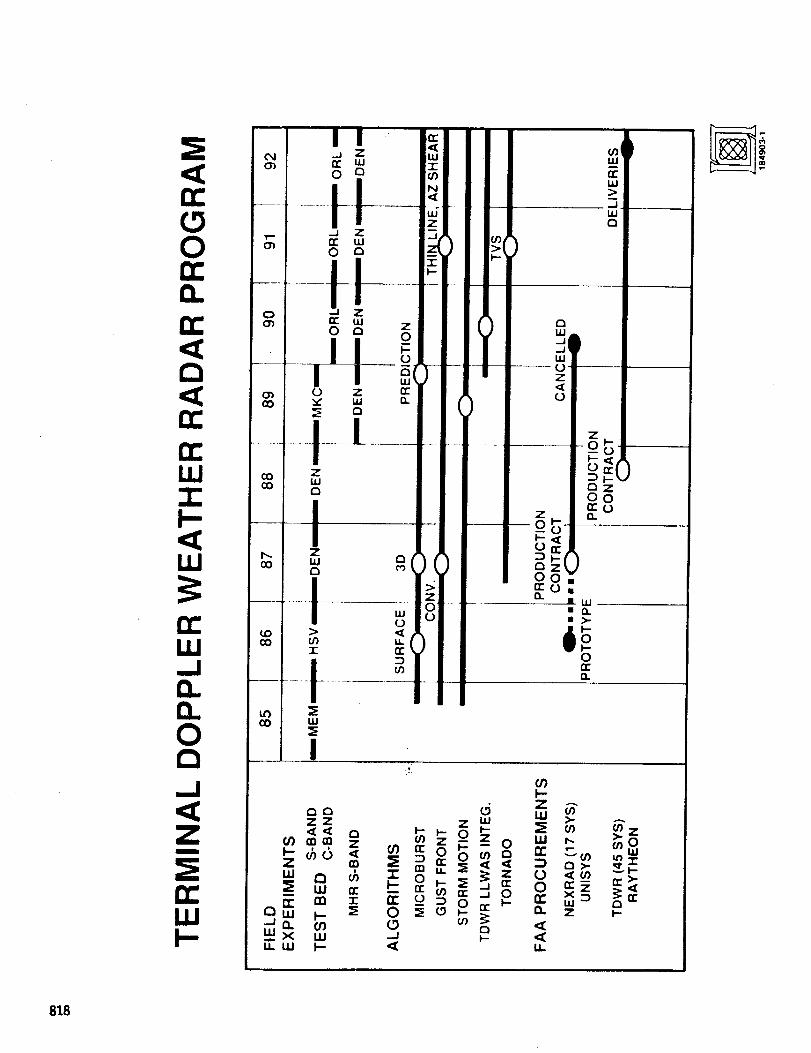
The focus of this talk is on comparing Terminal Doppler Weather Radar
(TDWR) and airborne wind shear data in computing a microburst hazard index
called the F factor. The TDWR is a ground-based system for detecting wind shearhazards to aviation in the terminal area. The Federal Aviation Administration will
begin deploying TDWR units near 45 airports in [ate 1992. As part of this develop-
ment effort, M.I.T. Lincoln 1,aboratory operates under F.A.A. support a TDWR
testbed radar in Orlando, F1,.
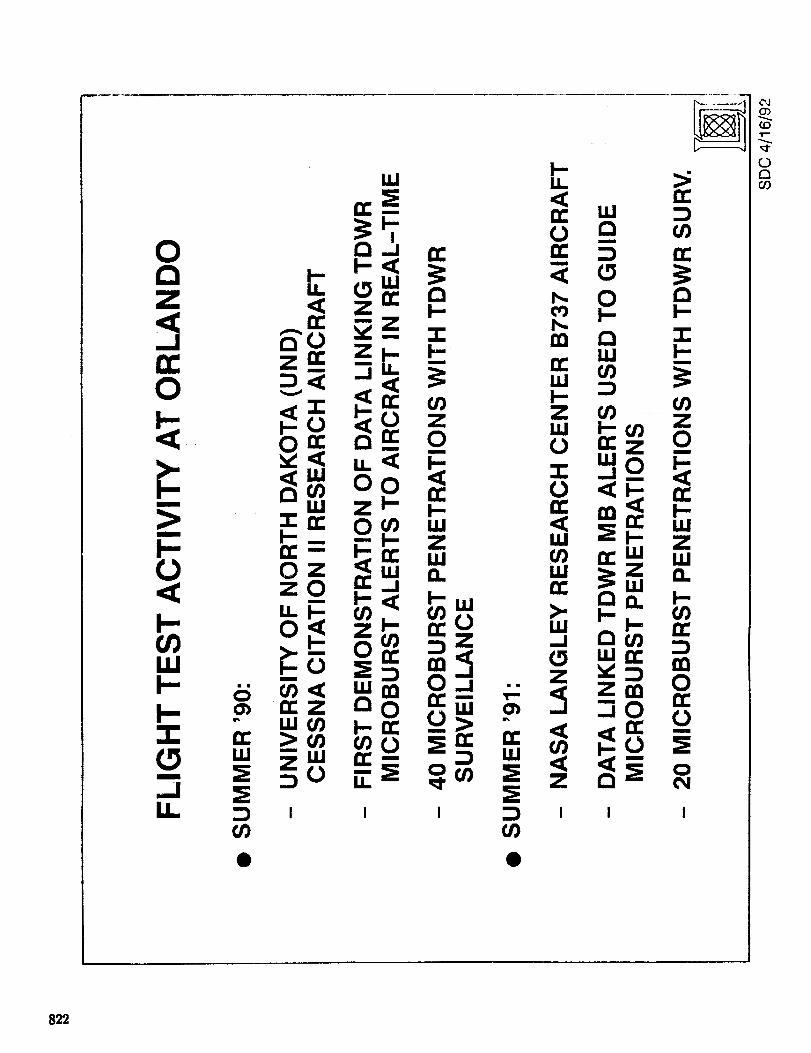
During the past two years, a series of flight tests has been coqducted with
instrumented aircraft penetrating microburst events while tinder testbed radar sur-
veillance. These tests were carried out wit!] a Cessna Citation II aircraft operated by
the University of North Dakota (UND) Center for Aerospace Sciences in 1990, and a
Boeing 737 operated by NASA l,angley Research Center in 1991. A large data base
of approximately 60 instrumented rnicroburst penetrations has been obtained from
these flights.
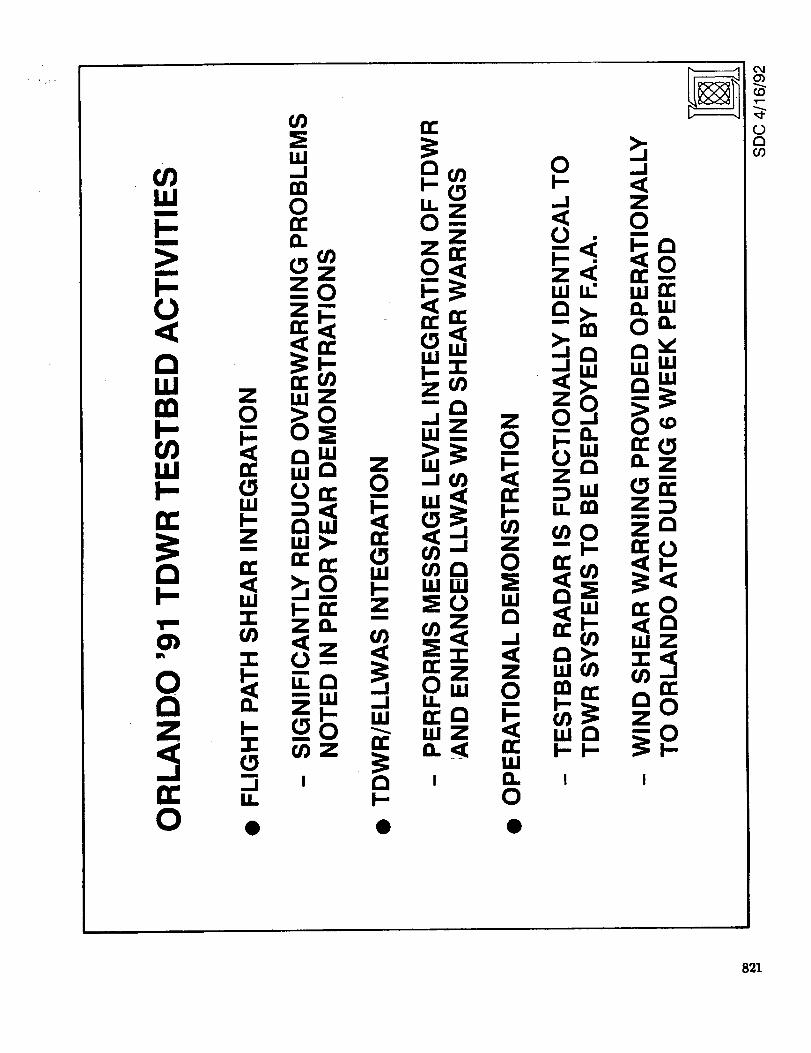
The test flights in 1990 included the firsl-evcr demonstration of real-time
transmission of TDWR microburst graphical warnings to an aircraft for cockpit dis-
play. A similar demonstration was carried out in 1991, with the Tr)WR microburst
alerts being used to direct the NASA aircraft in making microburst penetrations.
Post-flight analysis was performed under NASA funding to compare the F
factor (Bowles & Targ, 1988) as measured hy aircraft in situ sensors and estimated
from TDWR microburst alarms. It was found that improvements are needed in the
The work described here was perfornled under Air Force Coiltract No. FI9_28-90-C-0002,
and was sponsored by the Federal Aviation Adminislraticm and the National Aeronautics and
Space Administration. The [Jnted States (hwermncnt assumes no liability for its content oruse thereof.
813

TDWR microburst alarm generation process to allow the aircraft F fa_.tor to be esti-
mated accurately. These improvements include: shear-based outflow detection,
physical model-based alarm representation, and compensation for the dependence
of outflow intensity on altitude. The rationale for these improvements will now bediscussed. "
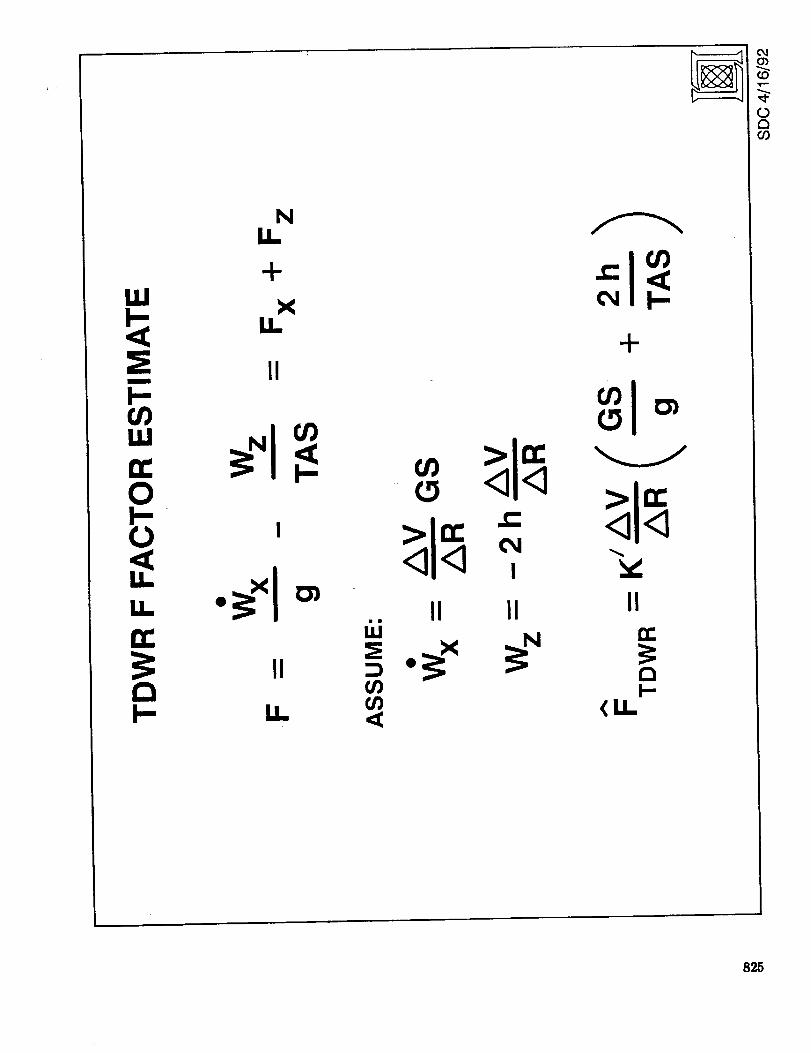
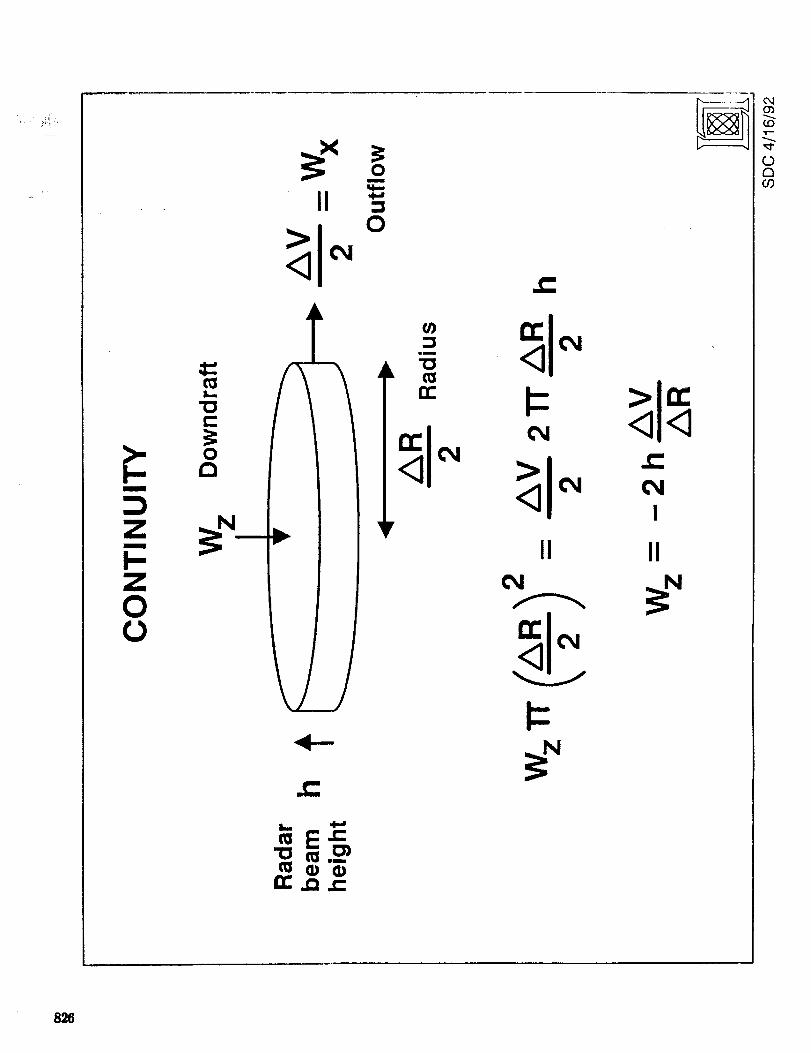
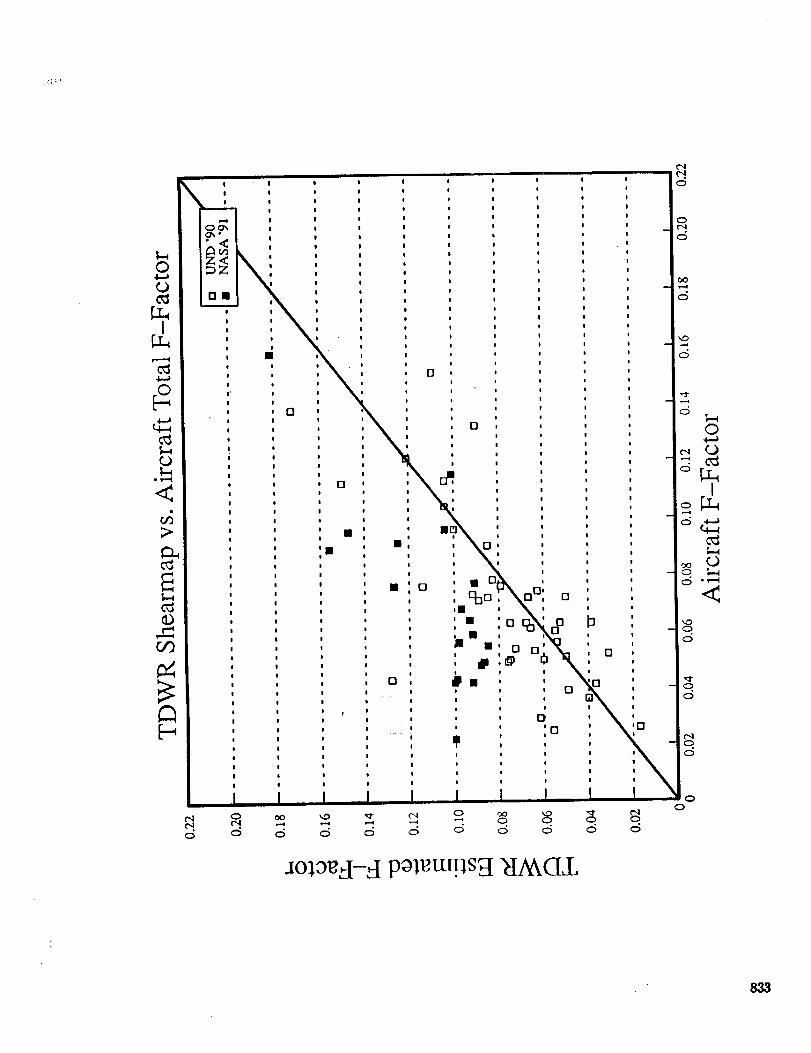
The aircraft F factor can be estimated from TDWR microburst alarms using a
formula proposed by Bowles (1988):
F "rr_wR = K' (AV/AR) [ GS/g + 2h/TAS ] = Fx + Fz (1)
where AV/AR is the TDWR-measured shear, GS is the aircraft ground speed, g is
gravitational acceleration, h is the radar beam height and TAS is the aircraft true
airspeed. K' is a factor which attempts to relate the average shear in the microburst,
AV/AR, to the peak shear in the microburst over a 1 km distance. The GS/g term
corresponds to the horizontal component of F (Fx) and the 2h/TAS term is an esti-
mate of the vertical (downdraft) component of F (Fz). It should be noted that the
equation assumes that the aircraft penetrates through the center of the microburst.
It was found that applying Equation 1 to current TDWR microburst alarms
often overestimates the aircraft F factor. Exarnination of TDWR radar data shows
that strong microbursts often contain small regions of intense shear inside a larger
region of less intense shear. These intense shear regions are not identified by the
current microburst detection algorithm, which attempts to identify the peak-to-peak
velocity loss, rather than shear. Because of this, the shear associated with a micro-
burst alarm is underestimated for slrong microbursts. Applying the K' factor to this
underestimated shear leads to the correct F factor estimate for strong microbtwsts,
but overestimates the F factor for weak microbursts.
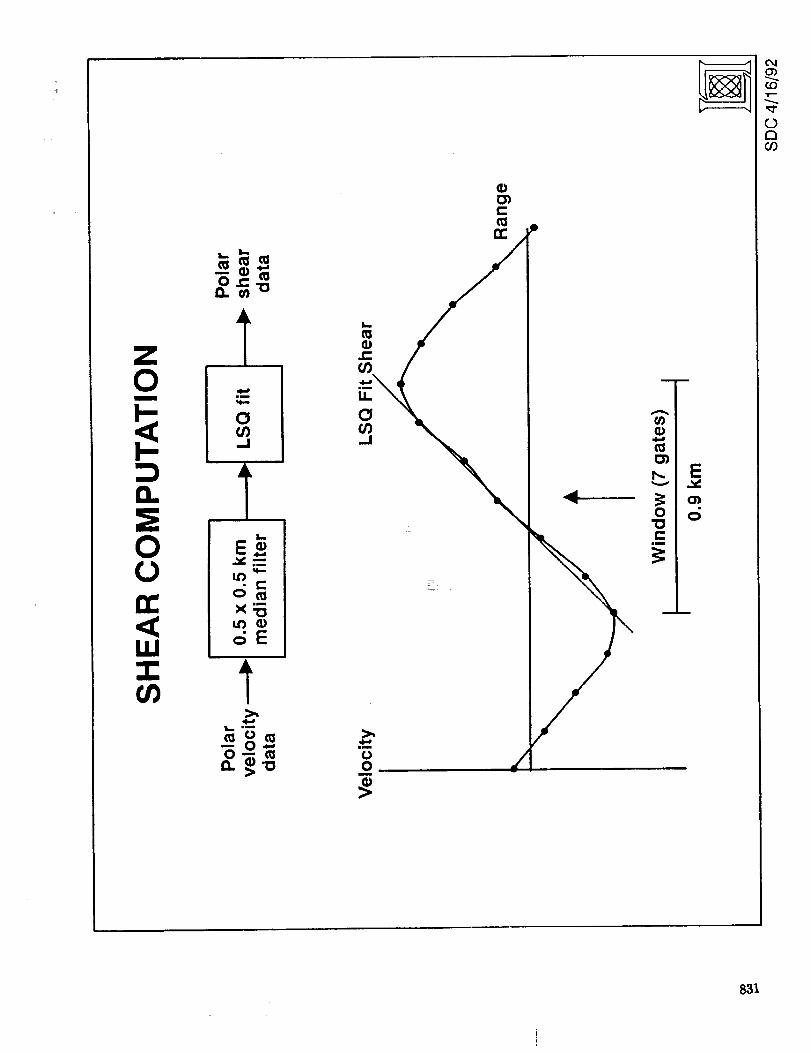
In order to beltcr quantify the shear for use in Equation 1, a least-squares
shear estimator was developed. The base polar radar data was first smoothed using a
0.5 km x 0.5 km median filter. The least squares estimator was then applied over a
seven-gate window of TDWR velocity data for an effective distance of 0.9 km (i.e., 6
gates center-to-center x 150 rn per gate). The corresponding shear values were then
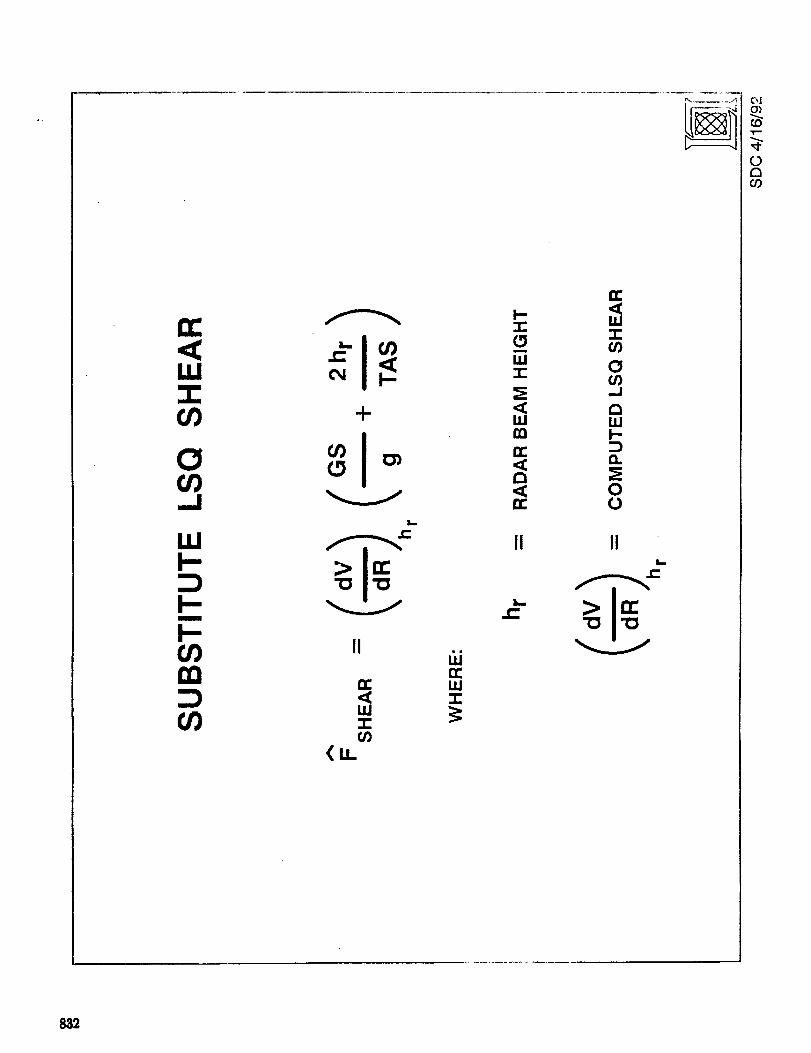
applied to the following equation:
I: StlEAIt = (dVtdR)lh [ GSIg + 2h/TAS 1 (2)
where (dV/dR)lh is the least-squares shear tit the radar beam height.
It was found that Equation 2 was an improvernent but still often overestimated
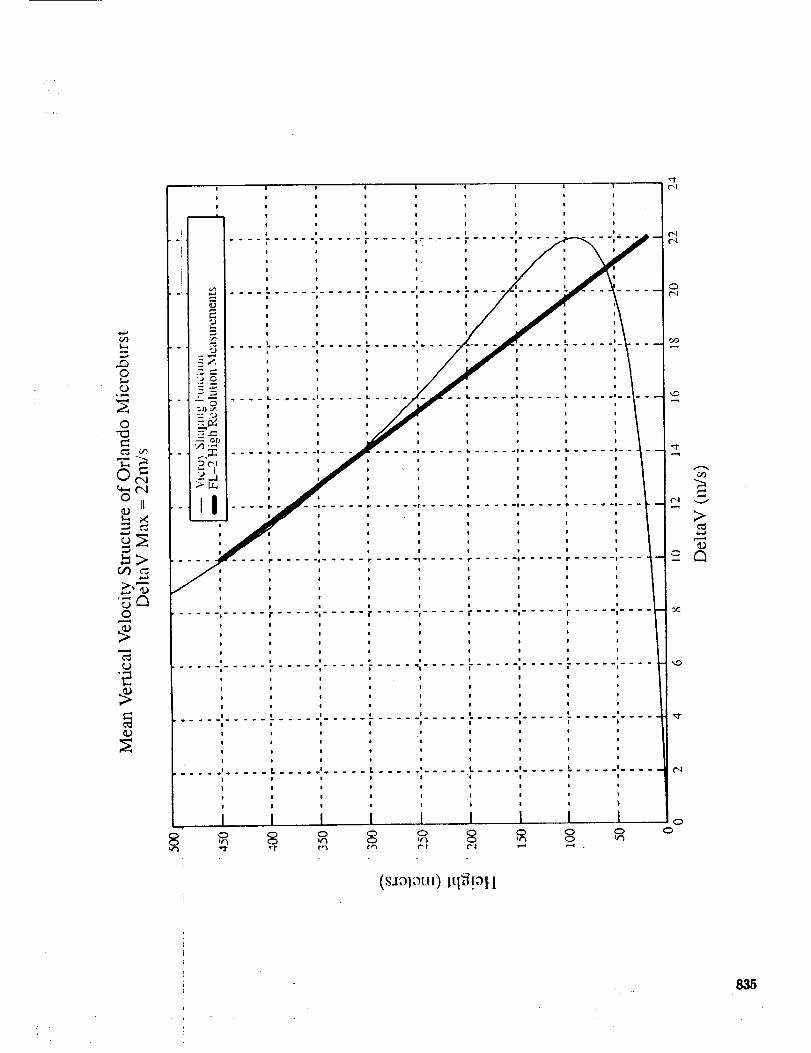
the aircraft F factor, l-:urlhcr examination ¢_1the radar data showed that there was a
strong dependence of the _utflow strenglh t_n altitude. Work by Mark lsaminger and
Patti Biron of Lincoln showed that the ot, tflow strength decreases linearly with height
above the surface. "l'hi_ rcsutt was consistent with an analytical model of microburst
outflows developctl by Vicroy of NASA l.angley (1991); this model is a modification
814

of an earlier model developed by Oseguera and Bowles (1988). In the Vicroy and
Oseguera & Bowles models, the horizontal shear is described by a shaping function,
p(z), which is zero at the surface, reaches a peak at height hm and then drops off with
increasing altitude.
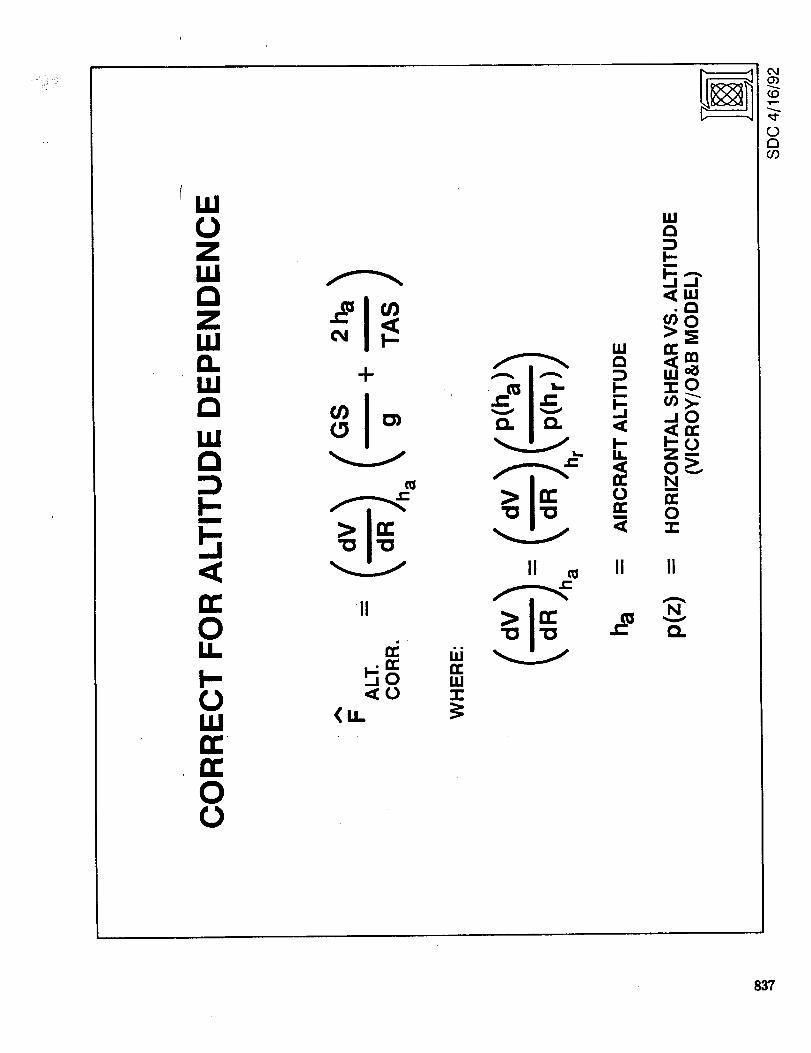
Using the altitude shaping function, p(z), the horizontal shear at the aircraft
altitude, a, can be estimated:
(dVldR)l,, = (dVldR)lh [ p(a)Ip(h) I (3)
and the revised F factor estimate can be written as:
F ALT.CO_R. = (dV/dR)l,, [ GS/g + 2a/'rAS I (4)
where we now use the aircraft altitude, a, in the downdraft estimation term, 2a/TAS.
This formula reflects the concept that as the aircraft altitude increases, the horizontal
shear will decrease but the downdraft component will increase.
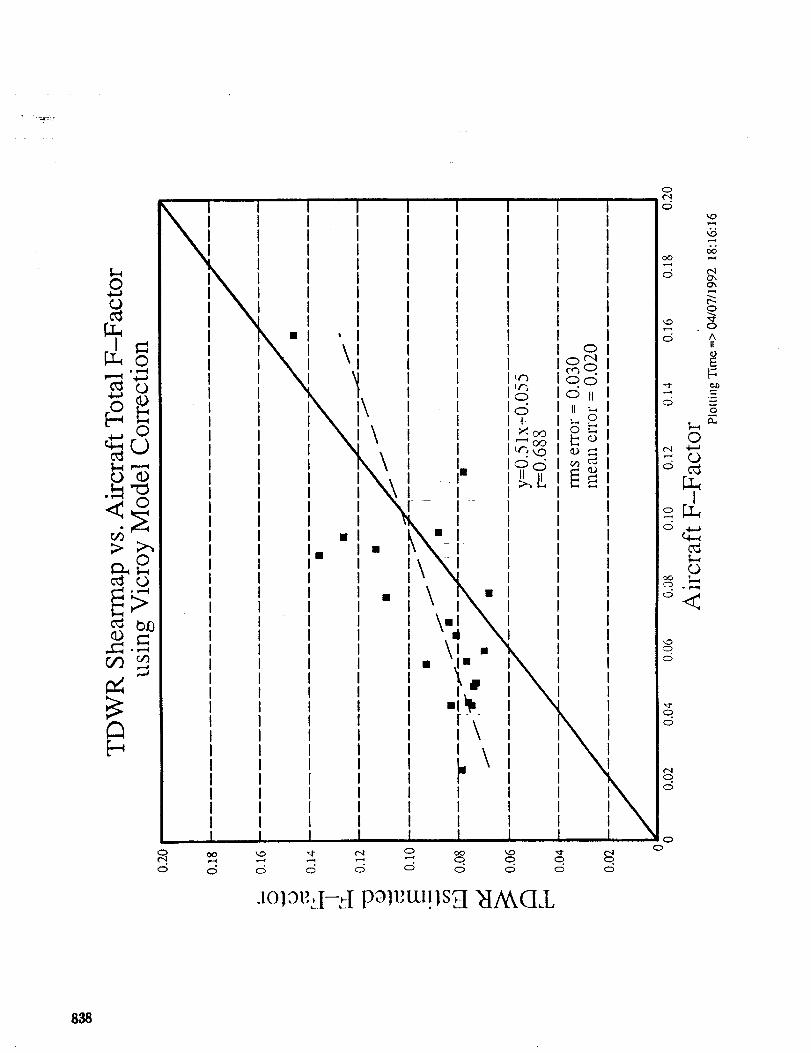
Equation 4 was found to estimate the Fx component quite accurately, but still
tends to overestimate the Fz component. Further reflection shows that the 2a/TAS
term leads to an overestimate of the vertical component, since it is assumed that the
aircraft flies directly through the center of the microburst, in fact, many of the pene-
trations were made at the edge of the. outflow where the Vicroy model predicts an
updraft, rather than a downdraft.
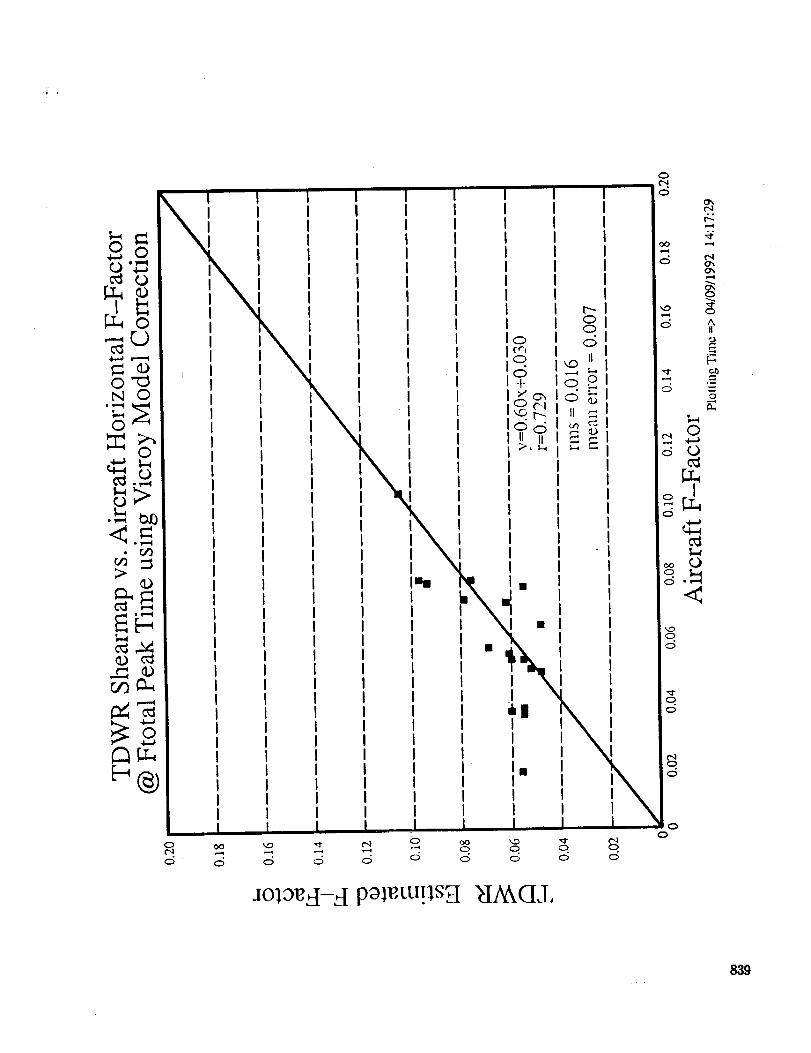
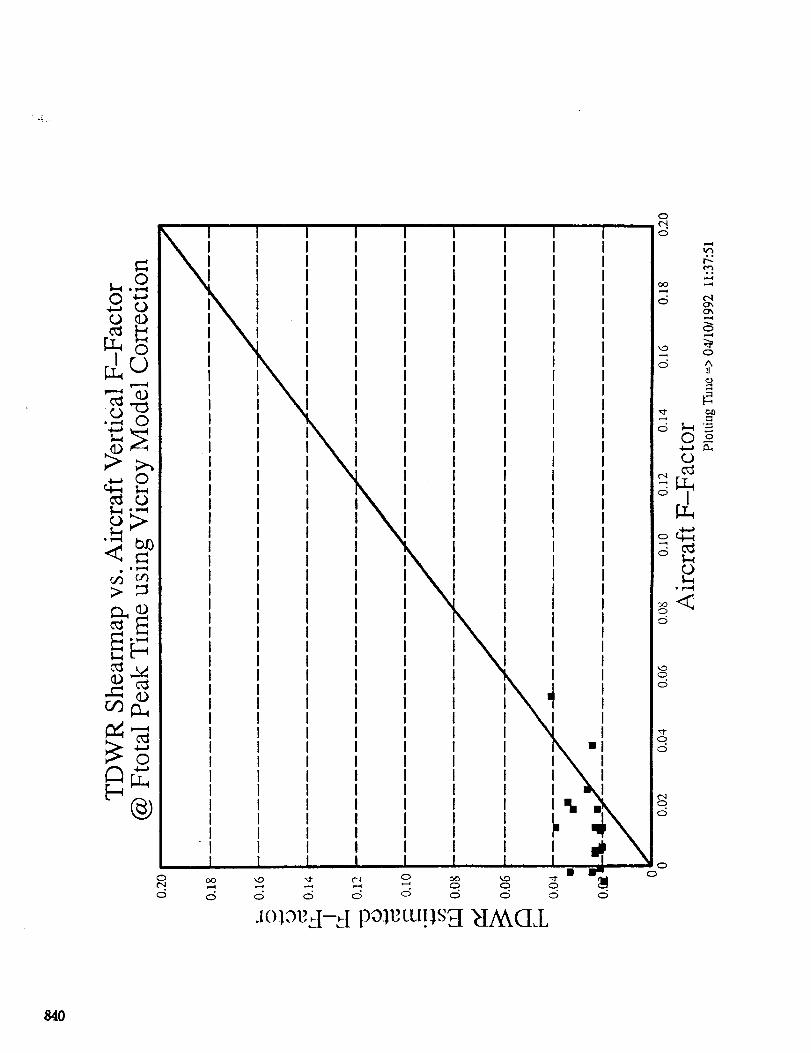
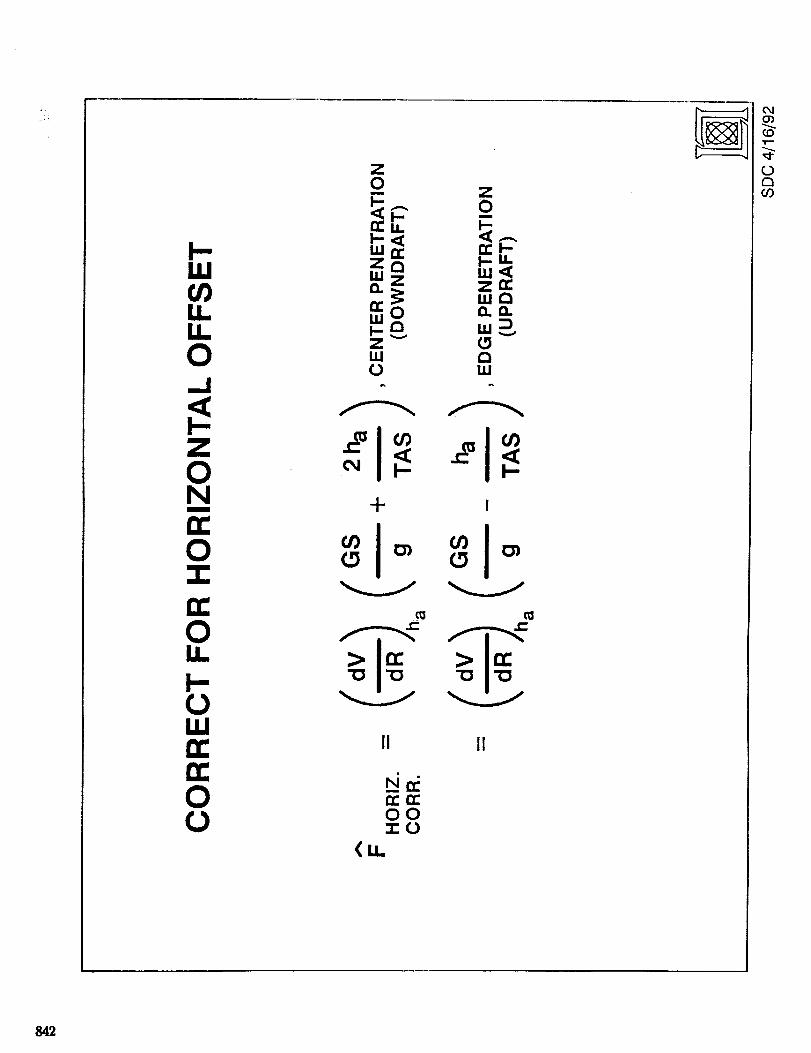
Accordingly, a final modification was tested which divided the aircraft data
into center and edge penetrations. For centcr penetrations, the unmodified Equation
4 was used; for edge penetrations, the vertical component estimator was changed
to -a/TAS (i.e., an updraft at the edge equal Io half the center downdraft):
F l loR.coRlt. = (dV/dR)[,, I (;S/g-t 2a/TAS l, center
= (dV/dR)l;, I GS/g - a/TAS I, edge
(5a)
(sb)
Applying Equation 5 yielded an improvcment in lhc mean Fz component, however,
the data points were clustered as either too high or too low. A further refinement
would be to scale the vertical compensation acc_wding to distance frona the outflow
center.
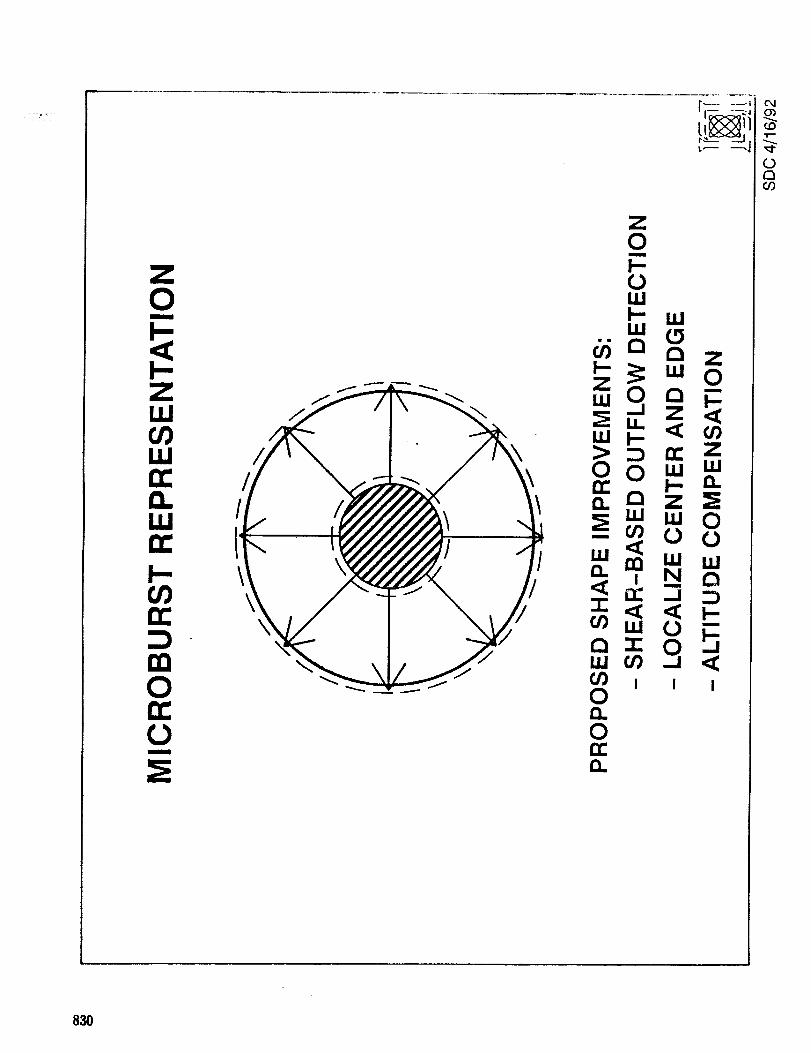
These results lead to the notion thai several improvements could be made to
the existing TDWR naicroburst recognition algorithm to allow accurate F factor esti-
mation. First, shear-based outflow de|ection at multiple thresholds would allow re-
gions of intense shear to be identified inside of larger outflow regions. Second, these
shear regions could bc used to create a microburst rcprcseniation based on a physical
model consisting of an outflow center and an outflow edge. Third, an analytic micro-
burst model or other technique could be used to compensate for the dependence of
outflow intensity on altitude. F?ourt]l, the impr_wed microburst representation could
815
be used to estimate the vertical component of the microburst based on distance fromthe outflow center.
A key goal for operations dt,ring the st, miner of 1992 will be to more accurate-
ly characterize the altitude dependence of microbt, rst outflows, it is planned to ac-
complish this goal by carrying out rapid, low-altitude scans of microburst outflows
by three radars during aircraft penetrations. The three radars will be the TDWR
testbed plus two C-band radars operated unclcr F.A.A. funding by the University of
North Dakota and Massachusetts Institute of Technology. These radars are situated
in such a fashion to allow triple-Doppler reconstruction of the three-dimensional
wind fields at the Orlando airport. These triple-Doppler wind field reconstructions
will allow both the horizontal and vertical components measured by airborne and
ground-based sensors to be compared.
In summary, a large data base of instrumented microburst penetrations while
under TDWR testbed radar surveillance has been obtained over the past two years at
Orlando. These tests also marked the first-ever d.cmonstration of real-time data link
transmission of TDWR microburst alerts to aircraft for graphical display in the cock-
pit. Additional flight tests will be performed in 1992, including penetrations with
rapid update, low-altitude triple-Doppler radar scans.
Sixty microburst penetrations have been examined to determine how well the
aircraft F factor can be estimated from TDWR data. Analysis of the data shows that
several improvements to the current microburst recognition algorithm would be
needed to allow the aircraft F factor to be accuralcly estimated. These improvements
would improve the quality of the microburst alerts currently supplied to ATC person-
nel and, in the future, supplied to pilots directly via Mode S Data Link.
References:
1. Bowles, R.I,. and R. Targ: Wind Shorn" Detection and Avoidance: Airborne
Systems Perspective, International Congress of Aeronaulical Sciences,
Jerusalem, Israel, At_gtnst-Scl-_tcmber, 1'_88.
2. Vicroy, D.D.: A Simple, An_llyiical, Axisymmctric Microburst Model for
Downdraft Estimation, NASA "l'echnictll Memorandum 104053, NASA I__angley
Research Center, tt_lmpton, VA, Fcl'wti;lly, 1991.
3. Oseguera, R.M., and R.I,. I_,owles: A Simple, Analytic 3-l)irnensional Downburst
Model Based on i_,oundary l.,ayer Stagn_ilion Vlow, NASA Technical Memo-
randum 100632, NASA I,angley Research Center, July, 1988.
816

illZi
0
00
I.LI
I--
a --!-- I--
0n" ,,_
a Z
I_ .-.J
re
Z Q
_ mI.U F-.J i-.
0 _a u.
..a 0
Z Z
W __- 0• •
Z0
Z0
u.I I- Z
usOO(/) =:) u.I
z _ I_.0 0 us us
a:: _; za
•- I.u '_ Z
I.u f.D_.j I- ILl
r_ _0 _- n.- QI- Z _ ,,i0 0 m Q
N 0 :::)-- I:Z: l--U. 0:: 0 --0 -o: -1.- _ <1:
t'l I I II--
Z0
m
I,-,f,/)u,.I
I--Lit.
rr
Z >"
0 "_
f,O
0
817
o
0
z
>
121
_ J
JtiZ
oo
i!n
ffl
zz __==, _ ,_ _" >o
818

819

LIJ0
<(=S
0i.I.rrLUI1.
=S>.iv-_--<C---..J"_<i:m
m
LI.0
inc) c)
(3)o
('do
0m
!--0LU
UJC_
I--(/)n-
Z>'0I--.-
--0mUj<C)--mUJOC_
0')OCO
_0
A A
O')OD• 9
0_t,') _1A A
<]<]
O_ 0")
00
A A
.,_<]
0
A
<]
0
A
0rr,t_m
rr,
C3
¢DO0D
UJ-.I,-,Im
(1)I--Z:3"I-
0O.co
I
cOP
CCILl
zLUa
O_oO
>-I-ra¢..)
(/)<((nZ<
0(3)!
0c_Z<..Jrr0
820
r$} 0c
o o_
_: _ == _ _ _ _o
,_ __ z _ ,,,rr ==i i a ) o= l iI- 0
0 • • •
_MO5
T=-
C_r__9
8_1
I-w LL _
c_
,Tin
cs_
82_

m<(/)<Z
0k--EZm
<I---<a
,-It_
r.
'l-
U)
L-
Imim
<_4.a
(n
0m
"0m
4.a
q)
(.1
O.
0
Z L_
I--
\
EQ).._"0 r-o"_
I't-
823

13.
000
Z
824
c_J
T-
O
D
825
.i..m
<:I_i--
lllml
I'I" ,,Q I--
co
0aC/)
816

0
0c_
I-,,v--I
O'3
I
I|
D0
I
!
I
[]
I
!
Oo
[]

.. =rF.
Z0m
I-
l---ZLU
ILlrr'D.U.In-
I---
E:
m0rr"cJm
///
\\
\
LLICl:: (DLU 13I-'- LUZ
\
\\
>,/
/
LUI--ZLI,i I,L!
LIJI-
n" l-
_ r_ __0 a,. Z_ _ 1.1.1
i_ ne z
_1 UJ W
0 I I I
>-ia.
O_
¢0
(br_09
828

0m
I--
I.-Z14.1
Ill
!11
!-
m0n-O/
///
\\
\
/
\\\
//
/
Illr_
N _ I.ll"i -- 0_ I-' z(j CO ,,I
ll.I0 rr a._i ,,i Z.._1 a ttl._1 rl,,i Z Ill
aI-. ,,iZ ali.I
a olzl Z
I I
W
"1-
I--CO I--_" 0
Zmoren- Ln
Zus
Z iitln"n"
0
O4
0agO
829
0m
I--
I--
W
nW
l--
r"r"
0
U
Z0i-0wI- ww
:-_ w 0zwO a _
J Z _I..-
_ ::) rr ZO0 w wnr" I--nQ Z __LU W 0-mo o
n m W uJ
_ W 0
w_ O_ ,_
0
0r_Q..
0'_
0DGO
cxl
(D
121ffJ
8,31
CE
UJ
U_
0U_.J
WF-
k-m
k-U_m
+
U_(5
I--
II
uJ
u_(,,
uJ-1-
F-
roLU
W
CE
n-
II
r-
n-
LU
u)
O09_J
LUF-
D.
00
II
e,-
0")
0tn¢.0
\
[]
o
0
0
o
o
%o o°: []mm ::o dJ
mmm' n
: _:_ ° iIPm) i Q! !
! |
, 0
!, ,! !
) I
! !
) !
o
Jola_d-d pm_,m!lsEl _A_GL
o
o
od
o

wLLIC_ I--
-- 0
C_uml
o
fn Lu
0 r_ne __._
_E 0Tm
o
c_,Tin
u_
ee
n"
LLI
ee
C_
C/)
834
0
0
O_
_>
0
"i I
i i
i l
i i
i l
i l
i
i
i
!
I
i
i
i
i
i
. I. ..... i.....
i i
i i i I
i i i i
i i t w
i i i l
.... i,...... i .... i..... a. ..... i....
t i i I
I i t I
i i i
i I i
i i i
° - . .i--i
i
!
I
i
..... I....
i
i
i
i
i
i
o
i
i ' 1I i i !
t i i I
i i i I
I I 1 I I
(,_.I,"ilOtU) Itl_]l+t I

0',,=,
0
4.J
£..,
{/')
*.==4
iI
• o j
b=..._
IIl-I
I II I
i _ I I II _ I I I Ii J-'i t i t
i i l t/J t t I
, I I I I /II I I 11'II I 1 11_
I I _c
I II I
!
v.--I
r,,I¢-4
C,P9
¢"..,I
830
UJ0ZUJ
UJ
iii
D.UJr_UJ
0U
¢.D
121
_1 _ _ _ _ _ 0 0 0 0
d d _ _ c5 d c5 o c5 d
.1ol,oe:.l-:I p01em!ls,_- _tA,_CLL
O
c5
O
O
838
::,, ,
0
0N 0
0
0
II
JOla_-_[ polp, tu!ls_
q0
0
839
I
0
o,0
t"q00
00
84O

Z
0R
h-,<(/)ZiiiD.:E00I---LI.I
ILI,I.0
I-,Z0Nm
O
I--IJ.,
EaZ
0
II
\\
\
I-ii
el"
ai
\
I/
Ill
aiii
LUh-ZUJ0
_"'9Z _ _.W _ I--0 W _
1I: ee 0
N m m _
uJ
0 m _ uJ. 0 "' "'
a. z z0 i I I
I--rr"ILl>
o,I
_0
0aor)
i
W(nU.U.
O.-I<
ZONm
G:OU.
OLUn-n-OO
G:
LUo:ZC)U.i z
a: ow
o
Z_C,,,C_
u.I _
ILl
-I- I
t_ tO
II II
OO"1"O
(,,
o_
I--
(DDo9
842

!i
I
gl I
II m
II
o.o
_g
I
I
I II I! i\
¢5
c,!.
c5
I I I
,"' _ _ o o¢-5 _ C5 O
O. O .O d o
d
O
I
Od-_
<
O
d
":1"O
d
o
oo
.I0131',3-_! p01vuOs3 _IA_U_L
o¢q
¢q
¢-,I
oAII
t...,
. ,..,_

• I
844

cO
,,i
(0WF-
ah-
0E_Z
0
0
h-
,,i
m
_JI,
W
0Z Z
Z _ a0 _ Zm
z0 oW --
w _ w _ wz _ -- _ 0 aW Z _ W --
0 w
Ep _ 0 _ m 0
w 0 0 w z
w _ m 0 -
Z _ _ _ ZI
J _ E 0 w--
0 = = 0
i i _ i i i
Z
u.ln-
l-.-
I.I=
0
n-W"rI--0
.-In
Zm
i.-
m
-.Iu.
Z
Z
0CO!11
l-
or_Ill..-I
0
I,,i._1D..m
h-i,-
m
0.
r_
C_
0(3o9
845

The Orlando TDWR Testbedand Airborne Wind ShearData Comparison Results
Questions and Answers
Q: Dan Vicroy (NASA Langley) - You pointed out some improvements or possible
improvements to the TDWR algorithms. Can you comment on the implementation issues and
what kind of time line you are looking at for implementing these improvements?
A: Steve Campbell (MIT Lincoln Lab.) - The TDWR was implemented as a very fast track
program. We knew that there would be some refinements. When the TDWR was designed, the
idea was that all you needed to do was detect the change in velocity. I think we now understand
that it is not true. There are really two avenues through which we could make improvements.
One is that the FAA expects to upgrade the TDWR algorithms over a period of time. The other
is that there is another program which is starting up called the Integrated Terminal Weather
System Program in which we will be incorporating data from a number of sources, TDWR,
surface observations and aircraft data. That may also be an avenue for making these
improvements. As far as how long that is going to take, well it is going to take some years. I
think we are at least plugged into that process,
846