Embed Size (px)
Citation preview
HAL Id: hal-01566591https://hal.inria.fr/hal-01566591
Submitted on 21 Jul 2017
HAL is a multi-disciplinary open accessarchive for the deposit and dissemination of sci-entific research documents, whether they are pub-lished or not. The documents may come fromteaching and research institutions in France orabroad, or from public or private research centers.
L’archive ouverte pluridisciplinaire HAL, estdestinée au dépôt et à la diffusion de documentsscientifiques de niveau recherche, publiés ou non,émanant des établissements d’enseignement et derecherche français ou étrangers, des laboratoirespublics ou privés.
Distributed under a Creative Commons Attribution| 4.0 International License
Weather Monitoring System for Renewable EnergyPower Production Correlation
Marcos Afonso, Pedro Pereira, João Martins
To cite this version:Marcos Afonso, Pedro Pereira, João Martins. Weather Monitoring System for Renewable EnergyPower Production Correlation. 2nd Doctoral Conference on Computing, Electrical and IndustrialSystems (DoCEIS), Feb 2011, Costa de Caparica, Portugal. pp.481-490, �10.1007/978-3-642-19170-1_53�. �hal-01566591�

Weather Monitoring System for Renewable Energy
Power Production Correlation
Marcos Afonso1, Pedro Pereira1, João Martins1
1 CTS, Uninova
Departamento de Engenharia Electrotécnica Faculdade de Ciências e Tecnologia, FCT, Universidade Nova de Lisboa
2829-516 Caparica, Portugal {maa18899, pmrp, jf.martins}@fct.unl.pt
Abstract. This work describes the development of a system designed for renewable power generation integration. It continuously acquires wind, solar and temperature data, which is automatically correlated with energy parameters, obtained from renewable energy systems. The developed system
was installed in an urban building equipped with photovoltaic cells and wind renewable generation. To validate the developed application, it was analyzed data of a wind generator and a set of photovoltaic panels, installed near to the weather station. The developed application allows, in addition to the acquisition of weather and energy data, their continuous monitoring and correlation through a graphical user interface, providing a friendly interactivity with the user.
Keywords: Weather Conditions, Energy Efficient Buildings, Renewable
Energy Production.
1 Introduction
The use of fossil fuels - coal, oil and gas - as the primary energy source, was one of
the main factors that made possible the rapid Humanity growth in the last century.
However, from the oil crisis in the 70’s, renewable energies started to have a
significant role as a potential alternative to the fossil fuels [1]. The demand and energy consumption in any country is directly connected to its demography and
development, having a strong impact on economic growth due to energy prices,
particularly prices of fossil fuels [2].
Renewable electric energy production’s efficiency depends not only on the
existent technology, but also mainly on the weather conditions at a given location.
Knowing the weather conditions at a specific place, it is possible to optimize
systems that take advantage of renewable energy sources. Moreover, accurate
meteorological records are crucial to accurately predict and monitor any energy
production system. There are currently a wide range of commercial systems that are
able to acquire weather conditions. From basic weather stations, capable of
acquiring temperature, humidity and barometric pressure, to the more advanced,
which, in addition, are able to measure, and record, wind speed and direction,
476 M. Afonso, P. Pereira and J. Martins
precipitation and solar radiation. However, these commercial systems only allow the
monitoring, and recording, of weather conditions.
In [3], a non-commercial weather acquisition system for monitoring a
photovoltaic (PV) system is proposed. The system is able to acquire solar radiation and temperature, as well as the PV electric parameters, trough a set of sensors
connected to a microprocessor, used as the core of the system. The collected data are
sent to a computer that works mainly as a database, and the system does not offer a
graphical interface. The hardware involved makes the system considerably complex,
thus not flexible to changes, making it difficult to adapt to other type of sensors. A
similar system is also proposed in [4]. Here, authors stated as major advantages the
hardware design and the possibility of operation in remote places, since the system
is battery powered. In [5] is described a LabVIEW based system. All data is
acquired and processed by LabVIEW, and the user can interact with the system
trough some graphical interface menus. However, the tool is only dedicated to PV
systems. The system proposed in [6] proposes, as main characteristic, the potential to integrate different renewable energy sources, namely PV and wind generator
systems. The core of the system is also a tool developed in LabVIEW. However, the
graphical interface and the options presented are limited.
A full system for weather monitoring and renewable energy production
correlation could become quite expensive, particularly when small renewable energy
systems (< 5kWp) are considered. The system costs are the main reason why
typically they are only used to: (i) demonstrate that the PV system is a reliable
energy source for the given application, or (ii) to develop criteria for design and
operation that optimize a PV system for its site and task [7].
In this work, we propose a tool for the management and management of weather
data, as well as the correlation among meteorological of energy production data.
Meteorological data will be acquired by a weather station equipped with several sensors; all of them installed in the same location as the renewable energy systems.
There will be a periodic acquiring of the relevant atmospheric values, including
wind speed and direction, temperature and solar radiation. Electrical power
generation data will be obtained from another system designed for this purpose and
already implemented [8]. With this work, it is our ambition to overcome some of the
limitation of the existent systems. The developed tool has three main goals: (i)
communication and data acquisition through the weather station; (ii) data processing
and (iii) analysis and correlation of meteorological data with data acquired from
renewable power generation systems. The developed tool was implemented in
Matlab.
2 Contribution for Sustainability
Due to the continuous increase in energy consumption, connected to the fact that
fossil fuels are becoming more rare and more expensive over the years, the market
of renewable energy production systems has increased, mainly in the residential and
small-medium enterprises sectors. The developed system, here presented, has two
major goals: (1) to offer the possibility of estimating the energy production of new
systems to be installed, and (2) to monitoring an existent renewable energy
Weather Monitoring System for Renewable Energy Power Production Correlation 477
production system, correlating weather and energy data. This system aims to support
and validate new technologies applied to renewable energy production systems,
since “green” sources play an important role in today’s electric grid sustainability.
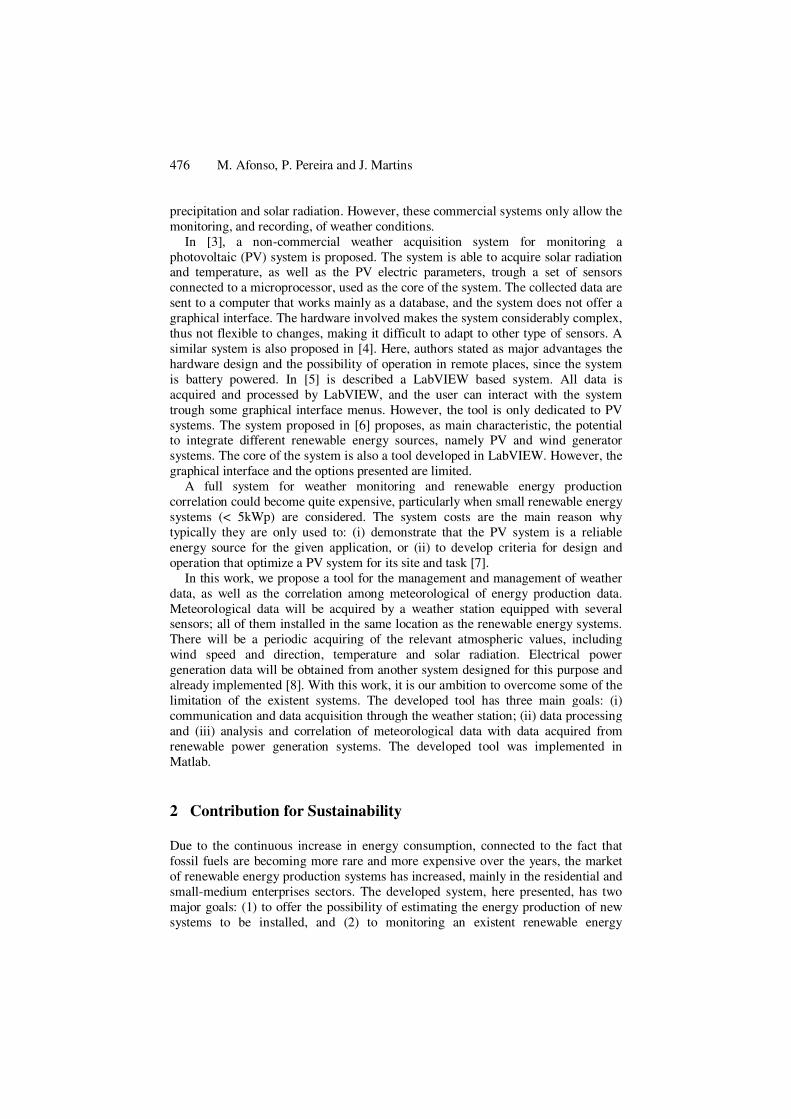
The developed system integrates two major areas of interest: (1) meteorological
data and renewable electricity generation. Figure 1 presents the framework of the
systems’ conceptual model.
Fig. 1. Conceptual model
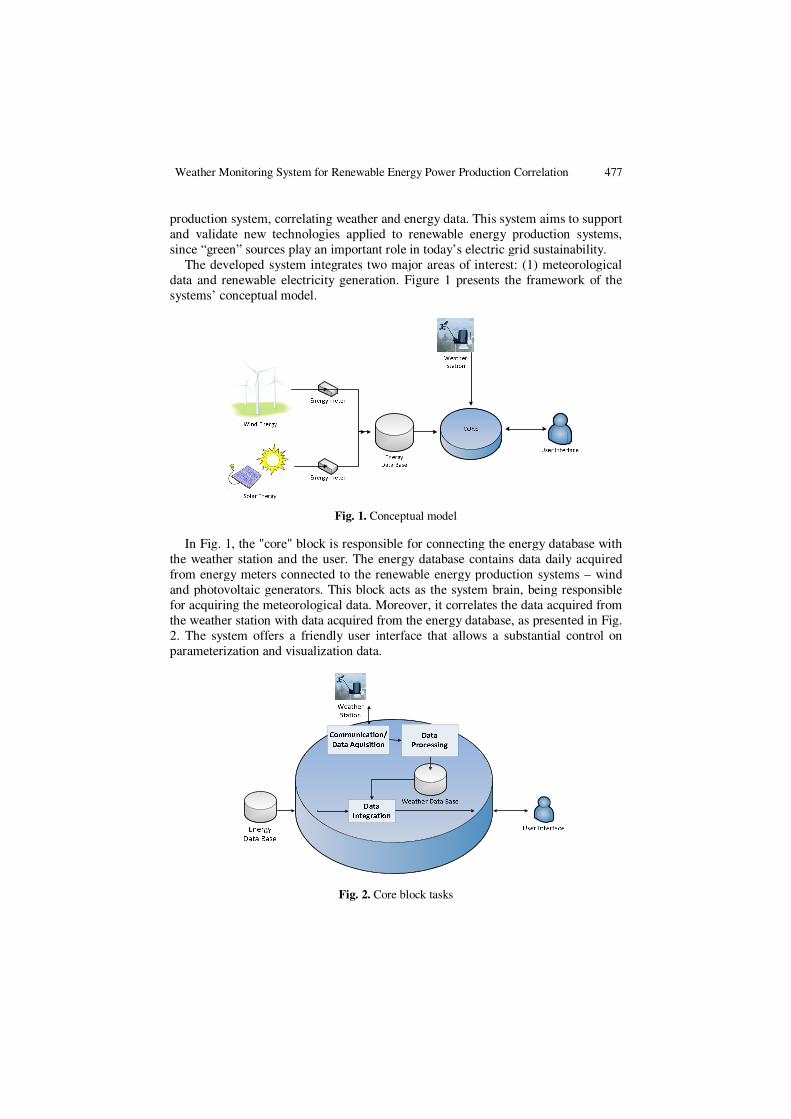
In Fig. 1, the "core" block is responsible for connecting the energy database with
the weather station and the user. The energy database contains data daily acquired
from energy meters connected to the renewable energy production systems – wind
and photovoltaic generators. This block acts as the system brain, being responsible
for acquiring the meteorological data. Moreover, it correlates the data acquired from
the weather station with data acquired from the energy database, as presented in Fig.
2. The system offers a friendly user interface that allows a substantial control on
parameterization and visualization data.
Fig. 2. Core block tasks
478 M. Afonso, P. Pereira and J. Martins
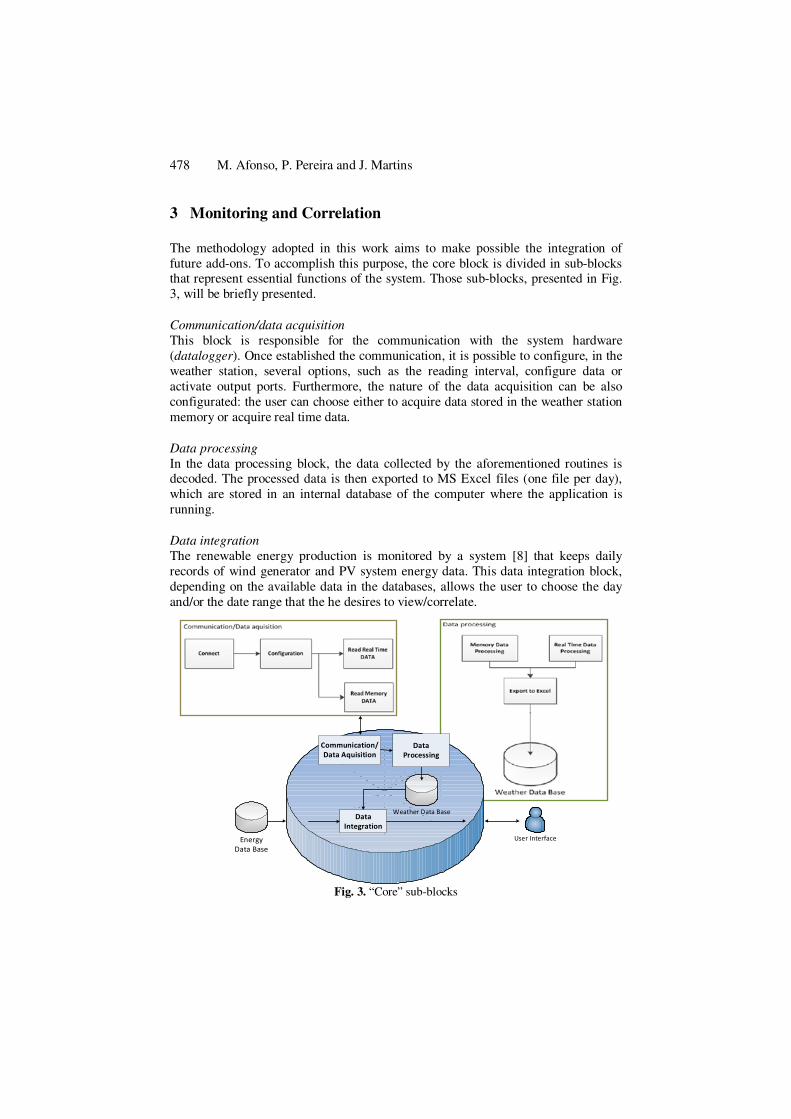
3 Monitoring and Correlation
The methodology adopted in this work aims to make possible the integration of
future add-ons. To accomplish this purpose, the core block is divided in sub-blocks that represent essential functions of the system. Those sub-blocks, presented in Fig.
3, will be briefly presented.
Communication/data acquisition
This block is responsible for the communication with the system hardware
(datalogger). Once established the communication, it is possible to configure, in the
weather station, several options, such as the reading interval, configure data or
activate output ports. Furthermore, the nature of the data acquisition can be also
configurated: the user can choose either to acquire data stored in the weather station
memory or acquire real time data.
Data processing
In the data processing block, the data collected by the aforementioned routines is decoded. The processed data is then exported to MS Excel files (one file per day),
which are stored in an internal database of the computer where the application is
running.
Data integration
The renewable energy production is monitored by a system [8] that keeps daily
records of wind generator and PV system energy data. This data integration block,
depending on the available data in the databases, allows the user to choose the day
and/or the date range that the he desires to view/correlate.
Fig. 3. “Core” sub-blocks
User InterfaceEnergy
Data Base
Weather Data Base
Communication/
Data Aquisition
Data
Integration
Data
Processing
Weather Monitoring System for Renewable Energy Power Production Correlation 479
Table 1 presents the several parameters that are suitable for display and
correlation. The developed system allows correlation analysis of these parameters
(in two different graphics), and also presents a compass rose regarding the set of
days selected, correlating wind speed and direction.
Table 1. List of parameters available for visualization and/or correlation.
Electrical Energy Production
Parameters (wind and PV) Weather Parameters
Voltage (V) Wind direction (º)
Current (A) Wind Gusts (m/s)
Power Factor Average Wind Speed (m/s)
Power (VA) Temperature (ºC)
Active Power (W) Solar Radiation (W/m2)
Reactive Power (VAr)
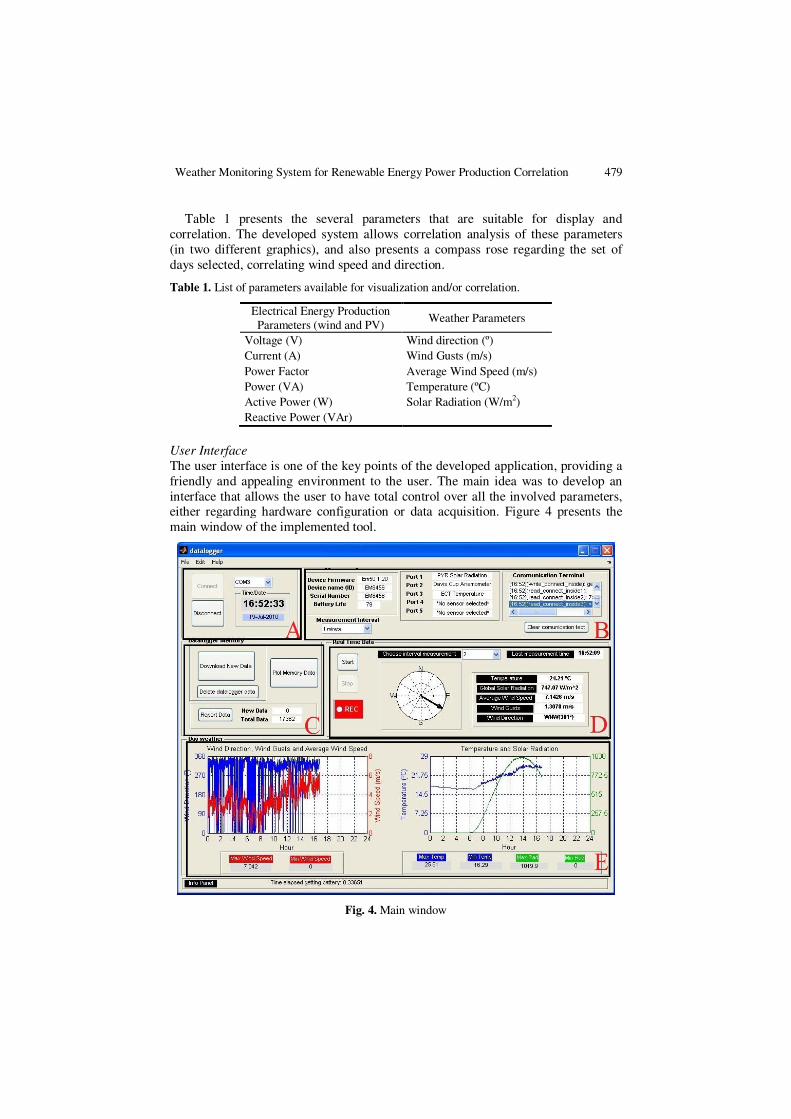
User Interface
The user interface is one of the key points of the developed application, providing a
friendly and appealing environment to the user. The main idea was to develop an
interface that allows the user to have total control over all the involved parameters, either regarding hardware configuration or data acquisition. Figure 4 presents the
main window of the implemented tool.
Fig. 4. Main window
480 M. Afonso, P. Pereira and J. Martins
In Fig. 4, the main interface is divided um several areas, each one related to a
specific task. A summary of each block, identified with capital letters, is presented
below.
• A - Datalogger Control – Starts and stops the connection with the weather station datalogger and gives information about current date and time;
• B - Datalogger Settings – Gives information about the weather station
parameters: firmware version number of the device (Device Firmware),
device name (Divide Name (ID)), unique serial number of the device (Serial
Number), battery current status (Battery Life) and sensors assigned to each
communication port. In the Communication terminal is possible to view all
messages exchanged between the application and the equipment. It is also
possible to define the data recording interval in the datalogger's internal
memory (Measurement Interval);
• C - Datalogger Memory - Download of new data from datalogger's internal
memory for the database in MS Excel files. It is possible to see the memory status, to clear the data logger internal memory and to open a new window
for data correlation;
• D – Real Time Data - Shows weather conditions in real time with a minimum
sample acquisition time of 2 seconds. The compass wind is updated in real
time (depending on the user-defined acquisition time; 1 sec, 10 sec, …, 1
min), indicating wind direction. Enables the record of meteorological data in
real time to the database (Weather Data Base);
• E – Day Weather - Presents the weather conditions for the current day in two
graphics. Also gives information about the maximum and minimum values
achieved in the present day.
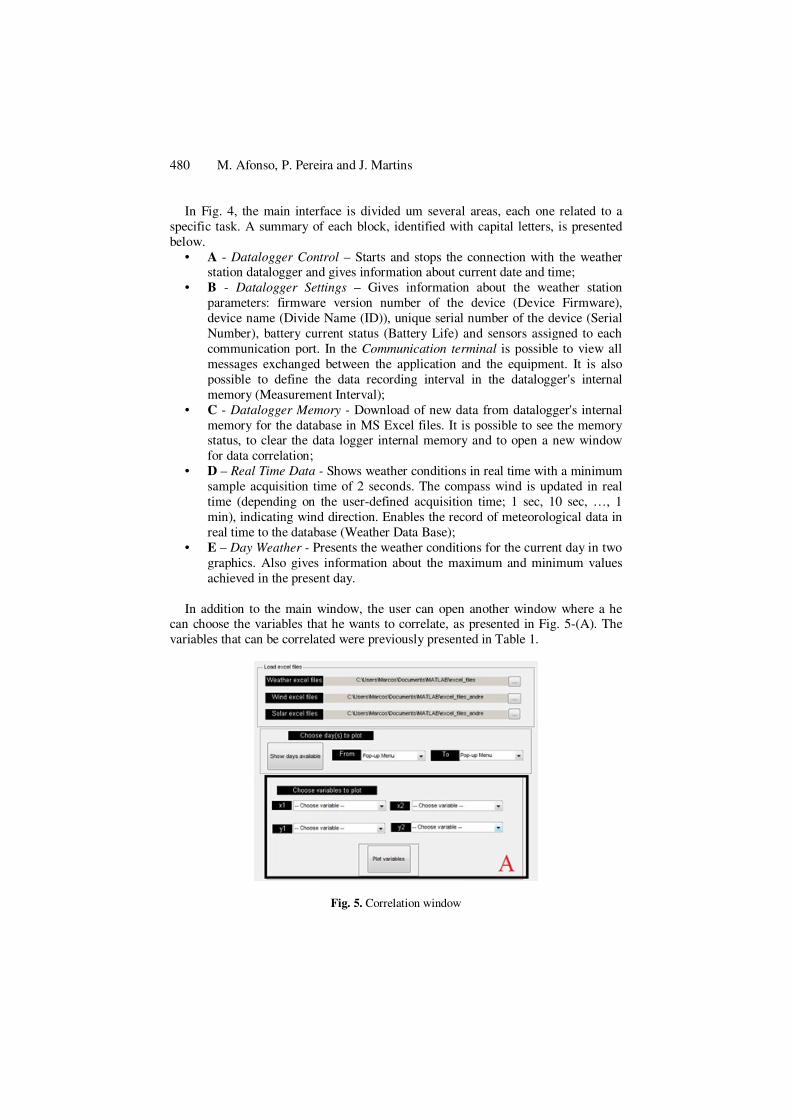
In addition to the main window, the user can open another window where a he can choose the variables that he wants to correlate, as presented in Fig. 5-(A). The
variables that can be correlated were previously presented in Table 1.
Fig. 5. Correlation window
Weather Monitoring System for Renewable Energy Power Production Correlation 481
In Fig. 5 window the user can create correlation graphics for the chosen variables,
relating weather conditions and electrical parameters of the two renewable energy
production systems. In addition to those variables, the total electrical energy
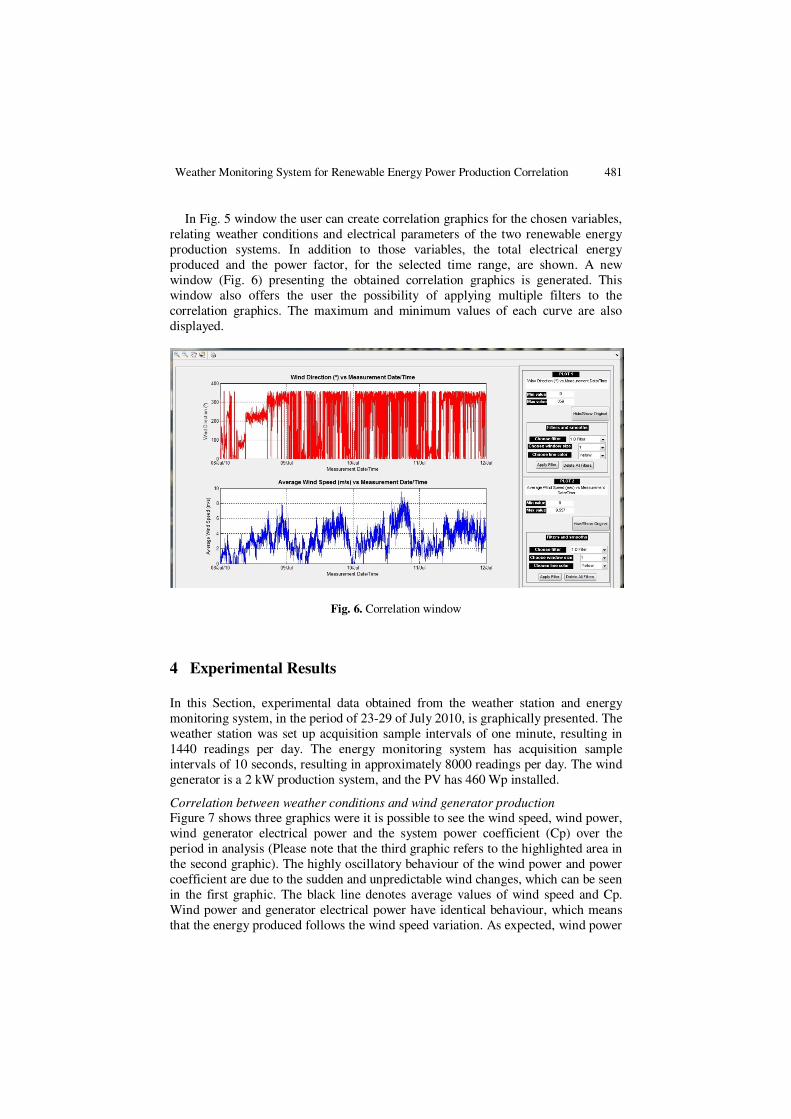
produced and the power factor, for the selected time range, are shown. A new
window (Fig. 6) presenting the obtained correlation graphics is generated. This
window also offers the user the possibility of applying multiple filters to the
correlation graphics. The maximum and minimum values of each curve are also
displayed.
Fig. 6. Correlation window
4 Experimental Results
In this Section, experimental data obtained from the weather station and energy
monitoring system, in the period of 23-29 of July 2010, is graphically presented. The
weather station was set up acquisition sample intervals of one minute, resulting in
1440 readings per day. The energy monitoring system has acquisition sample
intervals of 10 seconds, resulting in approximately 8000 readings per day. The wind
generator is a 2 kW production system, and the PV has 460 Wp installed.
Correlation between weather conditions and wind generator production
Figure 7 shows three graphics were it is possible to see the wind speed, wind power,
wind generator electrical power and the system power coefficient (Cp) over the
period in analysis (Please note that the third graphic refers to the highlighted area in
the second graphic). The highly oscillatory behaviour of the wind power and power
coefficient are due to the sudden and unpredictable wind changes, which can be seen
in the first graphic. The black line denotes average values of wind speed and Cp.
Wind power and generator electrical power have identical behaviour, which means
that the energy produced follows the wind speed variation. As expected, wind power
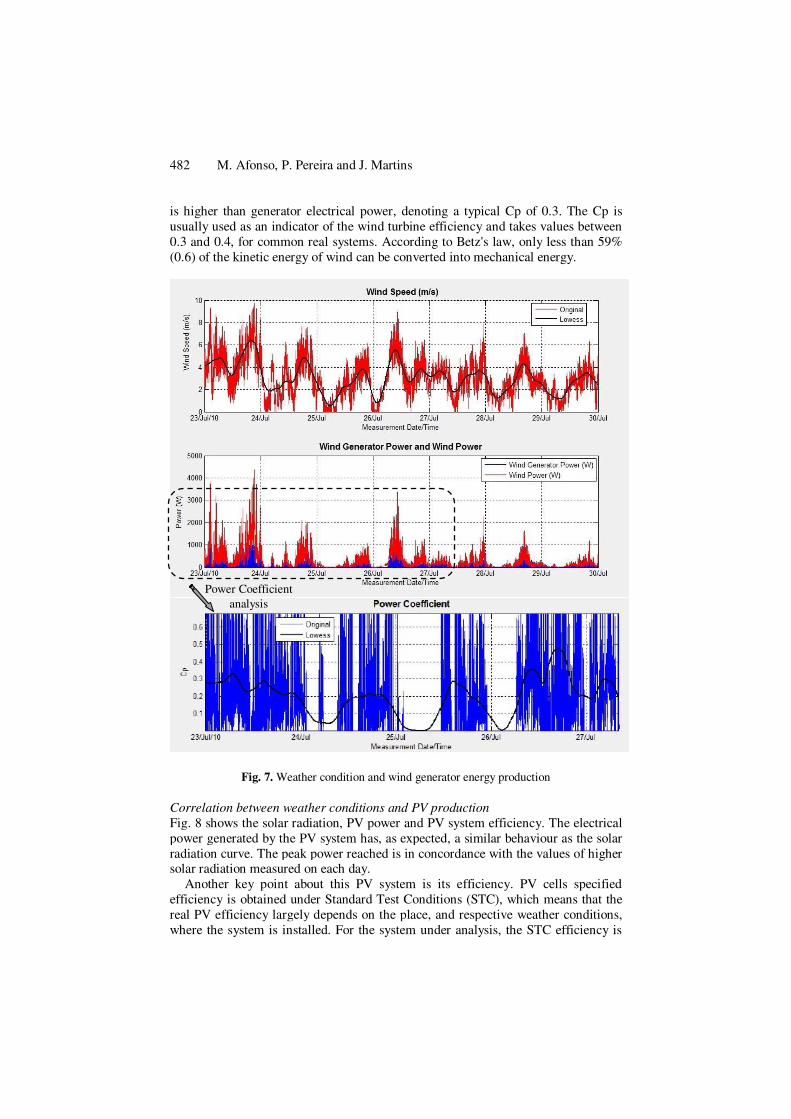
482 M. Afonso, P. Pereira and J. Martins
is higher than generator electrical power, denoting a typical Cp of 0.3. The Cp is
usually used as an indicator of the wind turbine efficiency and takes values between
0.3 and 0.4, for common real systems. According to Betz's law, only less than 59%
(0.6) of the kinetic energy of wind can be converted into mechanical energy.
Fig. 7. Weather condition and wind generator energy production
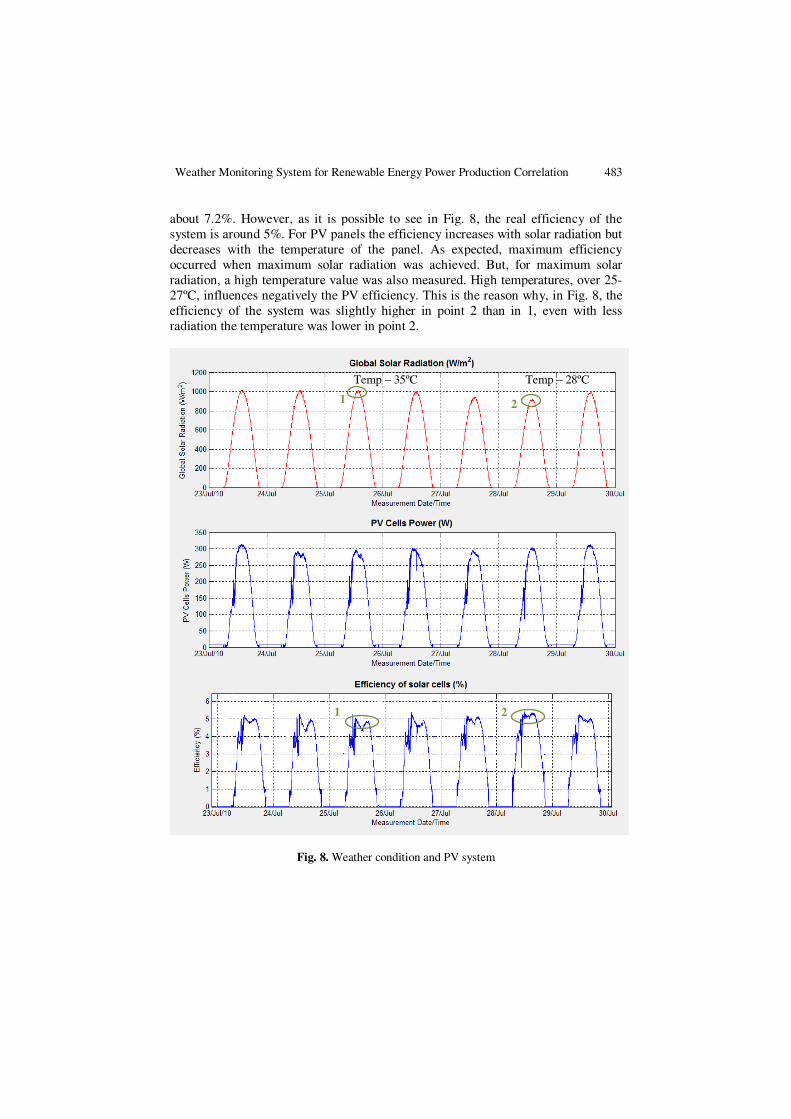
Correlation between weather conditions and PV production
Fig. 8 shows the solar radiation, PV power and PV system efficiency. The electrical
power generated by the PV system has, as expected, a similar behaviour as the solar
radiation curve. The peak power reached is in concordance with the values of higher solar radiation measured on each day.
Another key point about this PV system is its efficiency. PV cells specified
efficiency is obtained under Standard Test Conditions (STC), which means that the
real PV efficiency largely depends on the place, and respective weather conditions,
where the system is installed. For the system under analysis, the STC efficiency is
Power Coefficient
analysis
Weather Monitoring System for Renewable Energy Power Production Correlation 483
about 7.2%. However, as it is possible to see in Fig. 8, the real efficiency of the
system is around 5%. For PV panels the efficiency increases with solar radiation but
decreases with the temperature of the panel. As expected, maximum efficiency
occurred when maximum solar radiation was achieved. But, for maximum solar
radiation, a high temperature value was also measured. High temperatures, over 25-
27ºC, influences negatively the PV efficiency. This is the reason why, in Fig. 8, the
efficiency of the system was slightly higher in point 2 than in 1, even with less
radiation the temperature was lower in point 2.
Fig. 8. Weather condition and PV system
Temp – 28ºC Temp – 35ºC
1 2
1 2
484 M. Afonso, P. Pereira and J. Martins
5 Conclusions
This work has presented a system that integrates weather conditions information and
energy parameters from renewable energy power generation system. The system incorporates an integrated analysis of the multiple variables involved, through an
interactive graphical user interface. One of the advantages of an accessible and
interactive user interface is the simple analysis of the renewable power systems
generated electrical energy in relation to the existing weather conditions.
To validate the developed application, it was used data from a wind generator and
photovoltaic panels, installed near to the weather station. The application developed
in this work allows, in addition to the acquisition of weather and energy data, their
monitoring and correlation through a simple and attractive graphical user interface,
providing an easy interactivity with the user.
The implemented system can be used by institutions or companies related to
renewable energy systems, meteorology, or even by the private user who is interested in monitoring the production of electricity from renewable energy systems
installed in their homes.
Acknowledgments. This work was supported by FCT (CTS multiannual funding)
through the PIDDAC Program funds.
References
1. Elhadidy, M., Shaahid, S.: Parametric Study of Hybrid (wind+solar+diesel) power generating Systems. In: Renew Energy; Vol. 21 (2), pp. 129-139. Elsevier. October (2000)
2. IEA: World Energy Outlook 2009. International Energy Agency Publications (2008) 3. Benghanem, M., Maafi, A.: Data Acquisition System for Photovoltaic Systems
Performance Monitoring. In: IEEE Transactions on Instrumentation and Measurement. Vol 47, pp. 30-33. December (1998)
4. Mukaro, R., Carelse, X.F..: A Microcontroller-Based Data Acquisition System for Solar Radiation and Environmental Monitoring. In: IEEE Transactions on Instrumentation and Measurement. Vol 48, pp. 1232-1238. (1999)
5. Forero, N., Hernández, J., Gordillo, G.: Development of a monitoring system for a PV
solar plant. In: Energy Conversion and Management. Vol. 47, Issues 15-16, pp. 2329-2336 Elsevier. September (2006)
6. Koutroulis, E., Kalaitzakis, K.. Development of an integrated data-acquisition system for renewable energy sources systems monitoring. In: Renewable Energy. Vol. 28, Issue 1, pp. 139-152. Elsevier, January (2003)
7. Blaesser, G.: PV system measurements and monitoring: The European experience. In: Solar Energy Materials and Solar Cells. Vol. 47, Issues 1-4, pp. 167-176. Elsevier, October (1997)
8. Jorge, A., Guerreiro, J., Pereira, P., Martins, J., Gomes, L.: Energy Consumption
Monitoring System for Large Complexes. In: Doctoral Conference on Computing, Electrical and Industrial Systems - DoCEIS'10, pp. 22-24, Caparica, Lisbon - Portugal. February (2010)