Embed Size (px)
Citation preview
Weather Map Analysis
Lab 7

Can include:
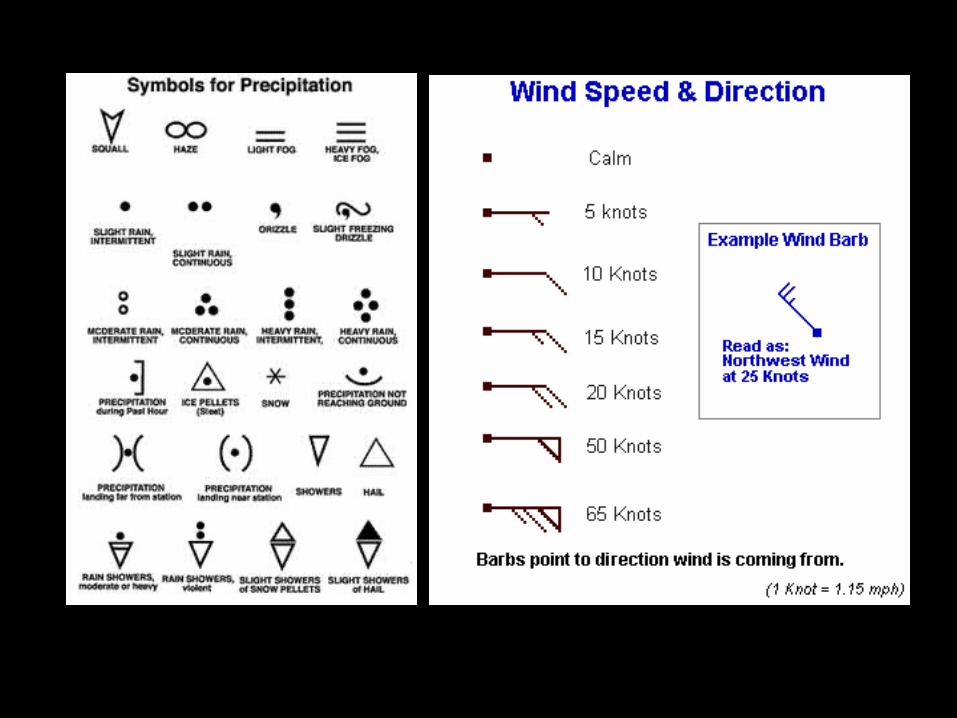
• Frontal lines• Barometric pressure• Isolines• Temperature• Frontal zones• Frontal air
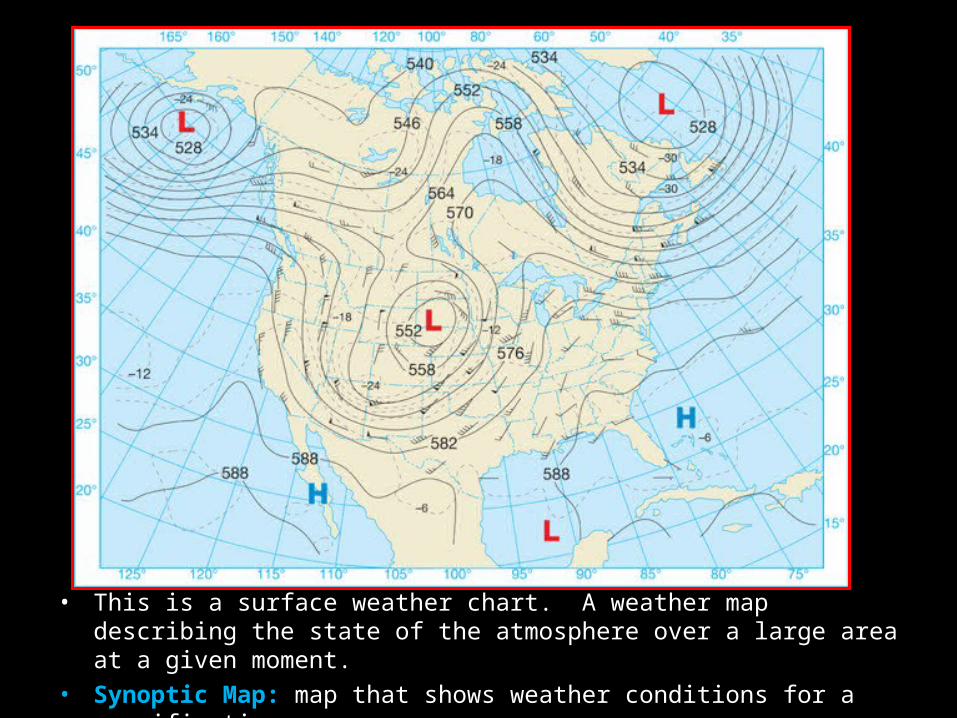
• This is a surface weather chart. A weather map describing the state of the atmosphere over a large area at a given moment.
• Synoptic Map: Synoptic Map: map that shows weather conditions for a specific time.

Data are always plotted in the same position around the station symbol for consistent reading.
Weather Map Analysis:Simplified Surface Station Model
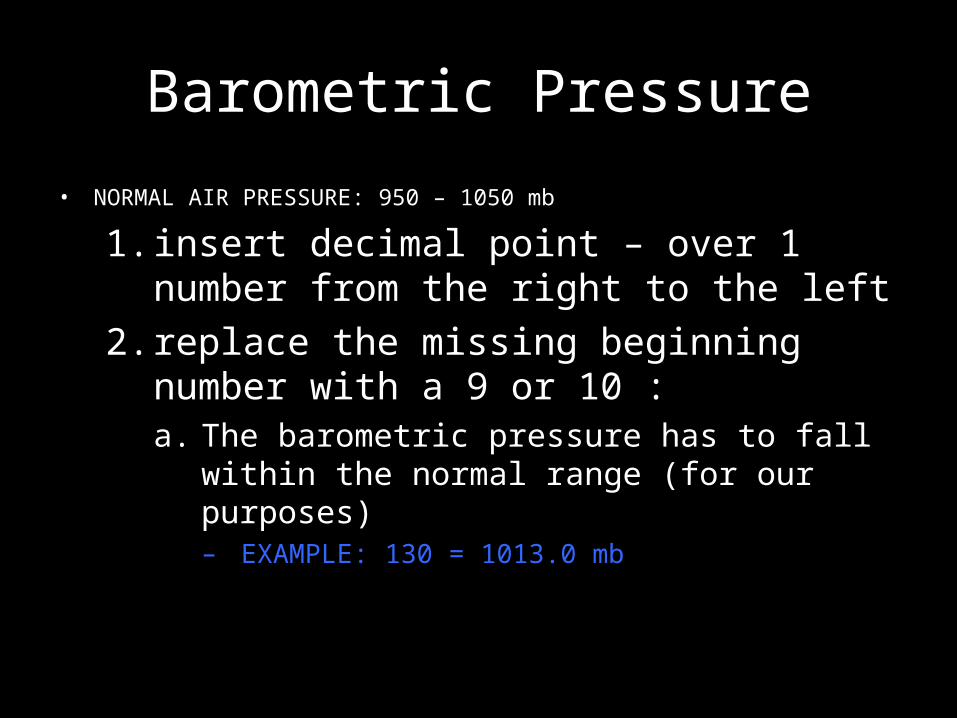
Barometric Pressure
• NORMAL AIR PRESSURE: 950 – 1050 mb
1. insert decimal point – over 1 number from the right to the left
2. replace the missing beginning number with a 9 or 10 :a. The barometric pressure has to fall within the normal
range (for our purposes)– EXAMPLE: 130 = 1013.0 mb
Wind Direction
• Measured by where wind is coming FROM• Will also determine the temperatures and
moisture content of the air mass• Pressure Gradient Force
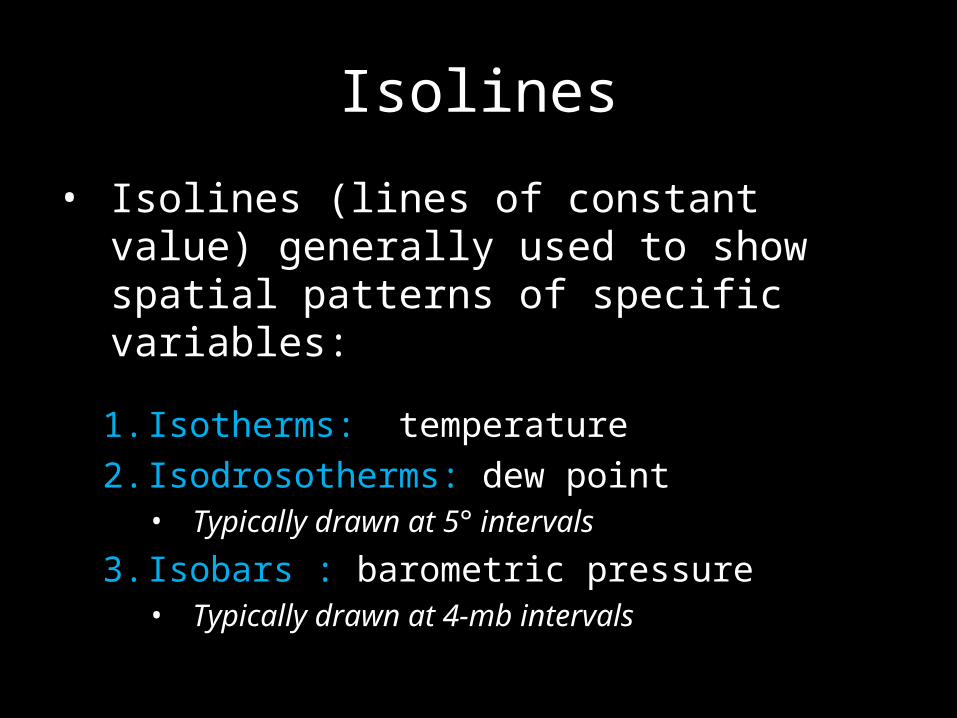
Isolines
• Isolines (lines of constant value) generally used to show spatial patterns of specific variables:
1. Isotherms: temperature2. Isodrosotherms: dew point
• Typically drawn at 5° intervals
3. Isobars : barometric pressure• Typically drawn at 4-mb intervals
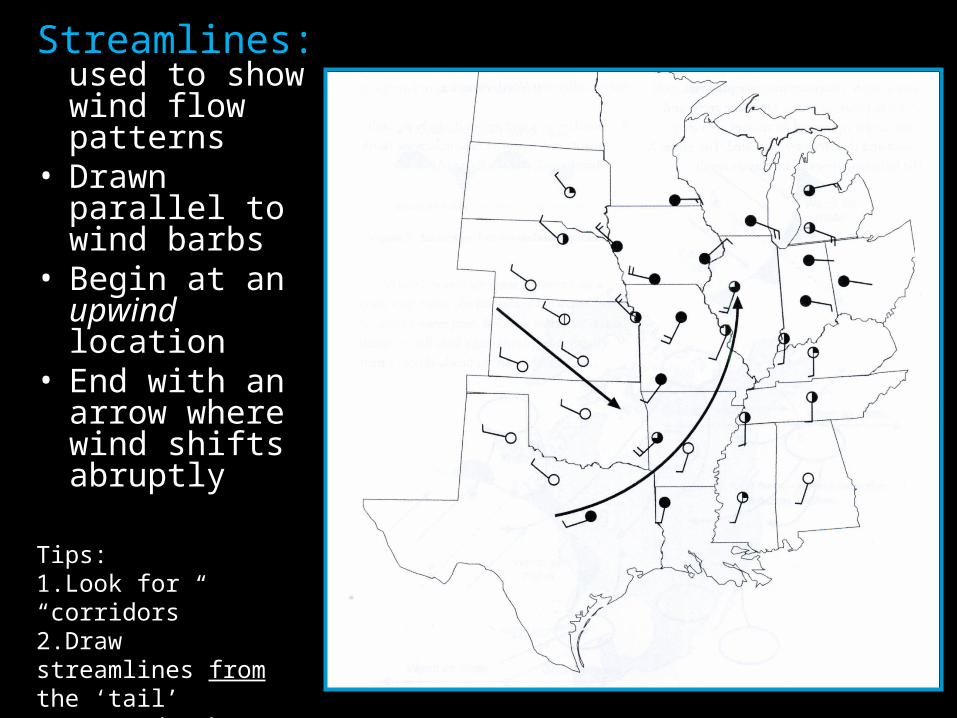
Streamlines: used to show wind flow patterns
• Drawn parallel to wind barbs
• Begin at an upwind location
• End with an arrow where wind shifts abruptly
Tips:1.Look for “corridors”2.Draw streamlines from the ‘tail’ to/towards the ‘head.’
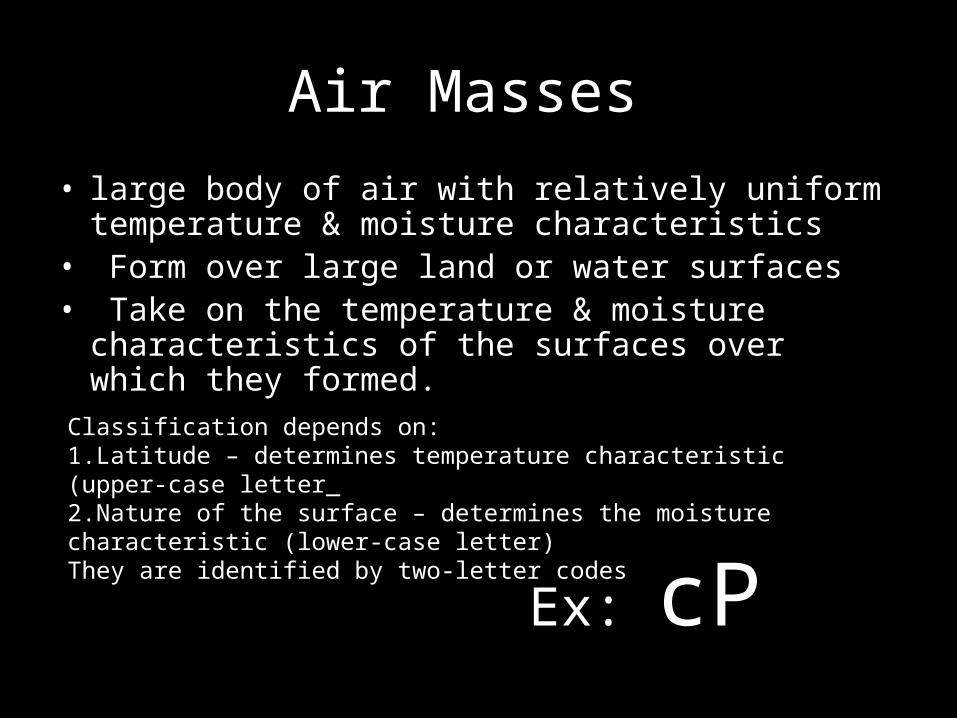
Air Masses
• large body of air with relatively uniform temperature & moisture characteristics
• Form over large land or water surfaces• Take on the temperature & moisture characteristics of
the surfaces over which they formed.
Classification depends on:1.Latitude – determines temperature characteristic (upper-case letter_2.Nature of the surface – determines the moisture characteristic (lower-case letter)They are identified by two-letter codes
Ex: cP
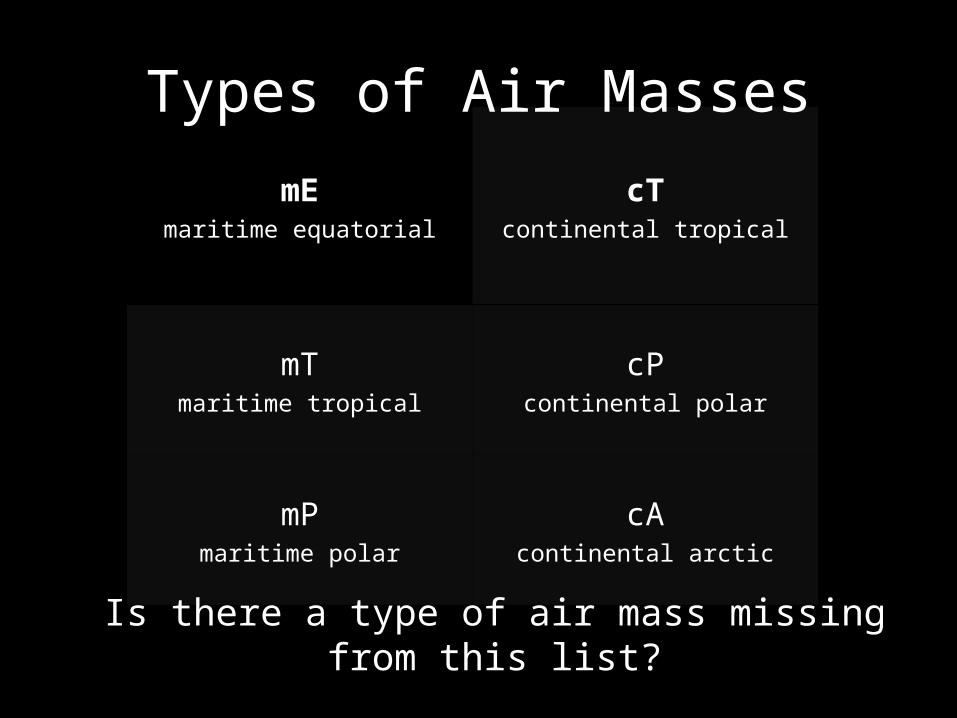
mEmaritime equatorial
cTcontinental tropical
mTmaritime tropical
cPcontinental polar
mPmaritime polar
cAcontinental arctic
Types of Air Masses
Is there a type of air mass missing from this list?

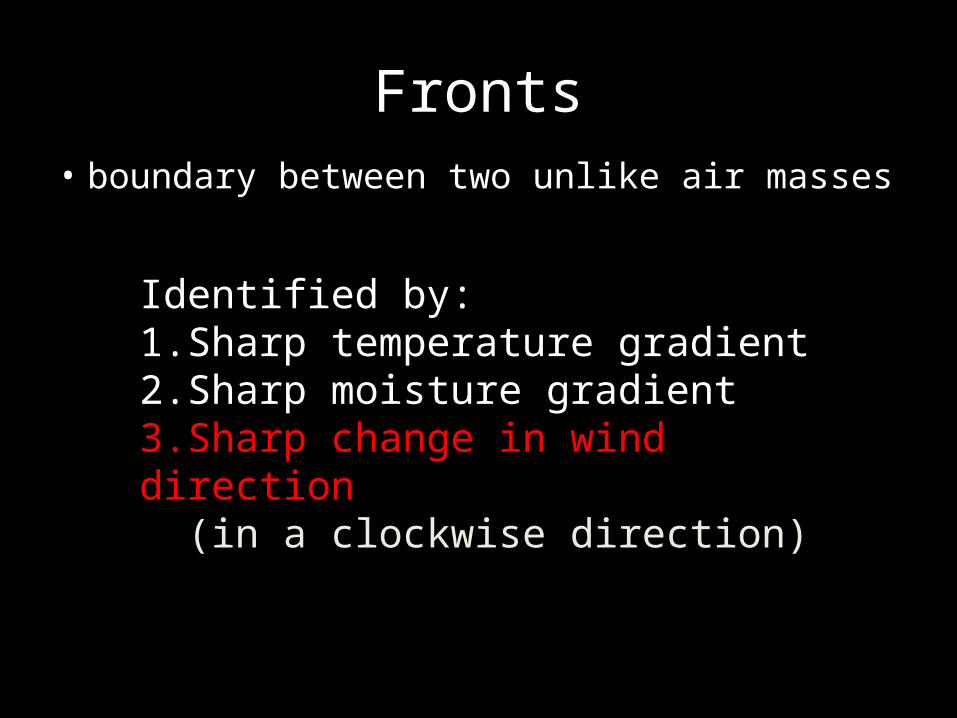
Fronts• boundary between two unlike air masses
Identified by:1.Sharp temperature gradient2.Sharp moisture gradient3.Sharp change in wind direction
(in a clockwise direction)
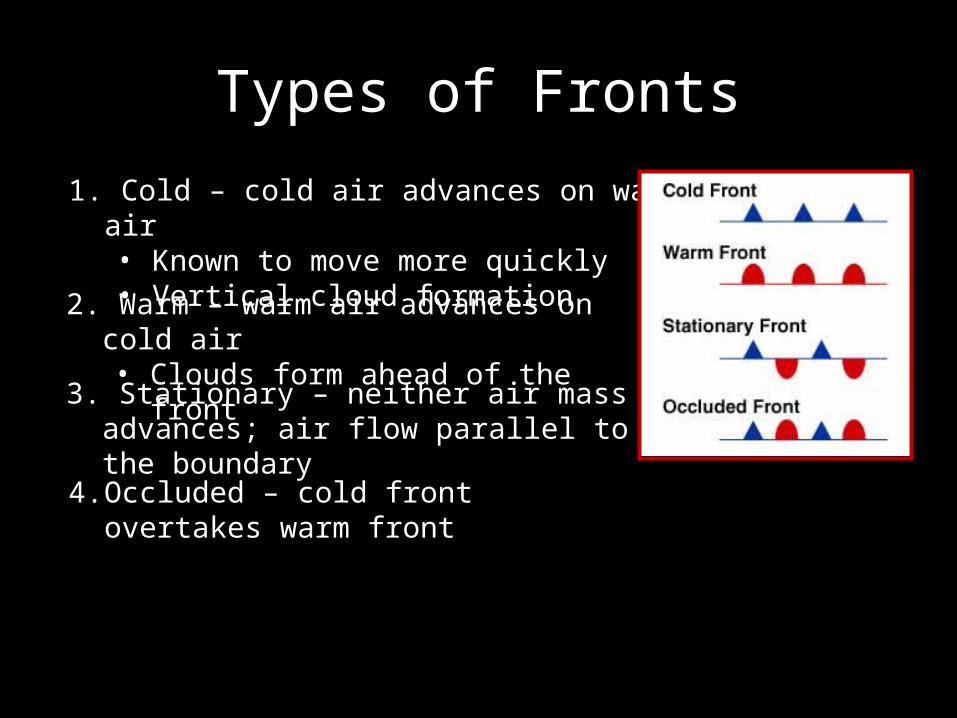
Types of Fronts
3. Stationary – neither air mass advances; air flow parallel to the boundary
1. Cold – cold air advances on warm air• Known to move more quickly• Vertical cloud formation
2. Warm – warm air advances on cold air• Clouds form ahead of the front
4. Occluded – cold front overtakes warm front
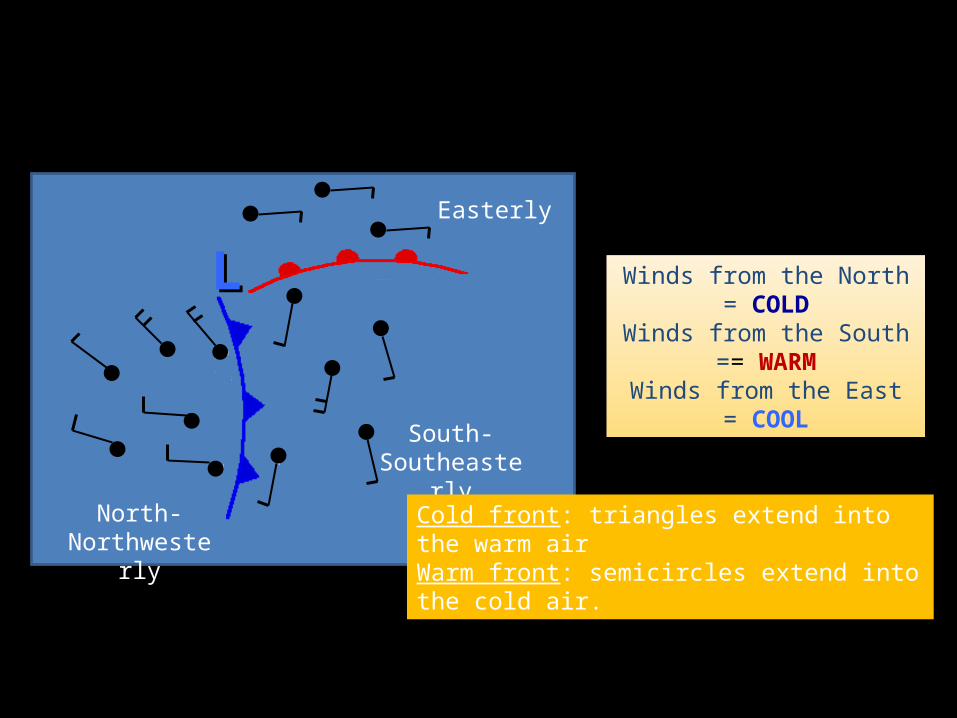
North-Northwesterly
LL
South-Southeasterly
Easterly
Winds from the North = COLDWinds from the South ==
WARMWinds from the East = COOL
Cold front: triangles extend into the warm airWarm front: semicircles extend into the cold air.
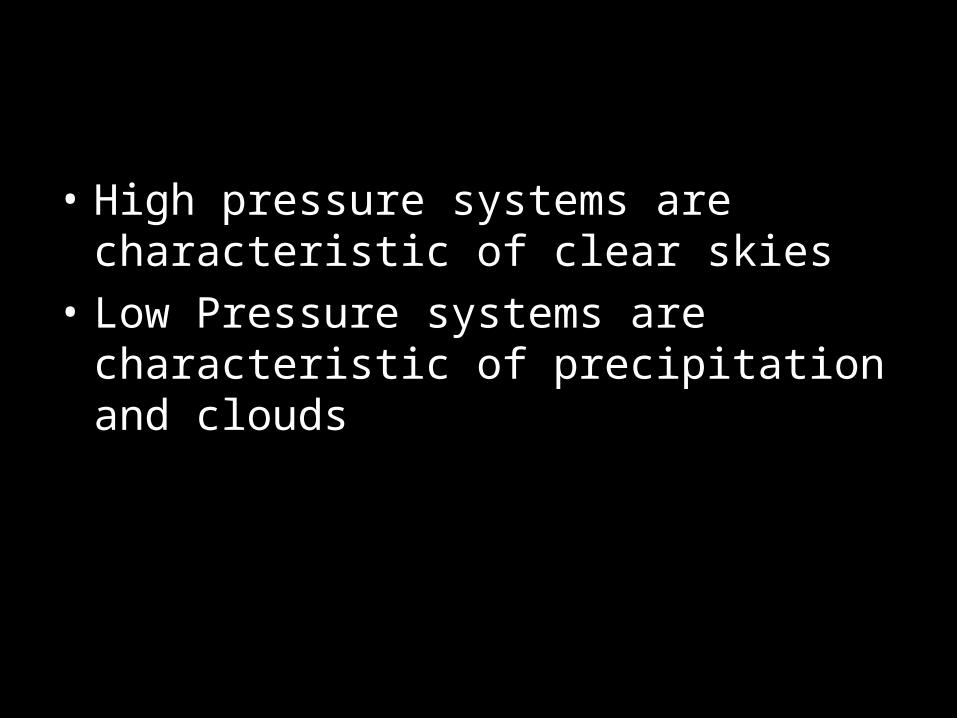
• High pressure systems are characteristic of clear skies
• Low Pressure systems are characteristic of precipitation and clouds
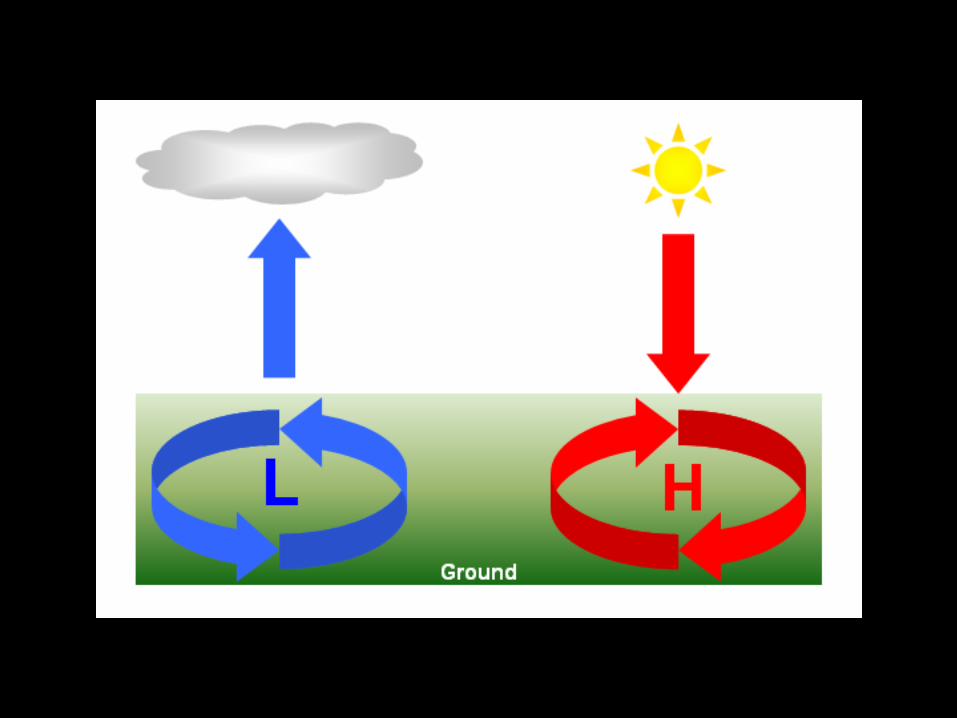
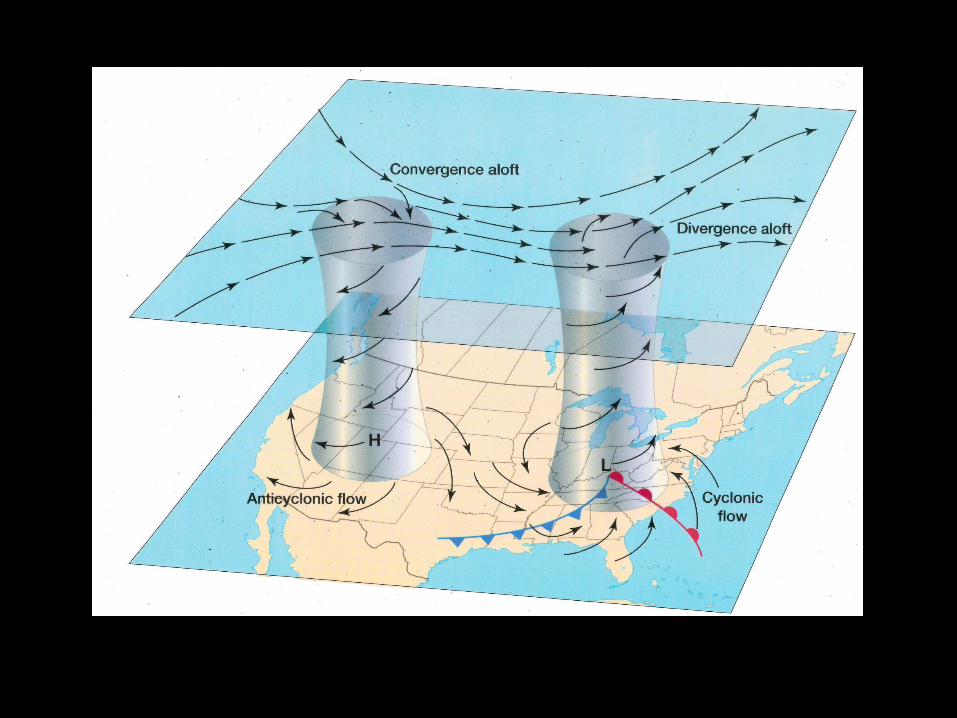
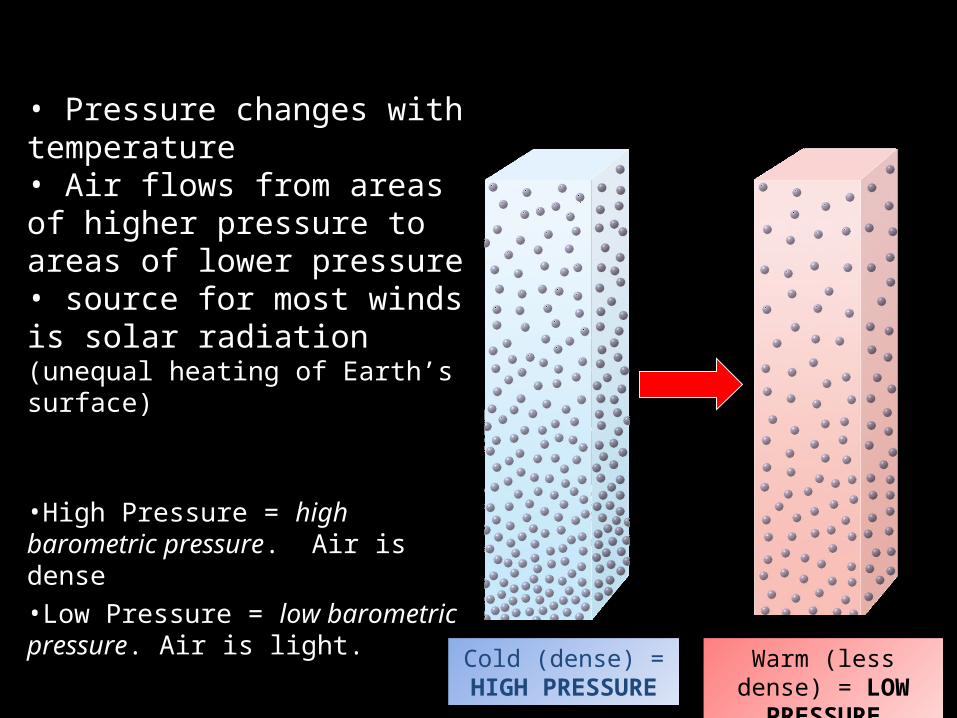
• Pressure changes with temperature• Air flows from areas of higher pressure to areas of lower pressure• source for most winds is solar radiation (unequal heating of Earth’s surface)
•High Pressure = high barometric pressure. Air is dense•Low Pressure = low barometric pressure. Air is light.
Cold (dense) = HIGH PRESSURE
Warm (less dense) = LOW PRESSURE

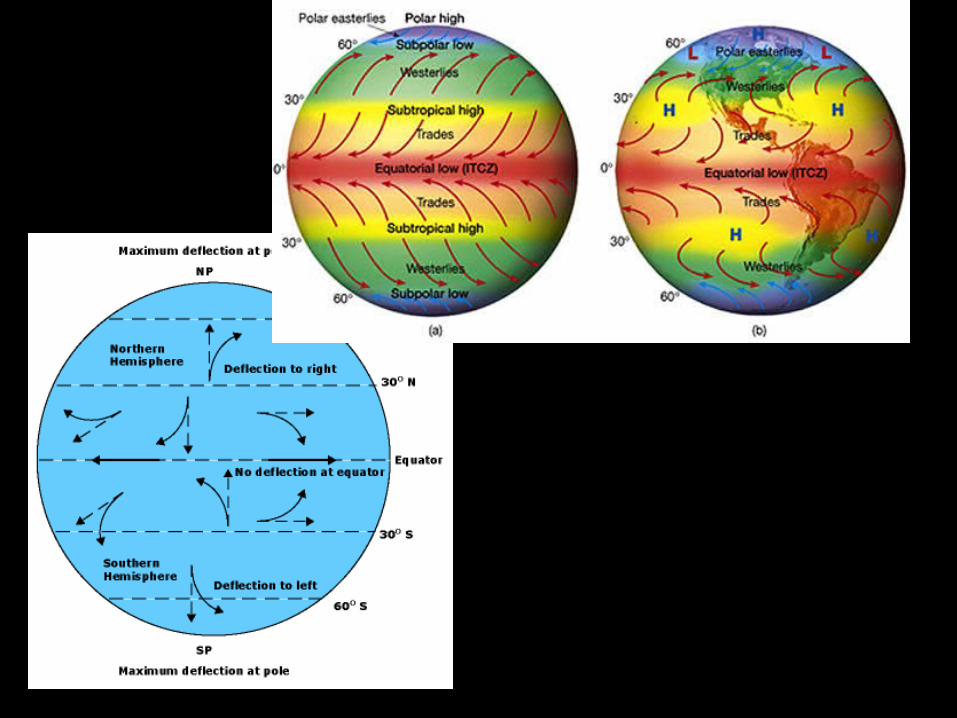
Coriollis Effect
• http://en.wikipedia.org/wiki/Coriolis_effect