Embed Size (px)
Citation preview
Blue Ridge Thunder – Spring 2018 Page 1
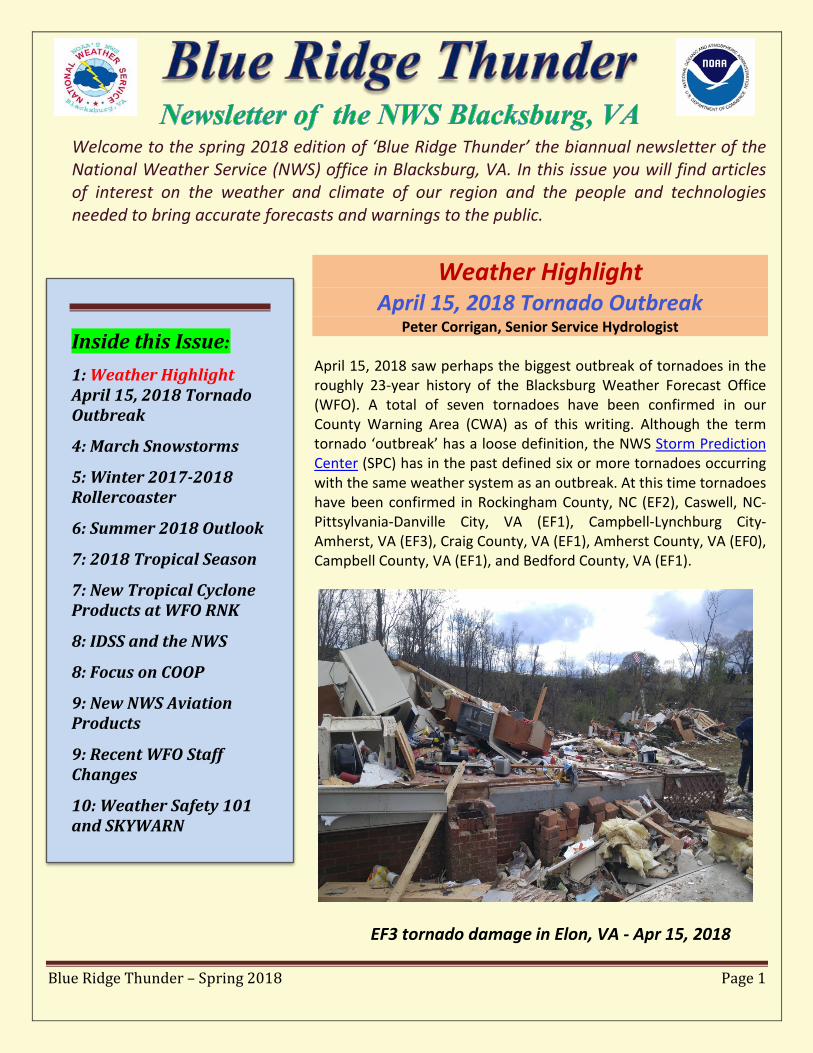
Welcome to the spring 2018 edition of ‘Blue Ridge Thunder’ the biannual newsletter of the National Weather Service (NWS) office in Blacksburg, VA. In this issue you will find articles of interest on the weather and climate of our region and the people and technologies needed to bring accurate forecasts and warnings to the public.
Weather Highlight
April 15, 2018 Tornado Outbreak Peter Corrigan, Senior Service Hydrologist
April 15, 2018 saw perhaps the biggest outbreak of tornadoes in the roughly 23-year history of the Blacksburg Weather Forecast Office (WFO). A total of seven tornadoes have been confirmed in our County Warning Area (CWA) as of this writing. Although the term tornado ‘outbreak’ has a loose definition, the NWS Storm Prediction Center (SPC) has in the past defined six or more tornadoes occurring with the same weather system as an outbreak. At this time tornadoes have been confirmed in Rockingham County, NC (EF2), Caswell, NC-Pittsylvania-Danville City, VA (EF1), Campbell-Lynchburg City-Amherst, VA (EF3), Craig County, VA (EF1), Amherst County, VA (EF0), Campbell County, VA (EF1), and Bedford County, VA (EF1).
EF3 tornado damage in Elon, VA - Apr 15, 2018
Inside this Issue:
1: Weather Highlight April 15, 2018 Tornado Outbreak
4: March Snowstorms
5: Winter 2017-2018 Rollercoaster
6: Summer 2018 Outlook
7: 2018 Tropical Season
7: New Tropical Cyclone Products at WFO RNK
8: IDSS and the NWS
8: Focus on COOP
9: New NWS Aviation Products
9: Recent WFO Staff Changes
10: Weather Safety 101 and SKYWARN
Blue Ridge Thunder – Spring 2018 Page 2
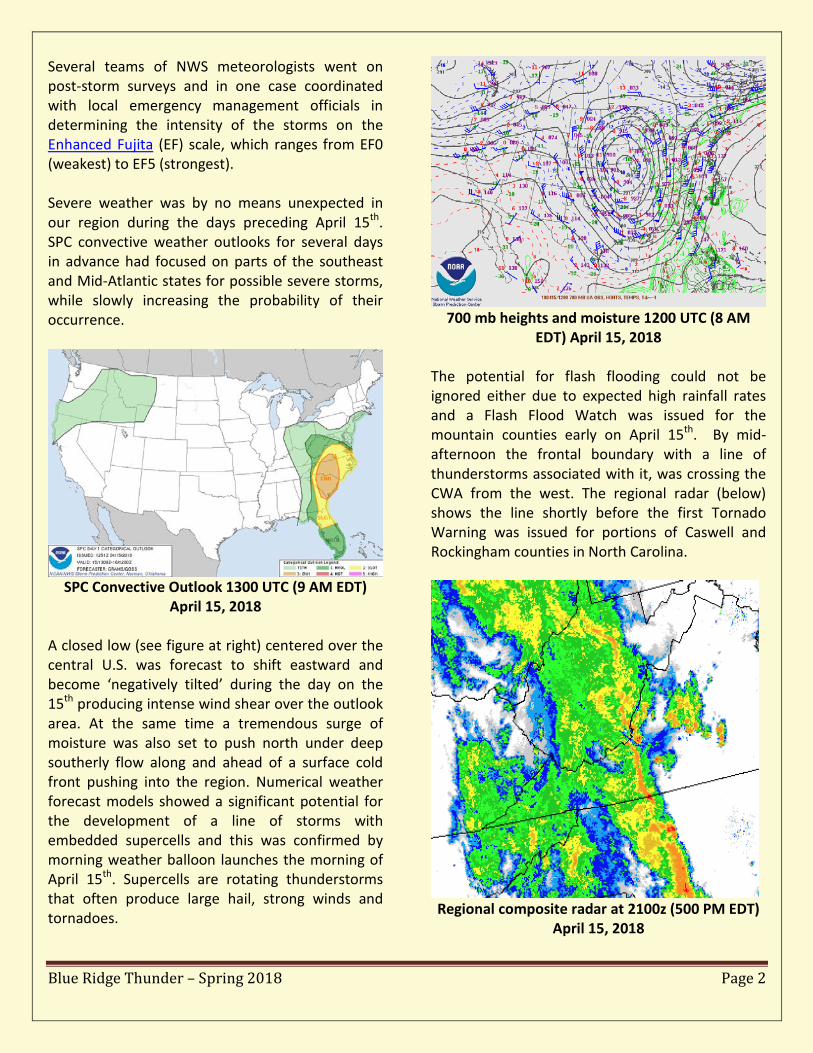
Several teams of NWS meteorologists went on post-storm surveys and in one case coordinated with local emergency management officials in determining the intensity of the storms on the Enhanced Fujita (EF) scale, which ranges from EF0 (weakest) to EF5 (strongest). Severe weather was by no means unexpected in our region during the days preceding April 15th. SPC convective weather outlooks for several days in advance had focused on parts of the southeast and Mid-Atlantic states for possible severe storms, while slowly increasing the probability of their occurrence.
SPC Convective Outlook 1300 UTC (9 AM EDT)
April 15, 2018
A closed low (see figure at right) centered over the central U.S. was forecast to shift eastward and become ‘negatively tilted’ during the day on the 15th producing intense wind shear over the outlook area. At the same time a tremendous surge of moisture was also set to push north under deep southerly flow along and ahead of a surface cold front pushing into the region. Numerical weather forecast models showed a significant potential for the development of a line of storms with embedded supercells and this was confirmed by morning weather balloon launches the morning of April 15th. Supercells are rotating thunderstorms that often produce large hail, strong winds and tornadoes.
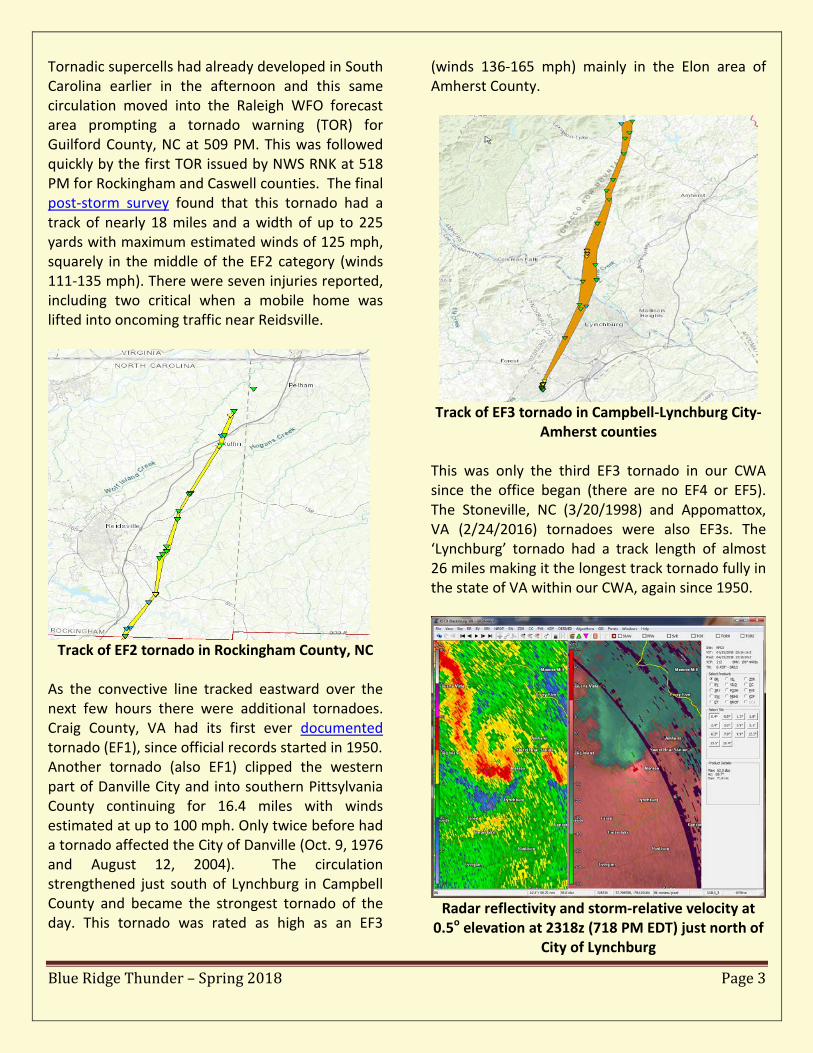
700 mb heights and moisture 1200 UTC (8 AM
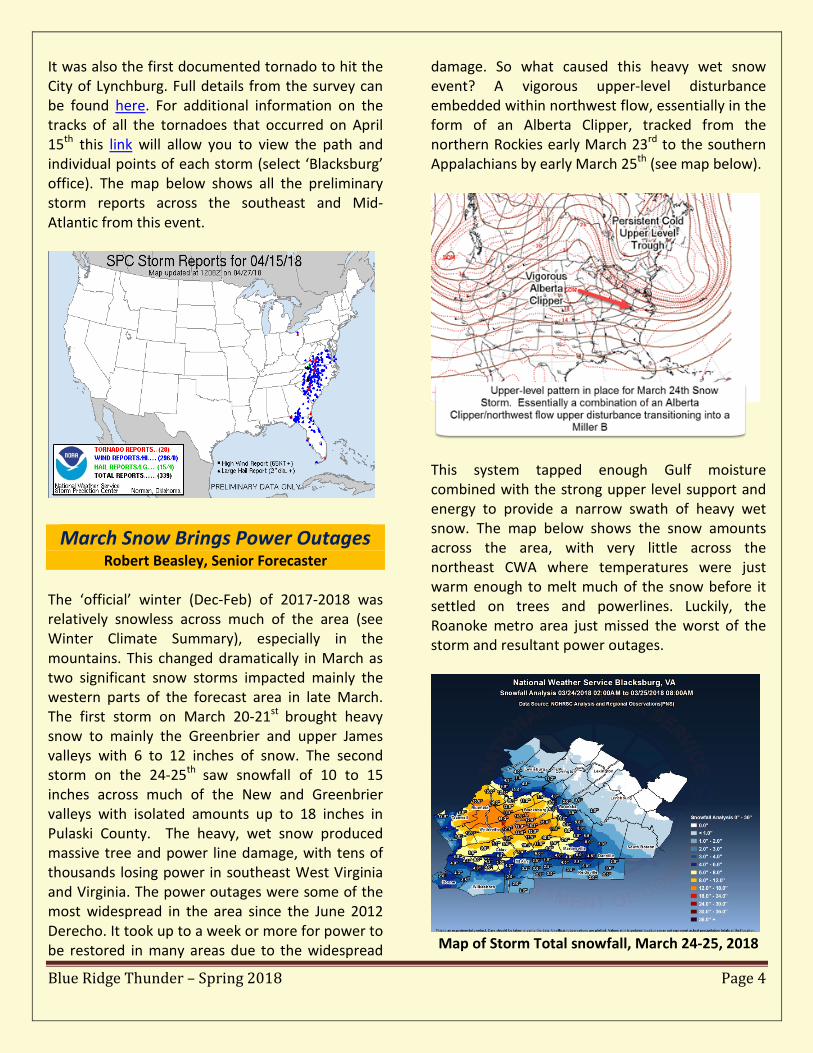
EDT) April 15, 2018 The potential for flash flooding could not be ignored either due to expected high rainfall rates and a Flash Flood Watch was issued for the mountain counties early on April 15th. By mid-afternoon the frontal boundary with a line of thunderstorms associated with it, was crossing the CWA from the west. The regional radar (below) shows the line shortly before the first Tornado Warning was issued for portions of Caswell and Rockingham counties in North Carolina.
Regional composite radar at 2100z (500 PM EDT)
April 15, 2018
Blue Ridge Thunder – Spring 2018 Page 3
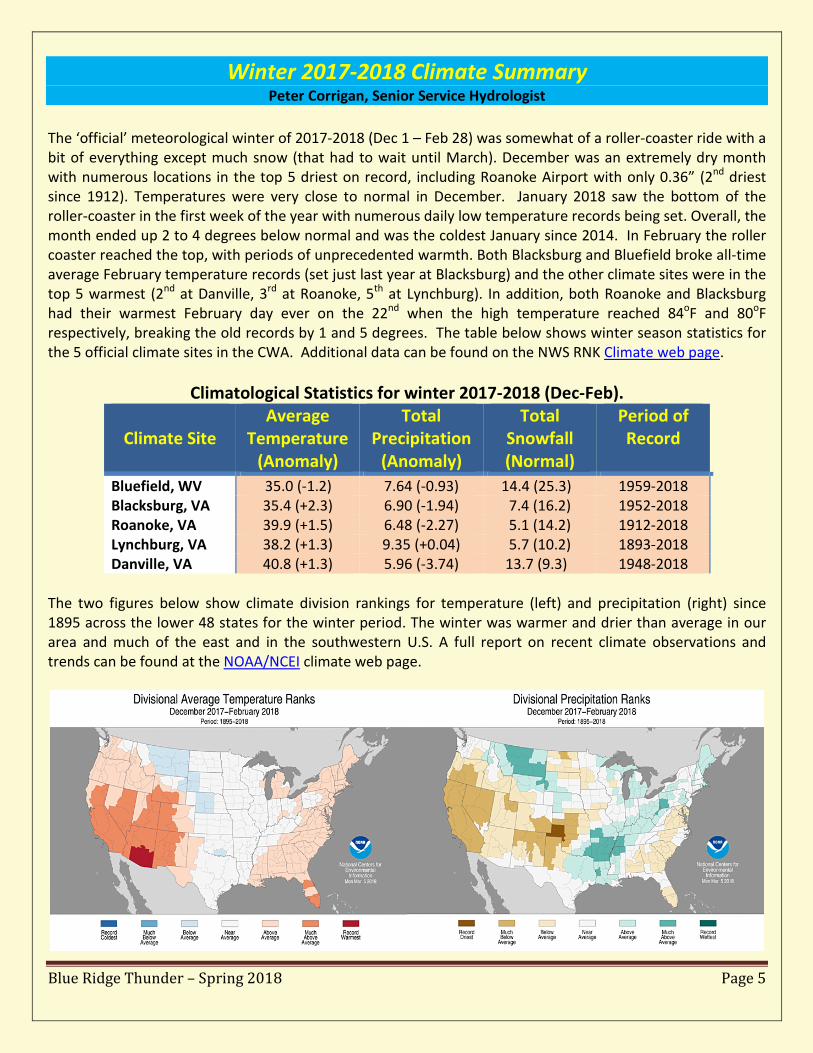
Tornadic supercells had already developed in South Carolina earlier in the afternoon and this same circulation moved into the Raleigh WFO forecast area prompting a tornado warning (TOR) for Guilford County, NC at 509 PM. This was followed quickly by the first TOR issued by NWS RNK at 518 PM for Rockingham and Caswell counties. The final post-storm survey found that this tornado had a track of nearly 18 miles and a width of up to 225 yards with maximum estimated winds of 125 mph, squarely in the middle of the EF2 category (winds 111-135 mph). There were seven injuries reported, including two critical when a mobile home was lifted into oncoming traffic near Reidsville.
Track of EF2 tornado in Rockingham County, NC
As the convective line tracked eastward over the next few hours there were additional tornadoes. Craig County, VA had its first ever documented tornado (EF1), since official records started in 1950. Another tornado (also EF1) clipped the western part of Danville City and into southern Pittsylvania County continuing for 16.4 miles with winds estimated at up to 100 mph. Only twice before had a tornado affected the City of Danville (Oct. 9, 1976 and August 12, 2004). The circulation strengthened just south of Lynchburg in Campbell County and became the strongest tornado of the day. This tornado was rated as high as an EF3
(winds 136-165 mph) mainly in the Elon area of Amherst County.
Track of EF3 tornado in Campbell-Lynchburg City-
Amherst counties This was only the third EF3 tornado in our CWA since the office began (there are no EF4 or EF5). The Stoneville, NC (3/20/1998) and Appomattox, VA (2/24/2016) tornadoes were also EF3s. The ‘Lynchburg’ tornado had a track length of almost 26 miles making it the longest track tornado fully in the state of VA within our CWA, again since 1950.
Radar reflectivity and storm-relative velocity at
0.5o elevation at 2318z (718 PM EDT) just north of City of Lynchburg
Blue Ridge Thunder – Spring 2018 Page 4
It was also the first documented tornado to hit the City of Lynchburg. Full details from the survey can be found here. For additional information on the tracks of all the tornadoes that occurred on April 15th this link will allow you to view the path and individual points of each storm (select ‘Blacksburg’ office). The map below shows all the preliminary storm reports across the southeast and Mid-Atlantic from this event.
March Snow Brings Power Outages Robert Beasley, Senior Forecaster
The ‘official’ winter (Dec-Feb) of 2017-2018 was relatively snowless across much of the area (see Winter Climate Summary), especially in the mountains. This changed dramatically in March as two significant snow storms impacted mainly the western parts of the forecast area in late March. The first storm on March 20-21st brought heavy snow to mainly the Greenbrier and upper James valleys with 6 to 12 inches of snow. The second storm on the 24-25th saw snowfall of 10 to 15 inches across much of the New and Greenbrier valleys with isolated amounts up to 18 inches in Pulaski County. The heavy, wet snow produced massive tree and power line damage, with tens of thousands losing power in southeast West Virginia and Virginia. The power outages were some of the most widespread in the area since the June 2012 Derecho. It took up to a week or more for power to be restored in many areas due to the widespread
damage. So what caused this heavy wet snow event? A vigorous upper-level disturbance embedded within northwest flow, essentially in the form of an Alberta Clipper, tracked from the northern Rockies early March 23rd to the southern Appalachians by early March 25th (see map below).
This system tapped enough Gulf moisture combined with the strong upper level support and energy to provide a narrow swath of heavy wet snow. The map below shows the snow amounts across the area, with very little across the northeast CWA where temperatures were just warm enough to melt much of the snow before it settled on trees and powerlines. Luckily, the Roanoke metro area just missed the worst of the storm and resultant power outages.
Map of Storm Total snowfall, March 24-25, 2018
Blue Ridge Thunder – Spring 2018 Page 5
Winter 2017-2018 Climate Summary Peter Corrigan, Senior Service Hydrologist
The ‘official’ meteorological winter of 2017-2018 (Dec 1 – Feb 28) was somewhat of a roller-coaster ride with a bit of everything except much snow (that had to wait until March). December was an extremely dry month with numerous locations in the top 5 driest on record, including Roanoke Airport with only 0.36” (2nd driest since 1912). Temperatures were very close to normal in December. January 2018 saw the bottom of the roller-coaster in the first week of the year with numerous daily low temperature records being set. Overall, the month ended up 2 to 4 degrees below normal and was the coldest January since 2014. In February the roller coaster reached the top, with periods of unprecedented warmth. Both Blacksburg and Bluefield broke all-time average February temperature records (set just last year at Blacksburg) and the other climate sites were in the top 5 warmest (2nd at Danville, 3rd at Roanoke, 5th at Lynchburg). In addition, both Roanoke and Blacksburg had their warmest February day ever on the 22nd when the high temperature reached 84oF and 80oF respectively, breaking the old records by 1 and 5 degrees. The table below shows winter season statistics for the 5 official climate sites in the CWA. Additional data can be found on the NWS RNK Climate web page.
Climatological Statistics for winter 2017-2018 (Dec-Feb).
Climate Site Average
Temperature (Anomaly)
Total Precipitation
(Anomaly)
Total Snowfall (Normal)
Period of Record
Bluefield, WV 35.0 (-1.2) 7.64 (-0.93) 14.4 (25.3) 1959-2018 Blacksburg, VA 35.4 (+2.3) 6.90 (-1.94) 7.4 (16.2) 1952-2018 Roanoke, VA 39.9 (+1.5) 6.48 (-2.27) 5.1 (14.2) 1912-2018 Lynchburg, VA 38.2 (+1.3) 9.35 (+0.04) 5.7 (10.2) 1893-2018 Danville, VA 40.8 (+1.3) 5.96 (-3.74) 13.7 (9.3) 1948-2018
The two figures below show climate division rankings for temperature (left) and precipitation (right) since 1895 across the lower 48 states for the winter period. The winter was warmer and drier than average in our area and much of the east and in the southwestern U.S. A full report on recent climate observations and trends can be found at the NOAA/NCEI climate web page.
Blue Ridge Thunder – Spring 2018 Page 6
Summer 2018 Outlook: Warm and Wet?
Robert Beasley, Senior Forecaster
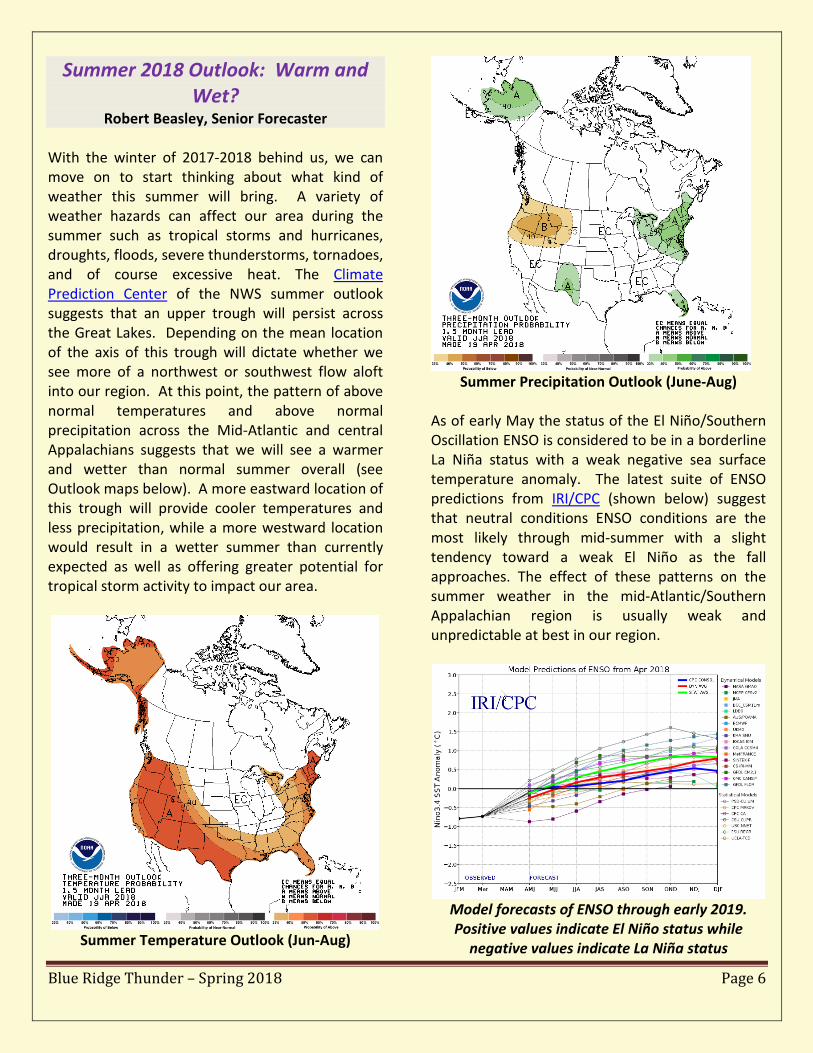
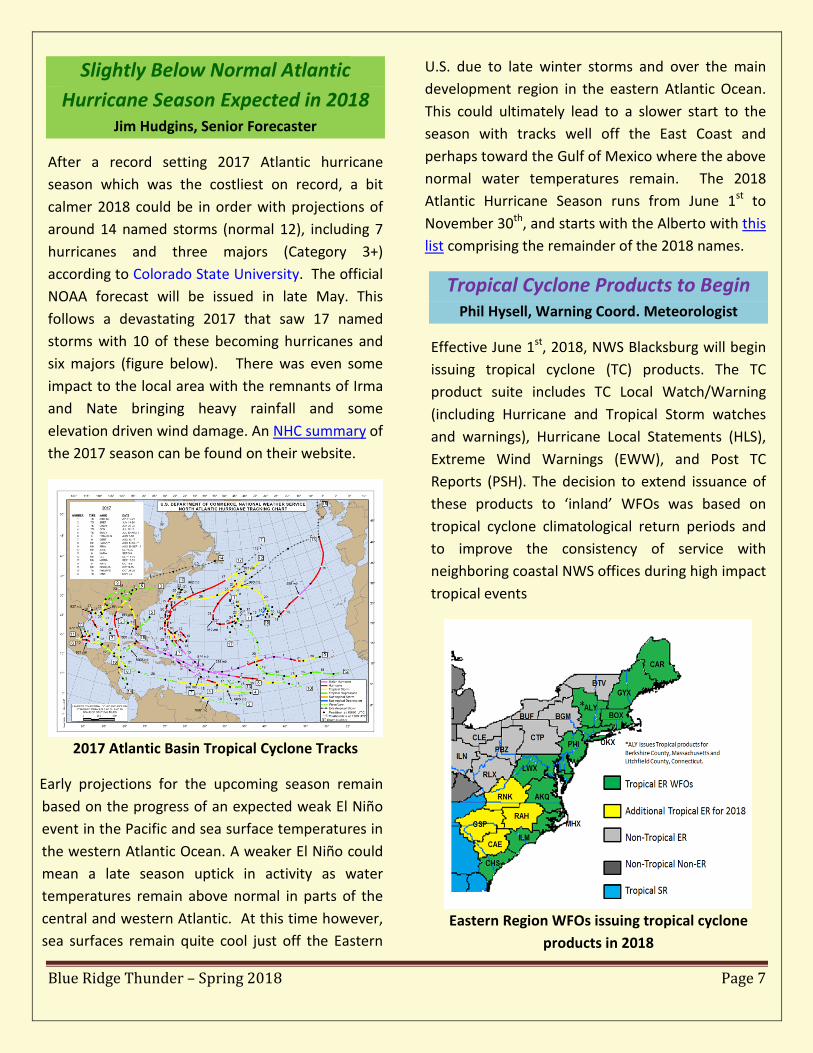
With the winter of 2017-2018 behind us, we can move on to start thinking about what kind of weather this summer will bring. A variety of weather hazards can affect our area during the summer such as tropical storms and hurricanes, droughts, floods, severe thunderstorms, tornadoes, and of course excessive heat. The Climate Prediction Center of the NWS summer outlook suggests that an upper trough will persist across the Great Lakes. Depending on the mean location of the axis of this trough will dictate whether we see more of a northwest or southwest flow aloft into our region. At this point, the pattern of above normal temperatures and above normal precipitation across the Mid-Atlantic and central Appalachians suggests that we will see a warmer and wetter than normal summer overall (see Outlook maps below). A more eastward location of this trough will provide cooler temperatures and less precipitation, while a more westward location would result in a wetter summer than currently expected as well as offering greater potential for tropical storm activity to impact our area.
Summer Temperature Outlook (Jun-Aug)
Summer Precipitation Outlook (June-Aug)
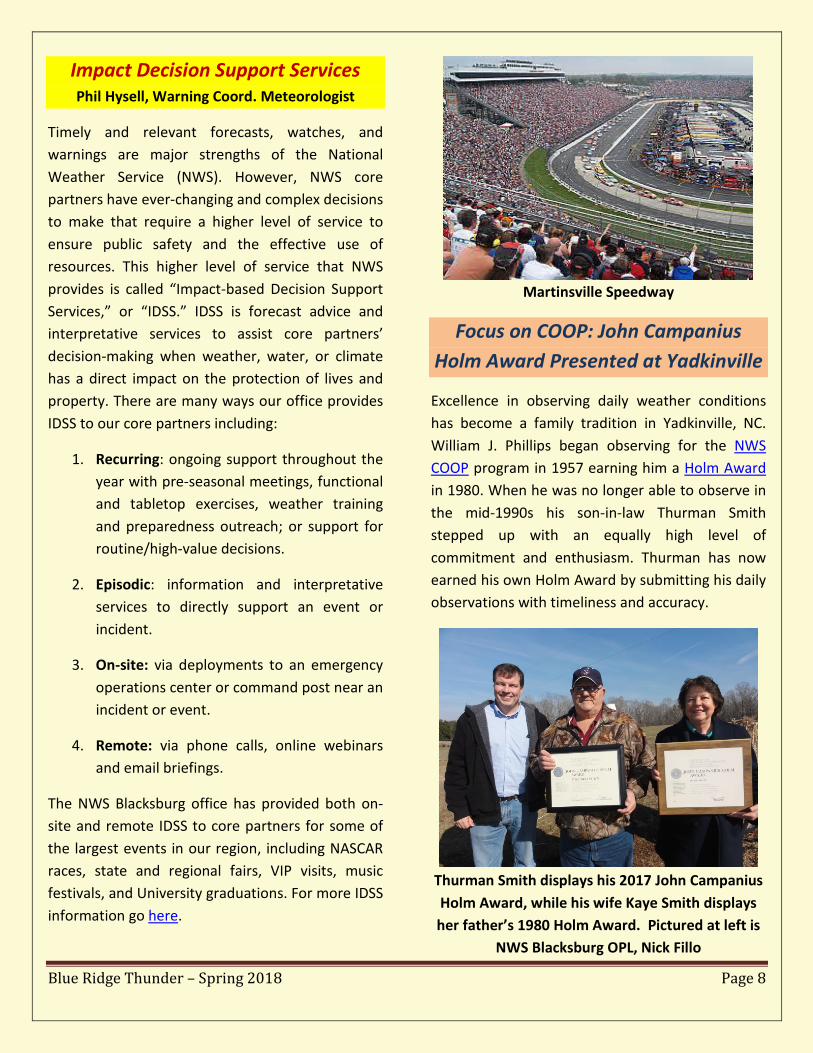
As of early May the status of the El Niño/Southern Oscillation ENSO is considered to be in a borderline La Niña status with a weak negative sea surface temperature anomaly. The latest suite of ENSO predictions from IRI/CPC (shown below) suggest that neutral conditions ENSO conditions are the most likely through mid-summer with a slight tendency toward a weak El Niño as the fall approaches. The effect of these patterns on the summer weather in the mid-Atlantic/Southern Appalachian region is usually weak and unpredictable at best in our region.
Model forecasts of ENSO through early 2019. Positive values indicate El Niño status while
negative values indicate La Niña status
Blue Ridge Thunder – Spring 2018 Page 7
Slightly Below Normal Atlantic Hurricane Season Expected in 2018
Jim Hudgins, Senior Forecaster
After a record setting 2017 Atlantic hurricane season which was the costliest on record, a bit calmer 2018 could be in order with projections of around 14 named storms (normal 12), including 7 hurricanes and three majors (Category 3+) according to Colorado State University. The official NOAA forecast will be issued in late May. This follows a devastating 2017 that saw 17 named storms with 10 of these becoming hurricanes and six majors (figure below). There was even some impact to the local area with the remnants of Irma and Nate bringing heavy rainfall and some elevation driven wind damage. An NHC summary of the 2017 season can be found on their website.
2017 Atlantic Basin Tropical Cyclone Tracks
Early projections for the upcoming season remain based on the progress of an expected weak El Niño event in the Pacific and sea surface temperatures in the western Atlantic Ocean. A weaker El Niño could mean a late season uptick in activity as water temperatures remain above normal in parts of the central and western Atlantic. At this time however, sea surfaces remain quite cool just off the Eastern
U.S. due to late winter storms and over the main development region in the eastern Atlantic Ocean. This could ultimately lead to a slower start to the season with tracks well off the East Coast and perhaps toward the Gulf of Mexico where the above normal water temperatures remain. The 2018 Atlantic Hurricane Season runs from June 1st to November 30th, and starts with the Alberto with this list comprising the remainder of the 2018 names.
Tropical Cyclone Products to Begin Phil Hysell, Warning Coord. Meteorologist
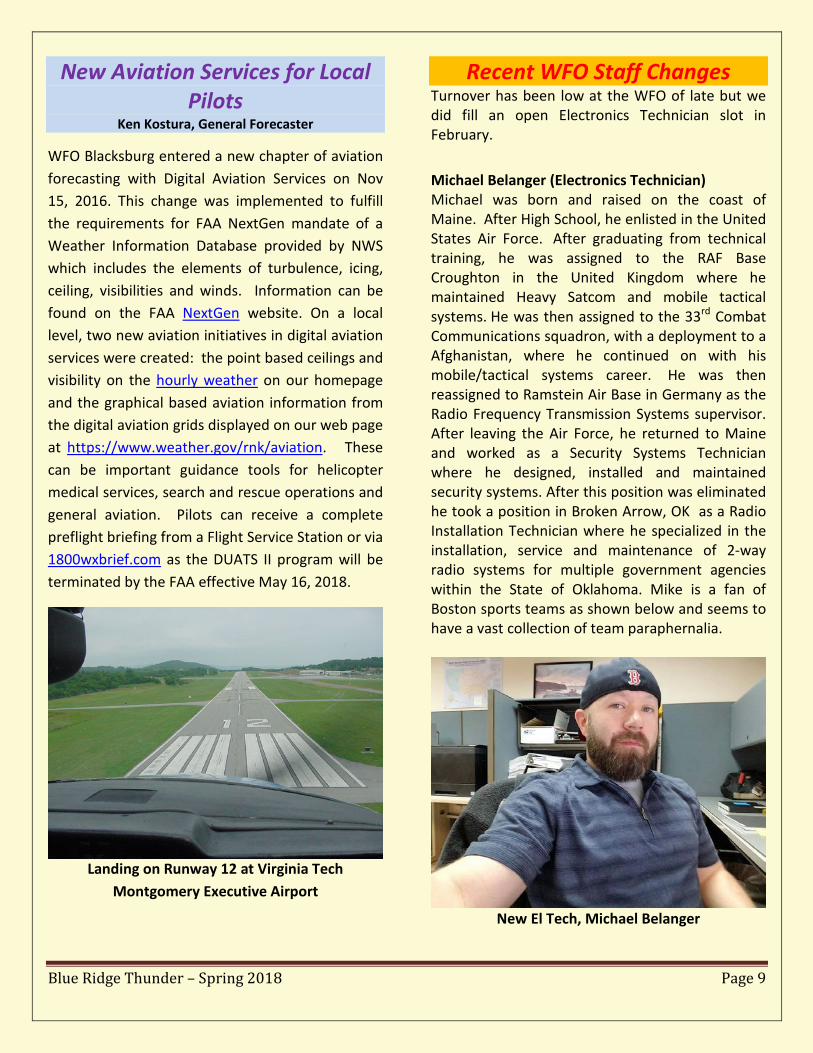
Effective June 1st, 2018, NWS Blacksburg will begin issuing tropical cyclone (TC) products. The TC product suite includes TC Local Watch/Warning (including Hurricane and Tropical Storm watches and warnings), Hurricane Local Statements (HLS), Extreme Wind Warnings (EWW), and Post TC Reports (PSH). The decision to extend issuance of these products to ‘inland’ WFOs was based on tropical cyclone climatological return periods and to improve the consistency of service with neighboring coastal NWS offices during high impact tropical events
Eastern Region WFOs issuing tropical cyclone products in 2018
Blue Ridge Thunder – Spring 2018 Page 8
Impact Decision Support Services Phil Hysell, Warning Coord. Meteorologist
Timely and relevant forecasts, watches, and warnings are major strengths of the National Weather Service (NWS). However, NWS core partners have ever-changing and complex decisions to make that require a higher level of service to ensure public safety and the effective use of resources. This higher level of service that NWS provides is called “Impact-based Decision Support Services,” or “IDSS.” IDSS is forecast advice and interpretative services to assist core partners’ decision-making when weather, water, or climate has a direct impact on the protection of lives and property. There are many ways our office provides IDSS to our core partners including:
1. Recurring: ongoing support throughout the year with pre-seasonal meetings, functional and tabletop exercises, weather training and preparedness outreach; or support for routine/high-value decisions.
2. Episodic: information and interpretative services to directly support an event or incident.
3. On-site: via deployments to an emergency operations center or command post near an incident or event.
4. Remote: via phone calls, online webinars and email briefings.
The NWS Blacksburg office has provided both on-site and remote IDSS to core partners for some of the largest events in our region, including NASCAR races, state and regional fairs, VIP visits, music festivals, and University graduations. For more IDSS information go here.
Martinsville Speedway
Focus on COOP: John Campanius Holm Award Presented at Yadkinville
Excellence in observing daily weather conditions has become a family tradition in Yadkinville, NC. William J. Phillips began observing for the NWS COOP program in 1957 earning him a Holm Award in 1980. When he was no longer able to observe in the mid-1990s his son-in-law Thurman Smith stepped up with an equally high level of commitment and enthusiasm. Thurman has now earned his own Holm Award by submitting his daily observations with timeliness and accuracy.
Thurman Smith displays his 2017 John Campanius Holm Award, while his wife Kaye Smith displays her father’s 1980 Holm Award. Pictured at left is
NWS Blacksburg OPL, Nick Fillo
Blue Ridge Thunder – Spring 2018 Page 9
New Aviation Services for Local Pilots
Ken Kostura, General Forecaster
WFO Blacksburg entered a new chapter of aviation forecasting with Digital Aviation Services on Nov 15, 2016. This change was implemented to fulfill the requirements for FAA NextGen mandate of a Weather Information Database provided by NWS which includes the elements of turbulence, icing, ceiling, visibilities and winds. Information can be found on the FAA NextGen website. On a local level, two new aviation initiatives in digital aviation services were created: the point based ceilings and visibility on the hourly weather on our homepage and the graphical based aviation information from the digital aviation grids displayed on our web page at https://www.weather.gov/rnk/aviation. These can be important guidance tools for helicopter medical services, search and rescue operations and general aviation. Pilots can receive a complete preflight briefing from a Flight Service Station or via 1800wxbrief.com as the DUATS II program will be terminated by the FAA effective May 16, 2018.
Landing on Runway 12 at Virginia Tech Montgomery Executive Airport
Recent WFO Staff Changes Turnover has been low at the WFO of late but we did fill an open Electronics Technician slot in February.
Michael Belanger (Electronics Technician) Michael was born and raised on the coast of Maine. After High School, he enlisted in the United States Air Force. After graduating from technical training, he was assigned to the RAF Base Croughton in the United Kingdom where he maintained Heavy Satcom and mobile tactical systems. He was then assigned to the 33rd Combat Communications squadron, with a deployment to a Afghanistan, where he continued on with his mobile/tactical systems career. He was then reassigned to Ramstein Air Base in Germany as the Radio Frequency Transmission Systems supervisor. After leaving the Air Force, he returned to Maine and worked as a Security Systems Technician where he designed, installed and maintained security systems. After this position was eliminated he took a position in Broken Arrow, OK as a Radio Installation Technician where he specialized in the installation, service and maintenance of 2-way radio systems for multiple government agencies within the State of Oklahoma. Mike is a fan of Boston sports teams as shown below and seems to have a vast collection of team paraphernalia.
New El Tech, Michael Belanger
Blue Ridge Thunder – Spring 2018 Page 10
Weather Safety 101 and SKYWARN
Spring and summer bring with them warm temperatures and outdoor activities along with the possibility of a whole range of weather hazards including severe storms, tornadoes, flooding and lighting. The NWS Weather Safety web page provides a wealth of information on all types weather and water hazards. If you are interested in helping the NWS in storm spotting and verification consider participating in the SKYWARN program. In addition the NWS can always use new rain/snow observers for the CoCoRaHS network, especially in West Virginia!
Report Severe Weather!
Trained spotters or the public should report the following to the NWS via Social Media (Twitter/Facebook) or SKYWARN: 1-800-221-2856.
• Tornadoes or funnel clouds • Wind damage, such as structural damage or trees/power lines down. • Measured or estimated wind gusts of 50 MPH or greater • Hail of any size • Water flowing over a road • Creeks or streams leaving their banks
‘Keep an Eye on the Sky!’
Blue Ridge Thunder – Spring 2018 Page 11
Visit us on the web: www.weather.gov/rnk Follow us on Twitter and Facebook
For questions/comments on Blue Ridge Thunder Please contact the editor