Embed Size (px)
Citation preview
Annual Report
2017
We dream the Future and Deliver it.
For the past 40 years, Systems Limited has helped its customers achieve their business objectives using leading-edge digital technologies. We have consistently met challenges and exceeded customer expectations through excellence in delivery and superior solutions for complex, mission-critical projects. Our strong focus on realizing disruptive and innovative ideas has led us to establish prestigious top-tier partnerships with Microsoft and IBM, as well as strong relationships with Oracle, Cisco, VMWare, Huawei, Kaspersky, Informatica, and MicroStrategy.
Our products and services have helped improve productivity and protability for hundreds of organizations in Pakistan and around the world. As an employee-owned company with a global workforce of around 2,000 employees, Systems Limited has established a strong presence in the USA, UAE and Qatar, and is engaged in ongoing projects in Germany, Oman, Saudi Arabia, Jordan, and Bahrain.
Annual Report 2017
“One of the key things in the tech business in particular is thatyou need to be able to pushboundaries.”
Company Prole
Stakeholders’ Information
Corporate Governance
Separate Financial Statements
Consolidated Financial Statements
01
Contents
Company Information
Prole of the Board of Directors
Vision and Mission
About Systems Limited
Partnerships, Technical Competencies & Recognition
Services and Solutions
Our Products
Business Model and Competencies
02
04
06
08
08
11
12
13
Financial Analysis
Shareholders' Information
Chairman's Review
CEO's Review
Directors' Report to the Shareholders
Pattern of Shareholding-Systems
Pattern of Shareholding-Group
Notice of Annual General Meeting
Statement of Compliance
with the Code of Corporate Governance
Review Report to the Members
on Statement of Compliance with Best Practices of
Code of Corporate Governance
14
20
22
23
24
37
38
40
42
50
51
Auditors' Report to the Members
Balance Sheet
Prot and Loss Account
Statement of Comprehensive Income
Cash Flow Statement
Statement of Changes in Equity
Notes to the Financial Statements
54
55
56
57
58
59
60
Auditors' Report to the Members
Consolidated Balance Sheet
Consolidated Prot and Loss Account
Consolidated Statement of
Comprehensive Income
Consolidated Cash Flow Statement
Consolidated Statement of
Changes in Equity
Notes to the Consolidated
Financial Statements
Form of Proxy
92
93
94
95
96
97
98
131
- Satya Nadella
Innovation is the only wayto win.
-Steve Jobs
Board of Directors
Human Resource & Compensation Committee
Mr. Asif Jooma Chairman
Mr. Tahir Masaud Member
Ms. Romana AbdullahMember
Mr. Ayaz Dawood Chairman
Mr. Tahir Masaud Member
Ms. Romana AbdullahMember
Audit Committee
Ms. Roohi Khan
Chief Financial Officer & Company Secretary
External Auditors
Ernst & Young Ford Rhodes Chartered Accountants Lahore
Internal Auditors
Uzair Hammad Faisal & Co.
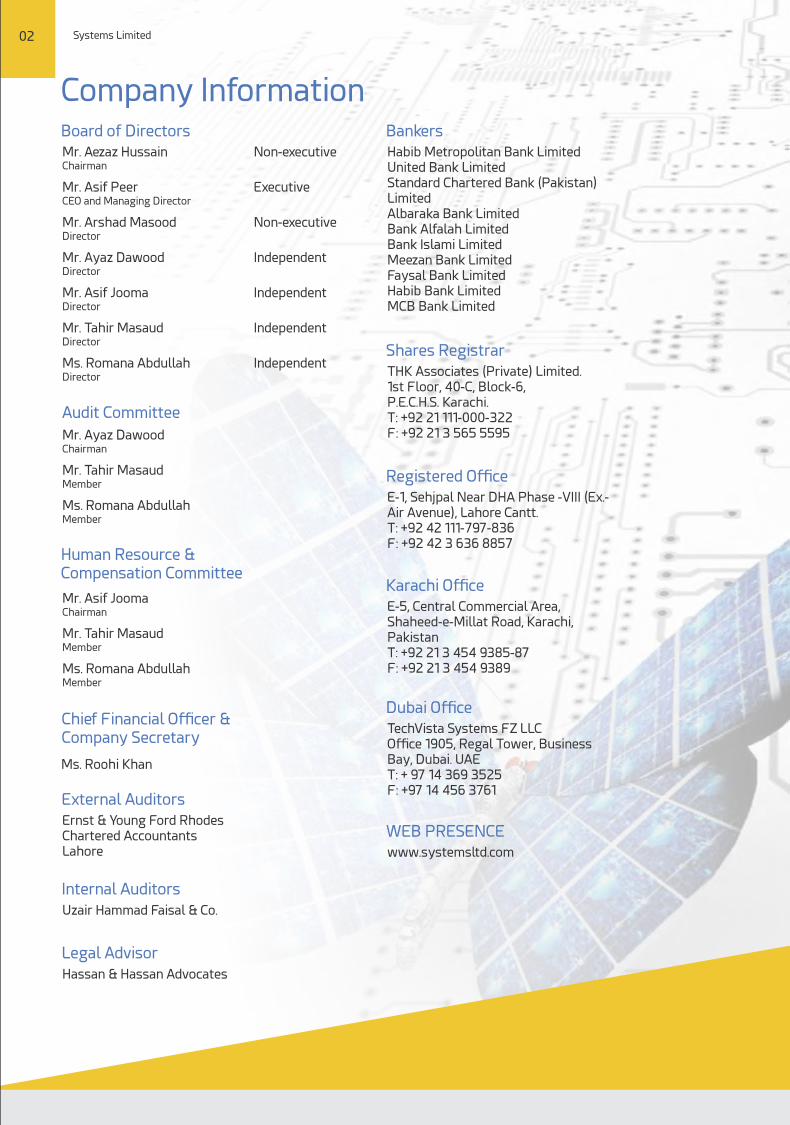
Bankers
Habib Metropolitan Bank Limited United Bank Limited Standard Chartered Bank (Pakistan) Limited Albaraka Bank Limited Bank Alfalah Limited Bank Islami Limited Meezan Bank Limited Faysal Bank Limited Habib Bank LimitedMCB Bank Limited
Shares Registrar
THK Associates (Private) Limited. 1st Floor, 40-C, Block-6,P.E.C.H.S. Karachi.T: +92 21 111-000-322 F: +92 21 3 565 5595
Registered Office
E-1, Sehjpal Near DHA Phase -VIII (Ex.-Air Avenue), Lahore Cantt.T: +92 42 111-797-836F: +92 42 3 636 8857
Karachi Office
E-5, Central Commercial Area, Shaheed-e-Millat Road, Karachi, Pakistan T: +92 21 3 454 9385-87 F: +92 21 3 454 9389
Dubai Office
TechVista Systems FZ LLC Office 1905, Regal Tower, Business Bay, Dubai. UAE T: + 97 14 369 3525 F: +97 14 456 3761
WEB PRESENCE
www.systemsltd.com
Company Information
Annual Report 2017 0302 Systems Limited
Mr. Aezaz Hussain Non-executive Chairman
Mr. Asif Peer Executive CEO and Managing Director
Mr. Arshad Masood Non-executive Director
Mr. Ayaz Dawood Independent Director
Mr. Asif Jooma Independent Director
Mr. Tahir Masaud Independent Director
Ms. Romana Abdullah Independent Director
Legal Advisor
Hassan & Hassan Advocates
Innovation is the only wayto win.
-Steve Jobs
Board of Directors
Human Resource & Compensation Committee
Mr. Asif Jooma Chairman
Mr. Tahir Masaud Member
Ms. Romana AbdullahMember
Mr. Ayaz Dawood Chairman
Mr. Tahir Masaud Member
Ms. Romana AbdullahMember
Audit Committee
Ms. Roohi Khan
Chief Financial Officer & Company Secretary
External Auditors
Ernst & Young Ford Rhodes Chartered Accountants Lahore
Internal Auditors
Uzair Hammad Faisal & Co.
Bankers
Habib Metropolitan Bank Limited United Bank Limited Standard Chartered Bank (Pakistan) Limited Albaraka Bank Limited Bank Alfalah Limited Bank Islami Limited Meezan Bank Limited Faysal Bank Limited Habib Bank LimitedMCB Bank Limited
Shares Registrar
THK Associates (Private) Limited. 1st Floor, 40-C, Block-6,P.E.C.H.S. Karachi.T: +92 21 111-000-322 F: +92 21 3 565 5595
Registered Office
E-1, Sehjpal Near DHA Phase -VIII (Ex.-Air Avenue), Lahore Cantt.T: +92 42 111-797-836F: +92 42 3 636 8857
Karachi Office
E-5, Central Commercial Area, Shaheed-e-Millat Road, Karachi, Pakistan T: +92 21 3 454 9385-87 F: +92 21 3 454 9389
Dubai Office
TechVista Systems FZ LLC Office 1905, Regal Tower, Business Bay, Dubai. UAE T: + 97 14 369 3525 F: +97 14 456 3761
WEB PRESENCE
www.systemsltd.com
Company Information
Annual Report 2017 0302 Systems Limited
Mr. Aezaz Hussain Non-executive Chairman
Mr. Asif Peer Executive CEO and Managing Director
Mr. Arshad Masood Non-executive Director
Mr. Ayaz Dawood Independent Director
Mr. Asif Jooma Independent Director
Mr. Tahir Masaud Independent Director
Ms. Romana Abdullah Independent Director
Legal Advisor
Hassan & Hassan Advocates
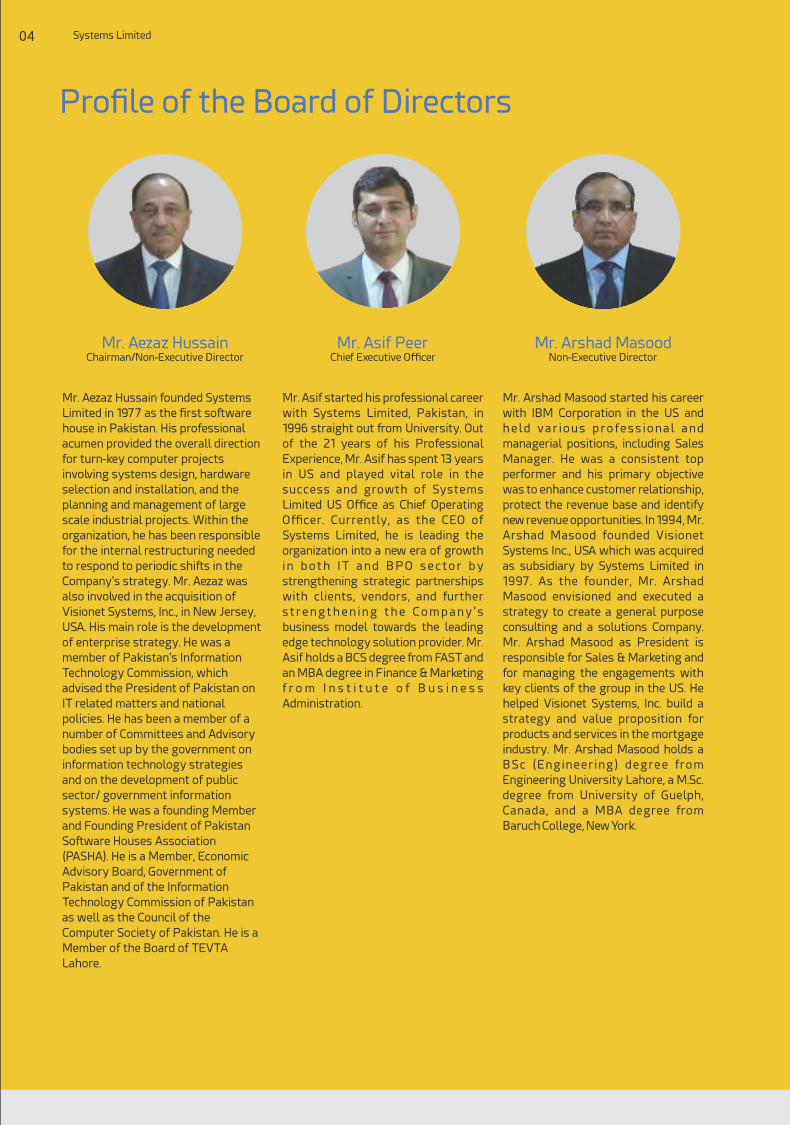
Prole of the Board of Directors
Mr. Aezaz Hussain Chairman/Non-Executive Director
Mr. Asif Peer Chief Executive Officer
Mr. Aezaz Hussain founded Systems
Limited in 1977 as the rst software
house in Pakistan. His professional
acumen provided the overall direction
for turn-key computer projects
involving systems design, hardware
selection and installation, and the
planning and management of large
scale industrial projects. Within the
organization, he has been responsible
for the internal restructuring needed
to respond to periodic shifts in the
Company's strategy. Mr. Aezaz was
also involved in the acquisition of
Visionet Systems, Inc., in New Jersey,
USA. His main role is the development
of enterprise strategy. He was a
member of Pakistan's Information
Technology Commission, which
advised the President of Pakistan on
IT related matters and national
policies. He has been a member of a
number of Committees and Advisory
bodies set up by the government on
information technology strategies
and on the development of public
sector/ government information
systems. He was a founding Member
and Founding President of Pakistan
Software Houses Association
(PASHA). He is a Member, Economic
Advisory Board, Government of
Pakistan and of the Information
Technology Commission of Pakistan
as well as the Council of the
Computer Society of Pakistan. He is a
Member of the Board of TEVTA
Lahore.
Mr. Asif started his professional career
with Systems Limited, Pakistan, in
1996 straight out from University. Out
of the 21 years of his Professional
Experience, Mr. Asif has spent 13 years
in US and played vital role in the
success and growth of Systems
Limited US Office as Chief Operating
Officer. Currently, as the CEO of
Systems Limited, he is leading the
organization into a new era of growth
i n b o t h I T a n d B P O s e c t o r b y
strengthening strategic partnerships
with clients, vendors, and further
s t r e n g t h e n i n g t h e C o m p a n y ' s
business model towards the leading
edge technology solution provider. Mr.
Asif holds a BCS degree from FAST and
an MBA degree in Finance & Marketing
f r o m I n s t i t u t e o f B u s i n e s s
Administration.
Mr. Tahir Masaud is the Chief Executive
Officer of IGI Insurance Limited and a
Director on the Board of IGI Life
Insurance Limited. He joined as a
Director on Board of Systems Limited
on 18 March 2015. Mr. Masaud brings
with him over 17 years of rich and
varied experience gained in senior
leadership positions within the
general insurance sector in Pakistan
and United Kingdom. His background
i n c l u d e s s a l e s a n d m a r ke t i n g
administration, product development
and project management. He is a
Chartered Insurer with an Advanced
Diploma in Insurance (ACII) from
Chartered Insurance Institute, United
Kingdom. Mr. Tahir has completed his
p o s t g r a d u a t i o n s i n C o m p u t e r
Sciences and Business Administration
f r o m L a h o r e U n i v e r s i t y o f
Management Sc iences (LUMS) ,
Pakistan. He has attended numerous
professional development programs in
P a k i s t a n , U n i t e d K i n g d o m a n d
Germany.
Annual Report 2017 0504 Systems Limited
Mr. Arshad Masood started his career
with IBM Corporation in the US and
h e l d v a r i o u s p r o fe s s i o n a l a n d
managerial positions, including Sales
Manager. He was a consistent top
performer and his primary objective
was to enhance customer relationship,
protect the revenue base and identify
new revenue opportunities. In 1994, Mr.
Arshad Masood founded Visionet
Systems Inc., USA which was acquired
as subsidiary by Systems Limited in
1997. As the founder, Mr. Arshad
Masood envisioned and executed a
strategy to create a general purpose
consulting and a solutions Company.
Mr. Arshad Masood as President is
responsible for Sales & Marketing and
for managing the engagements with
key clients of the group in the US. He
helped Visionet Systems, Inc. build a
strategy and value proposition for
products and services in the mortgage
industry. Mr. Arshad Masood holds a
BSc (Engineer ing) degree from
Engineering University Lahore, a M.Sc.
degree from University of Guelph,
Canada, and a MBA degree from
Baruch College, New York.
Mr. Ayaz Dawood Independent Director
Mr. Ayaz Dawood is serving BRR
Investments (Private) Ltd. (Managers
of BRR Guardian Modaraba and
Crescent Standard Modaraba) as its
Chief Executive. He has the distinction
of being Founder of Burj Bank
(Dawood Islamic Bank), Dawood
Family Takaful, Dawood Equities
Limited, First Dawood Investment
Bank, Dawood Capital Management,
managers of First Dawood Mutual
Fund, Dawood Money Market Fund and
Dawood Islamic Fund. Mr. Dawood has
also served Modaraba Association of
Pakistan as its Chairman. He is a
director of Japan Power Company
Limited and Chairman of its Human
Resource Committee and a director of
Systems Limited and Chairman of its
Audit Committee. A member of Young
Presidents Organization, Mr. Dawood
is a graduate in Economics from McGill
University, Montreal and completed
his MBA in Finance and Money and
Financial Markets with distinction
from Colombia Business School, New
York.
Mr. Asif Jooma Independent Director
Mr. Asif Jooma started his career in the
corporate sector with ICI Pakistan in
1983 and has over 28 years of
ex t e n s i ve ex p e r i e n c e i n s e n i o r
commercial and leadership roles.
Following early years with ICI Pakistan
and subsequently Pakistan PTA
Limited, Asif Jooma was appointed
Managing Director of Abbott Labora-
tories Pakistan Limited in 2007. After
serving there for nearly six years, he
was appointed Chief Executive of ICI
Pakistan Limited in February 2013. A
Bachelor of Arts in Developmental
Economics from Boston University, Mr.
A s i f h a s p r e v i o u s ly s e r v e d a s
President, American Business Council
(ABC), President of Overseas Investors
Chamber of Commerce & Industry
(OICCI) and Chairman of Pharma
Bureau. He also serves as a Director on
NIB Bank Limited, Systems Limited and
Board of Investment, Government of
Pakistan.
Mrs. Romana Abdullah is CEO of Highpoint Ventures (Pvt) Ltd and leads Hopscotch, a
kidswear brand she co-founded in 2014. Prior to becoming an entrepreneur, Romana
was part of the Management Team of MCB Bank, one of Pakistan’s largest banks,
leading their strategic planning, transformation and new initiative functions. She was
also Group Head for strategy at Soneri Bank. Earlier, Romana spent signicant time at
The Boston Consulting Group (Management Consulting) and Merrill Lynch (Investment
Banking) in New York, where she focused on strategic, nancial and operational
assignments for Fortune 500 nancial services and consumer clients. Romana is also
on the board of Karandaaz, a DFID and Gates Foundation funded company that
promotes access to capital for small businesses and digital nancial inclusion for
individuals in Pakistan. She also mentors young start-ups/incubators/accelerators in
her free time. Romana has a BSc in Financial Engineering from Princeton University and
an MBA from the Harvard Business School.
Mr. Tahir Masaud Independent Director
Mrs. Romana AbdullahIndependent Director
Mr. Arshad Masood Non-Executive Director

Our VisionSystem Limited strives to maximize customers' business value
through our solutions, services, and people. We are committed to
providing thought leadership and accelerating digital transformation
in the region.
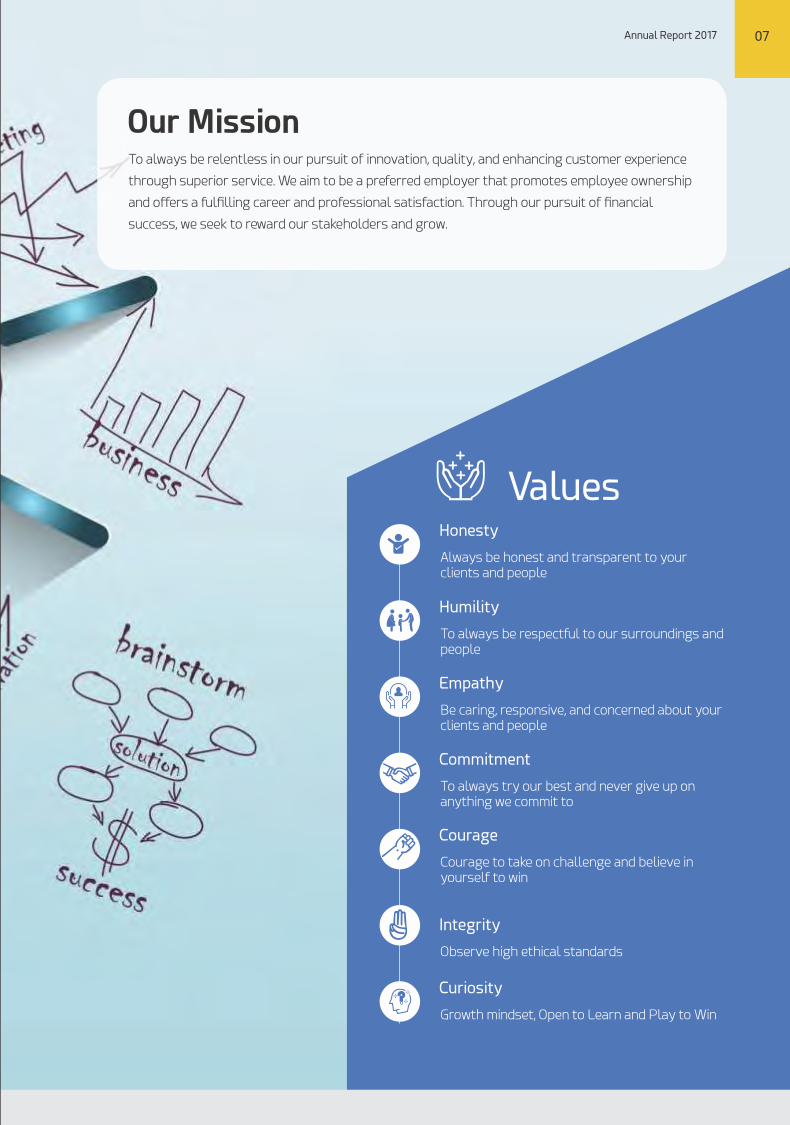
Our MissionTo always be relentless in our pursuit of innovation, quality, and enhancing customer experience
through superior service. We aim to be a preferred employer that promotes employee ownership
and offers a fullling career and professional satisfaction. Through our pursuit of nancial
success, we seek to reward our stakeholders and grow.
Values
Annual Report 2017 0706 Systems Limited
Humility
To always be respectful to our surroundings and people
Honesty
Always be honest and transparent to your clients and people
Empathy
Be caring, responsive, and concerned about your clients and people
Commitment
To always try our best and never give up on anything we commit to
Courage
Courage to take on challenge and believe in yourself to win
Integrity
Observe high ethical standards
Curiosity
Growth mindset, Open to Learn and Play to Win
Our VisionSystem Limited strives to maximize customers' business value
through our solutions, services, and people. We are committed to
providing thought leadership and accelerating digital transformation
in the region.
Our MissionTo always be relentless in our pursuit of innovation, quality, and enhancing customer experience
through superior service. We aim to be a preferred employer that promotes employee ownership
and offers a fullling career and professional satisfaction. Through our pursuit of nancial
success, we seek to reward our stakeholders and grow.
Values
Annual Report 2017 0706 Systems Limited
Humility
To always be respectful to our surroundings and people
Honesty
Always be honest and transparent to your clients and people
Empathy
Be caring, responsive, and concerned about your clients and people
Commitment
To always try our best and never give up on anything we commit to
Courage
Courage to take on challenge and believe in yourself to win
Integrity
Observe high ethical standards
Curiosity
Growth mindset, Open to Learn and Play to Win
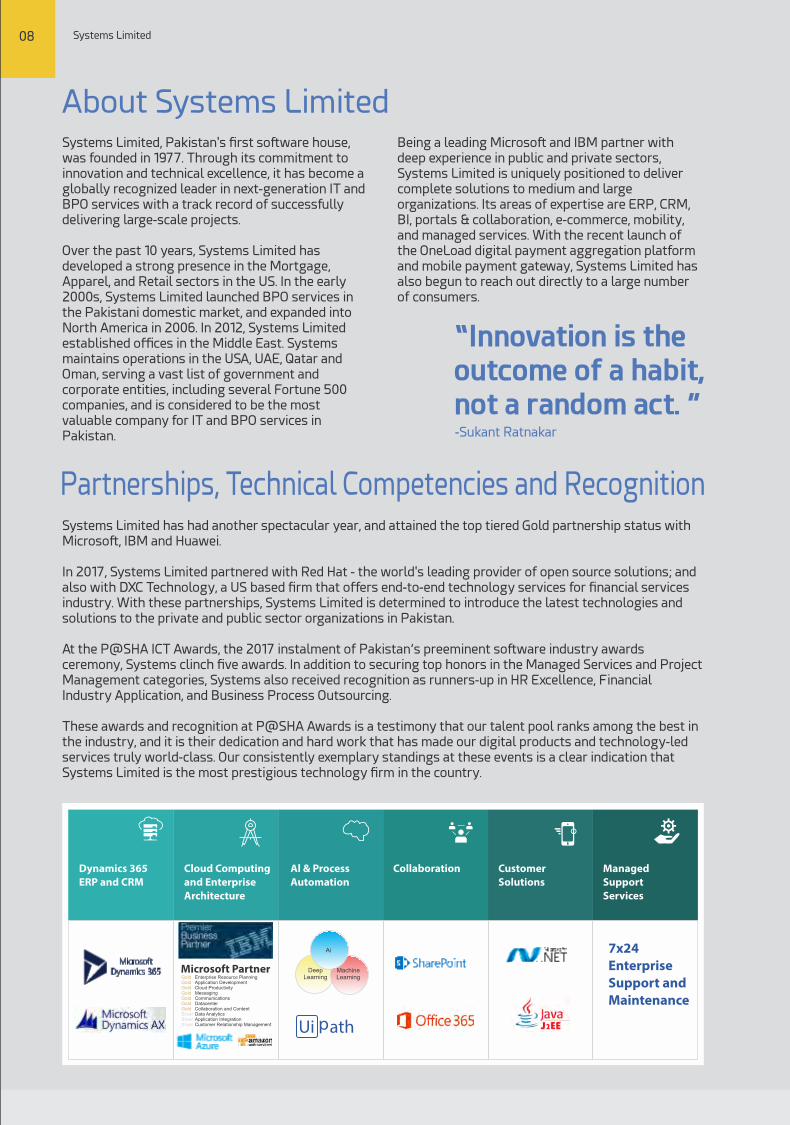
About Systems LimitedSystems Limited, Pakistan's rst software house, was founded in 1977. Through its commitment to innovation and technical excellence, it has become a globally recognized leader in next-generation IT and BPO services with a track record of successfully delivering large-scale projects.
Over the past 10 years, Systems Limited has developed a strong presence in the Mortgage, Apparel, and Retail sectors in the US. In the early 2000s, Systems Limited launched BPO services in the Pakistani domestic market, and expanded into North America in 2006. In 2012, Systems Limited established offices in the Middle East. Systems maintains operations in the USA, UAE, Qatar and Oman, serving a vast list of government and corporate entities, including several Fortune 500 companies, and is considered to be the most valuable company for IT and BPO services in Pakistan.
Annual Report 2017 0908 Systems Limited
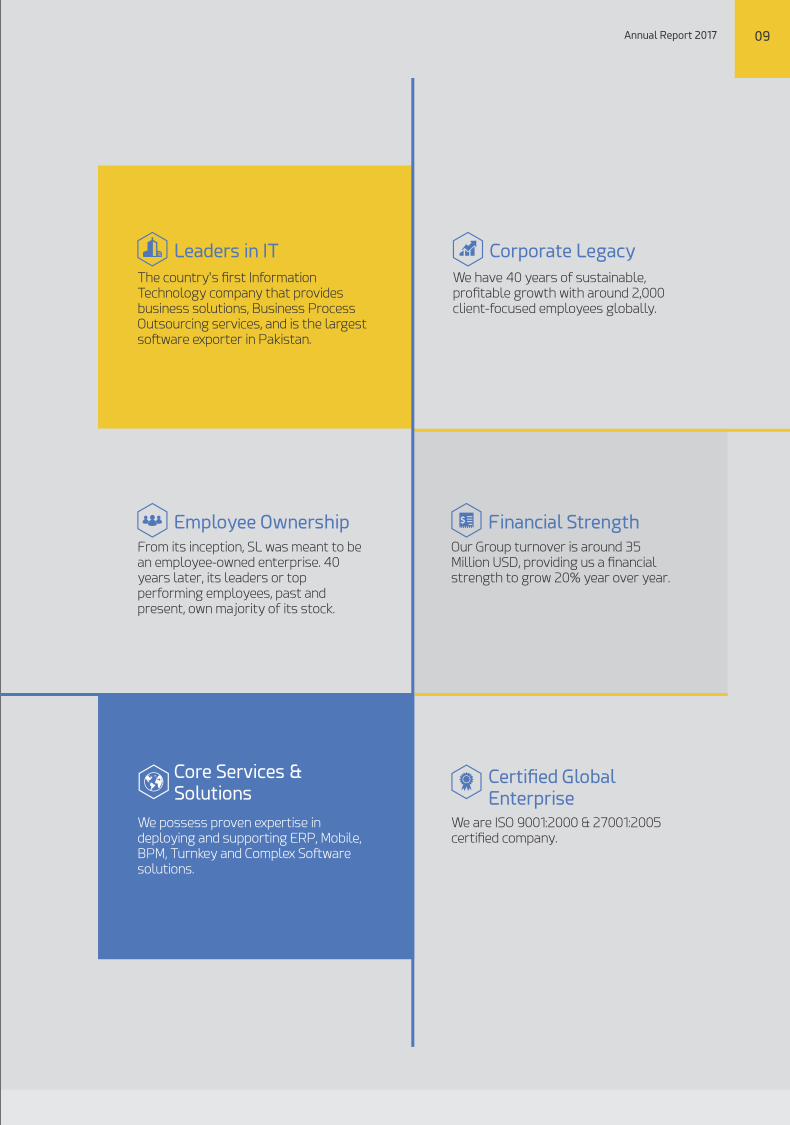
Leaders in IT
The country's rst Information Technology company that provides business solutions, Business Process Outsourcing services, and is the largest software exporter in Pakistan.
Corporate Legacy
We have 40 years of sustainable, protable growth with around 2,000 client-focused employees globally.
Employee OwnershipFrom its inception, SL was meant to be an employee-owned enterprise. 40 years later, its leaders or top performing employees, past and present, own majority of its stock.
Our Group turnover is around 35 Million USD, providing us a nancial strength to grow 20% year over year.
Financial Strength
Core Services &Solutions
We possess proven expertise in deploying and supporting ERP, Mobile, BPM, Turnkey and Complex Software solutions.
We are ISO 9001:2000 & 27001:2005 certied company.
Certied GlobalEnterprise
Partnerships, Technical Competencies and Recognition
Enterprise Resource PlanningApplication DevelopmentCloud Productivity MessagingCommunicationsDatacenterCollaboration and ContentData AnalyticsApplication IntegrationCustomer Relationship Management
GoldGoldGoldGoldGoldGoldGoldSilverSilverSilver
DeepLearning
Ai
MachineLearning
Microsoft Partner
Ui path
7x24EnterpriseSupport andMaintenance
Dynamics 365ERP and CRM
Cloud Computingand EnterpriseArchitecture
Al & ProcessAutomation
Collaboration CustomerSolutions
ManagedSupportServices
Being a leading Microsoft and IBM partner with deep experience in public and private sectors, Systems Limited is uniquely positioned to deliver complete solutions to medium and large organizations. Its areas of expertise are ERP, CRM, BI, portals & collaboration, e-commerce, mobility, and managed services. With the recent launch of the OneLoad digital payment aggregation platform and mobile payment gateway, Systems Limited has also begun to reach out directly to a large number of consumers.
Systems Limited has had another spectacular year, and attained the top tiered Gold partnership status with Microsoft, IBM and Huawei.
In 2017, Systems Limited partnered with Red Hat - the world's leading provider of open source solutions; and also with DXC Technology, a US based rm that offers end-to-end technology services for nancial services industry. With these partnerships, Systems Limited is determined to introduce the latest technologies and solutions to the private and public sector organizations in Pakistan.
At the P@SHA ICT Awards, the 2017 instalment of Pakistan’s preeminent software industry awards ceremony, Systems clinch ve awards. In addition to securing top honors in the Managed Services and Project Management categories, Systems also received recognition as runners-up in HR Excellence, Financial Industry Application, and Business Process Outsourcing.
These awards and recognition at P@SHA Awards is a testimony that our talent pool ranks among the best in the industry, and it is their dedication and hard work that has made our digital products and technology-led services truly world-class. Our consistently exemplary standings at these events is a clear indication that Systems Limited is the most prestigious technology rm in the country.
“Innovation is the outcome of a habit,not a random act. ”-Sukant Ratnakar
About Systems LimitedSystems Limited, Pakistan's rst software house, was founded in 1977. Through its commitment to innovation and technical excellence, it has become a globally recognized leader in next-generation IT and BPO services with a track record of successfully delivering large-scale projects.
Over the past 10 years, Systems Limited has developed a strong presence in the Mortgage, Apparel, and Retail sectors in the US. In the early 2000s, Systems Limited launched BPO services in the Pakistani domestic market, and expanded into North America in 2006. In 2012, Systems Limited established offices in the Middle East. Systems maintains operations in the USA, UAE, Qatar and Oman, serving a vast list of government and corporate entities, including several Fortune 500 companies, and is considered to be the most valuable company for IT and BPO services in Pakistan.
Annual Report 2017 0908 Systems Limited
Leaders in IT
The country's rst Information Technology company that provides business solutions, Business Process Outsourcing services, and is the largest software exporter in Pakistan.
Corporate Legacy
We have 40 years of sustainable, protable growth with around 2,000 client-focused employees globally.
Employee OwnershipFrom its inception, SL was meant to be an employee-owned enterprise. 40 years later, its leaders or top performing employees, past and present, own majority of its stock.
Our Group turnover is around 35 Million USD, providing us a nancial strength to grow 20% year over year.
Financial Strength
Core Services &Solutions
We possess proven expertise in deploying and supporting ERP, Mobile, BPM, Turnkey and Complex Software solutions.
We are ISO 9001:2000 & 27001:2005 certied company.
Certied GlobalEnterprise
Partnerships, Technical Competencies and Recognition
Enterprise Resource PlanningApplication DevelopmentCloud Productivity MessagingCommunicationsDatacenterCollaboration and ContentData AnalyticsApplication IntegrationCustomer Relationship Management
GoldGoldGoldGoldGoldGoldGoldSilverSilverSilver
DeepLearning
Ai
MachineLearning
Microsoft Partner
Ui path
7x24EnterpriseSupport andMaintenance
Dynamics 365ERP and CRM
Cloud Computingand EnterpriseArchitecture
Al & ProcessAutomation
Collaboration CustomerSolutions
ManagedSupportServices
Being a leading Microsoft and IBM partner with deep experience in public and private sectors, Systems Limited is uniquely positioned to deliver complete solutions to medium and large organizations. Its areas of expertise are ERP, CRM, BI, portals & collaboration, e-commerce, mobility, and managed services. With the recent launch of the OneLoad digital payment aggregation platform and mobile payment gateway, Systems Limited has also begun to reach out directly to a large number of consumers.
Systems Limited has had another spectacular year, and attained the top tiered Gold partnership status with Microsoft, IBM and Huawei.
In 2017, Systems Limited partnered with Red Hat - the world's leading provider of open source solutions; and also with DXC Technology, a US based rm that offers end-to-end technology services for nancial services industry. With these partnerships, Systems Limited is determined to introduce the latest technologies and solutions to the private and public sector organizations in Pakistan.
At the P@SHA ICT Awards, the 2017 instalment of Pakistan’s preeminent software industry awards ceremony, Systems clinch ve awards. In addition to securing top honors in the Managed Services and Project Management categories, Systems also received recognition as runners-up in HR Excellence, Financial Industry Application, and Business Process Outsourcing.
These awards and recognition at P@SHA Awards is a testimony that our talent pool ranks among the best in the industry, and it is their dedication and hard work that has made our digital products and technology-led services truly world-class. Our consistently exemplary standings at these events is a clear indication that Systems Limited is the most prestigious technology rm in the country.
“Innovation is the outcome of a habit,not a random act. ”-Sukant Ratnakar
“When we take Technology andmix it with art, youalways come upwith somethinginnovative.”
Annual Report 2017 1110 Systems Limited
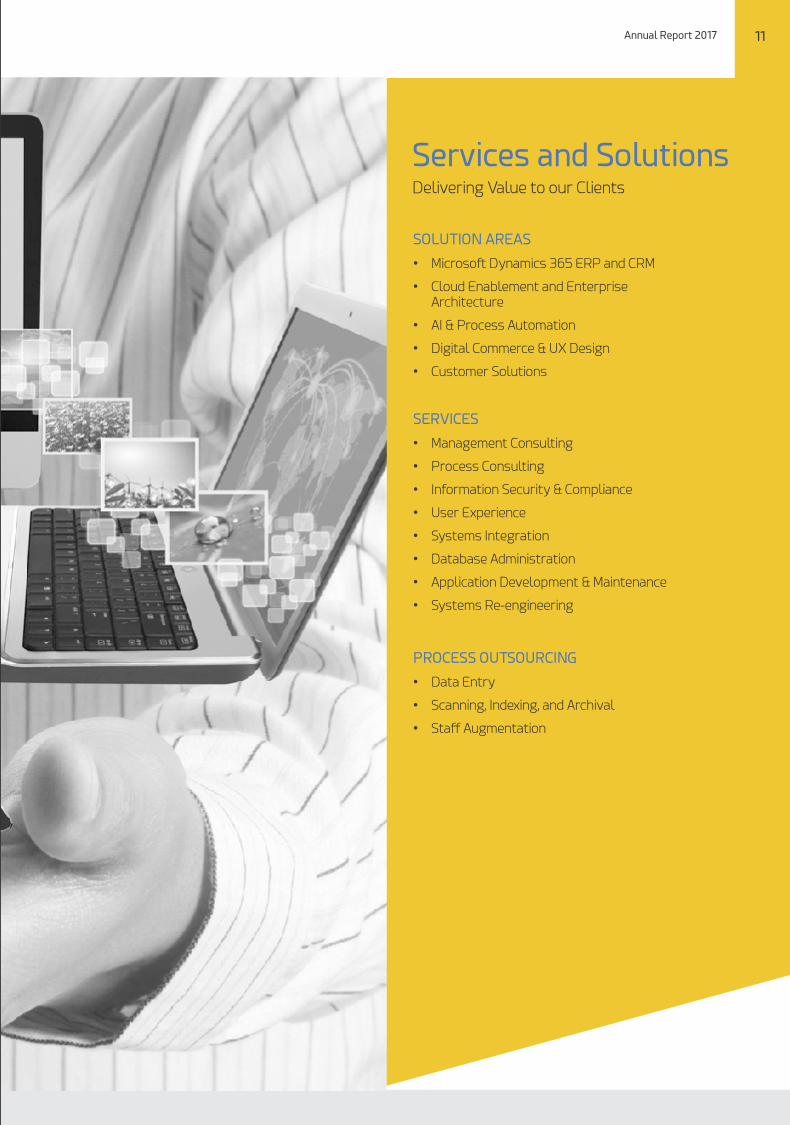
Delivering Value to our Clients
SOLUTION AREAS
• Microsoft Dynamics 365 ERP and CRM
• Cloud Enablement and Enterprise Architecture
• AI & Process Automation
• Digital Commerce & UX Design
• Customer Solutions
Services and Solutions
SERVICES
• Management Consulting
• Process Consulting
• Information Security & Compliance
• User Experience
• Systems Integration
• Database Administration
• Application Development & Maintenance
• Systems Re-engineering
PROCESS OUTSOURCING
• Data Entry
• Scanning, Indexing, and Archival
• Staff Augmentation
“When we take Technology andmix it with art, youalways come upwith somethinginnovative.”
Annual Report 2017 1110 Systems Limited
Delivering Value to our Clients
SOLUTION AREAS
• Microsoft Dynamics 365 ERP and CRM
• Cloud Enablement and Enterprise Architecture
• AI & Process Automation
• Digital Commerce & UX Design
• Customer Solutions
Services and Solutions
SERVICES
• Management Consulting
• Process Consulting
• Information Security & Compliance
• User Experience
• Systems Integration
• Database Administration
• Application Development & Maintenance
• Systems Re-engineering
PROCESS OUTSOURCING
• Data Entry
• Scanning, Indexing, and Archival
• Staff Augmentation
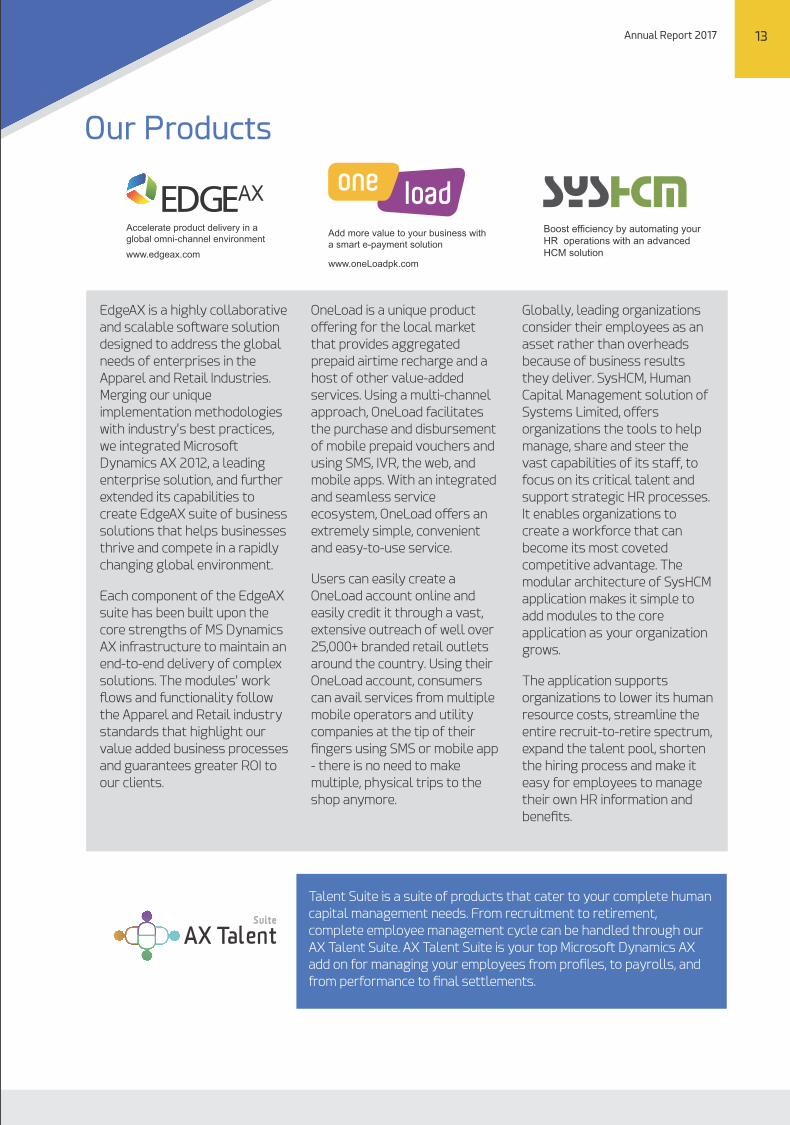
Our Products
Add more value to your business witha smart e-payment solution
www.oneLoadpk.com
Boost efficiency by automating your HR operations with an advancedHCM solution
AX
Accelerate product delivery in aglobal omni-channel environment
www.edgeax.com
EdgeAX is a highly collaborative
and scalable software solution
designed to address the global
needs of enterprises in the
Apparel and Retail Industries.
Merging our unique
implementation methodologies
with industry's best practices,
we integrated Microsoft
Dynamics AX 2012, a leading
enterprise solution, and further
extended its capabilities to
create EdgeAX suite of business
solutions that helps businesses
thrive and compete in a rapidly
changing global environment.
Each component of the EdgeAX
suite has been built upon the
core strengths of MS Dynamics
AX infrastructure to maintain an
end-to-end delivery of complex
solutions. The modules' work
ows and functionality follow
the Apparel and Retail industry
standards that highlight our
value added business processes
and guarantees greater ROI to
our clients.
OneLoad is a unique product
offering for the local market
that provides aggregated
prepaid airtime recharge and a
host of other value-added
services. Using a multi-channel
approach, OneLoad facilitates
the purchase and disbursement
of mobile prepaid vouchers and
using SMS, IVR, the web, and
mobile apps. With an integrated
and seamless service
ecosystem, OneLoad offers an
extremely simple, convenient
and easy-to-use service.
Users can easily create a
OneLoad account online and
easily credit it through a vast,
extensive outreach of well over
25,000+ branded retail outlets
around the country. Using their
OneLoad account, consumers
can avail services from multiple
mobile operators and utility
companies at the tip of their
ngers using SMS or mobile app
- there is no need to make
multiple, physical trips to the
shop anymore.
Globally, leading organizations
consider their employees as an
asset rather than overheads
because of business results
they deliver. SysHCM, Human
Capital Management solution of
Systems Limited, offers
organizations the tools to help
manage, share and steer the
vast capabilities of its staff, to
focus on its critical talent and
support strategic HR processes.
It enables organizations to
create a workforce that can
become its most coveted
competitive advantage. The
modular architecture of SysHCM
application makes it simple to
add modules to the core
application as your organization
grows.
The application supports
organizations to lower its human
resource costs, streamline the
entire recruit-to-retire spectrum,
expand the talent pool, shorten
the hiring process and make it
easy for employees to manage
their own HR information and
benets.
Annual Report 2017 13
Talent Suite is a suite of products that cater to your complete human
capital management needs. From recruitment to retirement,
complete employee management cycle can be handled through our
AX Talent Suite. AX Talent Suite is your top Microsoft Dynamics AX
add on for managing your employees from proles, to payrolls, and
from performance to nal settlements.
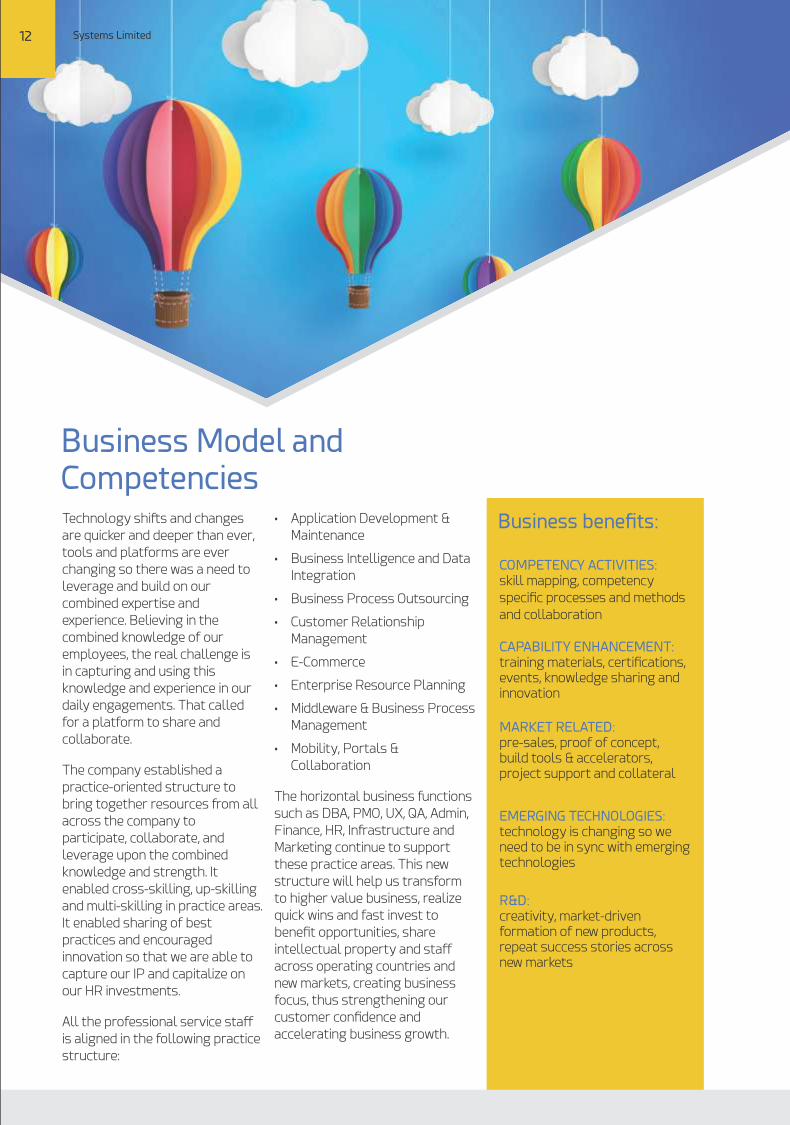
Business Model and Competencies Technology shifts and changes
are quicker and deeper than ever,
tools and platforms are ever
changing so there was a need to
leverage and build on our
combined expertise and
experience. Believing in the
combined knowledge of our
employees, the real challenge is
in capturing and using this
knowledge and experience in our
daily engagements. That called
for a platform to share and
collaborate.
The company established a
practice-oriented structure to
bring together resources from all
across the company to
participate, collaborate, and
leverage upon the combined
knowledge and strength. It
enabled cross-skilling, up-skilling
and multi-skilling in practice areas.
It enabled sharing of best
practices and encouraged
innovation so that we are able to
capture our IP and capitalize on
our HR investments.
All the professional service staff
is aligned in the following practice
structure:
• Application Development &
Maintenance
• Business Intelligence and Data
Integration
• Business Process Outsourcing
• Customer Relationship
Management
• E-Commerce
• Enterprise Resource Planning
• Middleware & Business Process
Management
• Mobility, Portals &
Collaboration
The horizontal business functions
such as DBA, PMO, UX, QA, Admin,
Finance, HR, Infrastructure and
Marketing continue to support
these practice areas. This new
structure will help us transform
to higher value business, realize
quick wins and fast invest to
benet opportunities, share
intellectual property and staff
across operating countries and
new markets, creating business
focus, thus strengthening our
customer condence and
accelerating business growth.
Business benets:
COMPETENCY ACTIVITIES:skill mapping, competency
specic processes and methods
and collaboration
CAPABILITY ENHANCEMENT: training materials, certications, events, knowledge sharing and innovation
R&D: creativity, market-driven formation of new products, repeat success stories across new markets
MARKET RELATED: pre-sales, proof of concept, build tools & accelerators, project support and collateral
EMERGING TECHNOLOGIES: technology is changing so we need to be in sync with emerging technologies
12 Systems Limited
Our Products
Add more value to your business witha smart e-payment solution
www.oneLoadpk.com
Boost efficiency by automating your HR operations with an advancedHCM solution
AX
Accelerate product delivery in aglobal omni-channel environment
www.edgeax.com
EdgeAX is a highly collaborative
and scalable software solution
designed to address the global
needs of enterprises in the
Apparel and Retail Industries.
Merging our unique
implementation methodologies
with industry's best practices,
we integrated Microsoft
Dynamics AX 2012, a leading
enterprise solution, and further
extended its capabilities to
create EdgeAX suite of business
solutions that helps businesses
thrive and compete in a rapidly
changing global environment.
Each component of the EdgeAX
suite has been built upon the
core strengths of MS Dynamics
AX infrastructure to maintain an
end-to-end delivery of complex
solutions. The modules' work
ows and functionality follow
the Apparel and Retail industry
standards that highlight our
value added business processes
and guarantees greater ROI to
our clients.
OneLoad is a unique product
offering for the local market
that provides aggregated
prepaid airtime recharge and a
host of other value-added
services. Using a multi-channel
approach, OneLoad facilitates
the purchase and disbursement
of mobile prepaid vouchers and
using SMS, IVR, the web, and
mobile apps. With an integrated
and seamless service
ecosystem, OneLoad offers an
extremely simple, convenient
and easy-to-use service.
Users can easily create a
OneLoad account online and
easily credit it through a vast,
extensive outreach of well over
25,000+ branded retail outlets
around the country. Using their
OneLoad account, consumers
can avail services from multiple
mobile operators and utility
companies at the tip of their
ngers using SMS or mobile app
- there is no need to make
multiple, physical trips to the
shop anymore.
Globally, leading organizations
consider their employees as an
asset rather than overheads
because of business results
they deliver. SysHCM, Human
Capital Management solution of
Systems Limited, offers
organizations the tools to help
manage, share and steer the
vast capabilities of its staff, to
focus on its critical talent and
support strategic HR processes.
It enables organizations to
create a workforce that can
become its most coveted
competitive advantage. The
modular architecture of SysHCM
application makes it simple to
add modules to the core
application as your organization
grows.
The application supports
organizations to lower its human
resource costs, streamline the
entire recruit-to-retire spectrum,
expand the talent pool, shorten
the hiring process and make it
easy for employees to manage
their own HR information and
benets.
Annual Report 2017 13
Talent Suite is a suite of products that cater to your complete human
capital management needs. From recruitment to retirement,
complete employee management cycle can be handled through our
AX Talent Suite. AX Talent Suite is your top Microsoft Dynamics AX
add on for managing your employees from proles, to payrolls, and
from performance to nal settlements.
Business Model and Competencies Technology shifts and changes
are quicker and deeper than ever,
tools and platforms are ever
changing so there was a need to
leverage and build on our
combined expertise and
experience. Believing in the
combined knowledge of our
employees, the real challenge is
in capturing and using this
knowledge and experience in our
daily engagements. That called
for a platform to share and
collaborate.
The company established a
practice-oriented structure to
bring together resources from all
across the company to
participate, collaborate, and
leverage upon the combined
knowledge and strength. It
enabled cross-skilling, up-skilling
and multi-skilling in practice areas.
It enabled sharing of best
practices and encouraged
innovation so that we are able to
capture our IP and capitalize on
our HR investments.
All the professional service staff
is aligned in the following practice
structure:
• Application Development &
Maintenance
• Business Intelligence and Data
Integration
• Business Process Outsourcing
• Customer Relationship
Management
• E-Commerce
• Enterprise Resource Planning
• Middleware & Business Process
Management
• Mobility, Portals &
Collaboration
The horizontal business functions
such as DBA, PMO, UX, QA, Admin,
Finance, HR, Infrastructure and
Marketing continue to support
these practice areas. This new
structure will help us transform
to higher value business, realize
quick wins and fast invest to
benet opportunities, share
intellectual property and staff
across operating countries and
new markets, creating business
focus, thus strengthening our
customer condence and
accelerating business growth.
Business benets:
COMPETENCY ACTIVITIES:skill mapping, competency
specic processes and methods
and collaboration
CAPABILITY ENHANCEMENT: training materials, certications, events, knowledge sharing and innovation
R&D: creativity, market-driven formation of new products, repeat success stories across new markets
MARKET RELATED: pre-sales, proof of concept, build tools & accelerators, project support and collateral
EMERGING TECHNOLOGIES: technology is changing so we need to be in sync with emerging technologies
12 Systems Limited
14 Systems Limited
2016 2015
2,263,290,351
1,506,544,772
756,745,579
381,082,023
2,121,044
91,963,242
465,505,754
12,991,024
452,514,730
4.14
33.44
16.84
19.99
2014
1,922,615,854
1,242,708,948
679,906,906
283,650,402
3,985,590
38,502,506
430,863,420
4,143,840
426,719,580
4.47
35.36
14.75
22.19
2013
1,420,562,189
859,467,123
561,095,066
202,692,544
3,402,989
70,805,575
425,805,108
10,663,819
415,141,289
4.91
39.50
14.27
29.22
1,080,598,569
615,454,025
465,144,544
152,997,391
9,681,423
43,808,631
346,274,361
18,391,150
327,883,211
7.76
43.05
14.16
30.34
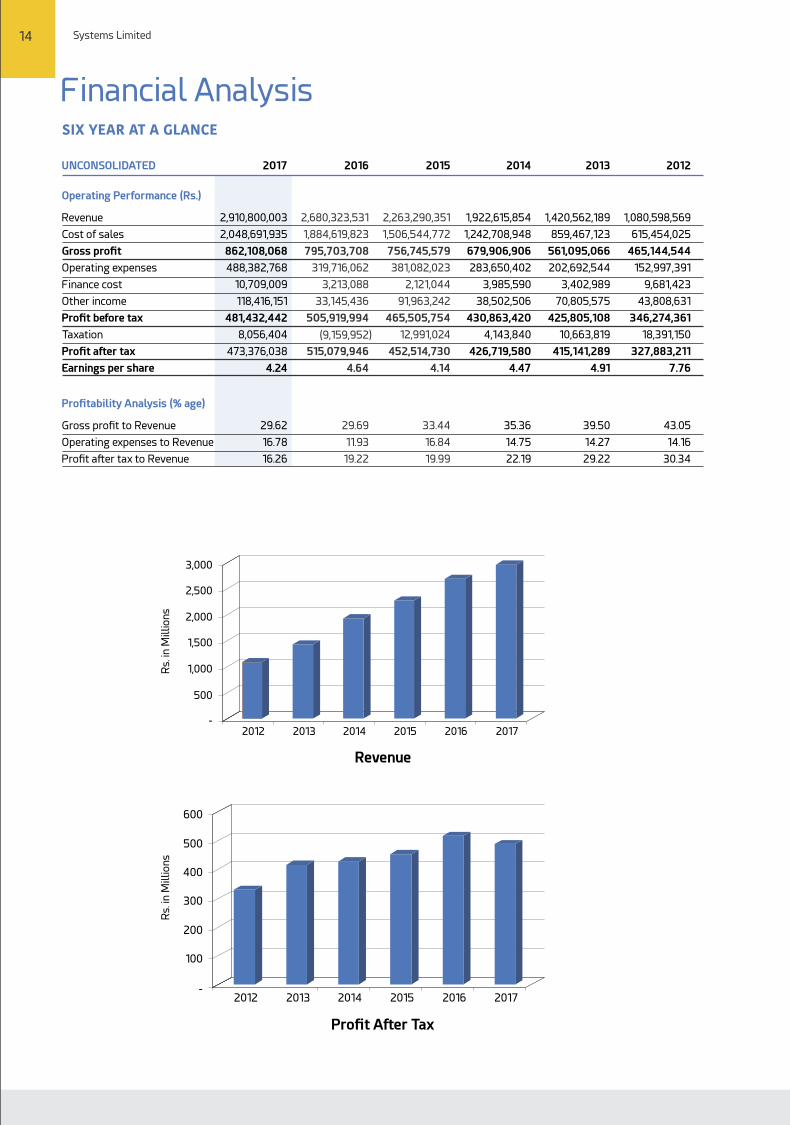
20122017UNCONSOLIDATED
Operating Performance (Rs.)
Revenue Cost of sales
Gross prot
Operating expenses
Finance cost
Other income
Prot before tax
Taxation
Prot after tax
Earnings per share
Protability Analysis (% age)
Gross prot to Revenue
Operating expenses to Revenue
Prot after tax to Revenue
SIX YEAR AT A GLANCE
Financial Analysis
Prot After Tax
Revenue
-
100
200
300
400
500
600
20172012 2013 2014 2015 2016
Rs.
in M
illi
on
s
20172012 2013 2014 2015 2016
2,910,800,003 2,680,323,531
2,048,691,935 1,884,619,823
862,108,068 795,703,708
488,382,768 319,716,062
10,709,009 3,213,088
118,416,151 33,145,436 481,432,442
505,919,994
8,056,404
(9,159,952)
473,376,038
515,079,946
4.24
4.64
29.62 29.69
16.78 11.93
16.26 19.22
Rs.
in M
illi
on
s
Rs.
in M
illi
on
sR
s. in
Mil
lio
ns
-
500
1,000
1,500
2,000
2,500
3,000
Annual Report 2017 15
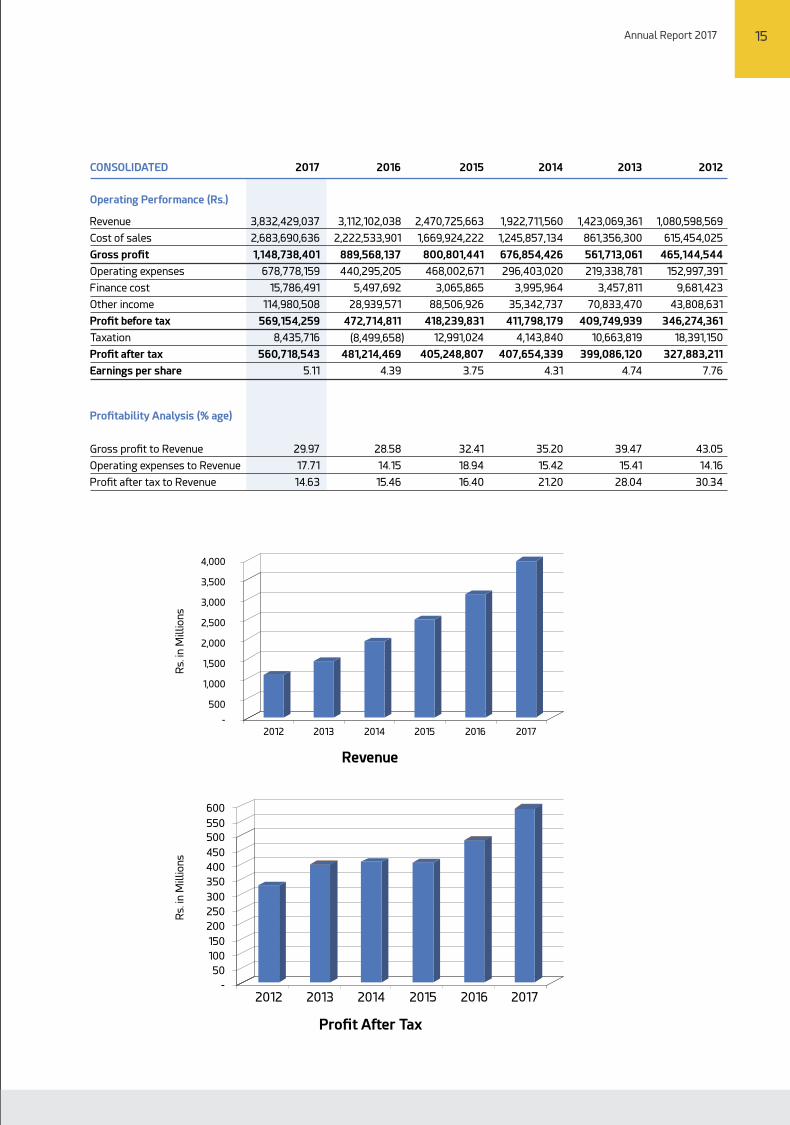
CONSOLIDATED
Operating Performance (Rs.)
Revenue
Cost of sales
Gross prot
Operating expenses
Finance cost
Other income
Prot before tax
Taxation
Prot after tax
Earnings per share
Protability Analysis (% age)
Gross prot to Revenue
Operating expenses to Revenue
Prot after tax to Revenue
2013
1,423,069,361
861,356,300
561,713,061
219,338,781
3,457,811
70,833,470
409,749,939
10,663,819
399,086,120
4.74
39.47
15.41
28.04
2012
1,080,598,569
615,454,025
465,144,544
152,997,391
9,681,423
43,808,631
346,274,361
18,391,150
327,883,211
7.76
43.05
14.16
30.34
2014
1,922,711,560
1,245,857,134
676,854,426
296,403,020
3,995,964
35,342,737
411,798,179
4,143,840
407,654,339
4.31
35.20
15.42
21.20
2015
2,470,725,663
1,669,924,222
800,801,441
468,002,671
3,065,865
88,506,926
418,239,831
12,991,024
405,248,807
3.75
32.41
18.94
16.40
20162017
Prot After Tax
Revenue
20172012 2013 2014 2015 2016-
500
1,000
1,500
2,000
2,500
3,000
3,500
4,000
-
50
100
150
200
250
300
350
400
450
500
20172012 2013 2014 2015 2016
550
600
3,112,102,038
2,222,533,901
889,568,137
440,295,205
5,497,692
28,939,571
472,714,811
(8,499,658)
481,214,469
4.39
28.58
14.15
15.46
3,832,429,037
2,683,690,636
1,148,738,401
678,778,159
15,786,491
114,980,508
569,154,259 8,435,716
560,718,543
5.11
29.97
17.71
14.63
14 Systems Limited
2016 2015
2,263,290,351
1,506,544,772
756,745,579
381,082,023
2,121,044
91,963,242
465,505,754
12,991,024
452,514,730
4.14
33.44
16.84
19.99
2014
1,922,615,854
1,242,708,948
679,906,906
283,650,402
3,985,590
38,502,506
430,863,420
4,143,840
426,719,580
4.47
35.36
14.75
22.19
2013
1,420,562,189
859,467,123
561,095,066
202,692,544
3,402,989
70,805,575
425,805,108
10,663,819
415,141,289
4.91
39.50
14.27
29.22
1,080,598,569
615,454,025
465,144,544
152,997,391
9,681,423
43,808,631
346,274,361
18,391,150
327,883,211
7.76
43.05
14.16
30.34
20122017UNCONSOLIDATED
Operating Performance (Rs.)
Revenue Cost of sales
Gross prot
Operating expenses
Finance cost
Other income
Prot before tax
Taxation
Prot after tax
Earnings per share
Protability Analysis (% age)
Gross prot to Revenue
Operating expenses to Revenue
Prot after tax to Revenue
SIX YEAR AT A GLANCE
Financial Analysis
Prot After Tax
Revenue
-
100
200
300
400
500
600
20172012 2013 2014 2015 2016
Rs.
in M
illi
on
s
20172012 2013 2014 2015 2016
2,910,800,003 2,680,323,531
2,048,691,935 1,884,619,823
862,108,068 795,703,708
488,382,768 319,716,062
10,709,009 3,213,088
118,416,151 33,145,436 481,432,442
505,919,994
8,056,404
(9,159,952)
473,376,038
515,079,946
4.24
4.64
29.62 29.69
16.78 11.93
16.26 19.22
Rs.
in M
illi
on
s
Rs.
in M
illi
on
sR
s. in
Mil
lio
ns
-
500
1,000
1,500
2,000
2,500
3,000
Annual Report 2017 15
CONSOLIDATED
Operating Performance (Rs.)
Revenue
Cost of sales
Gross prot
Operating expenses
Finance cost
Other income
Prot before tax
Taxation
Prot after tax
Earnings per share
Protability Analysis (% age)
Gross prot to Revenue
Operating expenses to Revenue
Prot after tax to Revenue
2013
1,423,069,361
861,356,300
561,713,061
219,338,781
3,457,811
70,833,470
409,749,939
10,663,819
399,086,120
4.74
39.47
15.41
28.04
2012
1,080,598,569
615,454,025
465,144,544
152,997,391
9,681,423
43,808,631
346,274,361
18,391,150
327,883,211
7.76
43.05
14.16
30.34
2014
1,922,711,560
1,245,857,134
676,854,426
296,403,020
3,995,964
35,342,737
411,798,179
4,143,840
407,654,339
4.31
35.20
15.42
21.20
2015
2,470,725,663
1,669,924,222
800,801,441
468,002,671
3,065,865
88,506,926
418,239,831
12,991,024
405,248,807
3.75
32.41
18.94
16.40
20162017
Prot After Tax
Revenue
20172012 2013 2014 2015 2016-
500
1,000
1,500
2,000
2,500
3,000
3,500
4,000
-
50
100
150
200
250
300
350
400
450
500
20172012 2013 2014 2015 2016
550
600
3,112,102,038
2,222,533,901
889,568,137
440,295,205
5,497,692
28,939,571
472,714,811
(8,499,658)
481,214,469
4.39
28.58
14.15
15.46
3,832,429,037
2,683,690,636
1,148,738,401
678,778,159
15,786,491
114,980,508
569,154,259 8,435,716
560,718,543
5.11
29.97
17.71
14.63
16 Systems Limited
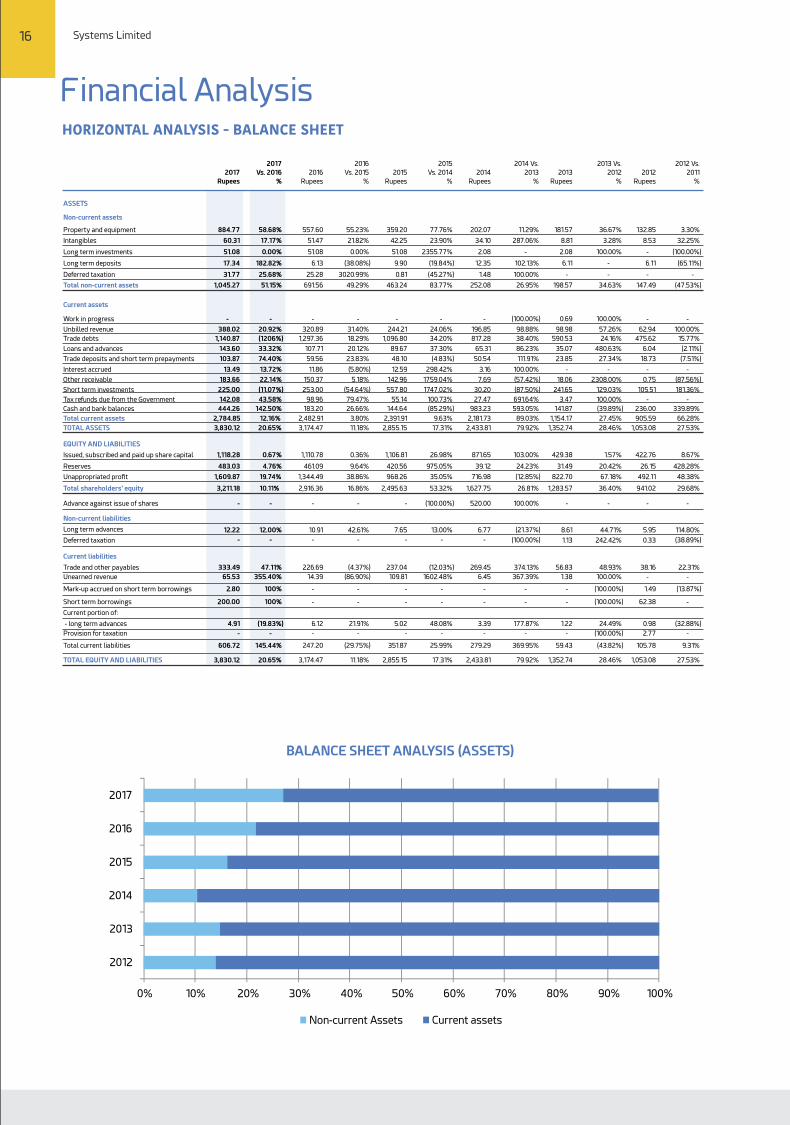
Financial Analysis HORIZONTAL ANALYSIS - BALANCE SHEET
2017
2017
Vs. 2016 2016
2016
Vs. 2015 2015
2015
Vs. 2014 2014
2014 Vs.
2013 2013
2013 Vs.
2012 2012
2012 Vs.
2011
Rupees % Rupees % Rupees % Rupees % Rupees % Rupees %
ASSETS
Non-current assets
Property and equipment 557.60 55.23% 359.20 77.76% 202.07 11.29% 181.57 36.67% 132.85 3.30%
Intangibles 51.47 21.82% 42.25 23.90% 34.10 287.06% 8.81 3.28% 8.53 32.25%
Long term investments 51.08 0.00% 51.08 2355.77% 2.08 -
2.08 100.00% -
(100.00%)
Long term deposits 6.13 (38.08%) 9.90 (19.84%) 12.35 102.13% 6.11 -
6.11 (65.11%)
Deferred taxation 25.28 3020.99% 0.81 (45.27%) 1.48 100.00% -
-
-
-
Total non-current assets 691.56 49.29% 463.24 83.77% 252.08 26.95% 198.57 34.63% 147.49 (47.53%)
Current assets
Work in progress - - - -
-
-
-
(100.00%) 0.69 100.00% -
-
Unbilled revenue 388.02 20.92% 320.89 31.40% 244.21 24.06% 196.85 98.88% 98.98 57.26% 62.94 100.00%
Trade debts 1,140.87 (1206%) 1,297.36 18.29% 1,096.80 34.20% 817.28 38.40% 590.53 24.16% 475.62 15.77%
Loans and advances 143.60 33.32% 107.71 20.12% 89.67 37.30% 65.31 86.23% 35.07 480.63% 6.04 (2.11%)
Trade deposits and short term prepayments 103.87 74.40% 59.56 23.83% 48.10 (4.83%) 50.54 111.91% 23.85 27.34% 18.73 (7.51%)
Interest accrued 13.49 13.72% 11.86 (5.80%) 12.59 298.42% 3.16 100.00% -
-
-
-
Other receivable 183.66 22.14% 150.37 5.18% 142.96 1759.04% 7.69 (57.42%) 18.06 2308.00% 0.75 (87.56%)
Short term investments 225.00 (11.07%) 253.00 (54.64%) 557.80 1747.02% 30.20 (87.50%) 241.65 129.03% 105.51 181.36%
Tax refunds due from the Government 142.08 43.58% 98.96 79.47% 55.14 100.73% 27.47 691.64% 3.47 100.00% -
-
Cash and bank balances 444.26 142.50% 183.20 26.66% 144.64 (85.29%) 983.23 593.05% 141.87 (39.89%) 236.00 339.89%
Total current assets 2,784.85 12.16% 2,482.91 3.80% 2,391.91 9.63% 2,181.73 89.03% 1,154.17 27.45% 905.59 66.28%
TOTAL ASSETS 3,830.12 20.65% 3,174.47 11.18% 2,855.15 17.31% 2,433.81 79.92% 1,352.74 28.46% 1,053.08 27.53%
EQUITY AND LIABILITIES
Issued, subscribed and paid up share capital 1,118.28 0.67% 1,110.78 0.36% 1,106.81 26.98% 871.65 103.00% 429.38 1.57% 422.76 8.67%
Reserves 483.03 4.76% 461.09 9.64% 420.56 975.05% 39.12 24.23% 31.49 20.42% 26.15 428.28%
Unappropriated prot 1,609.87 19.74% 1,344.49 38.86% 968.26 35.05% 716.98 (12.85%) 822.70 67.18% 492.11 48.38%
Total shareholders' equity 3,211.18 10.11% 2,916.36 16.86% 2,495.63 53.32% 1,627.75 26.81% 1,283.57 36.40% 941.02 29.68%
Advance against issue of shares - - - -
-
(100.00%) 520.00 100.00% -
-
-
-
Non-current liabilities
Long term advances 12.22 12.00% 10.91 42.61% 7.65 13.00% 6.77 (21.37%) 8.61 44.71% 5.95 114.80%
Deferred taxation - - - -
-
- - (100.00%) 1.13 242.42% 0.33 (38.89%)
Current liabilities
Trade and other payables 333.49 47.11% 226.69 (4.37%) 237.04 (12.03%) 269.45 374.13% 56.83 48.93% 38.16 22.31%
Unearned revenue 65.53 355.40% 14.39 (86.90%) 109.81 1602.48% 6.45 367.39% 1.38 100.00% - -
Mark-up accrued on short term borrowings (100.00%)
2.80 100% - - - - - - - 1.49 (13.87%)
Short term borrowings 200.00 100% - -
-
-
-
-
-
(100.00%) 62.38 -
Current portion of:
- long term advances 4.91 (19.83%) 6.12 21.91% 5.02 48.08% 3.39 177.87% 1.22 24.49% 0.98 (32.88%)
Provision for taxation - - - - - - - - - (100.00%) 2.77 -
Total current liabilities 606.72 145.44% 247.20 (29.75%) 351.87 25.99% 279.29 369.95% 59.43 (43.82%) 105.78 9.31%
TOTAL EQUITY AND LIABILITIES 3,830.12 20.65% 3,174.47 11.18% 2,855.15 17.31% 2,433.81 79.92% 1,352.74 28.46% 1,053.08 27.53%
0% 10% 20% 30% 40% 50% 60% 70% 80% 90% 100%
2017
2012
2013
2014
2015
2016
Non-current Assets Current assets
BALANCE SHEET ANALYSIS (ASSETS)
884.77 58.68%
60.31 17.17%
51.08 0.00%
17.34 182.82%
31.77 25.68%
1,045.27 51.15%
Annual Report 2017 17
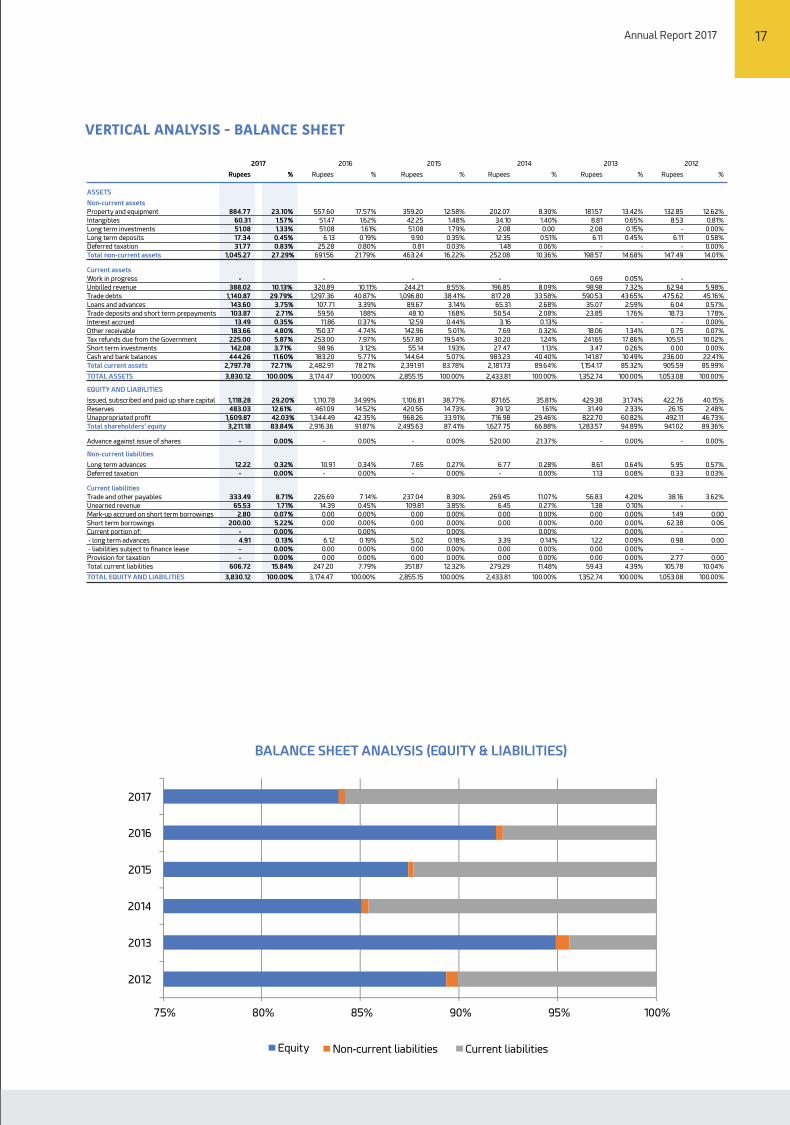
VERTICAL ANALYSIS - BALANCE SHEET
ASSETS
Non-current assets
Property and equipment
Intangibles
Long term investments
Long term deposits
Deferred taxation
Total non-current assets
Current assets
Work in progress
Unbilled revenue
Trade debts
Loans and advances
Trade deposits and short term prepayments
Interest accrued
Other receivable
Tax refunds due from the Government
Short term investments
Cash and bank balances
Total current assets
TOTAL ASSETS
EQUITY AND LIABILITIES
Issued, subscribed and paid up share capital
Reserves
Unappropriated prot
Total shareholders' equity
Advance against issue of shares
Non-current liabilities
Long term advances
Deferred taxation
Current liabilities
Trade and other payables
Unearned revenue
Mark-up accrued on short term borrowings
Short term borrowings
Current portion of:
- long term advances
- liabilities subject to nance lease
Provision for taxation
Total current liabilities
TOTAL EQUITY AND LIABILITIES
Rupees
884.77
60.31
51.08
17.34
31.77
1,045.27
-
388.02
1,140.87
143.60
103.87
13.49
183.66
225.00
142.08
444.26
2,797.78
3,830.12
1,118.28
483.03
1,609.87
3,211.18
-
12.22
-
333.49
65.53
2.80
200.00
-
4.91
-
-
606.72
3,830.12
%
23.10%
1.57%
1.33%
0.45%
0.83%
27.29%
10.13%
29.79%
3.75%
2.71%
0.35%
4.80%
5.87%
3.71%
11.60%
72.71%
100.00%
29.20%
12.61%
42.03%
83.84%
0.00%
0.32%
0.00%
8.71%
1.71%
0.07%
5.22%
0.00%
0.13%
0.00%
0.00%
15.84%
100.00%
Rupees
557.60
51.47
51.08
6.13
25.28
691.56
-
320.89
1,297.36
107.71
59.56
11.86
150.37
253.00
98.96
183.20
2,482.91
3,174.47
1,110.78
461.09
1,344.49
2,916.36
-
10.91
-
226.69
14.39
0.00
0.00
6.12
0.00
0.00
247.20
3,174.47
%
17.57%
1.62%
1.61%
0.19%
0.80%
21.79%
10.11%
40.87%
3.39%
1.88%
0.37%
4.74%
7.97%
3.12%
5.77%
78.21%
100.00%
34.99%
14.52%
42.35%
91.87%
0.00%
0.34%
0.00%
7.14%
0.45%
0.00%
0.00%
0.00%
0.19%
0.00%
0.00%
7.79%
100.00%
Rupees
359.20
42.25
51.08
9.90
0.81
463.24
-
244.21
1,096.80
89.67
48.10
12.59
142.96
557.80
55.14
144.64
2,391.91
2,855.15
1,106.81
420.56
968.26
2,495.63
-
7.65
-
237.04
109.81
0.00
0.00
5.02
0.00
0.00
351.87
2,855.15
%
12.58%
1.48%
1.79%
0.35%
0.03%
16.22%
8.55%
38.41%
3.14%
1.68%
0.44%
5.01%
19.54%
1.93%
5.07%
83.78%
100.00%
38.77%
14.73%
33.91%
87.41%
0.00%
0.27%
0.00%
8.30%
3.85%
0.00%
0.00%
0.00%
0.18%
0.00%
0.00%
12.32%
100.00%
Rupees
202.07
34.10
2.08
12.35
1.48
252.08
-
196.85
817.28
65.31
50.54
3.16
7.69
30.20
27.47
983.23
2,181.73
2,433.81
871.65
39.12
716.98
1,627.75
520.00
6.77
-
269.45
6.45
0.00
0.00
3.39
0.00
0.00
279.29
2,433.81
%
8.30%
1.40%
0.00
0.51%
0.06%
10.36%
8.09%
33.58%
2.68%
2.08%
0.13%
0.32%
1.24%
1.13%
40.40%
89.64%
100.00%
35.81%
1.61%
29.46%
66.88%
21.37%
0.28%
0.00%
11.07%
0.27%
0.00%
0.00%
0.00%
0.14%
0.00%
0.00%
11.48%
100.00%
Rupees
181.57
8.81
2.08
6.11
-
198.57
0.69
98.98
590.53
35.07
23.85
-
18.06
241.65
3.47
141.87
1,154.17
1,352.74
429.38
31.49
822.70
1,283.57
-
8.61
1.13
56.83
1.38
0.00
0.00
1.22
0.00
0.00
59.43
1,352.74
%
13.42%
0.65%
0.15%
0.45%
-
14.68%
0.05%
7.32%
43.65%
2.59%
1.76%
-
1.34%
17.86%
0.26%
10.49%
85.32%
100.00%
31.74%
2.33%
60.82%
94.89%
0.00%
0.64%
0.08%
4.20%
0.10%
0.00%
0.00%
0.00%
0.09%
0.00%
0.00%
4.39%
100.00%
Rupees
132.85
8.53
-
6.11
-
147.49
-
62.94
475.62
6.04
18.73
-
0.75
105.51
0.00
236.00
905.59
1,053.08
422.76
26.15
492.11
941.02
-
5.95
0.33
38.16
-
1.49
62.38
-
0.98
-
2.77
105.78
1,053.08
%
12.62%
0.81%
0.00%
0.58%
0.00%
14.01%
5.98%
45.16%
0.57%
1.78%
0.00%
0.07%
10.02%
0.00%
22.41%
85.99%
100.00%
40.15%
2.48%
46.73%
89.36%
0.00%
0.57%
0.03%
3.62%
0.00
0.06
0.00
0.00
10.04%
100.00%
2017 2016 2015 2014 2013 2012
75% 80% 85% 90% 95% 100%
2017
2012
2013
2014
2015
2016
Equity Non-current liabilities Current liabilities
BALANCE SHEET ANALYSIS (EQUITY & LIABILITIES)
16 Systems Limited
Financial Analysis HORIZONTAL ANALYSIS - BALANCE SHEET
2017
2017
Vs. 2016 2016
2016
Vs. 2015 2015
2015
Vs. 2014 2014
2014 Vs.
2013 2013
2013 Vs.
2012 2012
2012 Vs.
2011
Rupees % Rupees % Rupees % Rupees % Rupees % Rupees %
ASSETS
Non-current assets
Property and equipment 557.60 55.23% 359.20 77.76% 202.07 11.29% 181.57 36.67% 132.85 3.30%
Intangibles 51.47 21.82% 42.25 23.90% 34.10 287.06% 8.81 3.28% 8.53 32.25%
Long term investments 51.08 0.00% 51.08 2355.77% 2.08 -
2.08 100.00% -
(100.00%)
Long term deposits 6.13 (38.08%) 9.90 (19.84%) 12.35 102.13% 6.11 -
6.11 (65.11%)
Deferred taxation 25.28 3020.99% 0.81 (45.27%) 1.48 100.00% -
-
-
-
Total non-current assets 691.56 49.29% 463.24 83.77% 252.08 26.95% 198.57 34.63% 147.49 (47.53%)
Current assets
Work in progress - - - -
-
-
-
(100.00%) 0.69 100.00% -
-
Unbilled revenue 388.02 20.92% 320.89 31.40% 244.21 24.06% 196.85 98.88% 98.98 57.26% 62.94 100.00%
Trade debts 1,140.87 (1206%) 1,297.36 18.29% 1,096.80 34.20% 817.28 38.40% 590.53 24.16% 475.62 15.77%
Loans and advances 143.60 33.32% 107.71 20.12% 89.67 37.30% 65.31 86.23% 35.07 480.63% 6.04 (2.11%)
Trade deposits and short term prepayments 103.87 74.40% 59.56 23.83% 48.10 (4.83%) 50.54 111.91% 23.85 27.34% 18.73 (7.51%)
Interest accrued 13.49 13.72% 11.86 (5.80%) 12.59 298.42% 3.16 100.00% -
-
-
-
Other receivable 183.66 22.14% 150.37 5.18% 142.96 1759.04% 7.69 (57.42%) 18.06 2308.00% 0.75 (87.56%)
Short term investments 225.00 (11.07%) 253.00 (54.64%) 557.80 1747.02% 30.20 (87.50%) 241.65 129.03% 105.51 181.36%
Tax refunds due from the Government 142.08 43.58% 98.96 79.47% 55.14 100.73% 27.47 691.64% 3.47 100.00% -
-
Cash and bank balances 444.26 142.50% 183.20 26.66% 144.64 (85.29%) 983.23 593.05% 141.87 (39.89%) 236.00 339.89%
Total current assets 2,784.85 12.16% 2,482.91 3.80% 2,391.91 9.63% 2,181.73 89.03% 1,154.17 27.45% 905.59 66.28%
TOTAL ASSETS 3,830.12 20.65% 3,174.47 11.18% 2,855.15 17.31% 2,433.81 79.92% 1,352.74 28.46% 1,053.08 27.53%
EQUITY AND LIABILITIES
Issued, subscribed and paid up share capital 1,118.28 0.67% 1,110.78 0.36% 1,106.81 26.98% 871.65 103.00% 429.38 1.57% 422.76 8.67%
Reserves 483.03 4.76% 461.09 9.64% 420.56 975.05% 39.12 24.23% 31.49 20.42% 26.15 428.28%
Unappropriated prot 1,609.87 19.74% 1,344.49 38.86% 968.26 35.05% 716.98 (12.85%) 822.70 67.18% 492.11 48.38%
Total shareholders' equity 3,211.18 10.11% 2,916.36 16.86% 2,495.63 53.32% 1,627.75 26.81% 1,283.57 36.40% 941.02 29.68%
Advance against issue of shares - - - -
-
(100.00%) 520.00 100.00% -
-
-
-
Non-current liabilities
Long term advances 12.22 12.00% 10.91 42.61% 7.65 13.00% 6.77 (21.37%) 8.61 44.71% 5.95 114.80%
Deferred taxation - - - -
-
- - (100.00%) 1.13 242.42% 0.33 (38.89%)
Current liabilities
Trade and other payables 333.49 47.11% 226.69 (4.37%) 237.04 (12.03%) 269.45 374.13% 56.83 48.93% 38.16 22.31%
Unearned revenue 65.53 355.40% 14.39 (86.90%) 109.81 1602.48% 6.45 367.39% 1.38 100.00% - -
Mark-up accrued on short term borrowings (100.00%)
2.80 100% - - - - - - - 1.49 (13.87%)
Short term borrowings 200.00 100% - -
-
-
-
-
-
(100.00%) 62.38 -
Current portion of:
- long term advances 4.91 (19.83%) 6.12 21.91% 5.02 48.08% 3.39 177.87% 1.22 24.49% 0.98 (32.88%)
Provision for taxation - - - - - - - - - (100.00%) 2.77 -
Total current liabilities 606.72 145.44% 247.20 (29.75%) 351.87 25.99% 279.29 369.95% 59.43 (43.82%) 105.78 9.31%
TOTAL EQUITY AND LIABILITIES 3,830.12 20.65% 3,174.47 11.18% 2,855.15 17.31% 2,433.81 79.92% 1,352.74 28.46% 1,053.08 27.53%
0% 10% 20% 30% 40% 50% 60% 70% 80% 90% 100%
2017
2012
2013
2014
2015
2016
Non-current Assets Current assets
BALANCE SHEET ANALYSIS (ASSETS)
884.77 58.68%
60.31 17.17%
51.08 0.00%
17.34 182.82%
31.77 25.68%
1,045.27 51.15%
Annual Report 2017 17
VERTICAL ANALYSIS - BALANCE SHEET
ASSETS
Non-current assets
Property and equipment
Intangibles
Long term investments
Long term deposits
Deferred taxation
Total non-current assets
Current assets
Work in progress
Unbilled revenue
Trade debts
Loans and advances
Trade deposits and short term prepayments
Interest accrued
Other receivable
Tax refunds due from the Government
Short term investments
Cash and bank balances
Total current assets
TOTAL ASSETS
EQUITY AND LIABILITIES
Issued, subscribed and paid up share capital
Reserves
Unappropriated prot
Total shareholders' equity
Advance against issue of shares
Non-current liabilities
Long term advances
Deferred taxation
Current liabilities
Trade and other payables
Unearned revenue
Mark-up accrued on short term borrowings
Short term borrowings
Current portion of:
- long term advances
- liabilities subject to nance lease
Provision for taxation
Total current liabilities
TOTAL EQUITY AND LIABILITIES
Rupees
884.77
60.31
51.08
17.34
31.77
1,045.27
-
388.02
1,140.87
143.60
103.87
13.49
183.66
225.00
142.08
444.26
2,797.78
3,830.12
1,118.28
483.03
1,609.87
3,211.18
-
12.22
-
333.49
65.53
2.80
200.00
-
4.91
-
-
606.72
3,830.12
%
23.10%
1.57%
1.33%
0.45%
0.83%
27.29%
10.13%
29.79%
3.75%
2.71%
0.35%
4.80%
5.87%
3.71%
11.60%
72.71%
100.00%
29.20%
12.61%
42.03%
83.84%
0.00%
0.32%
0.00%
8.71%
1.71%
0.07%
5.22%
0.00%
0.13%
0.00%
0.00%
15.84%
100.00%
Rupees
557.60
51.47
51.08
6.13
25.28
691.56
-
320.89
1,297.36
107.71
59.56
11.86
150.37
253.00
98.96
183.20
2,482.91
3,174.47
1,110.78
461.09
1,344.49
2,916.36
-
10.91
-
226.69
14.39
0.00
0.00
6.12
0.00
0.00
247.20
3,174.47
%
17.57%
1.62%
1.61%
0.19%
0.80%
21.79%
10.11%
40.87%
3.39%
1.88%
0.37%
4.74%
7.97%
3.12%
5.77%
78.21%
100.00%
34.99%
14.52%
42.35%
91.87%
0.00%
0.34%
0.00%
7.14%
0.45%
0.00%
0.00%
0.00%
0.19%
0.00%
0.00%
7.79%
100.00%
Rupees
359.20
42.25
51.08
9.90
0.81
463.24
-
244.21
1,096.80
89.67
48.10
12.59
142.96
557.80
55.14
144.64
2,391.91
2,855.15
1,106.81
420.56
968.26
2,495.63
-
7.65
-
237.04
109.81
0.00
0.00
5.02
0.00
0.00
351.87
2,855.15
%
12.58%
1.48%
1.79%
0.35%
0.03%
16.22%
8.55%
38.41%
3.14%
1.68%
0.44%
5.01%
19.54%
1.93%
5.07%
83.78%
100.00%
38.77%
14.73%
33.91%
87.41%
0.00%
0.27%
0.00%
8.30%
3.85%
0.00%
0.00%
0.00%
0.18%
0.00%
0.00%
12.32%
100.00%
Rupees
202.07
34.10
2.08
12.35
1.48
252.08
-
196.85
817.28
65.31
50.54
3.16
7.69
30.20
27.47
983.23
2,181.73
2,433.81
871.65
39.12
716.98
1,627.75
520.00
6.77
-
269.45
6.45
0.00
0.00
3.39
0.00
0.00
279.29
2,433.81
%
8.30%
1.40%
0.00
0.51%
0.06%
10.36%
8.09%
33.58%
2.68%
2.08%
0.13%
0.32%
1.24%
1.13%
40.40%
89.64%
100.00%
35.81%
1.61%
29.46%
66.88%
21.37%
0.28%
0.00%
11.07%
0.27%
0.00%
0.00%
0.00%
0.14%
0.00%
0.00%
11.48%
100.00%
Rupees
181.57
8.81
2.08
6.11
-
198.57
0.69
98.98
590.53
35.07
23.85
-
18.06
241.65
3.47
141.87
1,154.17
1,352.74
429.38
31.49
822.70
1,283.57
-
8.61
1.13
56.83
1.38
0.00
0.00
1.22
0.00
0.00
59.43
1,352.74
%
13.42%
0.65%
0.15%
0.45%
-
14.68%
0.05%
7.32%
43.65%
2.59%
1.76%
-
1.34%
17.86%
0.26%
10.49%
85.32%
100.00%
31.74%
2.33%
60.82%
94.89%
0.00%
0.64%
0.08%
4.20%
0.10%
0.00%
0.00%
0.00%
0.09%
0.00%
0.00%
4.39%
100.00%
Rupees
132.85
8.53
-
6.11
-
147.49
-
62.94
475.62
6.04
18.73
-
0.75
105.51
0.00
236.00
905.59
1,053.08
422.76
26.15
492.11
941.02
-
5.95
0.33
38.16
-
1.49
62.38
-
0.98
-
2.77
105.78
1,053.08
%
12.62%
0.81%
0.00%
0.58%
0.00%
14.01%
5.98%
45.16%
0.57%
1.78%
0.00%
0.07%
10.02%
0.00%
22.41%
85.99%
100.00%
40.15%
2.48%
46.73%
89.36%
0.00%
0.57%
0.03%
3.62%
0.00
0.06
0.00
0.00
10.04%
100.00%
2017 2016 2015 2014 2013 2012
75% 80% 85% 90% 95% 100%
2017
2012
2013
2014
2015
2016
Equity Non-current liabilities Current liabilities
BALANCE SHEET ANALYSIS (EQUITY & LIABILITIES)
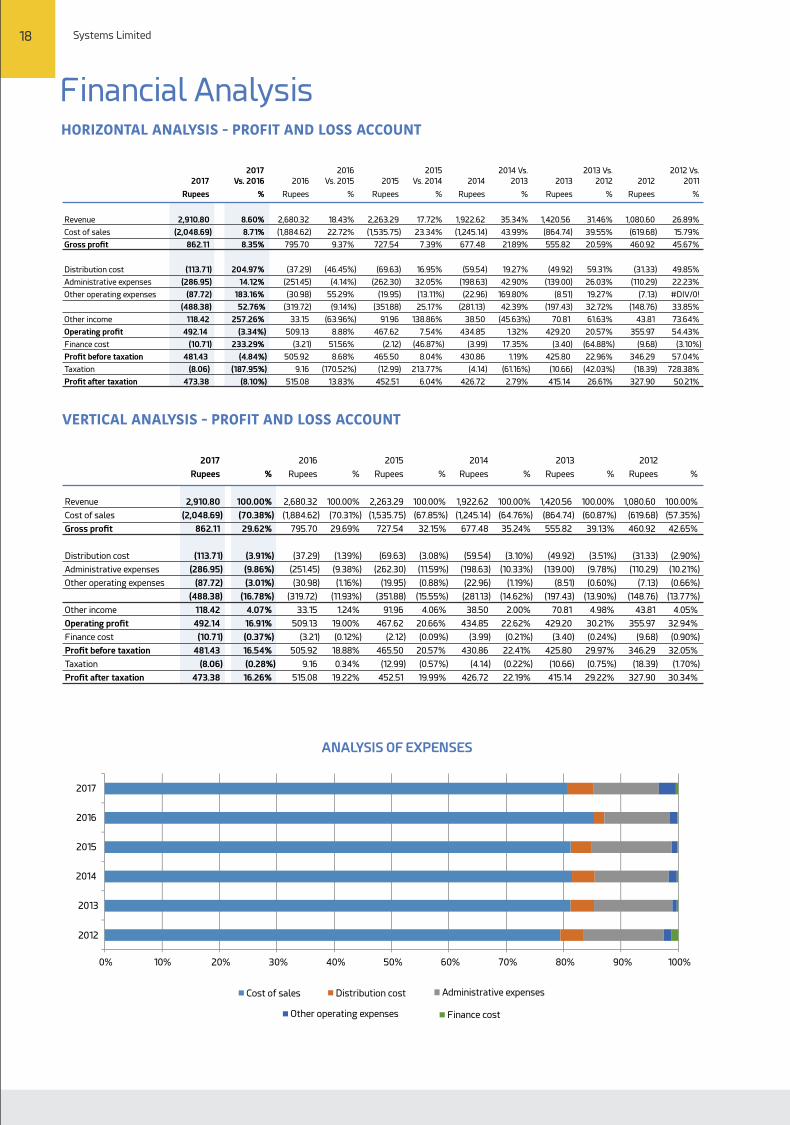
18 Systems Limited
Financial Analysis HORIZONTAL ANALYSIS - PROFIT AND LOSS ACCOUNT
Revenue
Cost of sales
Gross prot
Distribution cost
Administrative expenses
Other operating expenses
Other income
Operating prot
Finance cost
Prot before taxation
Taxation
Prot after taxation
2017
Rupees
2,910.80
(2,048.69)
862.11
(113.71)
(286.95)
(87.72)
(488.38)
118.42
492.14
(10.71)
481.43
(8.06)
473.38
2017
Vs. 2016
%
8.60%
8.71%
8.35%
204.97%
14.12%
183.16%
52.76%
257.26%
(3.34%)
233.29%
(4.84%)
(187.95%)
(8.10%)
2016
Rupees
2,680.32
(1,884.62)
795.70
(37.29)
(251.45)
(30.98)
(319.72)
33.15
509.13
(3.21)
505.92
9.16
515.08
2016
Vs. 2015
%
18.43%
22.72%
9.37%
(46.45%)
(4.14%)
55.29%
(9.14%)
(63.96%)
8.88%
51.56%
8.68%
(170.52%)
13.83%
2015
Rupees
2,263.29
(1,535.75)
727.54
(69.63)
(262.30)
(19.95)
(351.88)
91.96
467.62
(2.12)
465.50
(12.99)
452.51
2015
Vs. 2014
%
17.72%
23.34%
7.39%
16.95%
32.05%
(13.11%)
25.17%
138.86%
7.54%
(46.87%)
8.04%
213.77%
6.04%
2014
Rupees
1,922.62
(1,245.14)
677.48
(59.54)
(198.63)
(22.96)
(281.13)
38.50
434.85
(3.99)
430.86
(4.14)
426.72
2014 Vs.
2013
%
35.34%
43.99%
21.89%
19.27%
42.90%
169.80%
42.39%
(45.63%)
1.32%
17.35%
1.19%
(61.16%)
2.79%
2013
Rupees
1,420.56
(864.74)
555.82
(49.92)
(139.00)
(8.51)
(197.43)
70.81
429.20
(3.40)
425.80
(10.66)
415.14
2013 Vs.
2012
%
31.46%
39.55%
20.59%
59.31%
26.03%
19.27%
32.72%
61.63%
20.57%
(64.88%)
22.96%
(42.03%)
26.61%
2012
Rupees
1,080.60
(619.68)
460.92
(31.33)
(110.29)
(7.13)
(148.76)
43.81
355.97
(9.68)
346.29
(18.39)
327.90
2012 Vs.
2011
%
26.89%
15.79%
45.67%
49.85%
22.23%
#DIV/0!
33.85%
73.64%
54.43%
(3.10%)
57.04%
728.38%
50.21%
VERTICAL ANALYSIS - PROFIT AND LOSS ACCOUNT
Rupees %
2,910.80
100.00%
(2,048.69)
(70.38%)
862.11
29.62%
(113.71)
(3.91%)
(286.95)
(9.86%)
(87.72)
(3.01%)
(488.38)
(16.78%)
118.42
4.07%
492.14
16.91%
(10.71)
(0.37%)
481.43
16.54%
(8.06)
(0.28%)
473.38
16.26%
%
100.00%
(70.31%)
29.69%
(1.39%)
(9.38%)
(1.16%)
(11.93%)
1.24%
19.00%
(0.12%)
18.88%
0.34%
19.22%
%
100.00%
(67.85%)
32.15%
(3.08%)
(11.59%)
(0.88%)
(15.55%)
4.06%
20.66%
(0.09%)
20.57%
(0.57%)
19.99%
%
100.00%
(64.76%)
35.24%
(3.10%)
(10.33%)
(1.19%)
(14.62%)
2.00%
22.62%
(0.21%)
22.41%
(0.22%)
22.19%
%
100.00%
(60.87%)
39.13%
(3.51%)
(9.78%)
(0.60%)
(13.90%)
4.98%
30.21%
(0.24%)
29.97%
(0.75%)
29.22%
%
100.00%
(57.35%)
42.65%
(2.90%)
(10.21%)
(0.66%)
(13.77%)
4.05%
32.94%
(0.90%)
32.05%
(1.70%)
30.34%
2017
Rupees
2,680.32
(1,884.62)
795.70
(37.29)
(251.45)
(30.98)
(319.72)
33.15
509.13
Revenue
Cost of sales
Gross prot
Distribution cost
Administrative expenses
Other operating expenses
Other income
Operating prot
Finance cost
Prot before taxation
Taxation
Prot after taxation
(3.21)
505.92
9.16
515.08
2016
Rupees
2,263.29
(1,535.75)
727.54
(69.63)
(262.30)
(19.95)
(351.88)
91.96
467.62
(2.12)
465.50
(12.99)
452.51
2015
Rupees
1,922.62
(1,245.14)
677.48
(59.54)
(198.63)
(22.96)
(281.13)
38.50
434.85
(3.99)
430.86
(4.14)
426.72
2014
Rupees
1,420.56
(864.74)
555.82
(49.92)
(139.00)
(8.51)
(197.43)
70.81
429.20
(3.40)
425.80
(10.66)
415.14
2013
Rupees
1,080.60
(619.68)
460.92
(31.33)
(110.29)
(7.13)
(148.76)
43.81
355.97
(9.68)
346.29
(18.39)
327.90
2012
0% 10% 20% 30% 40% 50% 60% 70% 80% 90% 100%
2017
2012
2013
2014
2015
2016
Cost of sales Distribution cost Administrative expenses
Other operating expenses Finance cost
ANALYSIS OF EXPENSES
56%
3%
23%
3%
7%
8%
55%
3%
26%
2%
5%
9%
Annual Report 2017 19
Wealth Generated
Gross revenue
Other income
Wealth Distributed
Employees remuneration and benets
Depreciation and amortisation
Direct cost and operating cost
Dividend distribution
Prot retained
UNCONSOLIDATED CONSOLIDATED
STATEMENT OF VALUE ADDITION
Government levies
UN
CO
NS
OLID
ATE
DC
ON
SO
LID
ATE
D
2017
Employees remunerationand benets
Depreciation andamortisation
Direct and operating cost
Government levies
Dividend distribution
Prot retained
Employees remunerationand benets
Depreciation andamortisation
Direct and operating cost
Government levies
Dividend distribution
Prot retained
2016
3,201,180,174
28,939,571
3,230,119,745
1,917,617,538
96,002,787
646,206,815
138,848,114
342,366,355
3,230,119,745
89,078,136
2016
2,769,401,667
33,145,436
2,802,547,103
1,555,610,152
92,424,422
550,354,447
138,848,114
376,231,832
2,802,547,103
89,078,136
2017
2,990,961,287
118,416,151
3,109,377,438
1,732,810,276
99,541,770
723,488,070
80,161,284
207,999,433
265,376,605
3,109,377,438
2017
2016
56%
3%
19%
4%
5%
13%
59%
3%
20%
3%
4%
11%
2016
2017
3,912,590,321
114,980,509
4,027,570,830
2,228,117,193
107,934,337
1,050,639,473
80,161,284
207,999,433
352,719,110
4,027,570,830
DUPONT ANALYSIS
Revenue
Total assets
Assets turnover
2,910
3,830
76.00%
Total assets
Equity
Equity multiplier
3,830
3,211
119.27%
Prot
Revenue
Prot margin
2017
473
2,910
16.26% 14.74%
ROE
Rupees in million
Revenue
Total assets
Assets turnover
2,680
3,174
84.43%
Total assets
Equity
Equity multiplier
3,174
2,916
108.85%
Prot
Revenue
Prot margin
2016
515
2,680
19.22% 17.66%
ROE
Rupees in million
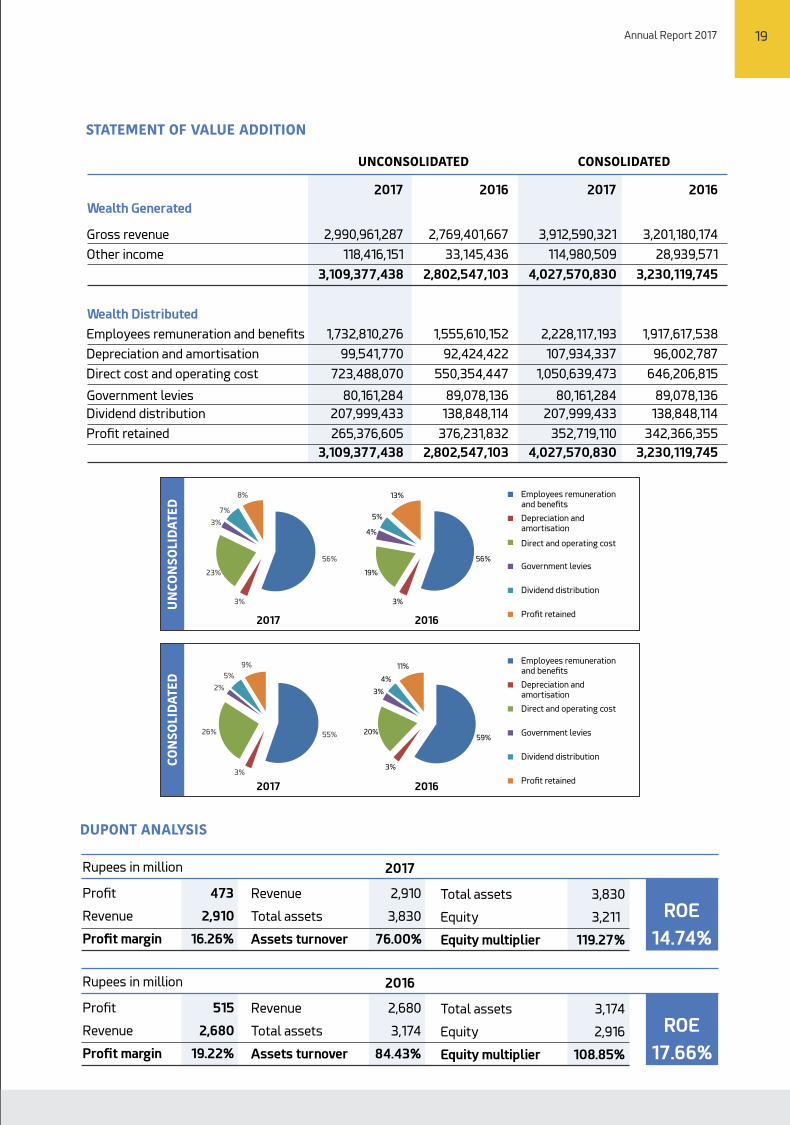
DIVIDEND REMITTANCE
Ordinary dividend declared and approved at the Annual General Meeting will be paid within the statutory time limit of 30 days.
(i) For shares held in physical form: to shareholders whose names appear in the Register of Members of the Company after entertaining all requests for transfer of shares lodged with the Company on or before the book closure date.
(ii) For shares held in electronic from: to shareholders whose names appear in the statement of beneficial ownership furnished by CDC as at end of business on book closure date.
WITHHOLDING OF TAX & ZAKATON ORDINARY DIVIDEND
As per the provisions of the Income Tax Ordinance, 2001, income tax is deductible at source by the Company at the rate of 15% in case of filer and 20% in case on non-filer wherever applicable.
Zakat is also deductible at source form the ordinary dividend at the rate of 2.5% of the face value of the share, other than corporate holders or individuals who have provided an undertaking for non-deduction.
DIVIDEND WARRANTS
Cash dividends are paid through dividend warrants addressed to the ordinary shareholders whose names appear in the Register of Shareholders at the date of book closure. INVESTOR’S GRIEVANCES
To date none of the investors or shareholders has filed any significant complaint against any service provided by the Company to its shareholders.
GENERAL MEETINGS & VOTING RIGHTS
Pursuant to section 158 of repealed Companies Ordinance 1984 (now, section 132 of Companies Act, 2017) Systems Limited holds a General Meeting of shareholders at least once a year. Every shareholder has a right to attend the General Meeting. The notice of such meeting is sent to all the shareholders at least 21 days before the meeting and also advertised in at least one English and one Urdu newspaper having circulation in Karachi, Lahore and Islamabad.Shareholders having holding of at least 10% of voting rights may also apply to the Board of Directors to call for meeting of shareholders, and if the Board does not take action on such application within 21 days, the shareholders may themselves call the meeting.All ordinary shares issued by the Company carry equal voting rights. Generally, matters at the general meetings are decided by a show of hands in the first instance. Voting by show of hands operates on the principle of “One Member-One Vote”. If majority of shareholders raise their hands in favor of a particular resolution, it is taken as passed, unless a poll is demanded.Since the fundamental voting principle in the Company is “One Share-One Vote”, voting takes place by a poll, if demanded. On a poll being taken, the decision arrived by poll is final, overruling any decision taken on a show of hands.
BOOK CLOSURE DATES
Share Transfer Books of the Company will remain closed from 20 April 2018 to 26 April 2018 (both days inclusive).
REGISTERED OFFICE
E-1, Sehjpal Near DHA Phase -VIII (Ex.-Air Avenue), Lahore Cantt.T: +92 42 111-797-836F: +92 42 3 636 8857
SHARE REGISTRAR
THK Associates (Private) Limited. 1st Floor, 40-C, Block-6,P.E.C.H.S. Karachi.T: +92 21 111-000-322 F: +92 21 3 565 5595
LISTING ON STOCK EXCHANGES
Ordinary shares of Systems Limited are listed on Pakistan Stock Exchange Limited.
STOCK CODE / SYMBOL
The stock code / symbol for trading in ordinary shares of Systems Limited at Pakistan Stock Exchange in SYS.
STATUTORY COMPLIANCE
During the year, the Company has complied with all applicable provisions, filed all returns/forms and furnished all the relevant particulars as required under the repealed Companies Ordinance, 1984 (Now, Companies Act, 2017) and allied rules, the Securities and Exchange Commission of Pakistan Regulations and the listing requirements.
DIVIDEND
The Board of Directors in their meeting held on 26 March 2018 has proposed a dividend on ordinary shares at Rs. 1.75 per ordinary share.
20 Systems Limited
Shareholders' Information
Fundamental knowledge and understanding of financial market is crucial for the general public and lack of financial literacy or capability makes them vulnerable to frauds. SECP recognizes the importance of investor education and therefore initiated this investor education program, called 'JamaPunji', an investor training program, to promote financial literacy in Pakistan.
www.jamapunji.pk
PROXIES
Pursuant to section 161 of repealed Companies Ordinance, 1984 (now, section 137 of Companies Act, 2017) and according to the Memorandum and Articles of Association of the Company, every shareholder of the Company who is entitled to attend and vote at a general meeting of the Company can appoint another member as his/her proxy to attend and vote instead of him/her. Every notice calling a general meeting of the Company contains a statement that a shareholder is entitled to appoint a proxy.
The instrument appointing a proxy (duly signed by the shareholder appointing that proxy) should be deposited at the office of the Company not less than forty-eight hours before the meeting.
SERVICE STANDARDS
Systems Limited has always endeavored to provide investors with prompt services. Listed below are various investor services and the maximum time limits set for their execution:
Transfer of shares
Transmission of shares
Issue of duplicate share certificates
Issue of duplicate dividend warrants
Issue of revalidated dividend warrants
Change of address
30 days after receipt
30 days after receipt
30 days after receipt
5 days after receipt
5 days after receipt
2 days after receipt
For requests receivedthrough post
30 days after receipt
30 days after receipt
30 days after receipt
5 days after receipt
5 days after receipt
1 day after receipt
For requests receivedover the counter
Well qualified personnel of the Shares Registrar have been entrusted with the responsibility of ensuring that services are rendered within the set time limits.
WEB PRESENCE
Updated information regarding the Company can be accessed at its website, www.systemsltd.com. The website contains the latest financial results of the Company together with the Company’s profile.
Annual Report 2017 21
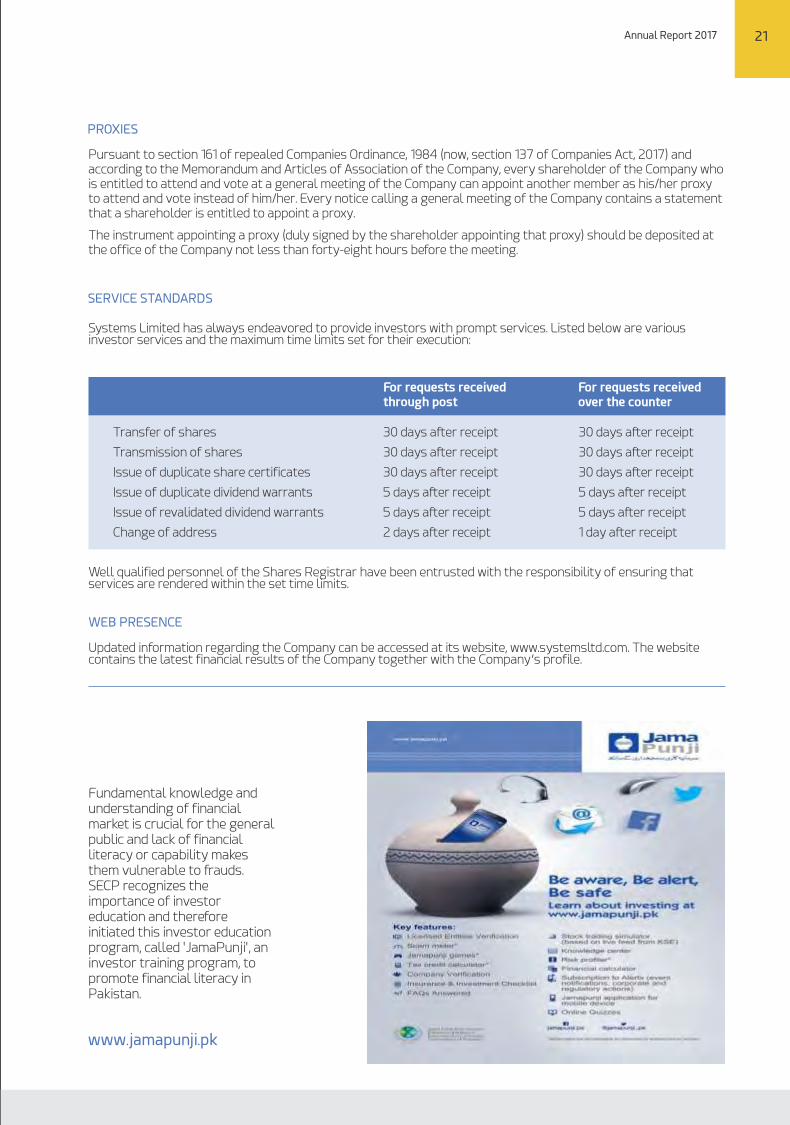
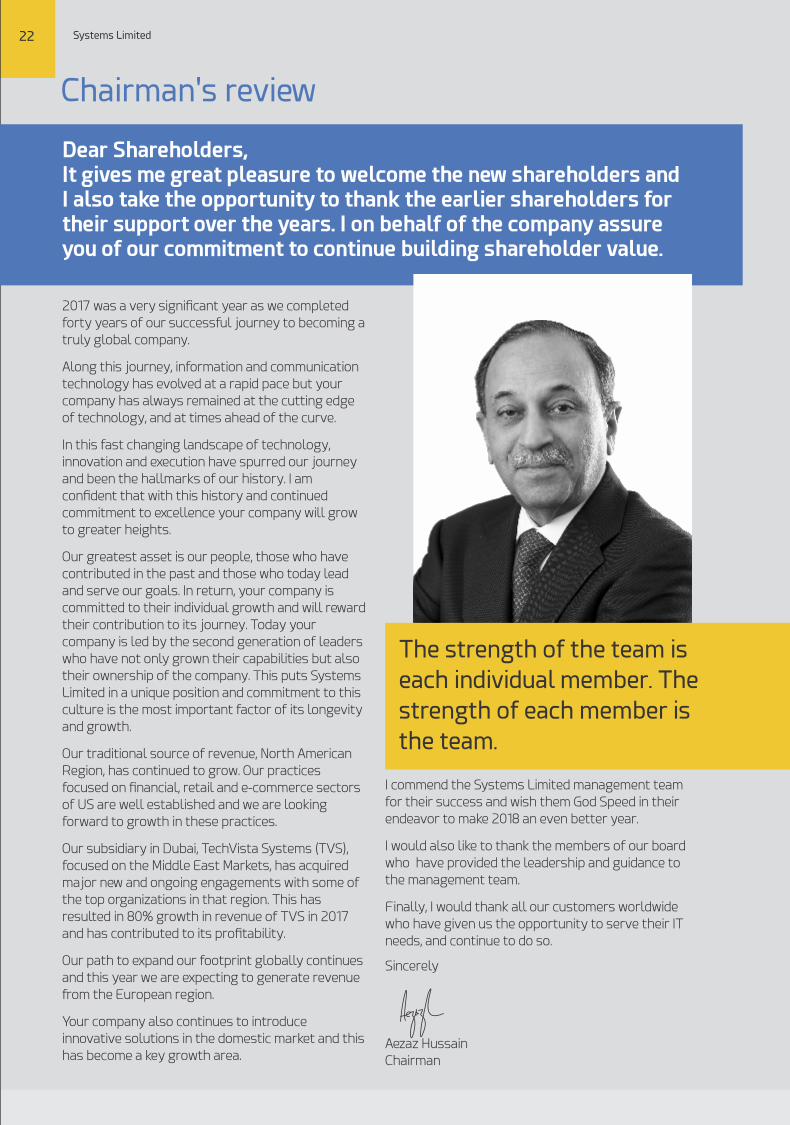
Dear Shareholders, It gives me great pleasure to welcome the new shareholders andI also take the opportunity to thank the earlier shareholders for their support over the years. I on behalf of the company assureyou of our commitment to continue building shareholder value.
Chairman's review
2017 was a very signicant year as we completed
forty years of our successful journey to becoming a
truly global company.
Along this journey, information and communication
technology has evolved at a rapid pace but your
company has always remained at the cutting edge
of technology, and at times ahead of the curve.
In this fast changing landscape of technology,
innovation and execution have spurred our journey
and been the hallmarks of our history. I am
condent that with this history and continued
commitment to excellence your company will grow
to greater heights.
Our greatest asset is our people, those who have
contributed in the past and those who today lead
and serve our goals. In return, your company is
committed to their individual growth and will reward
their contribution to its journey. Today your
company is led by the second generation of leaders
who have not only grown their capabilities but also
their ownership of the company. This puts Systems
Limited in a unique position and commitment to this
culture is the most important factor of its longevity
and growth.
Our traditional source of revenue, North American
Region, has continued to grow. Our practices
focused on nancial, retail and e-commerce sectors
of US are well established and we are looking
forward to growth in these practices.
Our subsidiary in Dubai, TechVista Systems (TVS),
focused on the Middle East Markets, has acquired
major new and ongoing engagements with some of
the top organizations in that region. This has
resulted in 80% growth in revenue of TVS in 2017
and has contributed to its protability.
Our path to expand our footprint globally continues
and this year we are expecting to generate revenue
from the European region.
Your company also continues to introduce
innovative solutions in the domestic market and this
has become a key growth area.
22 Systems Limited
I commend the Systems Limited management team
for their success and wish them God Speed in their
endeavor to make 2018 an even better year.
I would also like to thank the members of our board
who have provided the leadership and guidance to
the management team.
Finally, I would thank all our customers worldwide
who have given us the opportunity to serve their IT
needs, and continue to do so.
Sincerely
Aezaz Hussain
Chairman
The strength of the team is
each individual member. The
strength of each member is
the team.
CEO's review As I reect on 2017, it has truly been one fantastic
and impressive year for Systems Limited. Not only
have we unlocked higher potential in launching new
technologies and further penetrated new
geographies across the globe, but we have also
taken bold steps to invest in the company's internal
and external growth endeavors which I believe is the
key to taking Systems Limited to the next level. I
would like to thank my team, Board of Directors, and
our shareholders for consistently supporting us
through our journey and making great things come
to life. At Systems, we pride ourselves for enabling a
value driven culture that incorporates all aspects of
the Systems family and brings it together to drive
top-line success.
With our dedicated efforts on expansion,
diversication and innovation we were able to
launch disruptive technologies in an impactful way.
We have also launched Systems Innovation Lab
(SILA) to incubate innovative ideas and startups. This
will enable us to focus on innovation and nurturing
talent for our future growth. Furthermore, our
Global Competency based model has allowed us to
implement these technologies and innovation faster,
in a better way, and more efficiently, which has
enabled us to reduce overhead costs and tighten
our margins. Furthermore, our agility and ability to
adapt to the ever-growing needs of our customers
has set us apart from global competition and
allowed us to take center stage by bringing on 30+
impressive clients globally in 2017.
As our technologies have continued to scale, so has
our international presence which has enabled
Systems Limited to extend a deeper market
penetration in high-potential areas. TechVista has
impressively grown over 80% in the Middle East
region and unlocked enterprise-level clients across
the spectrum which has created a foundation for
further business development. We are condent
about the continued success here. Furthermore, for
the rst time, we are delivering business to
European customer – further instilling our global
footprint and paving the way for the future.
Our BPO portfolio is attracting international interest
thanks to the addition of our call center services
and digital marketing expertise. We look forward to
continued growth in this vertical.
Systems Limited also proudly celebrated multiple
awards at this year's PASHA ICT Awards 2017. We
ranked 1st in both the Project Management category
and the Managed Services catagory. This was
possible owing to the unwavering collaboration and
support from our numerous departments which was
ultimately recognized nation-wide by these two
awards.
2018 is among us, and I am looking forward to
continuing the momentum of growth we have
started in 2017 and leading it to discover growth like
never before. Our aggressive goals and objectives
will guide us along the way, and our dedicated
leadership and delivery teams will be working
tirelessly to ensure success.
Annual Report 2017 23
Asif Peer
Chief Executive Officer
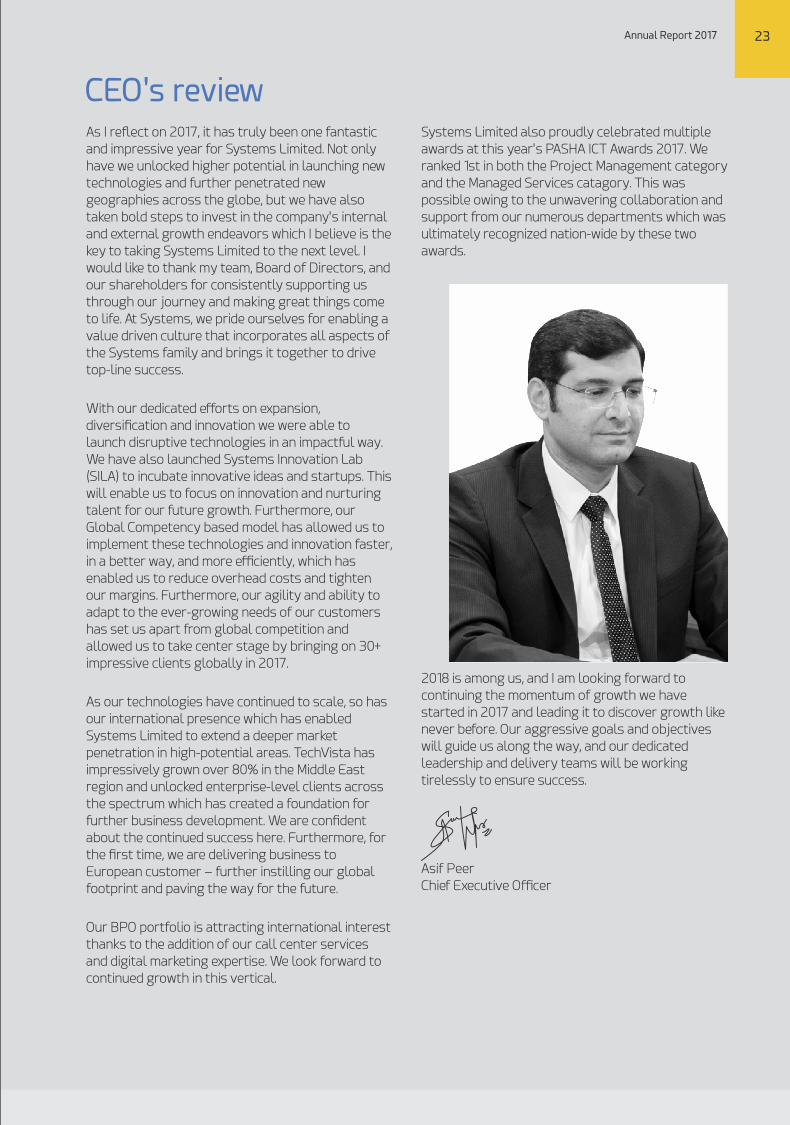
stOn behalf of the Board of Directors we are pleased to present the 41 Annual Report to the members together with Audited Group Financial Statements and Auditors Report for the year ended December 31, 2017.
Directors' Report to the Shareholders
DIVIDEND & APPROPRIATIONS
Directors recommended a payment of nal cash dividend @ Rs. 1.75 per share (2016: 1.86 per share).
The following appropriation on account of dividend was made during the year:
24 Systems Limited
Un-appropriated prot (PKR)
Balance as at 31 December 2016
Total comprehensive income for the year
Less: Final dividend for the year ended 31 December 2016 at the rate ofPKR 1.86 per share
Balance as at 31 December 2017
1,344,492,456
473,376,038
1,817,868,494
207,999,433
1,609,869,061
Unconsolidated
Particulars
Revenue
Gross prot
Prot before taxation
Prot after taxation
Earnings per share (basic)
Earnings per share (diluted)
2017 2016
2,910,800,003
862,108,068
481,432,442
473,376,038
4.24
4.23
2,680,323,531
795,703,708
505,919,994
515,079,946
4.64
4.61
Y/Y
9%
8%
(5%)
(8%)
(9%)
(8%)
Annual Report 2017 25
EARNING PER SHARE
Basic and diluted earnings per share for the year ended 31 December 2017 for the Company are PKR 4.24 and PKR 4.23 (31 December 2016: PKR 4.64 and PKR 4.61) per share. Similarly, the basic and diluted earnings per share for the Group are PKR 5.11 and PKR 5.10 (31 December 2016: PKR 4.39 and PKR 4.36) per share.
FINANCIAL PERFORMANCE OF THE COMPANY AND THE GROUP DURING 2017
Activities:
The Company is a public limited Company incorporated in Pakistan under the repealed Companies ordinance, 1984 (now, Companies Act, 2017) and listed on the Pakistan Stock Exchange (formerly Karachi, Islamabad and Lahore Stock Exchanges). The Company is principally engaged in the business of software development, trading of software and business process outsourcing services.
The Group comprises of Systems Limited (Holding Company) and its subsidiaries – TechVista Systems FZ LLC and E-Processing Systems (Private) Limited.
TechVista Systems FZ LLC (TVS), a limited liability Company incorporated in Dubai Technology and Media Free Zone Authority, is 100% owned subsidiary of Systems Limited. TVS is engaged in the business of developing software and providing ancillary services. TVS has also invested in TechVista Systems LLC and have acquired full control over the operations.This company is also registered as a software house but it does not have any independent operations and was created to support the projects of TechVista Systems FZ LLC.
E-Processing Systems (Private) Limited (EPS), a private limited Company registered under repealed Companies Ordinance, 1984 (now, Companies Act, 2017) incorporated on 06 February 2013, is a 53% (2016: 70%) owned subsidiary of Systems Limited. EPS is currently engaged in the business of purchase and sale of teleco's airtime and related services. The product of the Company is called OneLoad.
The nancial statements of the Company and the Group truly reect the state of Company's affairs and fair review of their business.
Performance:
The Company:
The company's revenue is primarily from software development and IT services work subcontracted by its subsidiary TVS operating in the Middle East region and its associated company Visionet Systems operating in the North America region. Over 76% of its revenue is export based. In recent years, the Company has started taking projects and
The Group:
For the year ended 31 December 2017, TechVista Systems FZ LLC registered a revenue of AED 43.15 million (2016: 23.85 million) and earned prot of AED 3.94 million (2016: AED -0.53 million). TechVista Systems LLC registered a cost of AED 6.20 million (2016: AED 2.04 million) which was charged to TechVista Systems FZ LLC.
During 2017, TechVista Systems FZ LLC has closed few signicant accounts in the Middle East, which will be the bedrock for future growth.
Financial Year 2017, being the rst full year of operations for E-Processing Systems (Private) Limited, the Company has achieved revenue growth of 828% from PKR 8.2 million in 2016 to PKR 76.5 million in 2017. The substantial revenue growth has enabled the Company to achieve a Gross Prot in 2017 of PKR 9.7 million compared to Gross Loss in
engagements in the domestic market. In the year 2017, the Company's standalone revenues grew by 9% as compared to the year 2016. A major reason for the lower top line growth was the delay in the launch of the new Islamabad International airport. This is a very signicant size project and the Company has not recognized signicant portion of its revenue from the project. On the other hand, the US and Middle East businesses have achieved sizable growth in terms of both top line and bottom line.
Gross prot is recorded at PKR 862.11 million in 2017 that at 30% of revenue was consistent with previous year. However, the net prot declined by 5% for the following key reasons:
• Distribution expense for the Company increased considerably over 2016 because the Company invested in marketing and business development both in it's international and local markets. This investment is expected to yield accelerated growth in future revenues and going forward, the Company will have a signicant decline in these marketing costs in 2018.
• In line with company policy for receivables outstanding for more than 365 days, the company has provided for doubtful debts due to delayed projects and delayed payments in our new markets.
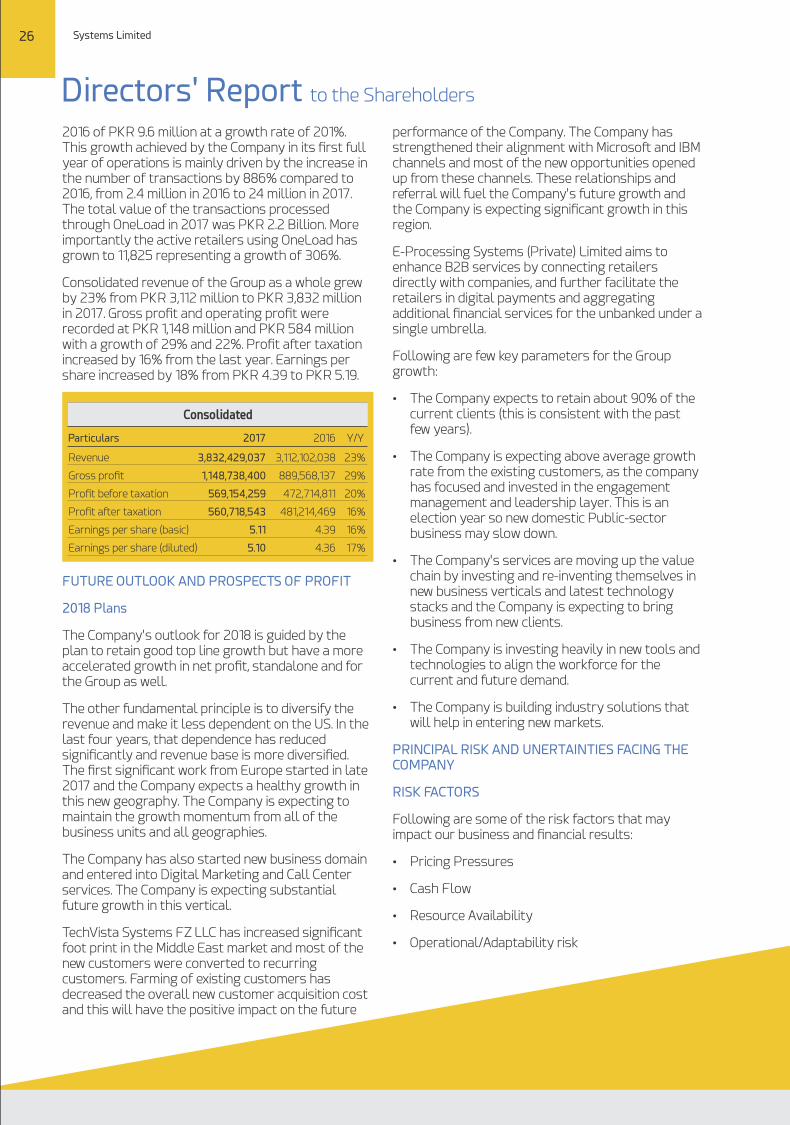
26 Systems Limited
Directors' Report to the Shareholders
2016 of PKR 9.6 million at a growth rate of 201%. This growth achieved by the Company in its rst full year of operations is mainly driven by the increase in the number of transactions by 886% compared to 2016, from 2.4 million in 2016 to 24 million in 2017. The total value of the transactions processed through OneLoad in 2017 was PKR 2.2 Billion. More importantly the active retailers using OneLoad has grown to 11,825 representing a growth of 306%.
Consolidated revenue of the Group as a whole grew by 23% from PKR 3,112 million to PKR 3,832 million in 2017. Gross prot and operating prot were recorded at PKR 1,148 million and PKR 584 million with a growth of 29% and 22%. Prot after taxation increased by 16% from the last year. Earnings per share increased by 18% from PKR 4.39 to PKR 5.19.
Consolidated
Particulars
Revenue
Gross prot
Prot before taxation
Prot after taxation
Earnings per share (basic)
Earnings per share (diluted)
2017 2016 Y/Y
3,832,429,037
1,148,738,400
569,154,259
560,718,543
5.11
5.10
3,112,102,038
889,568,137
472,714,811
481,214,469
4.39
4.36
23%
29%
20%
16%
16%
17%
FUTURE OUTLOOK AND PROSPECTS OF PROFIT
2018 Plans
The Company's outlook for 2018 is guided by the plan to retain good top line growth but have a more accelerated growth in net prot, standalone and for the Group as well.
The other fundamental principle is to diversify the revenue and make it less dependent on the US. In the last four years, that dependence has reduced signicantly and revenue base is more diversied. The rst signicant work from Europe started in late 2017 and the Company expects a healthy growth in this new geography. The Company is expecting to maintain the growth momentum from all of the business units and all geographies.
The Company has also started new business domain and entered into Digital Marketing and Call Center services. The Company is expecting substantial future growth in this vertical.
TechVista Systems FZ LLC has increased signicant foot print in the Middle East market and most of the new customers were converted to recurring customers. Farming of existing customers has decreased the overall new customer acquisition cost and this will have the positive impact on the future
performance of the Company. The Company has strengthened their alignment with Microsoft and IBM channels and most of the new opportunities opened up from these channels. These relationships and referral will fuel the Company's future growth and the Company is expecting signicant growth in this region.
E-Processing Systems (Private) Limited aims to enhance B2B services by connecting retailers directly with companies, and further facilitate the retailers in digital payments and aggregating additional nancial services for the unbanked under a single umbrella.
Following are few key parameters for the Group growth:
• The Company expects to retain about 90% of the current clients (this is consistent with the past few years).
• The Company is expecting above average growth rate from the existing customers, as the company has focused and invested in the engagement management and leadership layer. This is an election year so new domestic Public-sector business may slow down.
• The Company's services are moving up the value chain by investing and re-inventing themselves in new business verticals and latest technology stacks and the Company is expecting to bring business from new clients.
• The Company is investing heavily in new tools and technologies to align the workforce for the current and future demand.
• The Company is building industry solutions that will help in entering new markets.
PRINCIPAL RISK AND UNERTAINTIES FACING THE COMPANY
RISK FACTORS
Following are some of the risk factors that may impact our business and nancial results:
• Pricing Pressures
• Cash Flow
• Resource Availability
• Operational/Adaptability risk
Annual Report 2017 27
“Every once in a
while, a new
Technology, an old
problem, and a big
idea turn into an
Innovation.”-Dean Kamen
28 Systems Limited
Directors' Report to the Shareholders
Pricing Pressure
Given the scarce IT resources in Market, cost of resources is going up year on year and the billing rate is not increasing with the same ratio. However, dollar is expected to depreciate in 2018, which will subsidize the increase in the Company's resource cost to some extent.
In order to mitigate this risk, the Company will continue to induct Fresh Graduates from top notch universities, and working on proper resource mix, where senior resources can be utilized in more customer facing and client engagement role and back office work can be done by the junior resources, this will help the Company in balancing the cost of resources in various engagements.
Cash Flow
Technology has disrupted the industry and the Company is investing in building new competencies, capabilities and partnerships. The Company will also explore entry into new markets and product development. On the collection front, during election year, recovery from domestic Public Sector projects is expected to be challenged.
Typical collection cycle in the Middle East has also increased and has been averaging at about 4-5 months.
In order to mitigate cash ow risk, the Company has taken credit line against the Export Renance, this will help the Company and the Group to continue to push the growth momentum.
Resource Availability
High prole IT consultants and Engineers are in heavy demand and very hard to nd, and considering the Company's growth target, it is extremely hard to nd quality resources. The Company is also exporting resources to North America and Middle East market and this further adds pressure on quality resources availability.
In order to mitigate this risk this year the Company has been heavily focused on in-house and outside trainings of resources to bring them at the level where the Company can use them effectively. The Company has also signed up with many recruitment rms so that they can continuously screen and select leaders, who are essential for our sustainable growth.
Operational/Adaptability risk
OneLoad, being dependent on consumers adaptability to Mobile Usage for payments and transactions purposes, creates an inherent Adaptability risk for the company.
IT Infrastructure and its connectivity, being an integral component for the service continuity of the application i.e. OneLoad, makes it an operational risk for the company in case of service disruption.
CHANGES DURING FINANCIAL YEAR CONCERNING THE NATURE OF THE BUSINESS OF THE COMPANY OR OF ITS SUBSIDIARIES AND JOINT OPERATION
There has been no change in the nature of business of the company or its subsidiaries. The company has however, entered into joint operations with 50% sharing with a M/S Beijing Unistrong Science & Technology Co. Ltd through its subsidiary Top Scientic Systems Inc. for executing a multi-year contract for Package 04A – Airport Information Management Systems (AIMS), a turnkey project for the new Islamabad International Airport.
MAIN TRENDS AND FACTORS LIKELY TO AFFECT THE FUTURE DEVELOPMENT, PERFORMANCE AND POSITION OF THE COMPANY BUSINESS
Technology is rapidly changing and demands are on the higher side for the disruptive technologies. In order to grow at a faster pace, the Company has to scale up and nurture talent. Scaling into relevant technologies will have a signicant impact on future performance and position of the Company's business.
IMPACT OF COMPANY BUSINESS ON THE ENVIRONMENT
Since the Company is in the software business, the Company doesn't have any adverse impact on the environment.
CORPORATE SOCIAL RESPONSIBILITY
The Company acknowledges its responsibility towards society and performs its duty by providing nancial assistance to projects for society development by various charitable institutions on consistent basis.
ADEQUACY OF INTERNAL FINANCIAL CONTROLS
• The management of Systems Limited as a Group is responsible for the establishment and maintenance of the Company's and the Group's system of internal control in order to identify and manage risks faced by the Group. The system provides reasonable, though not absolute, assurance that:
• assets are safeguarded against unauthorized use or disposition;
• proper and reliable accounting records are available for use within the business;
• adequate control mechanisms have been established within the operational businesses and
Annual Report 2017 03
• Internal nancial controls deployed within the Company have been satisfactory throughout the year.
CORPORATE GOVERNANCE AND FINANCIAL REPORTING FRAMEWORK
As required by the Code of Corporate Governance, the directors are pleased to conrm that:
• The nancial statements prepared by the management of the Company and the Group, present its state of affairs fairly, the result of its operations, cash ows and changes in equity
• Proper books of accounts of the Company and each of its subsidiaries have been maintained
• Appropriately accounting policies have been consistently applied in the preparation of nancial statements and accounting estimates are based on reasonable and prudent judgment
• International Financial Reporting Standards, as applicable in Pakistan, have been followed in the preparation of nancial statements and there have been no departures therefrom
• The system of internal control is sound in design and has been effectively implemented and monitored
• There are no signicant doubts about the Company's ability along with the subsidiaries to continue as a going concern
• There has been no material departure from the best practices of corporate governance as detailed in listing regulations
BOARD OF DIRECTORS
The board comprises of seven (7) directors. During the year, board of directors elected in Extra Ordinary General Meeting held on 01 December 2014 completed their term of three (3) years and retired. Consequently, new board of directors were elected in Extra Ordinary General Meeting held on 01 December 2017.
During the year, six (6) board meetings were held. Out of these six (6) board meetings, ve (5) board meetings were of retiring board of directors while one (1) board meeting was of newly elected board of directors.
The names of directors and number of meetings attended by each director is as follows:
Retiring Directors
Name of Director Meetings Attended
Mr. Asif Peer
Mr. Arshad Masood
Mr. Omar Saeed
Mr. Ayaz Dawood
Mr. Asif Jooma
Mr. Tair Masaud
5
5
5
5
3
2
For TechVista Systems FZ LLC, Mr. Asif Peer is the director of the company.
For E-Processing Systems (Private) Limited, the directors of the company are – Mr. Aezaz Hussain, Chairman, Mr. Asif Peer and Mr. Muhammad Yar Hiraj.
BOARD COMMITTEES
The Board of Directors has constituted Audit Committee and Human Resource & Compensation Committee. These committees dissolved on retirement of board of directors and were reconstituted following election of new board of directors.
The names of members of Board Committees and number of meetings attended by each member is as follows:
Audit Committee:
Retiring Directors
Name of Director Meetings Attended
Mr. Ayaz Dawood
Mr. Omar Saeed
Mr. Tahir Masaud
3
3
-
Existing Committee
Name of Director Meetings Attended
1
1
1
Mr. Ayaz Dawood
Mrs. Romana Abdullah
Mr. Tahir Masaud
Retiring Directors
Name of Director Meetings Attended
Mr. Aezaz Hussain 5
Existing Directors
Name of Director Meetings Attended
Mr. Aezaz Hussain
Mr. Asif Peer
Mr. Arshad Masood
Mrs. Romana Abdullah
Mr. Ayaz Dawood
Mr. Asif Jooma
Mr. Tair Masaud
1
1
1
1
1
1
1
29
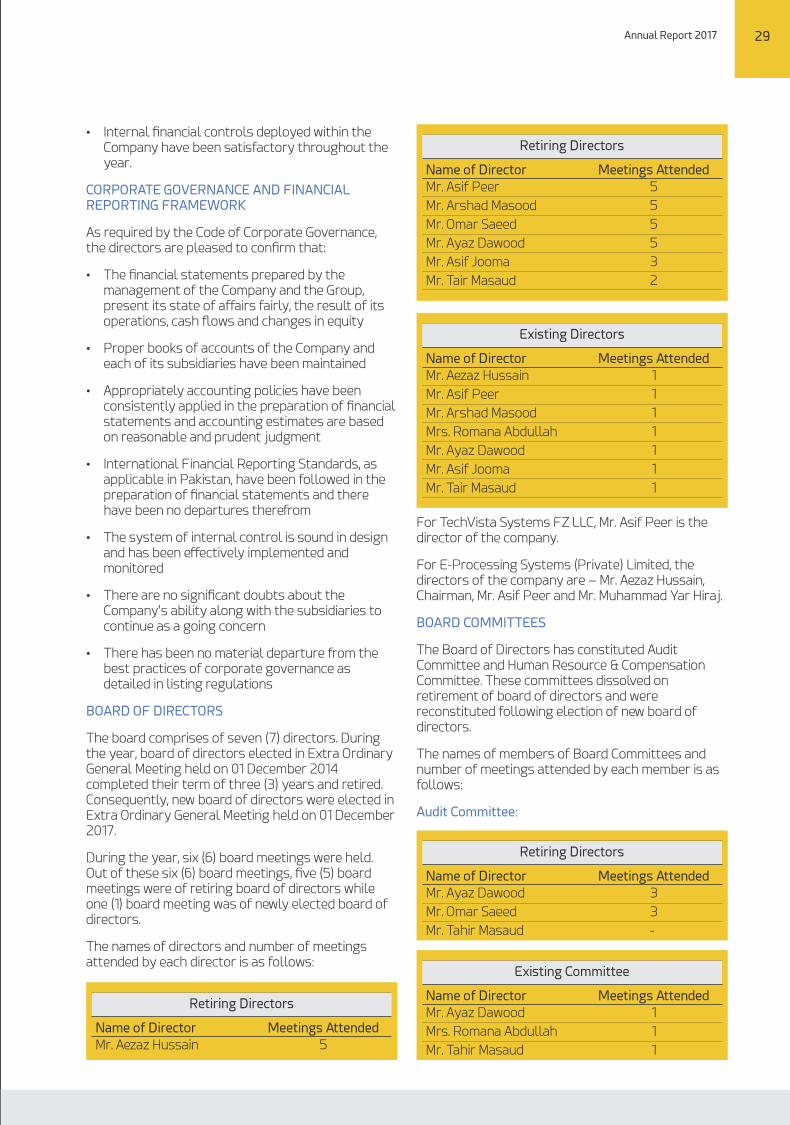
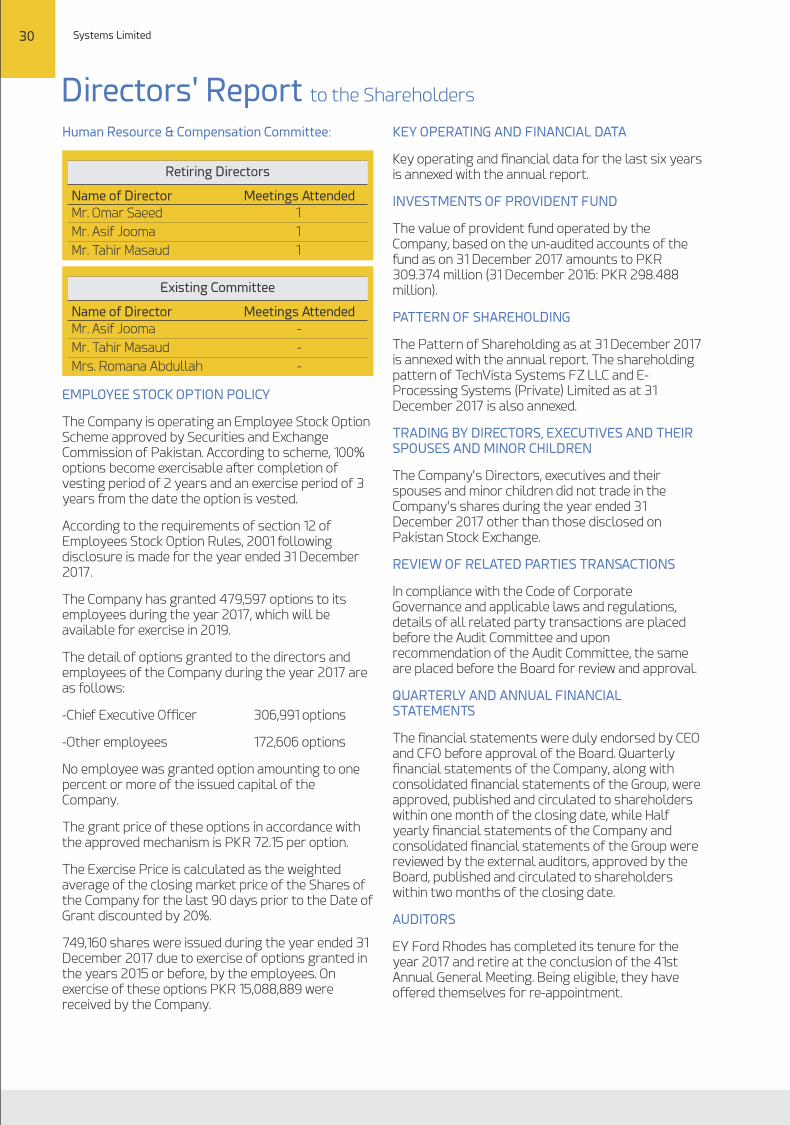
30 Systems Limited
Directors' Report to the Shareholders
Retiring Directors
Name of Director Meetings Attended
1
1
1
Existing Committee
Name of Director Meetings Attended
-
-
-
Mr. Omar Saeed
Mr. Asif Jooma
Mr. Tahir Masaud
Mr. Asif Jooma
Mr. Tahir Masaud
Mrs. Romana Abdullah
Human Resource & Compensation Committee:
EMPLOYEE STOCK OPTION POLICY
The Company is operating an Employee Stock Option Scheme approved by Securities and Exchange Commission of Pakistan. According to scheme, 100% options become exercisable after completion of vesting period of 2 years and an exercise period of 3 years from the date the option is vested.
According to the requirements of section 12 of Employees Stock Option Rules, 2001 following disclosure is made for the year ended 31 December 2017.
The Company has granted 479,597 options to its employees during the year 2017, which will be available for exercise in 2019.
The detail of options granted to the directors and employees of the Company during the year 2017 are as follows:
-Chief Executive Officer 306,991 options
-Other employees 172,606 options
No employee was granted option amounting to one percent or more of the issued capital of the Company.
The grant price of these options in accordance with the approved mechanism is PKR 72.15 per option.
The Exercise Price is calculated as the weighted average of the closing market price of the Shares of the Company for the last 90 days prior to the Date of Grant discounted by 20%.
749,160 shares were issued during the year ended 31 December 2017 due to exercise of options granted in the years 2015 or before, by the employees. On exercise of these options PKR 15,088,889 were received by the Company.
KEY OPERATING AND FINANCIAL DATA
Key operating and nancial data for the last six years is annexed with the annual report.
INVESTMENTS OF PROVIDENT FUND
The value of provident fund operated by the Company, based on the un-audited accounts of the fund as on 31 December 2017 amounts to PKR 309.374 million (31 December 2016: PKR 298.488 million).
PATTERN OF SHAREHOLDING
The Pattern of Shareholding as at 31 December 2017 is annexed with the annual report. The shareholding pattern of TechVista Systems FZ LLC and E-Processing Systems (Private) Limited as at 31 December 2017 is also annexed.
TRADING BY DIRECTORS, EXECUTIVES AND THEIR SPOUSES AND MINOR CHILDREN
The Company's Directors, executives and their spouses and minor children did not trade in the Company's shares during the year ended 31 December 2017 other than those disclosed on Pakistan Stock Exchange.
REVIEW OF RELATED PARTIES TRANSACTIONS
In compliance with the Code of Corporate Governance and applicable laws and regulations, details of all related party transactions are placed before the Audit Committee and upon recommendation of the Audit Committee, the same are placed before the Board for review and approval.
QUARTERLY AND ANNUAL FINANCIAL STATEMENTS
The nancial statements were duly endorsed by CEO and CFO before approval of the Board. Quarterly nancial statements of the Company, along with consolidated nancial statements of the Group, were approved, published and circulated to shareholders within one month of the closing date, while Half yearly nancial statements of the Company and consolidated nancial statements of the Group were reviewed by the external auditors, approved by the Board, published and circulated to shareholders within two months of the closing date.
AUDITORS
EY Ford Rhodes has completed its tenure for the year 2017 and retire at the conclusion of the 41st Annual General Meeting. Being eligible, they have offered themselves for re-appointment.
Annual Report 2017 31
CONSOLIDATED FINANCIAL STATEMENTS
Consolidated nancial statements of the Company together with its subsidiary companies E-Processing Systems (Private) Limited and TechVista Systems FZ LLC are also included.
SUBSEQUENT EVENTS
No material changes or commitments affecting the nancial position of the Company and the Group have occurred between the end of the nancial year and the date of this report except as disclosed in this report, if any.
ACKNOWLEDGEMENT
The Board takes this opportunity to thank the Company's and its subsidiaries' valued customers, bankers and other stakeholders for their corporation and support. The Board greatly appreciates hard work and dedication of the management and all employees of the Group.
On behalf of the Board
Asif PeerChief Executive Officer
Aezaz HussainChairman
Date: 26 March 2018Lahore
32 Systems Limited Annual Report 2017 33
3
3
-
1
1
1
1
1
1
-
-
-
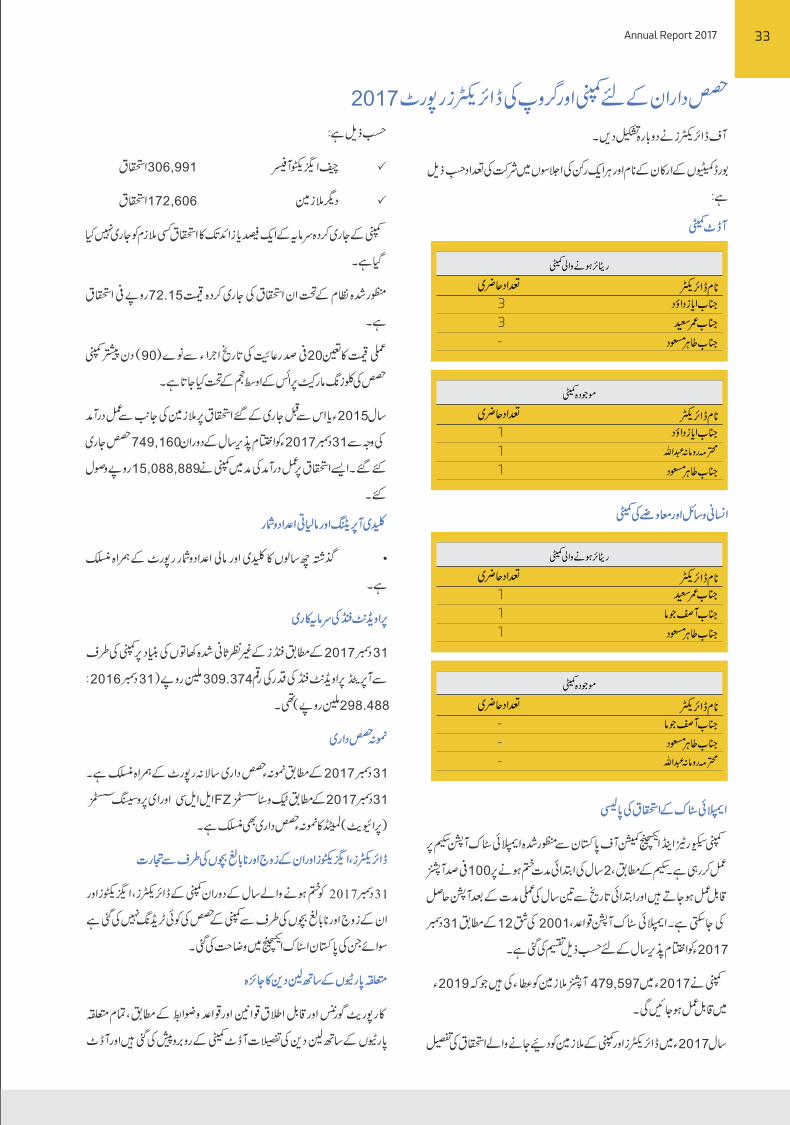
32 Systems Limited Annual Report 2017 33
3
3
-
1
1
1
1
1
1
-
-
-
34 Systems Limited Annual Report 2017 35
1
1
1
1
1
1
1
5
5
5
5
3
2
5
34 Systems Limited Annual Report 2017 35
1
1
1
1
1
1
1
5
5
5
5
3
2
5
36 Systems Limited
20172016
2,910,800,003
862,108,068
481,432,442
473,376,038
4.24
4.23
2,680,323,531
795,703,708
505,919,994
515,079,946
4.64
4.61
9%
8%
(5%)
(8%)
(9%)
(8%)
Annual Report 2017 37
1,344,492,456
473,376,038
1,817,868,494
207,999,433
1,609,869,061
20172016Y/Y
3,832,429,037
1,148,738,400
569,154,259
560,718,543
5.11
5.10
3,112,102,038
889,568,137
472,714,811
481,214,469
4.39
4.36
23%
29%
20%
16%
16%
17%
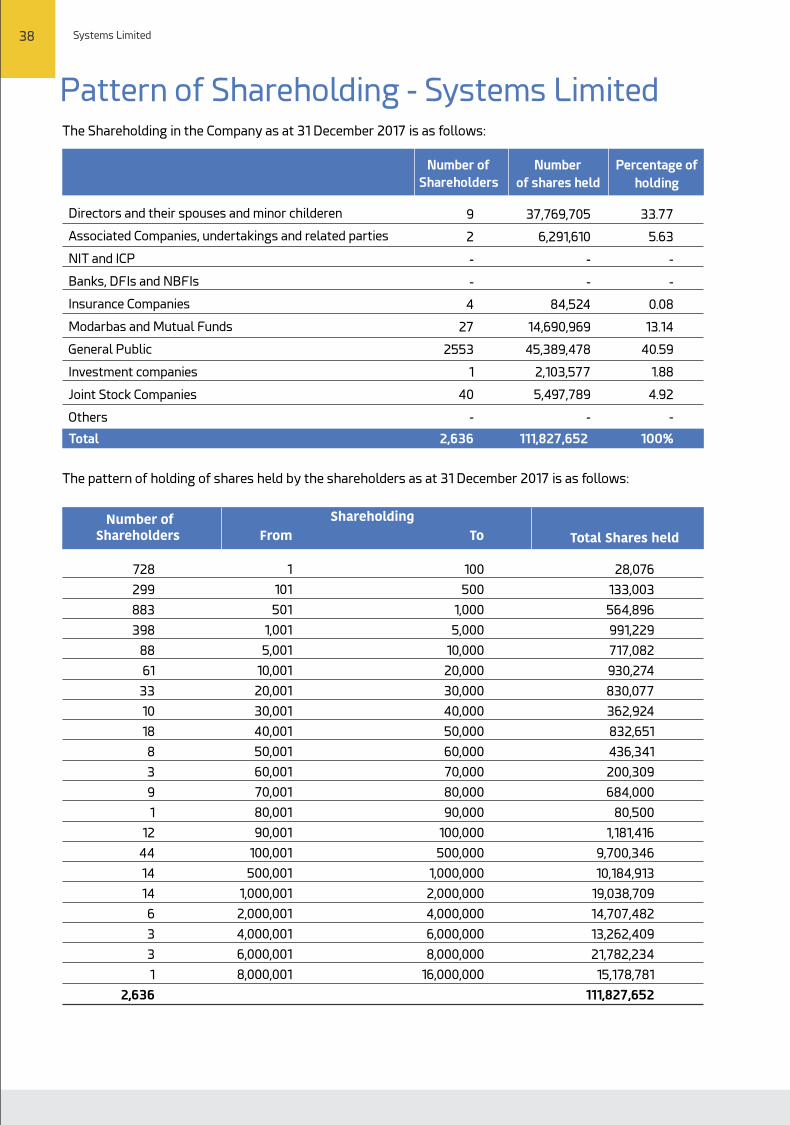
38 Systems Limited
Pattern of Shareholding - Systems LimitedThe Shareholding in the Company as at 31 December 2017 is as follows:
Directors and their spouses and minor childeren
Associated Companies, undertakings and related parties
NIT and ICP
Banks, DFIs and NBFIs
Insurance Companies
Modarbas and Mutual Funds
General Public
Investment companies
Joint Stock Companies
Others
Number of
Shareholders
Number
of shares held
Percentage of
holding
2,636 111,827,652 100%
From To
Number of Shareholders
Shareholding
Total Shares held
The pattern of holding of shares held by the shareholders as at 31 December 2017 is as follows:
Total
9
2
-
-
4
27
2553
1
40
-
37,769,705
6,291,610
-
-
84,524
14,690,969
45,389,478
2,103,577
5,497,789
-
33.77
5.63
-
-
0.08
13.14
40.59
1.88
4.92
-
728
299
883
398
88
61
33
10
18
8
3
9
1
12
44
14
14
6
3
3
1
2,636
1
101
501
1,001
5,001
10,001
20,001
30,001
40,001
50,001
60,001
70,001
80,001
90,001
100,001
500,001
1,000,001
2,000,001
4,000,001
6,000,001
8,000,001
100
500
1,000
5,000
10,000
20,000
30,000
40,000
50,000
60,000
70,000
80,000
90,000
100,000
500,000
1,000,000
2,000,000
4,000,000
6,000,000
8,000,000
16,000,000
28,076
133,003
564,896
991,229
717,082
930,274
830,077
362,924
832,651
436,341
200,309
684,000
80,500
1,181,416
9,700,346
10,184,913
19,038,709
14,707,482
13,262,409
21,782,234
15,178,781
111,827,652
Annual Report 2017 39
Information of shareholding as at 31 December 2017 as required under Code of Corporate Governance isas follows
CategoryNo. Shareholder's category
Number ofshares held
Percentage %
1
2
3
3.75%
1.88%
5.63%
3.00%
2.51%
1.33%
0.00%
0.35%
0.03%
0.09%
0.85%
1.90%
0.09%
0.64%
0.23%
0.00%
0.01%
0.15%
0.19%
0.10%
0.01%
0.08%
0.00%
0.12%
0.95%
0.33%
0.01%
0.13%
0.03%
0.01%
13.14%
12.81%
0.09%
5.97%
14.47%
0.00%
0.00%
0.00%
0.01%
0.42%
33.77%
12.81%
5.97%
14.47%
6.71%
5.79%
45.75%
Associated Companies, undertakings and related parties
M/S IGI Insurance Limited
M/S B.R.R. Guardian Modarba
Mutual Funds
TUNDRA PAKISTAN FUND
TUNDRA FRONTIER OPPORTUNITIES FUND
TUNDRA SUSTAINABLE FRONTIER FUND
CDC - TRUSTEE MCB PAKISTAN STOCK MARKET FUND
CDC - TRUSTEE ALHAMRA ISLAMIC STOCK FUND
CDC - TRUSTEE FIRST DAWOOD MUTUAL FUND
CDC - TRUSTEE AKD OPPORTUNITY FUND
CDC - TRUSTEE UBL STOCK ADVANTAGE FUND
CDC - TRUSTEE NAFA STOCK FUND
CDC - TRUSTEE MCB PAKISTAN ASSET ALLOCATION FUND
CDC - TRUSTEE LAKSON EQUITY FUND
CDC-TRUSTEE NAFA ASSET ALLOCATION FUND
CDC - TRUSTEE PICIC STOCK FUND
JS GLOBAL CAPITAL LIMITED - MF
ADAMJEE LIFE ASSURANCE COMPANY LIMITED-ISF
CDC - TRUSTEE NAFA PENSION FUND EQUITY SUB-FUND ACCOUNT
CDC - TRUSTEE NAFA ISLAMIC PENSION FUND EQUITY ACCOUNT
ARIF HABIB LIMITED - MF
CDC - TRUSTEE UBL RETIREMENT SAVINGS FUND - EQUITY SUB FUND
CDC - TRUSTEE PICIC ISLAMIC STOCK FUND
CDC - TRUSTEE PAKISTAN PENSION FUND - EQUITY SUB FUND
CDC - TRUSTEE NAFA ISLAMIC STOCK FUND
CDC - TRUSTEE NAFA ISLAMIC ACTIVE ALLOCATION EQUITY FUND
MARKET 786 (PRIVATE) LIMITED - MF
CDC - TRUSTEE LAKSON TACTICAL FUND
CDC - TRUSTEE LAKSON ISLAMIC TACTICAL FUND
MRA SECURITIES LIMITED - MF
Directors and their spouses and children
Aezaz Hussain
Neelam Hussain
Asif Peer
Arshad Masood
Mrs. Romana Abdullah
Chaudhary Tahir Masaud
Asif Jooma
Ayaz Dawood
Riaz Hussain
Shareholders holding ve percent or more voting rights
Aezaz Hussain
Asif Peer
Arshad Masood
Salma Mian
Manzurul Haq
4,188,033
2,103,577
6,291,610
3,350,000
2,807,000
1,490,500
3,250
386,500
35,500
100,000
956,000
2,127,000
98,500
713,974
259,500
1,375
7,500
171,000
211,500
106,500
14,500
93,500
150
138,955
1,057,000
364,000
9,000
150,906
29,859
7,500
14,690,969
14,329,734
95,110
6,674,370
16,184,745
500
100
549
11,000
473,597
37,769,705
14,329,734
6,674,370
16,184,745
7,500,000
6,476,822
51,165,671
6 6.87%Banks DFIs and NBFIs, Insurance Companies, Modarabas and Pension Funds 7,685,890
5 0.00%Public Sector Companies and Corporations -
4 0.00%Executives -
7 40.59%Others 45,389,478
100%111,827,652Total
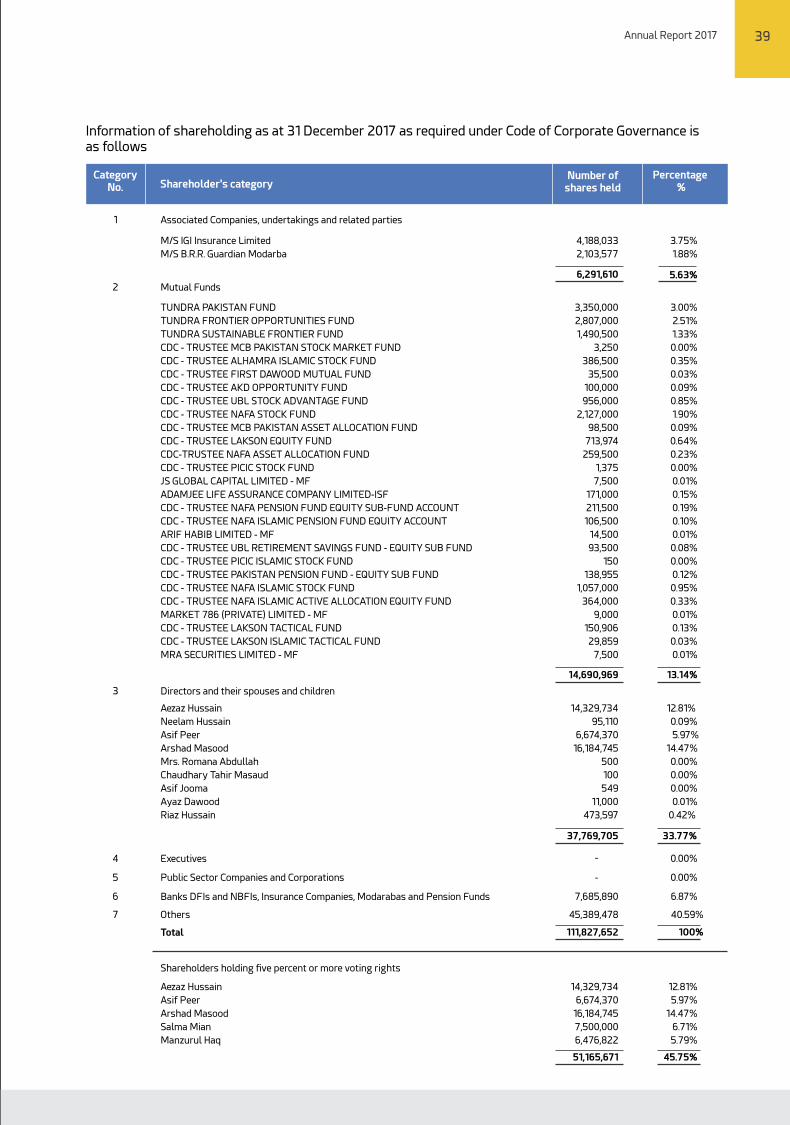
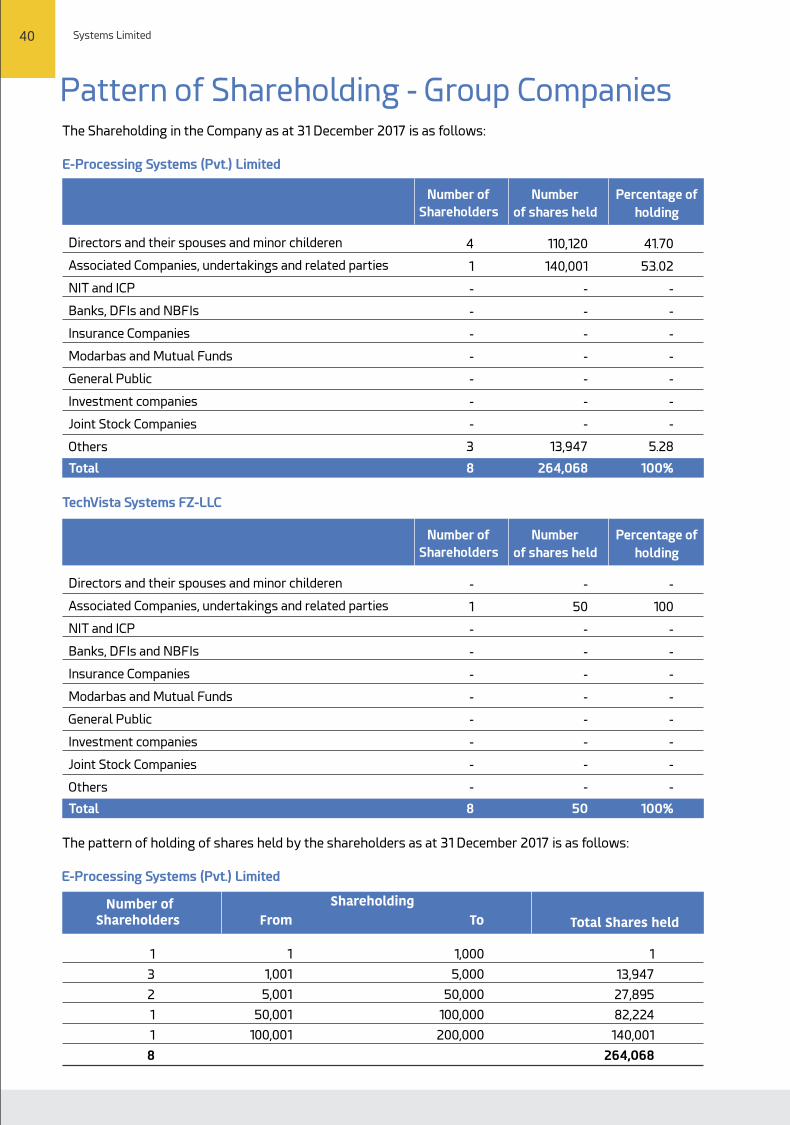
40 Systems Limited
Pattern of Shareholding - Group CompaniesThe Shareholding in the Company as at 31 December 2017 is as follows:
Directors and their spouses and minor childeren
Associated Companies, undertakings and related parties
NIT and ICP
Banks, DFIs and NBFIs
Insurance Companies
Modarbas and Mutual Funds
General Public
Investment companies
Joint Stock Companies
Others
Number of
Shareholders
Number
of shares held
Percentage of
holding
8 264,068 100%Total
4
1
-
-
-
-
-
-
-
3
110,120
140,001
-
-
-
-
-
-
-
13,947
41.70
53.02
-
-
-
-
-
-
-
5.28
E-Processing Systems (Pvt.) Limited
Directors and their spouses and minor childeren
Associated Companies, undertakings and related parties
NIT and ICP
Banks, DFIs and NBFIs
Insurance Companies
Modarbas and Mutual Funds
General Public
Investment companies
Joint Stock Companies
Others
Number of
Shareholders
Number
of shares held
Percentage of
holding
8 50 100%Total
-
1
-
-
-
-
-
-
-
-
-
50
-
-
-
-
-
-
-
-
-
100
-
-
-
-
-
-
-
-
TechVista Systems FZ-LLC
The pattern of holding of shares held by the shareholders as at 31 December 2017 is as follows:
From To Number of
Shareholders
Shareholding
Total Shares held
1
3
2
1
1
8
1
1,001
5,001
50,001
100,001
1,000
5,000
50,000
100,000
200,000
1
13,947
27,895
82,224
140,001
264,068
E-Processing Systems (Pvt.) Limited
Annual Report 2017 41
From To Number of
Shareholders
Shareholding
Total Shares held
1
1
1 50 50
50
TechVista Systems FZ LLC
Information of shareholding as at 31 December 2017 as required under Code of Corporate Governance isas follows
CategoryNo. Shareholder's category
1
2
3
4
5
6
7
Associated Companies, undertakings and related parties
M/S Systems Limited
Mutual Funds
Directors and their spouses and children
Aezaz Hussain
Muhammad Asif Peer
Muhammad Yar Hiraj
Neelam Hussain
Executives
Public Sector Companies and Corporations
Others
Total
Shareholders holding ve percent or more voting rights
Muhammad Asif Peer
Muhammad Yar Hiraj
Systems Limited
Neelam Hussain
Banks DFIs and NBFIs, Insurance Companies, Modarabas
and Pension Funds
Number ofshares held
Percentage %
53.02%
53.02%
0.00%
0.00%
5.28%
31.14%
5.28%
41.70%
0.00%
0.00%
0.00%
5.28%
100%
5.28%
31.14%
53.02%
5.28%
94.72%
140,001
140,001
-
1
13,948
82,224
13,947
110,120
-
-
13,947
264,068
13,948
82,224
140,001
13,947
250,120
-
50
50
-
-
-
-
-
50
50
50
100.00%
100.00%
0.00%
0.00%
0.00%
0.00%
0.00%
0.00%
0.00%
0.00%
0.00%
0.00%
100%
0.00%
0.00%
100.00%
0.00%
100.00%
-
Number ofshares held
Percentage %
TechVista Systems FZ LLCE-Processing Systems (Pvt.) Limited
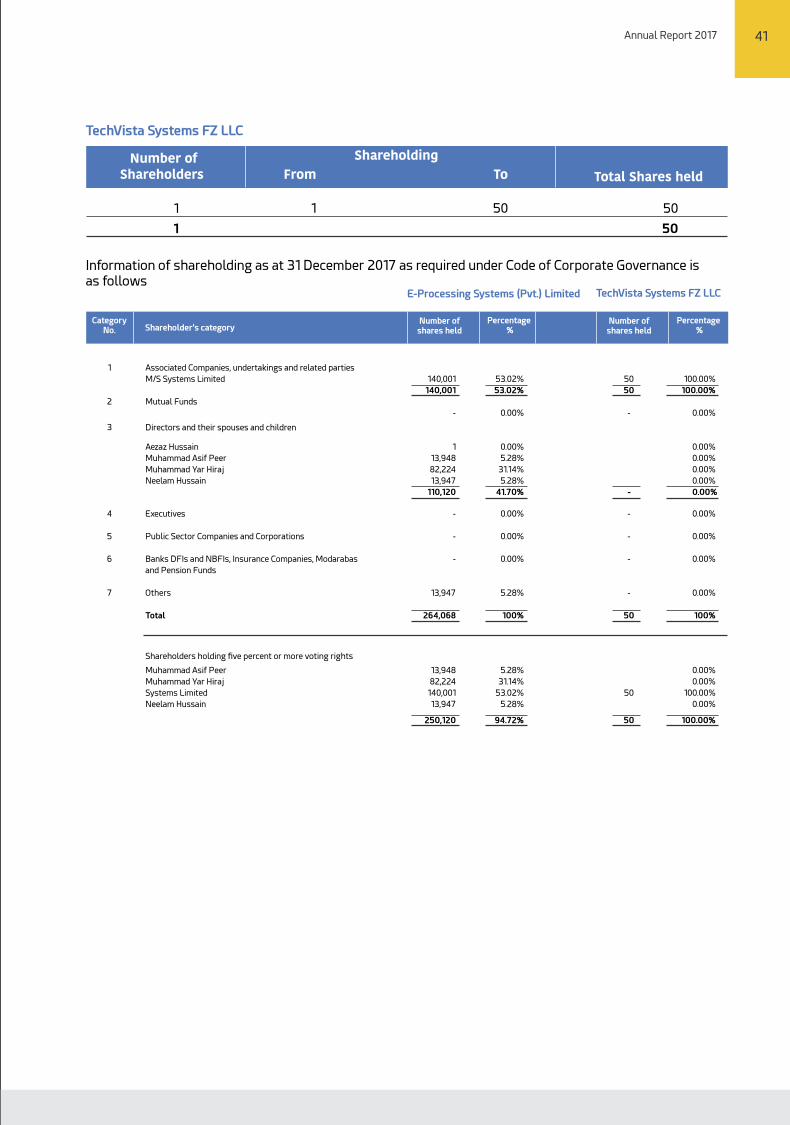
42 Systems Limited
Notice of Annual General Meeting
Annual Report 2017 43
Notice is hereby given to all the members of Systems Limited (the “Company”) that 41st Annual General Meeting of the Company is scheduled to be held on 26 April 2018 at 10:00 A.M. at Chamber of Commerce Building, 11 Sharae Aiwan-e-Tijarat, Lahore to transact the following business:
Ordinary Business:
1. To conrm the minutes of the last Extraordinary General Meeting held on December 01, 2017.
2. To, receive, consider and adopt the Audited Accounts of the Company for the year ended 31 December 2017 together with the Directors' and Auditors' report thereon.
3. To approve and declare cash dividend @ 17.5 % i.e. PKR 1.75/ per share, for the year ended 31 December 2017 as recommended by the Board of Directors.
4. To appoint Auditors and x their remuneration for the year ending 31 December 2018. The Board of Directors upon recommendation of audit committee has recommended M/s EY Ford Rhodes, Chartered Accountants, being eligible for re-appointment as auditors of the company for the year ending 31 December 2018.
Special Business
5. To replace the name of “Visionet Systems Inc., USA” with the word subsidiaries at point no 1.2 and 3.19 of the Systems Limited's Employees Stock option Scheme, 2009 subject to the approval of Securities & Exchange Commission of Pakistan.
RESOLVED THAT the point no 1.2 and 3.19 of Systems Limited Employees Stock Option Scheme, 2009 shall be replaced as follows:
1.2 “It extends to all the employees of Systems Limited and its subsidiaries”
3.19 "Subsidiary" means subsidiary of Systems Limited”
RESOLVED FURTHER that the Company Secretary be and is hereby authorized to do all acts, deed and things, take all steps and necessary action, ancillary and incidental for change in the Systems Limited Employees Stock Option Scheme, 2009 of the Company including ling of all requisite documents/ application as may be required to be led with the Commission and complying with all other regulatory requirements so as to effectuate the change in the Employees Stock Option Scheme of the Company and implementing the aforesaid resolution.”
6. To consider and, if thought t, pass, with or without modication, the following special resolution in terms of Section 199 of Companies Act, 2017, for increase in existing investment in the form of loan and guarantee in UUS Joint Venture (Private) Limited, an associated company of the Company, from Rs. 250 million to Rs. 400 million.
“Resolved that Systems Limited (the Company) shall increase its existing investment in its associated company, UUS Joint Venture (Private) Limited (Associated Company) in the form of loan and guarantee amounting to Rs. 250 million to Rs. 400 million on the terms and conditions to be contained in the agreement to be executed between the Company and Associated Company in terms of Section 199 of Companies Act, 2017.
“Further resolved that Mr. Muhammad Asif Peer, the Chief Executive of the Company (the “Authorized Officer”), be and is hereby empowered and authorized to undertake, execute and implement all the decisions in respect of the Investment and to take and do and/or cause to be taken or done any/all necessary acts, deeds and things, and to take any or all necessary actions which are or may be necessary, incidental and/or consequential to give effect to the aforesaid resolution, including signing and execution of documents and agreements and to complete all necessary legal formalities and to le all necessary documents as may be necessary or incidental for the purposes of implementing the aforesaid resolution”.
7. To consider and, if thought t, pass, with or without modication, the following special resolution in terms of Section 199 of Companies Act, 2017, for increase in existing investment in the form of running credit line in E-Processing Systems (Private) Limited, a subsidiary company of the Company, from Rs. 120 million to Rs. 240 million.
“Resolved that Systems Limited (the Company) shall increase its existing investment in its subsidiary company, E-Processing Systems (Private) Limited (Subsidiary Company) in the form of running credit line amounting to Rs. 120 million to Rs. 240 million, renewable each year, on the terms and conditions to be contained in the agreement to be executed between the Company and Subsidiary Company in terms of Section 199 of Companies Act, 2017.
Further resolved that Mr. Muhammad Asif Peer, Chief Executive of the Company (“Authorized Officers”) be and are hereby singly empowered
and authorized to undertake the decisions of investment and to take and do and/or cause to be taken or done any/all necessary acts, deeds and things, take any or all necessary actions which are or may be necessary, incidental and/or consequential to give effect to the aforesaid resolution including signing and execution of documents and agreements and complete all necessary legal formalities and le all necessary documents as may be necessary or incidental for the purposes of implementing the aforesaid resolution.”
Other Business:
8. Any other Business with the permission of the Chair.
By Order of the Board
Roohi Khan
Company Secretary
April 05, 2018
Lahore
NOTES:
1. The Share Transfer books of the Company will be closed from 20 April 2018 to 26 April 2018 (both days inclusive). Transfer received at the address of M/s THK Associates (Pvt.) Limited, 1st Floor, 40-C, Block-6, P.E.C.H.S., Karachi at the close of business on 19 April 2018 will be treated in time for the purpose of above entitlement to the transferees.
2. A member entitled to attend and vote at the meeting may appoint another member as his/her proxy to attend and vote in his/her place. Proxies completed in all respect, in order to be effective, must be received at the Registered Office of the Company not less than forty eight (48) hours before the time of meeting.
3. Pursuant to the directive of the Securities & Exchange Commission of Pakistan, CNIC numbers of shareholders are mandatorily required to be mentioned on Dividend Warrants. Shareholders are, therefore, requested to submit a copy of their CNIC (if not already provided) to the Company Share Registrar, M/s THK Associates (Pvt.) Limited, 1st Floor, 40-C, Block-6, P.E.C.H.S., Karachi.
4. The Government of Pakistan through Finance Act, 2017 has made certain amendments in Section 150 of the Income Tax Ordinance, 2001 whereby different rates are prescribed for deduction of withholding Tax on the amount of dividend paid by the companies/banks. These tax rates are as follows:
(a) For lers of income tax returns 15%
(b) For non-lers of income tax returns 20%
To enable the Company to make tax deduction on the amount of cash dividend @15% instead of 20% all shareholders whose names are not entered into the Active Tax- payers list (ATL) provided on the website of FBR, despite the fact that they are lers, are advised to make sure that their names are entered into ATL before the date of payment of the cash dividend, otherwise tax on their cash dividend will be deducted @20% instead of 15%.
The joint shareholders are requested to provide shareholding proportions of principal shareholders & joint shareholders as withholding tax will be determined separately on Filer/Non-ler status based on their shareholding proportions otherwise it will be assumed that shares are equally held.
The Corporate shareholders having CDC account are required to have their National Tax Number (NTN) updated with their respective participants, whereas physical shareholders should send a copy of their NTN Certicate to the Company or Company's Share Registrar, M/s. THK Associates (Pvt.) Limited. The shareholders while sending NTN or NTN Certicate, as the case may be, must quote Company name and their respective folio numbers.
5. SECP through its notication SRO 787(1) /2014 dated September 8, 2014 has allowed the circulations of Audited Financial Statement along with Notice of Annual General Meeting to the Members through e-mail. Therefore, all members of the Company who wish to receive soft copy of Annual Report are requested to send their e-mail addresses. The consent form for electronic transmission could be downloaded from the Company Website: www.systemsltd.com Audited nancial statements & reports are being placed on the aforesaid website.
6. All the account holders whose registration details are uploaded as per CDC Regulations shall authenticate their identity by showing original CNIC at the time of attending the meeting. In case of corporate entity, a certied copy of resolution of the Board of Directors / valid Power of Attorney having the name and specimen signature of the nominee should be produced at the time of meeting.
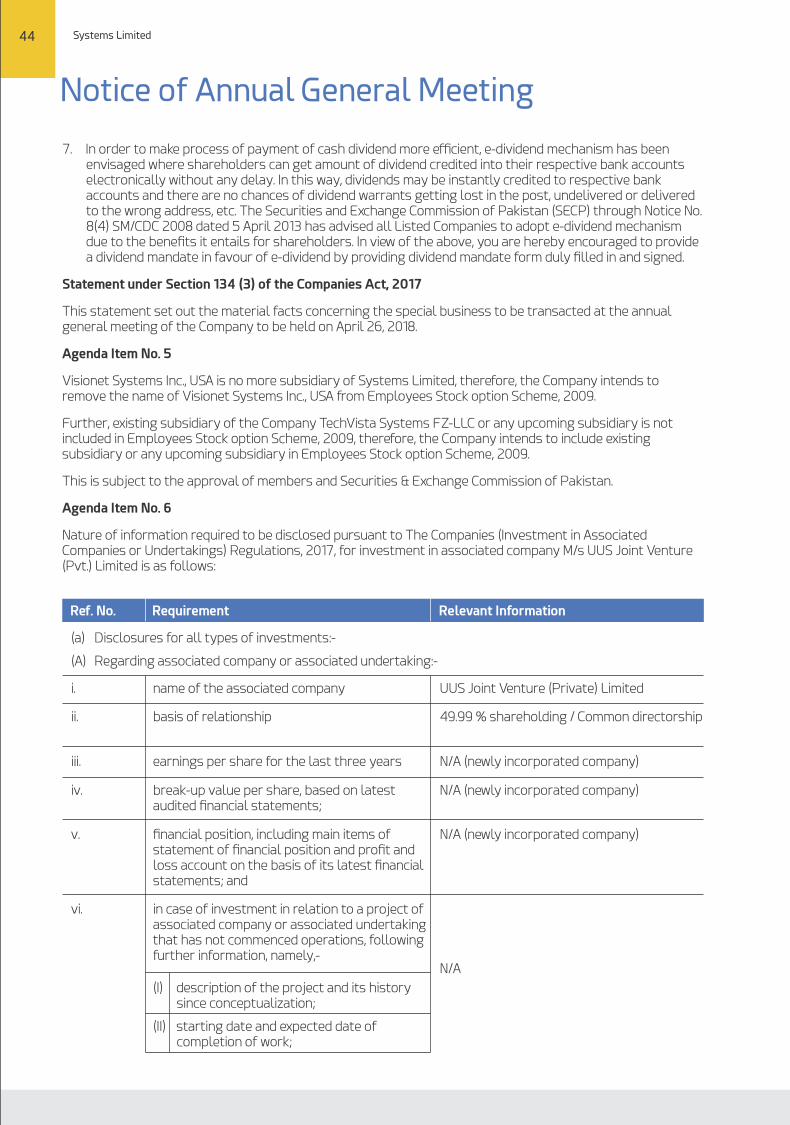
44 Systems Limited
Notice of Annual General Meeting
Annual Report 2017 45
7. In order to make process of payment of cash dividend more efficient, e-dividend mechanism has been envisaged where shareholders can get amount of dividend credited into their respective bank accounts electronically without any delay. In this way, dividends may be instantly credited to respective bank accounts and there are no chances of dividend warrants getting lost in the post, undelivered or delivered to the wrong address, etc. The Securities and Exchange Commission of Pakistan (SECP) through Notice No. 8(4) SM/CDC 2008 dated 5 April 2013 has advised all Listed Companies to adopt e-dividend mechanism due to the benets it entails for shareholders. In view of the above, you are hereby encouraged to provide a dividend mandate in favour of e-dividend by providing dividend mandate form duly lled in and signed.
Statement under Section 134 (3) of the Companies Act, 2017
This statement set out the material facts concerning the special business to be transacted at the annual general meeting of the Company to be held on April 26, 2018.
Agenda Item No. 5
Visionet Systems Inc., USA is no more subsidiary of Systems Limited, therefore, the Company intends to remove the name of Visionet Systems Inc., USA from Employees Stock option Scheme, 2009.
Further, existing subsidiary of the Company TechVista Systems FZ-LLC or any upcoming subsidiary is not included in Employees Stock option Scheme, 2009, therefore, the Company intends to include existing subsidiary or any upcoming subsidiary in Employees Stock option Scheme, 2009.
This is subject to the approval of members and Securities & Exchange Commission of Pakistan.
Agenda Item No. 6
Nature of information required to be disclosed pursuant to The Companies (Investment in Associated Companies or Undertakings) Regulations, 2017, for investment in associated company M/s UUS Joint Venture (Pvt.) Limited is as follows:
Ref. No. Requirement Relevant Information
(a) Disclosures for all types of investments:-
(A) Regarding associated company or associated undertaking:-
i. name of the associated company UUS Joint Venture (Private) Limited
ii. basis of relationship 49.99 % shareholding / Common directorship
iii. earnings per share for the last three years N/A (newly incorporated company)
iv. break-up value per share, based on latest audited nancial statements;
N/A (newly incorporated company)
v. nancial position, including main items of statement of nancial position and prot and loss account on the basis of its latest nancial statements; and
N/A (newly incorporated company)
vi. in case of investment in relation to a project of associated company or associated undertaking that has not commenced operations, following further information, namely,-
N/A
(I) description of the project and its history since conceptualization;
(II) starting date and expected date of completion of work;
(III) time by which such project shall become commercially operational;
(IV) expected time by which the project shall start paying return on investment; and
(V) funds invested or to be invested by the promoters, sponsors, associated company or associated undertaking distinguishing between cash and non-cash amounts;
Ref. No. Requirement Relevant Information
N/A
(B) General Disclosures
(i) maximum amount of investment to be made; Investment to be increased from Rs. 250 million to Rs. 400 million
(ii) purpose, benets likely to accrue to the investing company and its members from such investment and period of investment;
Purpose: To meet working capital requirements of UUS Joint Venture (Private) Limited and to give guarantees to Pakistan Civil Aviation Authority.
Benet: The completion of project will results in distribution of prots by UUS Joint Venture (Pvt.) Limited to Systems Limited.
Period of Investment: The period of investment shall be one (1) year.
(iii) sources of funds to be utilized for investment and where the investment is intended to be made using borrowed funds,-
Loan shall be from own funds while guarantee shall be issued by the banker of Systems Limited.
(I) justication for investment through borrowings;
UUS Joint Venture (Private) Limited is only a special purpose vehicle for executing Pakistan Civil Aviation Authority (PCAA) project awarded to consortium of Systems Limited and Beijing UniStrong Science & Technology Co. It is Systems Limited liability to issue guarantee to (PCAA).
(II) detail of collateral, guarantees provided and assets pledged for obtaining such funds; and
Building
(III) cost benet analysis; N/A
(iv) salient features of the agreement(s), if any, with associated company or associated undertaking with regards to the proposed investment;
None. Agreement shall be executed in line with section 199 of Companies Act, 2017 and resolution of shareholders to be passed in annual general meeting.
(v) direct or indirect interest of directors, sponsors, majority shareholders and their relatives, if any, in the associated company or associated undertaking or the transaction under consideration;
Mr. Asif Peer, CEO of Systems Limited is also member and director in UUS Joint Venture (Pvt.) Limited.
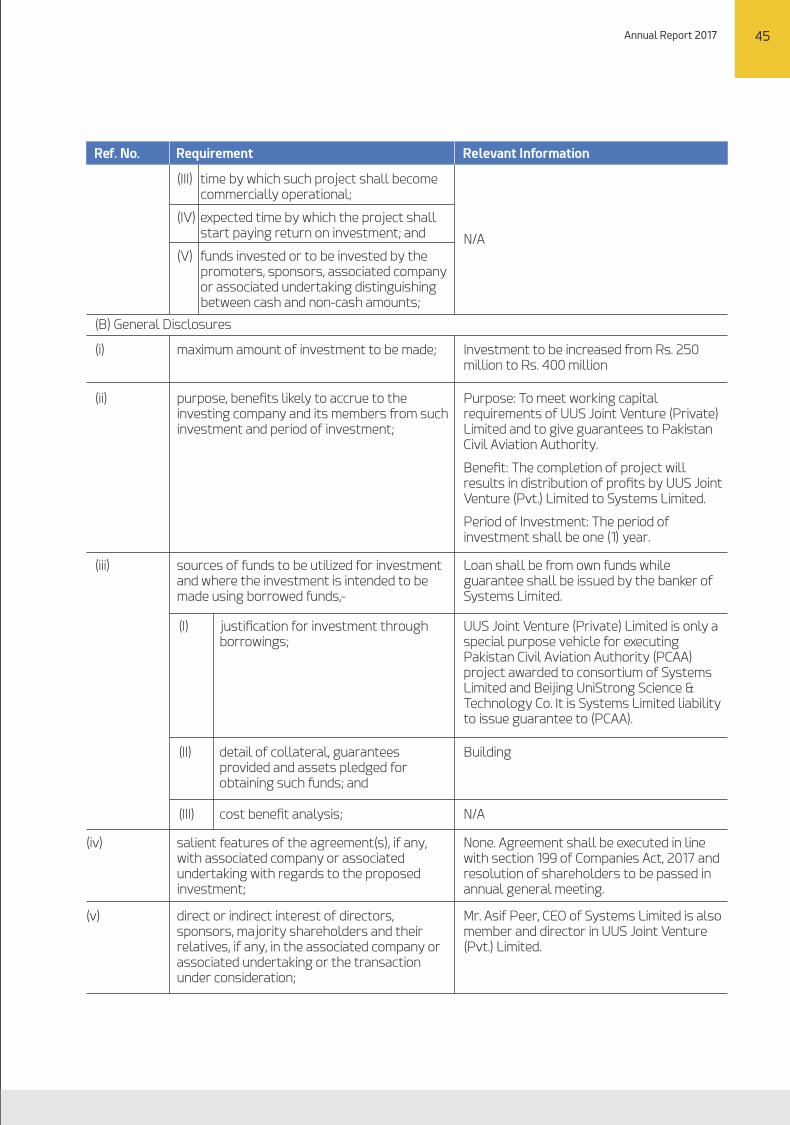
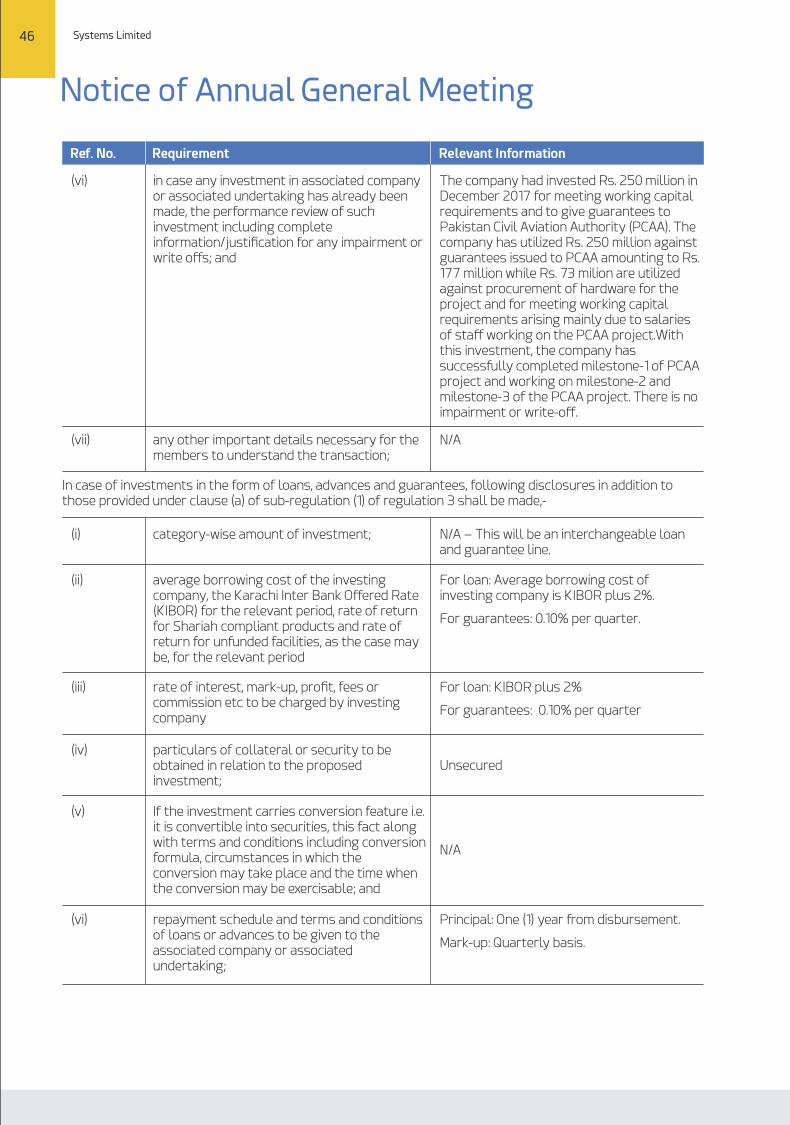
46 Systems Limited
Notice of Annual General Meeting
Annual Report 2017 47
Ref. No. Requirement Relevant Information
(vi) in case any investment in associated company or associated undertaking has already been made, the performance review of such investment including complete information/justication for any impairment or write offs; and
The company had invested Rs. 250 million in December 2017 for meeting working capital requirements and to give guarantees to Pakistan Civil Aviation Authority (PCAA). The company has utilized Rs. 250 million against guarantees issued to PCAA amounting to Rs. 177 million while Rs. 73 milion are utilized against procurement of hardware for the project and for meeting working capital requirements arising mainly due to salaries of staff working on the PCAA project.With this investment, the company has successfully completed milestone-1 of PCAA project and working on milestone-2 and milestone-3 of the PCAA project. There is no impairment or write-off.
(vii) any other important details necessary for the members to understand the transaction;
N/A
In case of investments in the form of loans, advances and guarantees, following disclosures in addition to those provided under clause (a) of sub-regulation (1) of regulation 3 shall be made,-
(i) category-wise amount of investment; N/A – This will be an interchangeable loan and guarantee line.
(ii) average borrowing cost of the investing company, the Karachi Inter Bank Offered Rate (KIBOR) for the relevant period, rate of return for Shariah compliant products and rate of return for unfunded facilities, as the case may be, for the relevant period
For loan: Average borrowing cost of investing company is KIBOR plus 2%.
For guarantees: 0.10% per quarter.
(iii) rate of interest, mark-up, prot, fees or commission etc to be charged by investing company
For loan: KIBOR plus 2%
For guarantees: 0.10% per quarter
(iv) particulars of collateral or security to be obtained in relation to the proposed investment;
Unsecured
(v) If the investment carries conversion feature i.e. it is convertible into securities, this fact along with terms and conditions including conversion formula, circumstances in which the conversion may take place and the time when the conversion may be exercisable; and
N/A
(vi) repayment schedule and terms and conditions of loans or advances to be given to the associated company or associated undertaking;
Principal: One (1) year from disbursement.
Mark-up: Quarterly basis.
Ref. No. Requirement Relevant Information
i name of the associated company E-Processing Systems (Private) Limited
Agenda Item No. 7
Nature of information required to be disclosed pursuant to The Companies (Investment in Associated Companies or Undertakings) Regulations, 2017, for investment in associated/subsidiary company M/s E-Processing Systems (Pvt.) Limited is as follows:
(a) Disclosures for all types of investments:-
(A) Regarding associated company or associated undertaking:-
ii basis of relationship 53.02% shareholding/Subsidiary/ Common directorship
iii earnings per share for the last three years 31 Dec 2017
(Rs.) (118.35)
31 Dec 2016
(Rs.)(96.01)
31 Dec 2015
(Rs.)(129.43)
iv break-up value per share, based on latest audited nancial statements;
Rs. 40.94
v nancial position, including main items of statement of nancial position and prot and loss account on the basis of its latest nancial statements; and
Statement of Financial Position – 31 December 2017
Non-current assets
Current assets
Shareholders' equity
Non-current liabilities
Current liabilities
90,235,252
72,671,217
10,810,415
-
152,096,054
Prot & Loss A/C – 31 December 2017
Revenue
Cost of revenue
Gross prot
Loss for the year
76,565,486
66,825,040
9,740,446
(25,818,402)
in case of investment in relation to a project of associated company or associated undertaking that has not commenced operations, following further information, namely,-
N/A
vi
(I) description of the project and its history since conceptualization;
(II) starting date and expected date of completion of work;
(III) time by which such project shall become commercially operational;
(IV) expected time by which the project shall start paying return on investment; and(V)funds invested or to be invested by the promoters, sponsors, associated company or associated undertaking distinguishing between cash and non-cash amounts;
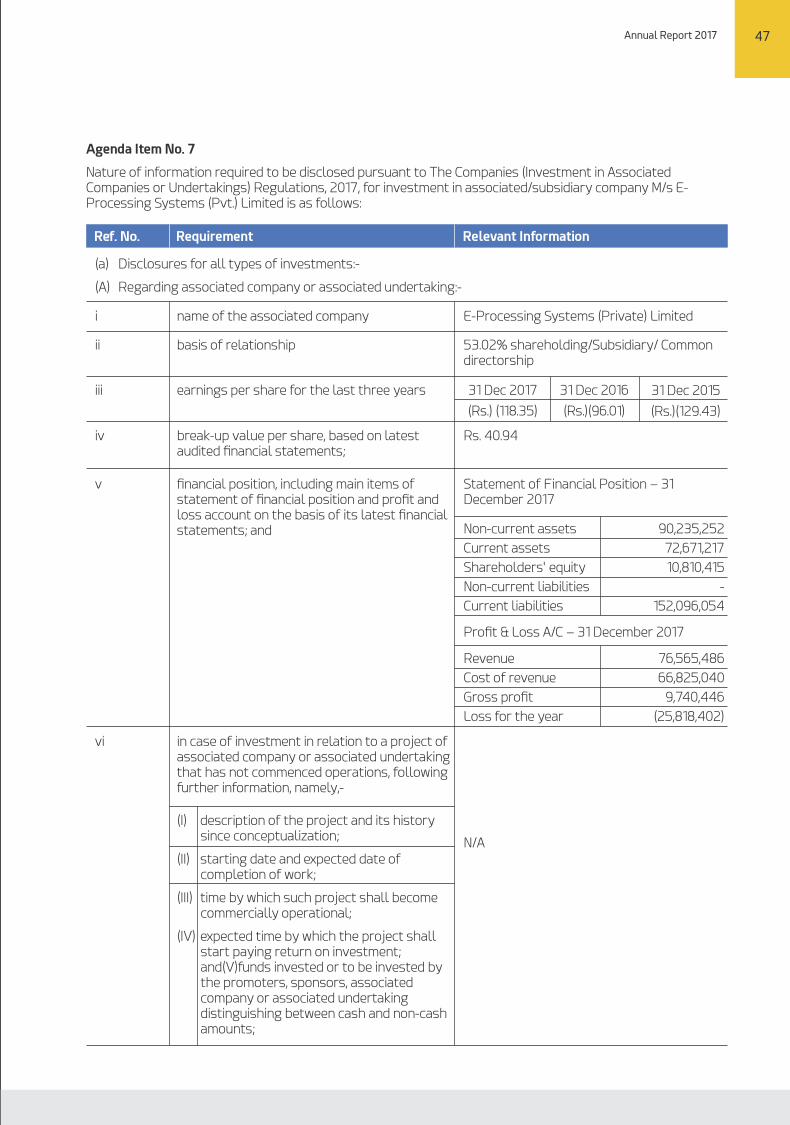
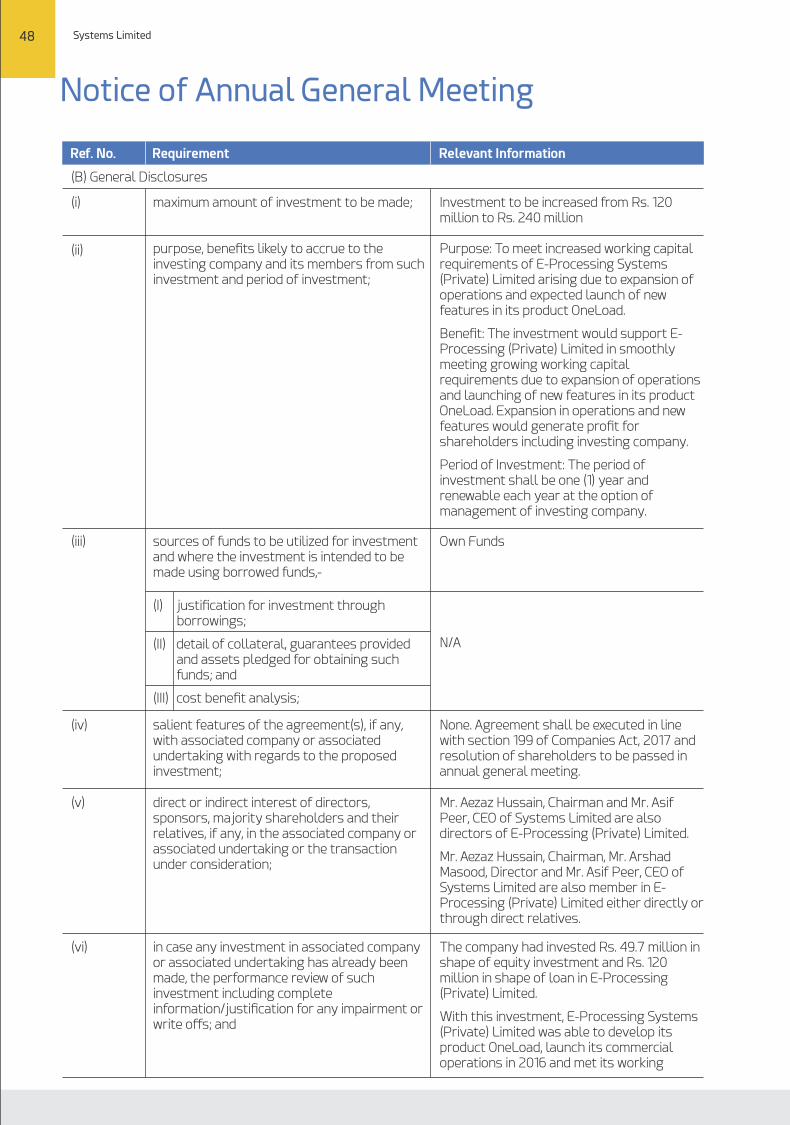
48 Systems Limited
Ref. No. Requirement Relevant Information
capital requirements. Since launch of commercial operation, E-Processing Systems (Private) Limited is able to multiply its revenues, number of transactions and number of retailers each month. Currently, OneLoad product is executing 3.6 million transactions per month while number of retailers using OneLoad product are around 10,000.
There is no impairment or write-off.
Annual Report 2017 49
Ref. No. Requirement Relevant Information
(i) maximum amount of investment to be made; Investment to be increased from Rs. 120 million to Rs. 240 million
(B) General Disclosures
N/A
(I) justication for investment through borrowings;
(II) detail of collateral, guarantees provided and assets pledged for obtaining such funds; and
(III) cost benet analysis;
Notice of Annual General Meeting
(ii) purpose, benets likely to accrue to the investing company and its members from such investment and period of investment;
Purpose: To meet increased working capital requirements of E-Processing Systems (Private) Limited arising due to expansion of operations and expected launch of new features in its product OneLoad.
Benet: The investment would support E-Processing (Private) Limited in smoothly meeting growing working capital requirements due to expansion of operations and launching of new features in its product OneLoad. Expansion in operations and new features would generate prot for shareholders including investing company.
Period of Investment: The period of investment shall be one (1) year and renewable each year at the option of management of investing company.
(iii) sources of funds to be utilized for investment and where the investment is intended to be made using borrowed funds,-
Own Funds
(iv) salient features of the agreement(s), if any, with associated company or associated undertaking with regards to the proposed investment;
None. Agreement shall be executed in line with section 199 of Companies Act, 2017 and resolution of shareholders to be passed in annual general meeting.
(v) direct or indirect interest of directors, sponsors, majority shareholders and their relatives, if any, in the associated company or associated undertaking or the transaction under consideration;
Mr. Aezaz Hussain, Chairman and Mr. Asif Peer, CEO of Systems Limited are also directors of E-Processing (Private) Limited.
Mr. Aezaz Hussain, Chairman, Mr. Arshad Masood, Director and Mr. Asif Peer, CEO of Systems Limited are also member in E-Processing (Private) Limited either directly or through direct relatives.
(vi) in case any investment in associated company or associated undertaking has already been made, the performance review of such investment including complete information/justication for any impairment or write offs; and
The company had invested Rs. 49.7 million in shape of equity investment and Rs. 120 million in shape of loan in E-Processing (Private) Limited.
With this investment, E-Processing Systems (Private) Limited was able to develop its product OneLoad, launch its commercial operations in 2016 and met its working
N/A(vii) any other important details necessary for the members to understand the transaction;
In case of investments in the form of loans, advances and guarantees, following disclosures in addition to those provided under clause (a) of sub-regulation (1) of regulation 3 shall be made,-
N/A – Single category(i) category-wise amount of investment;
Average borrowing cost of investing company is KIBOR plus 2%.
(ii) average borrowing cost of the investing company, the Karachi Inter Bank Offered Rate (KIBOR) for the relevant period, rate of return for Shariah compliant products and rate of return for unfunded facilities, as the case may be, for the relevant period
Kibor plus 2%(iii) rate of interest, mark-up, prot, fees or commission etc to be charged by investing company
Unsecured(iv) particulars of collateral or security to be obtained in relation to the proposed investment;
N/A(v) if the investment carries conversion feature i.e. it is convertible into securities, this fact along with terms and conditions including conversion formula, circumstances in which the conversion may take place and the time when the conversion may be exercisable; and
Principal: One (1) year from disbursement.
Mark-up: Quarterly basis.
(vi) repayment schedule and terms and conditions of loan or advances to be given to the associated company or associated undertaking.
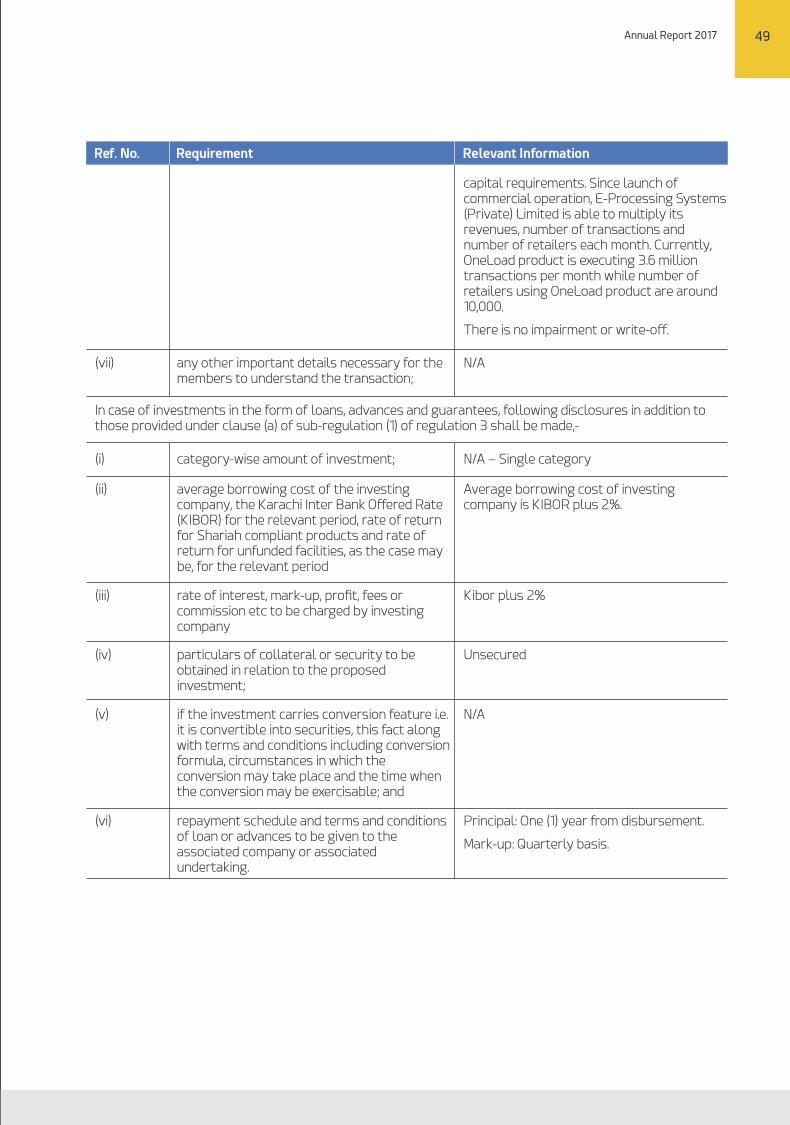
Annual Report 2017 51
50 Systems Limited
Chartered Accountants
Engagement Partner: Naseem Akbar
Date: 29 March 2017Lahore:
Review Report to the Memberson the Statement of Compliance with best Practicesof the Code of Corporate Governance
We have reviewed the Statement of Compliance with the best practices (the statement) contained in the Code of Corporate Governance prepared by the Board of Directors of Systems Limited (the Company) for the year ended 31 December 2017 to comply with the Rule Book of Pakistan Stock Exchange Limited (formerly known as Karachi, Lahore and Islamabad Stock Exchanges), where the Company is listed.
The responsibility for compliance with the Code of Corporate Governance is that of the Board of Directors of the Company. Our responsibility is to review, to the extent where such compliance can be objectively veried, whether the Statement of Compliance reects the status of the Company's compliance with the provisions of the Code of Corporate Governance and report if it does not. A review is limited primarily to inquiries of the Company personnel and review of various documents prepared by the Company to comply with the Code.
As part of our audit of nancial statements we are required to obtain an understanding of the accounting and internal control systems sufficient to plan the audit and develop an effective audit approach. We are not required to consider whether the Board's statement on internal controls covers all the risks and controls, or to form an opinion on the effectiveness of such internal controls, the Company's corporate governance procedures and risks.
The Code requires the Company to place before the Audit Committee, and upon recommendation of the Audit Committee, place before the Board of Directors for their review and approval its related party transactions distinguishing between transactions carried out on terms equivalent to those that prevail in arm's length transactions and transactions which are not executed at arm's length price and recording proper justication for using such alternate pricing mechanism. We are only required and have ensured compliance of this requirement to the extent of the approval of the related party transactions by the Board of Directors upon recommendation of the Audit Committee. We have not carried out any procedures to determine whether the related party transactions were undertaken at arm's length price or not.
Based on our review, nothing has come to our attention which causes us to believe that the Statement of Compliance does not appropriately reect the Company's compliance, in all material respects, with the best practices contained in the Code of Corporate Governance as applicable to the Company for the year ended 31 December 2017.
Statement of Compliancewith the Code of Corporate GovernanceThis statement is being presented to comply with the Code of Corporate Governance (CCG) contained in Regulation No. 35 of listing regulations of Pakistan Stock Exchange for the purpose of establishing a framework of good governance, whereby a listed company is managed in compliance with the best practices of corporate governance.
The company has applied the principles contained in the CCG in the following manner:
1. The company encourages representation of independent non-executive directors and directors representing minority interests on its board of directors. At present the board includes:
Category Names
Independent Directors Mr. Tahir Masud
Mr. Ayaz Dawood
Mr. Asif Jooma
Ms. Romana Abudllah
Executive Director Mr. Asif Peer
Non-Executive Directors Mr. Aezaz Hussain
Mr. Arshad Masood
The independent directors meets the criteria of independence under clause 5.19.1. (b) of the CCG.
2. The directors have conrmed that none of them is serving as a director on more than seven listed companies, including this company (excluding the listed subsidiaries of listed holding companies where applicable).
3. All the resident directors of the company are registered as taxpayers and none of them has defaulted in payment of any loan to a banking company, a DFI or an NBFI or, being a member of a stock exchange, has been declared as a defaulter by that stock exchange.
4. During the year no casual vacancy occurred in the Board of Directors of the Company.
5. The company has prepared a “Code of Conduct” and has ensured that appropriate steps have been taken to disseminate it throughout the company along with its supporting policies and procedures.
6. The board has developed a vision/mission statement, overall corporate strategy and signicant policies of the company. A complete record of particulars of signicant policies along with the dates on which they were approved or amended has been maintained.
7. All the powers of the board have been duly exercised and decisions on material transactions, including appointment and determination of remuneration and terms and conditions of employment of the CEO, other executive and non-executive directors, have been taken by the board.
8. The meetings of the board were presided over by the Chairman and, in his absence, by a director elected by the board for this purpose and the board met at least once in every quarter. Written notices of the board meetings, along with agenda and working papers, were circulated at least seven days before the meetings. The minutes of the meetings were appropriately recorded and circulated.
9. The Board of directors are aware of their duties and responsibilities regarding corporate Laws and four directors have already completed director training program.
10. The Board has approved the appointment of Mr. Muhammad Khurram Iqbal as Company Secretary/CFO and Muhammad Qasim Siddiqui as head of Internal Audit, including their remuneration and terms and conditions of employment.
11. The directors' report for this year has been prepared in compliance with the requirements of the CCG and fully describes the salient matters required to be disclosed.
12. The nancial statements of the company were duly endorsed by CEO and CFO before approval of the board.
13. The directors, CEO and executives do not hold any interest in the shares of the company other than that disclosed in the pattern of shareholding.
14. The company has complied with all the corporate and nancial reporting requirements of the CCG.
15. The board has formed an Audit Committee. It comprises three members, of whom all are independent directors including chairman of the committee.
16. The meetings of the audit committee were held at least once every quarter prior to approval of interim and nal results of the company and as required by the CCG. The terms of reference of the committee have been formed and advised to the committee for compliance.
17. The board has formed Human Resource and Compensation Committee. It comprises three members, of whom all are independent directors including chairman of the committee.
18. The board has outsourced the internal audit function to Uzair Hammad Faisal & Co. Chartered Accountants, which are considered suitably qualied and experienced for the purpose and are conversant with the policies and procedures of the company. Further, as required under clause xxxi of Code of Corporate Governance, the company has also appointed a full time employee other than CFO as Head of Internal Audit to act as coordinator between rm providing internal audit services and the Board.
19. The statutory auditors of the company have conrmed that they have been given a satisfactory rating under the quality control review program of the ICAP, that they or any of the partners of the rm, their spouses and minor children do not hold shares of the company and that the rm and all its partners are in compliance with International Federation of Accountants (IFAC) guidelines on code of ethics as adopted by the ICAP.
20. The statutory auditors or the persons associated with them have not been appointed to provide other services except in accordance with the listing regulations and the auditors have conrmed that they have observed IFAC guidelines in this regard.
21. The 'closed period', prior to the announcement of interim/nal results, and business decisions, which may materially affect the market price of company's securities, was determined and intimated to directors, employees and stock exchange(s).
22. Material/price sensitive information has been disseminated among all market participants at once through stock exchange(s).
23. The Company has complied with the requirements relating to maintenance of register of persons having access to inside information by designated senior management officer in a timely manner and maintained proper record including basis for inclusion or exclusion of names of persons from the said list.
24. We conrm that all other material principles enshrined in the CCG have been complied with.
On behalf of the Board
Asif PeerChief Executive Officer
Date: 26 March 2018Lahore
52 Systems Limited
Systems LimitedStandalone Financial Statements
54 Systems Limited
Auditors’ Report to the Members
Annual Report 2017 55
Balance Sheetas at 31 December 2017
2017 2016
ASSETS
Note RupeesRupees
Non-current assets
Property and equipment 5 884,773,411
Intangibles 6 60,306,397
Long term investments 7 51,077,980
Long term deposits 17,336,739
Deferred taxation - net 8 31,771,724
1,045,266,251
Current assets
Unbilled revenue 9 388,018,078
Trade debts 10 1,140,871,164
Loans and advances 11 143,600,657
Trade deposits and short term prepayments 12 103,870,280
Interest accrued 13,486,671
Other receivables 13 183,663,700
Short term investments 14 225,000,000
Tax refunds due from the Government 15 142,084,484
Cash and bank balances 16 444,255,392
2,784,850,426
TOTAL ASSETS 3,830,116,677
EQUITY AND LIABILITIES
Share capital and reserves
Authorized share capital
200,000,000 (2016: 150,000,000) ordinary shares of Rs. 10/- each 2,000,000,000
Issued, subscribed and paid up capital 17 1,118,276,520
Capital reserves 18 483,032,576
Unappropriated prot 1,609,869,061
3,211,178,157
Non-current liabilities
Long term advances 19 12,218,784
Current liabilities
Trade and other payables 20 333,485,673
Unearned revenue 21 65,532,595
Mark-up accrued on short term borrowings 2,795,246
Short term borrowings 22 200,000,000
Current portion of long term advances 4,906,222
606,719,736
TOTAL EQUITY AND LIABILITIES 3,830,116,677
557,598,452
51,467,435
51,077,980
6,130,852
25,276,863
691,551,582
320,894,130
1,297,360,241
107,710,905
59,561,630
11,863,416
150,365,370
253,000,000
98,958,341
183,200,188
2,482,914,221
3,174,465,803
1,500,000,000
1,110,784,920
461,091,227
1,344,492,456
2,916,368,603
10,910,791
226,689,126
14,387,586 - -
6,109,697
247,186,409
3,174,465,803
CONTINGENCIES AND COMMITMENTS 23
The annexed notes from 1 to 43 form an integral part of these nancial statements.
We have audited the annexed balance sheet of Systems Limited (“the Company”) as at 31 December 2017 and the related prot and loss account, cash ow statement, statement of comprehensive income and statement of changes in equity together with the notes forming part thereof, for the year then ended and we state that we have obtained all the information and explanations which, to the best of our knowledge and belief, were necessary for the purposes of our audit.
It is the responsibility of the Company's management to establish and maintain a system of internal control and prepare and present the above said statements in conformity with the approved accounting standards and the requirements of Companies Ordinance, 1984. Our responsibility is to express an opinion on these statements based on our audit.
We conducted our audit in accordance with the auditing standards as applicable in Pakistan. These standards require that we plan and perform the audit to obtain reasonable assurance about whether the above said statements are free of any material misstatement. An audit includes examining on a test basis, evidence supporting the amounts and disclosures in the above said statements. An audit also includes assessing the accounting policies and signicant estimates made by the management, as well as, evaluating the overall presentation of the above said statements. We believe that our audit provides a reasonable basis for our opinion and, after due verication, we report that:
a) in our opinion, proper books of accounts have been kept by the company as required by the Companies Ordinance, 1984;
b) in our opinion:
i) the balance sheet and prot and loss account together with the notes thereon have been drawn up in conformity with the Companies Ordinance, 1984, and are in agreement with the books of account and are further in accordance with accounting policies consistently applied, except for the changes as stated in Note 4.1 with which we concur;
ii) the expenditure incurred during the year was for the purpose of the company's business; and
iii) the business conducted, investments made and the expenditure incurred during the year were in accordance with the objects of the Company;
c) in our opinion and to the best of our information and according to the explanations given to us, the balance sheet, prot and loss account, cash ow statement, statement of comprehensive income and statement of changes in equity together with the notes forming part thereof conform with approved accounting standards as applicable in Pakistan, and give the information required by the Companies Ordinance, 1984 in the manner so required and respectively give a true and fair view of the state of the Company's affairs as at 31 December 2017 and of the prot, comprehensive income, its cash ows and changes in equity for the year then ended; and
d) in our opinion, Zakat deductible at source under the Zakat and Ushr Ordinance, 1980 (XVIII of 1980), was deducted by the Company and deposited in the Central Zakat Fund established under section 7 of that Ordinance.
Chartered Accountants
Engagement Partner: Naseem Akbar
Date: 29 March 2018Lahore
CHIEF EXECUTIVE OFFICER CHIEF FINANCIAL OFFICERCHAIRMAN
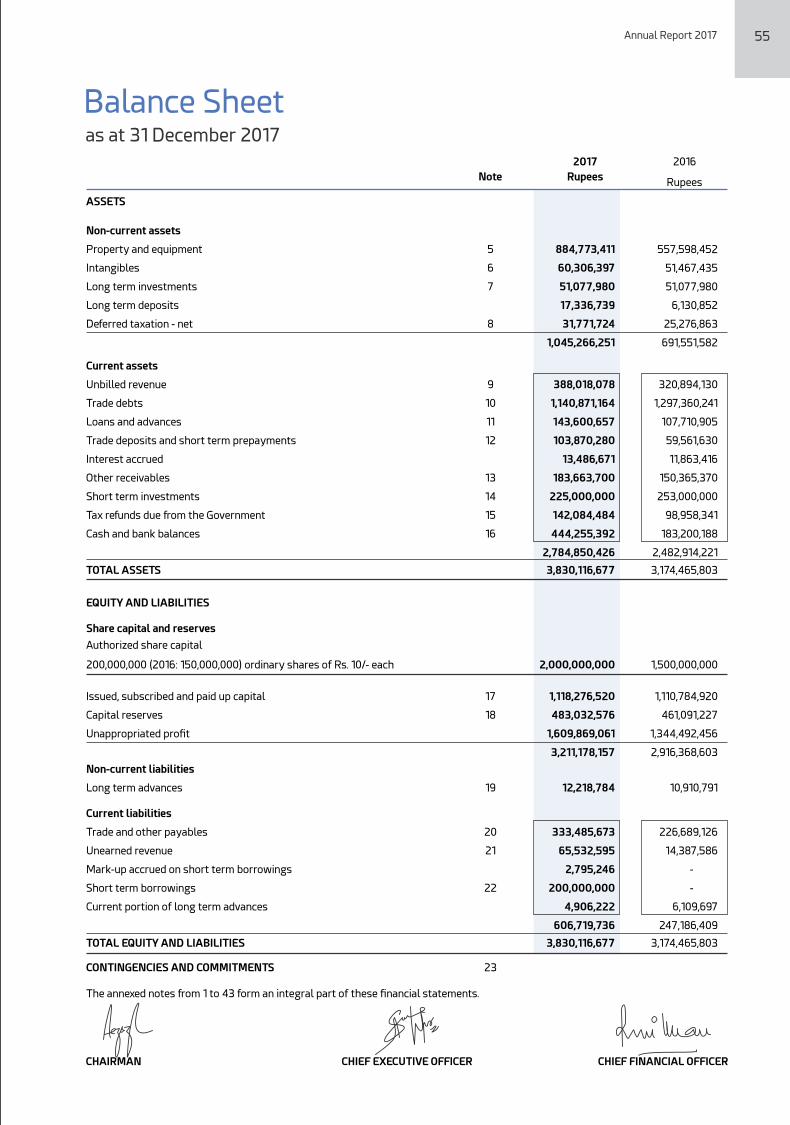
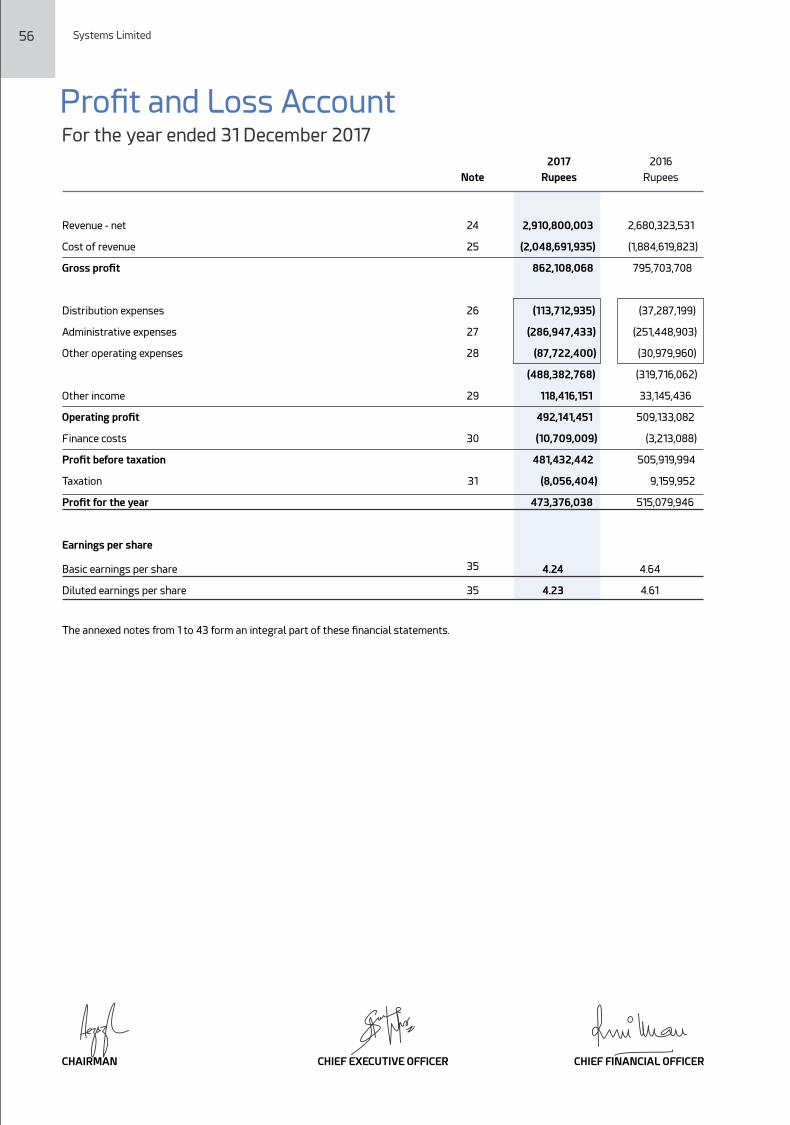
56 Systems Limited Annual Report 2017 57
Statement of Comprehensive IncomeProt and Loss AccountFor the year ended 31 December 2017
Revenue - net 24 2,910,800,003 2,680,323,531
Cost of revenue 25 (2,048,691,935) (1,884,619,823)
Gross prot 862,108,068 795,703,708
Distribution expenses 26 (113,712,935) (37,287,199)
Administrative expenses 27 (286,947,433) (251,448,903)
Other operating expenses 28 (87,722,400) (30,979,960)
(488,382,768) (319,716,062)
Other income 29 118,416,151 33,145,436
Operating prot 492,141,451 509,133,082
Finance costs 30 (10,709,009) (3,213,088)
Prot before taxation 481,432,442 505,919,994
Taxation 31 (8,056,404) 9,159,952
Prot for the year 473,376,038 515,079,946
Earnings per share
Basic earnings per share 35 4.24 4.64
Diluted earnings per share 35 4.23 4.61
The annexed notes from 1 to 43 form an integral part of these nancial statements.
2017 2016
Note Rupees Rupees
Prot for the year
Other comprehensive income not to be reclassied to prot or loss in
subsequent periods:
Other comprehensive income to be reclassied to prot or loss in
subsequent periods:
Total comprehensive income for the year
473,376,038
-
-
473,376,038
515,079,946
-
-
515,079,946
The annexed notes from 1 to 43 form an integral part of these nancial statements.
2017 2016
Rupees Rupees
For the year ended 31 December 2017
CHIEF EXECUTIVE OFFICER CHIEF FINANCIAL OFFICERCHAIRMANCHIEF EXECUTIVE OFFICER CHIEF FINANCIAL OFFICERCHAIRMAN
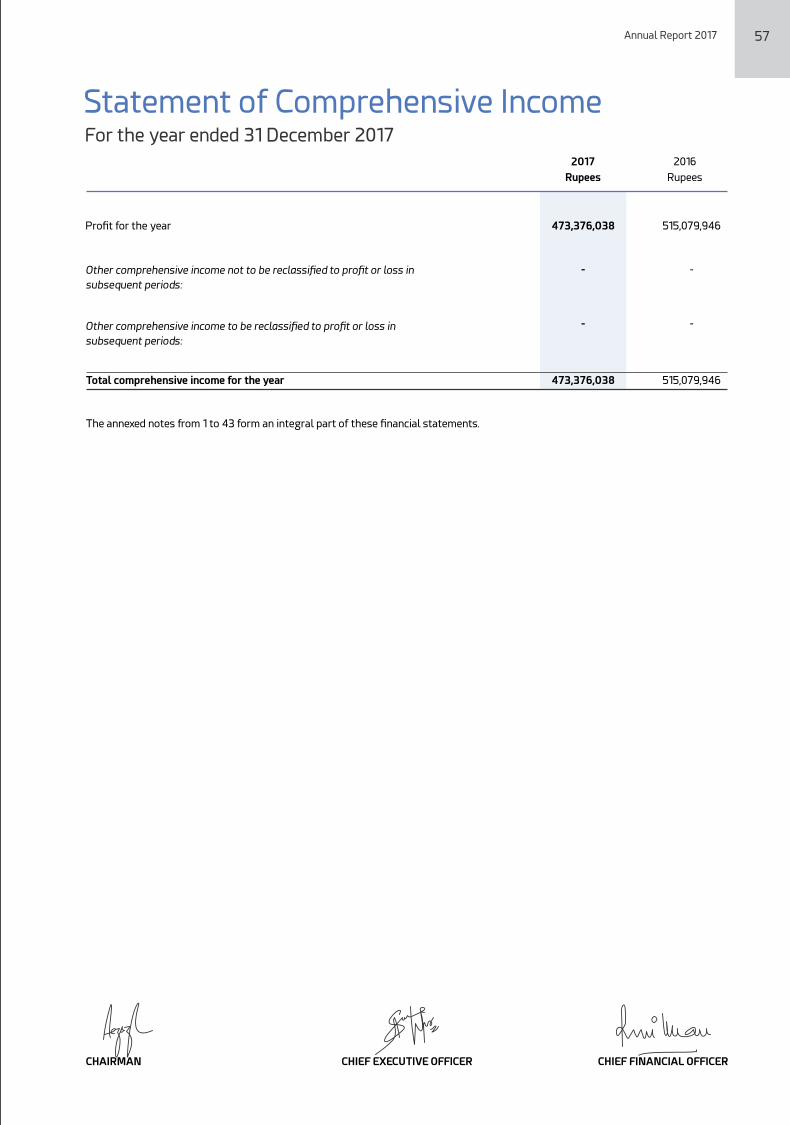
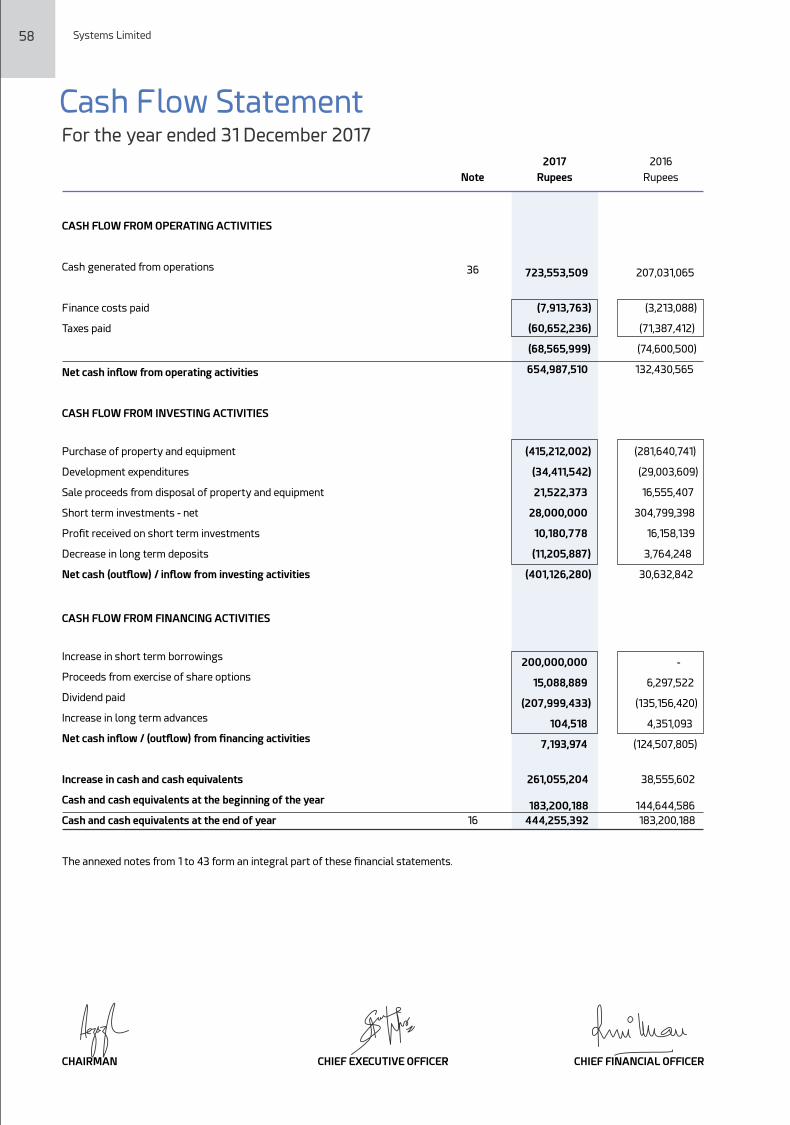
58 Systems Limited Annual Report 2017 59
Statement of Changes in EquityCash Flow StatementFor the year ended 31 December 2017
CASH FLOW FROM OPERATING ACTIVITIES
Cash generated from operations 36
Finance costs paid
Taxes paid
Net cash inow from operating activities
CASH FLOW FROM INVESTING ACTIVITIES
Purchase of property and equipment
Development expenditures
Sale proceeds from disposal of property and equipment
Short term investments - net
Prot received on short term investments
Decrease in long term deposits
Net cash (outow) / inow from investing activities
CASH FLOW FROM FINANCING ACTIVITIES
Increase in short term borrowings
Proceeds from exercise of share options
Dividend paid
Increase in long term advances
Net cash inow / (outow) from nancing activities
Increase in cash and cash equivalents
Cash and cash equivalents at the beginning of the year
Cash and cash equivalents at the end of year 16
723,553,509
(7,913,763)
(60,652,236)
(68,565,999)
654,987,510
(415,212,002)
(34,411,542)
21,522,373
28,000,000
10,180,778
(11,205,887)
(401,126,280)
200,000,000
15,088,889
(207,999,433)
104,518
7,193,974
261,055,204
183,200,188
444,255,392
207,031,065
(3,213,088)
(71,387,412)
(74,600,500)
132,430,565
(281,640,741)
(29,003,609)
16,555,407
304,799,398
16,158,139
3,764,248
30,632,842
-
6,297,522
(135,156,420)
4,351,093
(124,507,805)
38,555,602
144,644,586
183,200,188
The annexed notes from 1 to 43 form an integral part of these nancial statements.
2017 2016
Note Rupees Rupees
For the year ended 31 December 2017
1,106,808,760
-
3,976,160
-
-
3,976,160
1,110,784,920
-
7,491,600
-
7,491,600
1,118,276,520
Issued, subscribed
and paid up
capital
-
Rupees
2,495,627,437
515,079,946
6,297,522
38,211,812
(138,848,114)
(94,338,780)
2,916,368,603
473,376,038
15,088,889
14,344,060
(178,566,484)
3,211,178,157
Rupees
(207,999,433)
Total equity
Un-approp-
riated prot
968,260,624
515,079,946
-
-
(138,848,114)
(138,848,114)
1,344,492,456
473,376,038
-
-
(207,999,433)
1,609,869,061
Revenue
reserve
(207,999,433)
Rupees
Capital reserves
Employee
compensation
reserve
9,255,467
-
(9,000,000)
38,211,812
-
29,211,812
38,467,279
-
(43,068,402)
14,344,060
(28,724,342)
9,742,937
-
Rupees
Share
premium
411,302,586
-
11,321,362
-
-
11,321,362
422,623,948
-
50,665,691
-
50,665,691
473,289,639
-
Rupees
Balance as on 01 January 2016
Total comprehensive income for the year
Transactions with owners
Exercise of share options
Share based payments
Balance as on 31 December 2016
Total comprehensive income for the year
Transactions with owners
Exercise of share options
Share based payments
Balance as at 31 December 2017
The annexed notes from 1 to 43 form an integral part of these nancial statements.
Final dividend for the year ended 31 December 2016
at the rate of Rs. 1.86 per share
Final dividend for the year ended 31 December 2015
at the rate of Rs. 1.25 per share
CHIEF EXECUTIVE OFFICER CHIEF FINANCIAL OFFICERCHAIRMANCHIEF EXECUTIVE OFFICER CHIEF FINANCIAL OFFICERCHAIRMAN
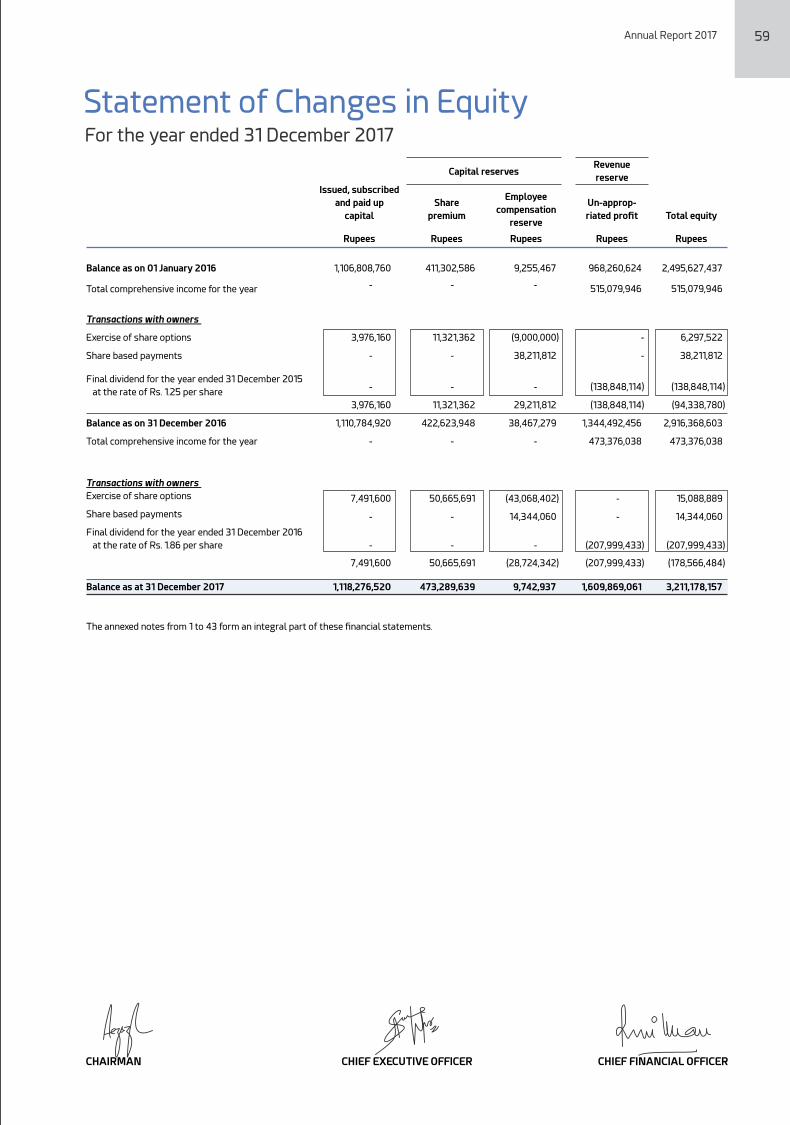
58 Systems Limited Annual Report 2017 59
Statement of Changes in EquityCash Flow StatementFor the year ended 31 December 2017
CASH FLOW FROM OPERATING ACTIVITIES
Cash generated from operations 36
Finance costs paid
Taxes paid
Net cash inow from operating activities
CASH FLOW FROM INVESTING ACTIVITIES
Purchase of property and equipment
Development expenditures
Sale proceeds from disposal of property and equipment
Short term investments - net
Prot received on short term investments
Decrease in long term deposits
Net cash (outow) / inow from investing activities
CASH FLOW FROM FINANCING ACTIVITIES
Increase in short term borrowings
Proceeds from exercise of share options
Dividend paid
Increase in long term advances
Net cash inow / (outow) from nancing activities
Increase in cash and cash equivalents
Cash and cash equivalents at the beginning of the year
Cash and cash equivalents at the end of year 16
723,553,509
(7,913,763)
(60,652,236)
(68,565,999)
654,987,510
(415,212,002)
(34,411,542)
21,522,373
28,000,000
10,180,778
(11,205,887)
(401,126,280)
200,000,000
15,088,889
(207,999,433)
104,518
7,193,974
261,055,204
183,200,188
444,255,392
207,031,065
(3,213,088)
(71,387,412)
(74,600,500)
132,430,565
(281,640,741)
(29,003,609)
16,555,407
304,799,398
16,158,139
3,764,248
30,632,842
-
6,297,522
(135,156,420)
4,351,093
(124,507,805)
38,555,602
144,644,586
183,200,188
The annexed notes from 1 to 43 form an integral part of these nancial statements.
2017 2016
Note Rupees Rupees
For the year ended 31 December 2017
1,106,808,760
-
3,976,160
-
-
3,976,160
1,110,784,920
-
7,491,600
-
7,491,600
1,118,276,520
Issued, subscribed
and paid up
capital
-
Rupees
2,495,627,437
515,079,946
6,297,522
38,211,812
(138,848,114)
(94,338,780)
2,916,368,603
473,376,038
15,088,889
14,344,060
(178,566,484)
3,211,178,157
Rupees
(207,999,433)
Total equity
Un-approp-
riated prot
968,260,624
515,079,946
-
-
(138,848,114)
(138,848,114)
1,344,492,456
473,376,038
-
-
(207,999,433)
1,609,869,061
Revenue
reserve
(207,999,433)
Rupees
Capital reserves
Employee
compensation
reserve
9,255,467
-
(9,000,000)
38,211,812
-
29,211,812
38,467,279
-
(43,068,402)
14,344,060
(28,724,342)
9,742,937
-
Rupees
Share
premium
411,302,586
-
11,321,362
-
-
11,321,362
422,623,948
-
50,665,691
-
50,665,691
473,289,639
-
Rupees
Balance as on 01 January 2016
Total comprehensive income for the year
Transactions with owners
Exercise of share options
Share based payments
Balance as on 31 December 2016
Total comprehensive income for the year
Transactions with owners
Exercise of share options
Share based payments
Balance as at 31 December 2017
The annexed notes from 1 to 43 form an integral part of these nancial statements.
Final dividend for the year ended 31 December 2016
at the rate of Rs. 1.86 per share
Final dividend for the year ended 31 December 2015
at the rate of Rs. 1.25 per share
CHIEF EXECUTIVE OFFICER CHIEF FINANCIAL OFFICERCHAIRMANCHIEF EXECUTIVE OFFICER CHIEF FINANCIAL OFFICERCHAIRMAN
60 Systems Limited Annual Report 2017 61
Notes to the Financial StatementsFor the year ended 31 December 2017
1. LEGAL STATUS AND NATURE OF BUSINESS
The Company is a public limited Company incorporated in Pakistan under the repealed Companies Ordinance 1984, (now Companies Act 2017) and is listed on the Pakistan Stock Exchange. The Company is principally engaged in the business of software development, trading of software and business process outsourcing services. The head office of the Company is situated at E-1, Sehjpal, Near DHA Phase-VIII (Ex-Air Avenue), Lahore Cantt.
These nancial statements are the separate nancial statements of the Company, in which investments in the subsidiary companies namely E-Processing Systems (Private) Limited and TechVista Systems FZ LLC, have been accounted for at cost less accumulated impairment losses, if any.
2. STATEMENT OF COMPLIANCE
During the year Companies Act 2017 (the Act) has been promulgated, however, Securities and Exchange Commission of Pakistan vide its circular no. 23 of 2017 dated 04 October 2017 communicated that the companies whose nancial year closes on or before 31 December 2017 shall prepare their nancial statements in accordance with the provisions of the repealed Companies Ordinance, 1984.
Hence, these nancial statements have been prepared in accordance with approved accounting standards as applicable in Pakistan and the requirements of repealed Companies Ordinance, 1984. Approved accounting standards comprise of such International Financial Reporting Standards (IFRSs) issued by the International Accounting Standards Board (IASB) as are notied under the provisions of the repealed Companies Ordinance, 1984. Wherever, the requirements of the repealed Companies Ordinance, 1984 or directives issued by the Securities and Exchange Commission of Pakistan (SECP) differ with the requirements of these standards, the requirements of repealed Companies Ordinance, 1984 or the requirements of the said directives shall prevail.
3. BASIS OF MEASUREMENT
3.1 Basis of preparation
These nancial statements have been prepared under the historical cost convention.
3.2 Functional and presentation currency
Items included in the nancial statements are measured using the currency of the primary economic environment in which the Company operates. The nancial statements are presented in Pak Rupees, which is the Company’s functional and presentation currency.
3.3 Use of estimates and judgments
The Company's signicant accounting policies are stated in note 4. Not all of these signicant policies require the management to make difficult, subjective or complex judgments or estimates. The following is intended to provide an understanding of the policies the management considers critical because of their complexity, judgment of estimation involved in their application and their impact on these nancial statements. Estimates and judgments are continually evaluated and are based on historical experience, including expectation of future events that are believed to be reasonable under the circumstances. These judgments involve assumptions or estimates in respect of future events and the actual results may differ from these estimates. The areas involving higher degree of judgments or complexity or areas where assumptions and estimates are signicant to the nancial statements are as follows:
3.3.1 Provision for taxation (note 4.2)
The Company takes into account the current income tax law and the decisions taken by appellate authorities. Instances where the Company's view differs from the view taken by the income tax department at the assessment stage and where the Company considers that its views on items of material nature are in accordance with law, the amounts are shown as contingent liabilities.
3.3.2 Useful life and residual values of property and equipment (note 4.3)
The Company reviews the useful lives of property and equipment on a regular basis. Any change in estimates in future years might affect the carrying amounts of respective items of property and equipment with a corresponding effect on the depreciation charge and impairment.
At the end of this nancial year, the Company reviews the useful life of the property and equipment on the basis of which useful lives of certain class of assets have been revised as mentioned in note 5. The effect of this revision for current year is amounting to Rs. 2.6 million, however, amount of the effect in future periods is impracticable to estimate.
3.3.3 Provision for doubtful debts (note 4.9.1)
The Company regularly reviews its receivables for impairment, if any. The provision in this regard is made, based on management's estimate, where the prospects of recovery are doubtful.
3.3.4 Stage of completion (note 4.12)
The Company determines stage of completion on the basis of services performed to date as a percentage of total services to be performed.
3.3.5 Provisions (note 4.11)
A provision is recognized in the balance sheet when the Company has a legal or constructive obligation as a result of a past event, and it is probable that an outow of economic benets will be required to settle the obligation and a reliable estimate can be made of the amount of obligation. The amount recognized as a provision reects the best estimate of the expenditure required to settle the present obligation at the end of the reporting period.
4. SIGNIFICANT ACCOUNTING POLICIES
The signicant accounting policies which have been adopted in the preparation of nancial statements of the Company are consistent with previous year except as described in Note 4.1, below:
4.1 New, amended standards and interpretations which became effective
The Company has adopted the following accounting standard and the amendments and interpretation of IFRSs which became effective for the current year:
IAS 7 Statement of Cash Flows - Disclosure Initiative - (Amendment)
IAS 12 Income Taxes – Recognition of Deferred Tax Assets for Unrealized losses (Amendments)
Improvements to Accounting Standards Issued by the IASB in September 2014
IFRS 12 Disclosure of Interests in Other Entities - Clarication of the scope of the disclosure requirements in IFRS 12
The adoption of the above amendments, improvements to accounting standards and interpretations did not have any material effect on the nancial statements.
4.1.1 Interests in joint operations
A joint operation is a joint arrangement whereby the parties that have joint control of the arrangement have rights to the assets, and obligations for the liabilities, relating to the arrangement. Joint control is the contractually agreed sharing of control of an arrangement, which exists only when decisions about the relevant activities require unanimous consent of the parties sharing control.
When the Company undertakes its activities under joint operations, the Company as a joint operator recognizes in relation to its interest in a joint operation:
Its assets, including its share of any assets held jointly;
Its liabilities, including its share of any liabilities incurred jointly;
Its revenue from the sale of its share of the output arising from the joint operation;
Its share of the revenue from the sale of the output by the joint operation; and
Its expenses, including its share of any expenses incurred jointly
The Company accounts for the assets, liabilities, revenues and expenses relating to its interest in a joint operation in accordance with the IFRSs applicable to the particular assets, liabilities, revenues and expenses.
When Company transacts with a joint operation in which a Company is a joint operator, the Company is considered to be conducting the transaction with the other parties to the joint operation, and gains and losses resulting from the transactions are recognized in the Company's standalone nancial statements only to the extent of other parties' interests in the joint operation.
When Company transacts with a joint operation in which Company is a joint operator, the Company does not recognize its share of the gains and losses until it resells those assets to a third party.
The Company has interest in joint operation UUS Joint Venture (Private) Limited, a Company set up specically for executing multi-year contract “Package 04A – Airport Information Management System (AIMS)”, a turnkey project for New Islamabad International Airport by Pakistan Civil Aviation Authority.
4.2 Taxation
4.2.1 Current
Provision for current tax is based on the taxable income for the year determined in accordance with the prevailing law for taxation of income. The charge for current tax is calculated using prevailing tax rates or tax rates expected to apply to the prot for the year, if enacted. The charge for current tax also includes adjustments, where considered necessary, to provision for taxation made in previous years arising from assessments framed during the year for such years.
62 Systems Limited Annual Report 2017 63
4.2.2 Deferred
Deferred tax is accounted for using the balance sheet liability method in respect of all temporary differences arising from differences between the carrying amount of assets and liabilities in the nancial statements and the corresponding tax bases used in the computation of the taxable prot. Deferred tax liabilities are generally recognized for all taxable temporary differences and deferred tax assets are recognized to the extent that it is probable that taxable prots will be available against which the deductible temporary differences, unused tax losses and tax credits can be utilized.
Deferred tax is calculated at the rates that are expected to apply to the year when the differences reverse based on tax rates that have been enacted or substantively enacted by the balance sheet date. Deferred tax is charged or credited in the prot and loss account, except in the case of items credited or charged to other comprehensive income in which case it is included in other comprehensive income.
4.3 Property and equipment
4.3.1 Operating xed assets
Property and equipment are stated at cost less accumulated depreciation and any identied impairment loss except for freehold land which is stated at historic cost. Cost of operating xed assets consist of purchase cost, borrowing cost pertaining to construction period and directly attributable cost of bringing the asset to working condition. Subsequent costs are included in the assets carrying amount or recognized as separate asset, as appropriate, only when it is probable that future economic benets associated with the item will ow to the Company and the cost of the item can be measured reliably. All other repair and maintenance costs are charged to prot and loss account during the period in which they are incurred.
Depreciation on property and equipment is charged to income by applying straight line method on pro rata basis so as to write off the historical cost of the assets over their estimated useful lives at the rates given in Note 5. Depreciation charge commences from the month in which the asset is available for use and continues until the month of disposal.
The assets residual values and useful lives are reviewed at each nancial year end, and adjusted if impact on depreciation is signicant.
An item of property and equipment is derecognized upon disposal or when no future economic benets are expected from its use or disposal. Prot or loss on disposal of operating xed assets represented by the difference between the sale proceeds and the carrying amount of the asset is included in income.
4.3.2 Capital work-in-progress
Capital work in progress represents expenditure on property and equipment which are in the course of construction and installation. Transfers are made to relevant property and equipment category as and when assets are available for use.
Capital work-in-progress is stated at cost less identied impairment loss, if any.
4.4 Intangibles
Intangible assets acquired from the market are carried at cost less accumulated amortization and any impairment losses.
Expenditure on research (or the research phase of an internal project) is recognized as an expense in the period in which it is incurred;
Development costs incurred on specic projects are capitalized when all the following conditions are satised:
- Completion of the intangible asset is technically feasible so that it will be available for use or sale.
- The Company intends to complete the intangible asset and use or sell it.
- The Company has the ability to use or sell the intangible asset.
- Intangible asset will generate probable future economic benets.
- The availability of adequate technical, nancial and other resources to complete the development and to use or sell the intangible asset.
- The Company's ability to measure reliably the expenditure attributable to the intangible asset during its development.
The cost of an internally generated intangible asset comprises all directly attributable costs necessary to create, produce and prepare the asset to be capable of operating in the manner intended by the management, Development costs not meeting the criteria for capitalization are expensed as incurred.
After initial recognition, internally generated intangible assets are carried at cost less accumulated amortization and impairment losses, if any. These are amortized using straight line method at the rate given in note 6. Full month amortization on additions is charged in the month of acquisition and no amortization is charged in month of disposal.
The Company assesses at each balance sheet date whether there is any indication that intangible assets may be impaired. If such indication exists, the carrying amounts of such assets are reviewed to assess whether they are recorded in excess of their recoverable amount. Where carrying amounts exceed the respective recoverable amount, assets are written down to their recoverable amounts and the resulting impairment loss is recognized in prot and loss account. The recoverable amount is the higher of an asset’s fair value less costs to sell and value in use. Where an impairment loss is recognized, the amortization charge is adjusted in the future periods to allocate the asset’s revised carrying amount over its estimated useful life.
4.5 Impairment
4.5.1 Financial assets including receivables
Financial assets are assessed at each reporting date to determine whether there is objective evidence that they are impaired. A nancial asset is impaired if objective evidence indicates that a loss event has occurred after the initial recognition of the asset and that the loss event had a negative effect on the estimated future cash ows of that asset that can be estimated reliably. Objective evidence that nancial assets are impaired may include default or delinquency by a debtor indications that a debtor or issuer will enter bankruptcy. All individually signicant receivables are assessed for specic impairment. All individually signicant receivables found not to be specically impaired are then collectively assessed for any impairment that has been incurred but not yet identied. Receivables that are not individually signicant are collectively assessed for impairment by grouping together receivables with similar risk characteristics.
An impairment loss in respect of a nancial asset measured at amortized cost is calculated as the difference between its carrying amount and the present value of the estimated future cash ows discounted at the asset's original effective interest rate. Losses are recognized in prot and loss and reected in an allowance account against receivables.
4.5.2 Non-nancial assets
The carrying amounts of non-nancial assets other than inventories and deferred tax asset, are reviewed at each reporting date to determine whether there is any indication of impairment. If any such indication exists, then the asset's recoverable amount is estimated. The recoverable amount of an asset or cash-generating unit is the greater of its value in use and its fair value less costs to sell. In assessing value in use, the estimated future cash ows are discounted to their present value using a pre-tax discount rate that reects current market assessment of the time value of money and the risks specic to the asset. For the purpose of impairment testing, assets that cannot be tested individually are grouped together into the smallest group of assets that generates cash inows from continuing use that are largely independent of the cash inows of other assets or groups of assets (the “cash generating unit, or CGU”).
The Company's corporate assets do not generate separate cash inows. If there is an indication that a corporate asset may be impaired, then the recoverable amount is determined for the CGU to which the corporate asset belongs. An impairment loss is recognized if the carrying amount of an asset or its CGU exceeds its estimated recoverable amount. Impairment losses are recognized in prot and loss account.
Impairment loss recognized in prior periods is assessed at each reporting date for any indications that the loss has decreased or no longer exists. An impairment loss is reversed if there has been a change in the estimates used to determine the recoverable amount. An impairment loss is reversed only to the extent that the asset's carrying amount does not exceed the carrying amount that would have been determined, net of depreciation or amortization, if no impairment loss had been recognized.
4.6 Staff benets
The Company has the following plans for its employees:
4.6.1 Provident fund
The Company operates a funded recognized provident fund contribution plan which covers all permanent employees. Equal contributions are made on monthly basis both by the Company and the employees at 10% of basic pay.
4.6.2 Employees' share option scheme
The Company operates an equity settled share based Employees Stock Option Scheme. The compensation committee of the Board of Directors of the Company evaluates the performance and other criteria of employees and approves the grant of options. These options vest with employees over a specied period subject to fulllment of certain conditions. Upon vesting, employees are eligible to apply and secure allotment of Company's shares at a price determined on the date of grant of options.
When share options are exercised, the proceeds received, net of any transaction costs, are credited to share capital (nominal value) and share premium.
4.7 Investments
The management determines the classication of its investments at the time of purchase depending on the purpose for which the investments are acquired and re-evaluates this classication at the end of each nancial year. Investments intended to be held for less than twelve months from the balance sheet date or to be sold to raise operating capital are included in current assets, all other investments are classied as non-current assets.
64 Systems Limited Annual Report 2017 65
Investments are either classied as nancial assets at fair value through prot or loss, held-to-maturity investments and available-for-sale investments as appropriate. When investments are recognized initially, they are measured at fair value, plus, in case of investments not at fair value through prot or loss, directly attributable transaction cost.
4.7.1 Investments in equity instruments of subsidiaries and associates
Investments in subsidiaries and associates where the Company has signicant inuence are measured at cost in the Company’s separate nancial statements in accordance with IAS-27 'Consolidated and separate nancial statements'.
The Company is required to publish consolidated nancial statements along with its separate nancial statements, in accordance with the requirements of IFRS 10 Consolidated Financial Statements and IAS 27 ‘Consolidated and separate nancial statements’. Investments in associates, in the consolidated nancial statements, are being accounted for using the equity method.
4.7.2 Investments at fair value through prot or loss
Investments that are acquired principally for the purpose of generating prot from short term uctuations in price are classied as investments at fair value through prot or loss. Investments at fair value through prot or loss are initially recognized at cost (excluding transaction cost), being the fair value of the consideration given. Subsequent to initial recognition they are recognized at fair value unless fair value cannot be reliably measured. Any surplus or decit on revaluation of investment is recognized in the prot or loss account.
All purchases and sale of investments are recognized on trade date, which is the date the Company commits to purchase, or sell the investment.
4.7.3 Investments held to maturity
Held-to-maturity investment are non-derivative nancial assets. Investment having xed maturity are classied as held-to-maturity where the Company has positive intension and ability to hold the investment till maturity. These investments are initially measured at fair value plus directly attributable transactions costs. Subsequently, these are carried at amortized cost using effective interest rate method less impairment losses, if any. Amortized cost is re-calculated by taking into account any discount or premium on acquisition and fees or costs that are integral part of effective interest rate (EIR). The effective interest rate amortization is included in prot and loss account. The losses arising from impairment are also recognized in prot and loss.
4.7.4 Foreign currency transactions
Assets and liabilities in foreign currencies are translated into Pak Rupees at the rate of exchange prevailing at the balance sheet date. Transactions during the year are converted into Pak Rupees at the exchange rate prevailing at the date of such transaction. All exchange differences are charged to prot and loss account.
4.8 Trade debts
Trade debts from local customers are stated at cost less provision for doubtful debts while foreign debtors are stated at translated amount by applying exchange rate applicable on the balance sheet reporting date.
4.8.1 Provision for doubtful debts
The Company reviews its trade and other receivable on each balance sheet date to assess whether the provision should be recorded in the prot and loss account relating to doubtful receivable. Judgment by the management is made of the amount and timing of future cash ows while determining the extent of provision required. Such estimation involves the application of the Company's provision for doubtful debt policy including the assessment of credit history of the counter party. Actual cash ows may differ resulting in subsequent change in provisions.
4.9 Advances, deposits and other receivables
These are recognized at nominal amount which is fair value, if considerations to be received in future.
4.10 Trade and other payables
Liabilities for trade and other payable are carried at cost which is the fair value of the consideration to be paid in future for goods and services.
4.11 Provisions and contingencies
Provisions are recognized in the balance sheet when the Company has a legal or constructive obligation as a result of past events and it is probable that outow of resources embodying economic benets will be required to settle the obligation and a reliable estimate of the amount can be made. However, provisions are reviewed at each balance sheet date and adjusted to reect current best estimate. Where outow of resources embodying economic benets is not probable, a contingent liability is disclosed, unless the possibility of outow is remote.
4.12 Revenue recognition
4.12.1 Professional services
Revenue from professional / software services includes xed price contracts and time and material contracts. Revenue from services performed under xed price contracts is recognized in accordance with the percentage of completion method. Revenue from services performed under time and material contracts is recognized as services are provided.
4.12.2 License and license support services
Revenue from license contracts without major customization is recognized when the license agreement is signed, delivery of software has occurred, fee is xed or determinable and collectability is probable. Revenue from license contracts with major modication, customization and development is recognized on percentage of completion method. Revenue from support services is recognized on time proportion basis.
4.12.3 Outsourcing services
Revenue from business process outsourcing services is recognized on completion of processing. Revenue from other outsourcing services is recognized as services are provided.
4.12.4 Consultancy
Revenue from provision of consultancy services is recognized as the work is performed.
4.12.5 Sale of third party software
Revenue from sale of third party software is recognized when the signicant risks and rewards of ownership of the software have passed to the buyer, usually on delivery of the software.
4.12.6 Unearned revenue
Revenue received in advance is transferred to unearned revenue as per respective revenue recognition policy.
4.13 Other income
Prot on deposit account and gain on short term investments is recognized on accrual basis.
4.14 Financial instruments
Financial assets and liabilities are recognized at fair value at the time when the Company becomes a party to the contractual provisions of the instrument by following trade date accounting.
A nancial asset or part thereof is de-recognized when the Company loses control of the contractual rights that comprise the nancial assets or part thereof. Such control is deemed to be lost if the Company realizes the rights to benets specied in the contracts, the rights expire or the Company surrenders those rights. A nancial liability or part thereof is removed from the balance sheet when it is extinguished i.e. when the obligation specied in the contract is discharged, cancelled or expired.
Any gain or loss on subsequent measurement and de-recognition is charged to prot and loss account.
4.14.1 Offsetting of nancial assets and liabilities
A nancial asset and a nancial liability is offset and the net amount is reported in the balance sheet if the Company has legal enforceable right to set off the recognized amount and intends either to settle on a net basis or to realize the assets and settle the liability simultaneously.
4.15 Finance costs
Finance cost is charged to prot and loss account in the year in which it is incurred.
4.16 Cash and cash equivalents
Cash and cash equivalents are stated in the balance sheet at cost. For the purpose of the Cash ow Statement, cash and cash equivalents comprise of cash in hand, cheques/demand draft in hand and deposits in the bank.
4.17 Operating lease
Leases where a signicant portion of the risks and rewards of ownership are retained by the lessor are classied as operating leases. Payments made under operating leases (net of any incentives received from the lessor) are charged to prot and loss account on a straight-line basis over the lease term unless another systematic basis is representative of the time pattern of the Company’s benet.
4.18 Dividends and appropriation reserves
Dividends and other appropriation to reserves are recognized in the nancial statements in the period in which these are approved. However, if they are approved after the reporting period but before the nancial statements are authorized for issue, they are disclosed in the notes to the nancial statements.
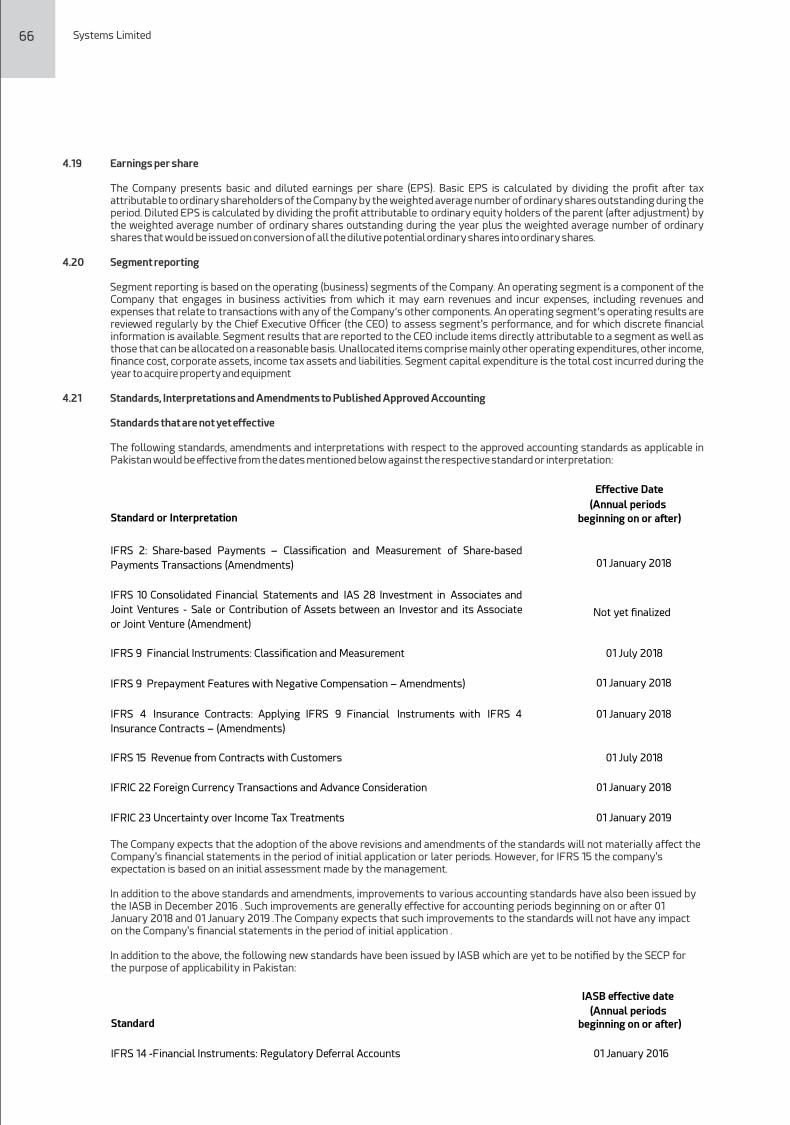
5.1.1 The cost of operating xed assets include assets amounting to Rs. 252.4 (2016: Rs. 195.3 ) million with nil book value.
66 Systems Limited Annual Report 2017 67
4.19 Earnings per share
The Company presents basic and diluted earnings per share (EPS). Basic EPS is calculated by dividing the prot after tax attributable to ordinary shareholders of the Company by the weighted average number of ordinary shares outstanding during the period. Diluted EPS is calculated by dividing the prot attributable to ordinary equity holders of the parent (after adjustment) by the weighted average number of ordinary shares outstanding during the year plus the weighted average number of ordinary shares that would be issued on conversion of all the dilutive potential ordinary shares into ordinary shares.
4.20 Segment reporting
Segment reporting is based on the operating (business) segments of the Company. An operating segment is a component of the Company that engages in business activities from which it may earn revenues and incur expenses, including revenues and expenses that relate to transactions with any of the Company’s other components. An operating segment’s operating results are reviewed regularly by the Chief Executive Officer (the CEO) to assess segment's performance, and for which discrete nancial information is available. Segment results that are reported to the CEO include items directly attributable to a segment as well as those that can be allocated on a reasonable basis. Unallocated items comprise mainly other operating expenditures, other income, nance cost, corporate assets, income tax assets and liabilities. Segment capital expenditure is the total cost incurred during the year to acquire property and equipment
4.21 Standards, Interpretations and Amendments to Published Approved Accounting
Standards that are not yet effective
The following standards, amendments and interpretations with respect to the approved accounting standards as applicable in Pakistan would be effective from the dates mentioned below against the respective standard or interpretation:
IASB effective date
Standard(Annual periods
beginning on or after)
IFRS 14 -Financial Instruments: Regulatory Deferral Accounts 01 January 2016
Effective Date
Standard or Interpretation(Annual periods
beginning on or after)
IFRS 2: Share-based Payments – Classication and Measurement of Share-based
Payments Transactions (Amendments) 01 January 2018
IFRS 10 Consolidated Financial Statements and IAS 28 Investment in Associates and
Joint Ventures - Sale or Contribution of Assets between an Investor and its Associate
or Joint Venture (Amendment)Not yet nalized
IFRS 9 Financial Instruments: Classication and Measurement 01 July 2018
IFRS 9 Prepayment Features with Negative Compensation – Amendments) 01 January 2018
IFRIC 23 Uncertainty over Income Tax Treatments 01 January 2019
IFRIC 22 Foreign Currency Transactions and Advance Consideration 01 January 2018
IFRS 15 Revenue from Contracts with Customers 01 July 2018
IFRS 4 Insurance Contracts: Applying IFRS 9 Financial Instruments with IFRS 4
Insurance Contracts – (Amendments)
01 January 2018
The Company expects that the adoption of the above revisions and amendments of the standards will not materially affect the Company's nancial statements in the period of initial application or later periods. However, for IFRS 15 the company's expectation is based on an initial assessment made by the management.
In addition to the above standards and amendments, improvements to various accounting standards have also been issued by the IASB in December 2016 . Such improvements are generally effective for accounting periods beginning on or after 01 January 2018 and 01 January 2019 .The Company expects that such improvements to the standards will not have any impact on the Company's nancial statements in the period of initial application .
In addition to the above, the following new standards have been issued by IASB which are yet to be notied by the SECP for the purpose of applicability in Pakistan:
IASB effective date
Standard(Annual periods
beginning on or after)
IFRS 17 -Insurance Contracts 01 January 2021
IFRS 16 – Leases 01 January 2019
5. PROPERTY AND EQUIPMENT
Note
Operating xed assets 5.1
Capital work in progress 5.2
832,499,330
52,274,081
884,773,411
175,872,315
381,726,137
557,598,452
5.1 Operating xed assets - Owned
2017 2016
Rupees Rupees
As at
01 January
-
-
159,193,701
28,682,853
20,363,772
14,348,665
46,387,278
24,953,489
10,031,922
7,952,326
311,914,006
Rupees
As at
01 January
53,030,412
-
210,460,928
37,855,659
24,613,374
19,463,422
52,771,597
63,680,324
17,066,029
8,844,576
487,786,321
Rupees
-
2.5
33
33
20
10
10
20
10
50-100
Depreciation
rate
(% per annum)
-
-
(2,870,008)
-
-
-
-
(25,379,908)
-
-
(28,249,916)
Disposals
Rupees
As at31 December
53,030,412
485,167,103
259,401,837
64,327,892
90,725,915
46,264,122
80,558,906
70,862,916
44,340,953
9,520,407
1,204,200,463
Rupees
-
2,021,530
36,486,349
7,401,440
4,139,882
2,127,027
2,846,289
15,904,539
2,817,626
224,508
73,969,190
Depreciation
charge for the
year
Rupees
Additions
Rupees
-
485,167,103
51,810,917
26,472,233
66,112,541
26,800,700
27,787,309
32,562,500
27,274,924
675,805
744,664,032
-
-
(2,251,776)
-
-
-
-
(11,930,287)
-
-
(14,182,063)
Disposals
Rupees
53,030,412
483,145,573
65,973,563
28,243,599
66,222,261
29,788,430
31,325,339
41,935,175
31,491,405
1,343,573
832,499,330
Net book
value as at
31 December
Rupees
-
2,021,530
193,428,274
36,084,293
24,503,654
16,475,692
49,233,567
28,927,741
12,849,548
8,176,834
371,701,133
As at 31December
Rupees
Land - free hold
Building
Computers and mobile sets
Computer equipment and installations
Other equipment and installations
Generator
Furniture and ttings
Vehicles
Office equipment
Project assets
DESCRIPTION
Cost Accumulated Depreciation
As at
01 January
Rupees
As at
01 January
Rupees
Depreciation
rate
(% per annum) Disposals
Rupees
As at31 December
Rupees
Depreciation
charge for the
year
Rupees
Additions
Rupees
Disposals
Rupees
Net book
value as at
31 December
Rupees
As at 31December
Rupees
Land - free hold 53,030,412 - - 53,030,412 -
- - - 53,030,412 -
Computers and mobile sets 212,234,091 22,200,497 (23,973,660) 210,460,928 143,371,309
39,090,142 (23,267,750) 159,193,701 51,267,227 33
Computer equipment and installations 37,714,877 4,407,210 (4,266,428) 37,855,659 27,272,867
5,662,247 (4,252,261) 28,682,853 9,172,806 33
Other equipment and installations 24,762,378 1,170,889 (1,319,893) 24,613,374 18,661,456
2,915,542 (1,213,226) 20,363,772 4,249,602 20
Generator 19,822,922 - (359,500) 19,463,422 12,304,441
2,270,491 (226,267) 14,348,665 5,114,757 20
Furniture and ttings 53,662,407 1,280,747 (2,171,557) 52,771,597 44,871,607 3,687,228 (2,171,557) 46,387,278 6,384,319 20
Vehicles 53,098,044 31,139,108 (20,556,828) 63,680,324 20,188,958 15,674,865 (10,910,334) 24,953,489 38,726,835 25
Office equipment 12,403,051 5,172,978 (510,000) 17,066,029 8,471,548 2,070,374 (510,000) 10,031,922 7,034,107 20
Project assets 7,532,119 1,353,000 (40,543) 8,844,576 6,723,028 1,269,841 (40,543) 7,952,326 892,250 50-100
474,260,301 66,724,429 (53,198,409) 487,786,321 281,865,214 72,640,730 (42,591,938) 311,914,006 175,872,315
DESCRIPTION
Cost Accumulated Depreciation
2017
2016
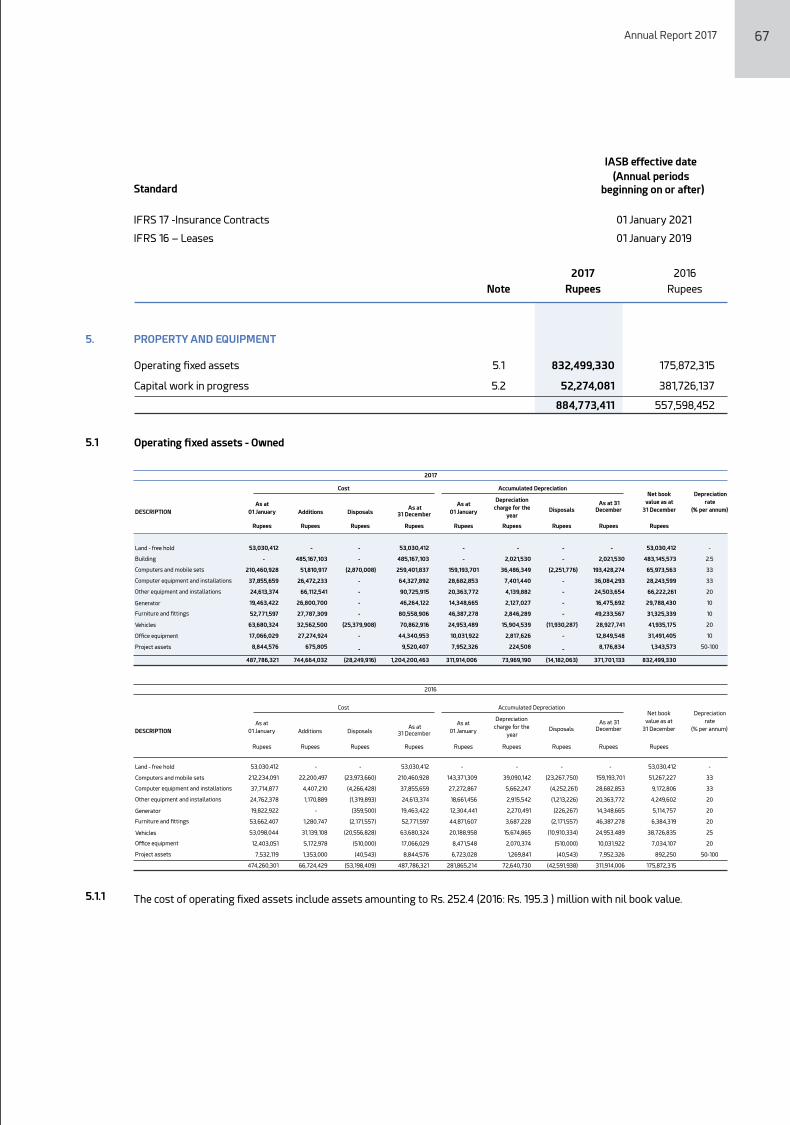
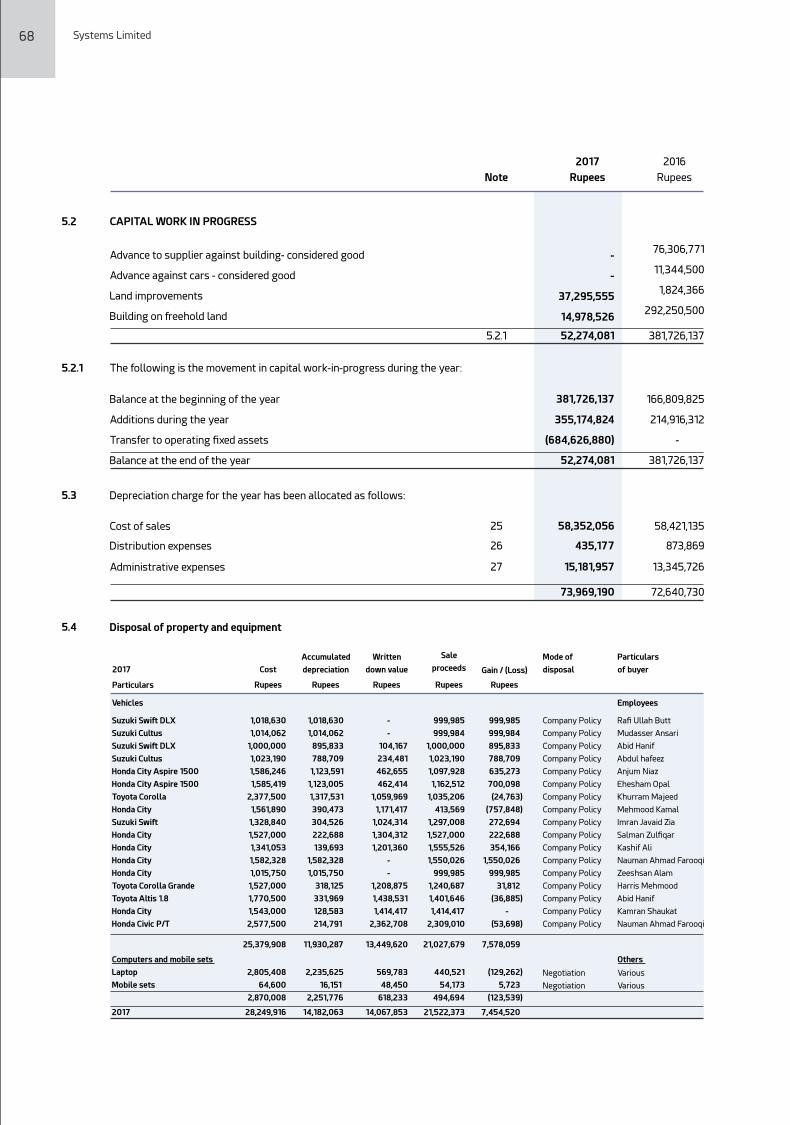
68 Systems Limited Annual Report 2017 69
Note
2017 2016
Rupees Rupees
5.2 CAPITAL WORK IN PROGRESS
Advance to supplier against building- considered good
Advance against cars - considered good
Land improvements
Building on freehold land
5.2.1 The following is the movement in capital work-in-progress during the year:
-76,306,771
-
11,344,500
37,295,555
1,824,366
14,978,526
292,250,500
5.2.1 52,274,081
381,726,137
Balance at the beginning of the year 381,726,137 166,809,825
Additions during the year 355,174,824 214,916,312
Transfer to operating xed assets (684,626,880) -
Balance at the end of the year 52,274,081
381,726,137
5.3 Depreciation charge for the year has been allocated as follows:
Cost of sales 25 58,352,056 58,421,135
Distribution expenses 26 435,177
873,869
Administrative expenses 27 15,181,957
13,345,726
73,969,190
72,640,730
5.4 Disposal of property and equipment
999,985
999,984
895,833
788,709
635,273
700,098
(24,763)
(757,848)
272,694
222,688
354,166
1,550,026
999,985
31,812
(36,885)
-
(53,698)
7,578,059
(129,262)
5,723
(123,539)
7,454,520
Employees
Ra Ullah Butt
Mudasser Ansari
Abid Hanif
Abdul hafeez
Anjum Niaz
Ehesham Opal
Khurram Majeed
Mehmood Kamal
Imran Javaid Zia
Salman Zulqar
Kashif Ali
Nauman Ahmad Farooqi
Zeeshsan Alam
Harris Mehmood
Abid Hanif
Kamran Shaukat
Nauman Ahmad Farooqi
Others
Various
Various
Company Policy
Company Policy
Company Policy
Company Policy
Company Policy
Company Policy
Company Policy
Company Policy
Company Policy
Company Policy
Company Policy
Company Policy
Company Policy
Company Policy
Company Policy
Company Policy
Company Policy
Negotiation
Negotiation
1,018,630
1,014,062
895,833
788,709
1,123,591
1,123,005
1,317,531
390,473
304,526
222,688
139,693
1,582,328
1,015,750
318,125
331,969
128,583
214,791
11,930,287
2,235,625
16,151
2,251,776
14,182,063
-
-
104,167
234,481
462,655
462,414
1,059,969
1,171,417
1,024,314
1,304,312
1,201,360
-
-
1,208,875
1,438,531
1,414,417
2,362,708
13,449,620
569,783
48,450
618,233
14,067,853
999,985
999,984
1,000,000
1,023,190
1,097,928
1,162,512
1,035,206
413,569
1,297,008
1,527,000
1,555,526
1,550,026
999,985
1,240,687
1,401,646
1,414,417
2,309,010
21,027,679
440,521
54,173
494,694
21,522,373
1,018,630
1,014,062
1,000,000
1,023,190
1,586,246
1,585,419
2,377,500
1,561,890
1,328,840
1,527,000
1,341,053
1,582,328
1,015,750
1,527,000
1,770,500
1,543,000
2,577,500
25,379,908
2,805,408
64,600
2,870,008
28,249,916
Gain / (Loss)
Rupees
Particulars
of buyer
Mode of
disposal
Accumulated
depreciation
Rupees
Written
down value
Rupees
Sale
proceeds
RupeesRupees
Cost
Particulars
Vehicles
Suzuki Swift DLX
Suzuki Cultus
Suzuki Swift DLX
Suzuki Cultus
Honda City Aspire 1500
Honda City Aspire 1500
Toyota Corolla
Honda City
Suzuki Swift
Honda City
Honda City
Honda City
Honda City
Toyota Corolla Grande
Toyota Altis 1.8
Honda City
Honda Civic P/T
Computers and mobile sets
Laptop
Mobile sets
2017 `
Gain / (Loss)
Rupees
Particulars
of buyer
Mode of
disposal
Accumulated
depreciation
Rupees
Written
down value
Rupees
Sale
proceeds
RupeesRupees
Cost
Directors
2,515,733 1,643,086
872,647
872,645
(2)
Company Policy Asif Peer
Employees
54,000 54,000
-
16,000
16,000
Company Policy Imdad Hussain Qazi
1,612,130 1,612,130
-
1,550,005
1,550,005
Company Policy Zahid Janjua
1,071,415 1,071,415
-
1,000,000
1,000,000
Company Policy Haris Mehmood
2,218,840 1,756,580
462,260
462,258
(2)
Company Policy Sajid Hamid
1,000,000 750,000
250,000
-
(250,000)
Company Policy Abid Sultan
1,030,340 515,170
515,170
916,168
400,998
Company Policy Mustafa Chohan
1,825,810 646,641
1,179,169
1,106,549
(72,620)
Company Policy Shoiab Hamid
2,056,810 642,753
1,414,057
1,374,995
(39,062)
Company Policy Affan Sajjad
1,380,820 402,739
978,081
969,780
(8,301)
Company Policy Naila Sabahat
1,361,850 312,091
1,049,759
1,049,759
-
Company Policy Omer Sardar
1,810,800 339,525
1,471,275
1,475,000
3,725
Company Policy Sabahat Bukhari
1,527,000 127,250
1,399,750
1,441,030
41,280
Company Policy Haseeb Ullah Khan
19,465,548 9,873,380
9,592,168
12,234,189
2,642,021
Others
3,695,422 3,022,854 672,568 732,724 60,156 Negotiation Various
839,044 839,044 - 46,785 46,785 Negotiation Various
139,490 106,157 33,333 35,000 1,667 Negotiation Various
3,217,126 3,217,126 - - - Negotiation Various
14,731,440 14,731,440 - 65,135 65,135 Negotiation Various
397,535 397,535 - 1,000 1,000 Negotiation Various
994,145 994,145 - 12,500 12,500 Negotiation Various
24,014,202 23,308,301 705,901 893,144 187,243
9,718,659 9,410,257 308,402 3,428,074 3,119,672 Negotiation Various
Particulars
Vehicles
Honda Civic
Motor Cycle
Toyota Corolla
Toyota Corolla
Honda Civic
Honda City
Suzuki Swift
Toyota Corolla
Toyota Corolla
Toyota Corolla
Honda City
Toyota Corolla
Honda City
Computers and mobile sets
Laptops
Lcd screen
Mobile Set
Monitor
Personal computer
Printer
Server
Other
Miscellaneous
2016 53,198,409 42,591,938 10,606,471̀ 16,555,407 5,948,936
6. INTANGIBLES
Computer software and licenses
Intangibles under development - Software
51,467,435
-
51,467,435
55,306,397
5,000,000
60,306,397
2017 2016
Rupees Rupees
Accumulated
amortization as
at 1 January
Amortization
charge
for the year
Accumulated
amortization as
at 31 December
Book value
as at
31 December
Computer software
and licenses 101,111,362
29,411,542
-
130,522,904
49,643,927
25,572,580
-
75,216,507
55,306,397
33%
Accumulated Amortization Accumulated Book value
amortization as charge amortization as as at
at 1 January for the year at 31 December 31 December
Owned:
Computer software
and licenses 72,107,753
29,003,609
- 101,111,362 29,860,235 19,783,692 - 49,643,927 51,467,435 30%`
Rate
Rate
Cost as at 1
January AdditionsCost as at 31
December
Additions
Cost as at 31
December
Cost as at 1
January Disposals Disposals
Disposals Disposals
Particulars
Particulars
2017
Rupees
2016
Rupees Rupees Rupees Rupees Rupees Rupees Rupees Rupees
Rupees Rupees Rupees Rupees Rupees Rupees Rupees Rupees Rupees
6.1 The cost of the intangibles include intangible assets amounting to Rs. 22.78 (2016: Rs. 15.72 ) million with nil book value.
6.2 Additions include in-house developed intangibles amounting to Rs. 26.2 (2016: Rs. 29) million capitalized during the current year.
2017
2016
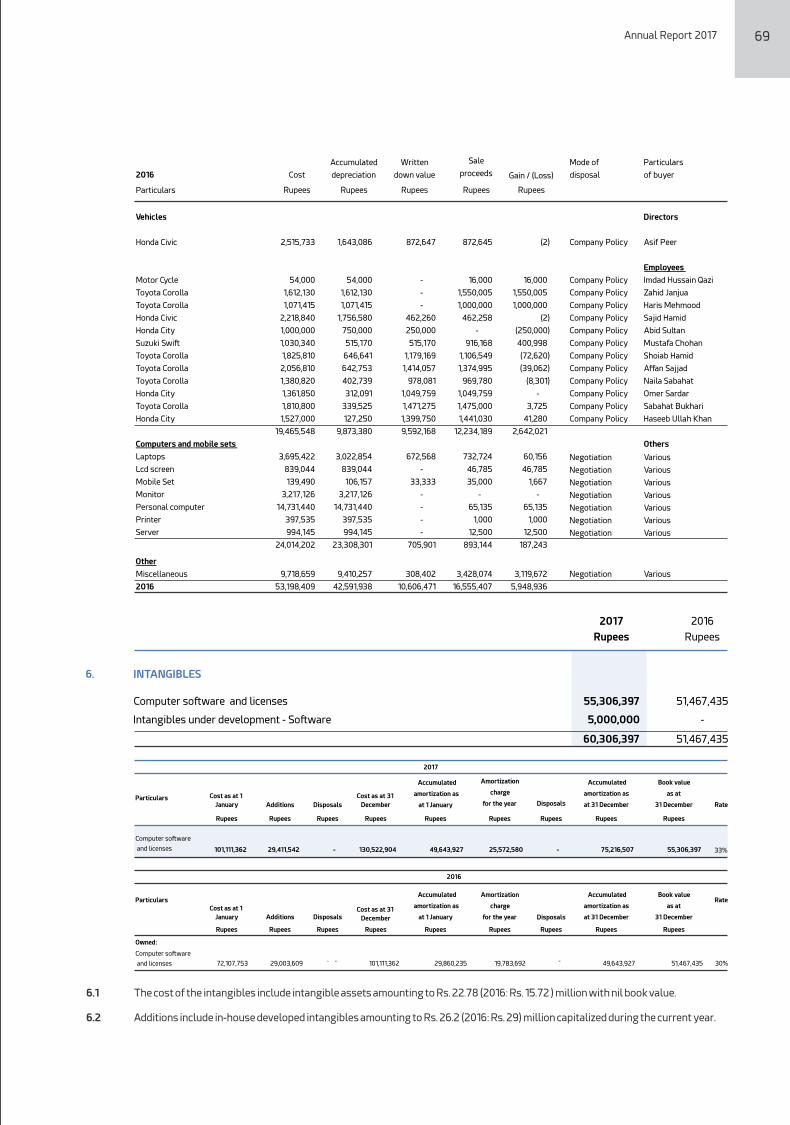
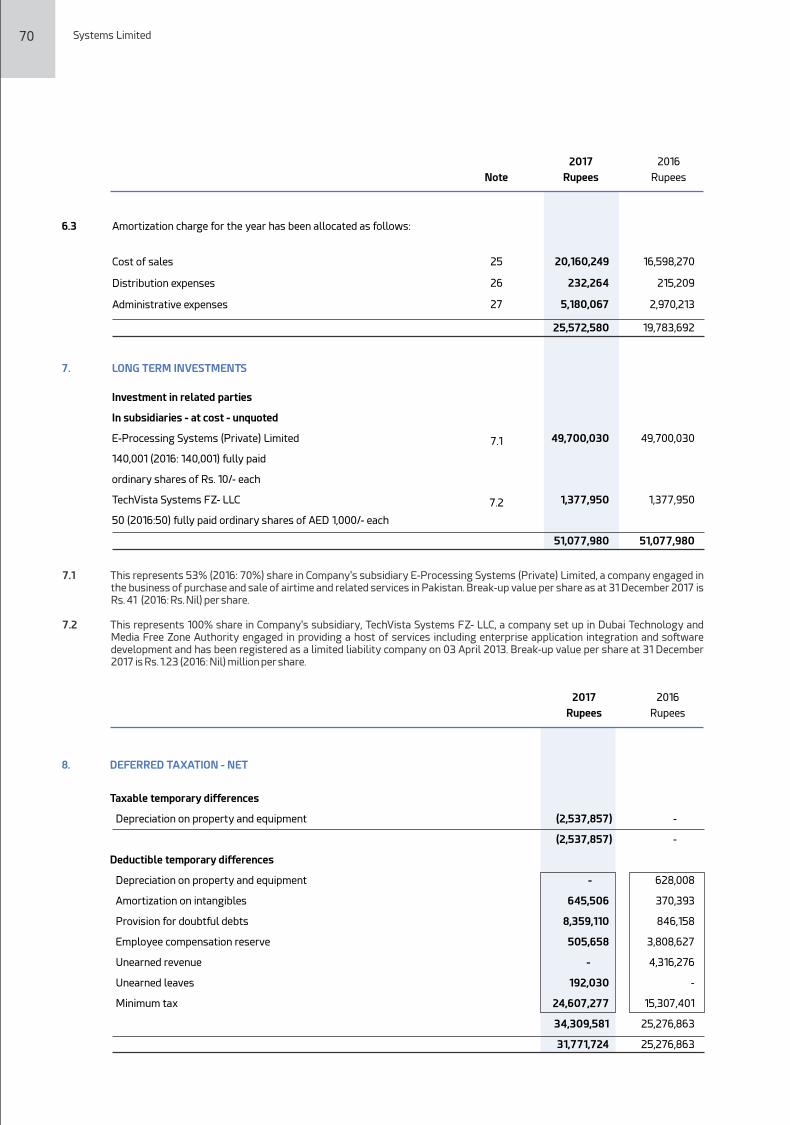
9.
9.1
86,919,358
350,634,652
437,554,010
(49,535,932)
388,018,078
147,630,227
187,904,849
335,535,076
(14,640,946)
320,894,130
9.1
UNBILLED REVENUE
Considered good - unsecured
Export
Local
Less: written off
This represents work performed but not billed to the client.
8.
-
-
628,008
370,393
846,158
3,808,627
4,316,276
-
DEFERRED TAXATION - NET
Taxable temporary differences
Depreciation on property and equipment
Deductible temporary differences
Depreciation on property and equipment
Amortization on intangibles
Provision for doubtful debts
Employee compensation reserve
Unearned revenue
Unearned leaves
Minimum tax 15,307,401
25,276,863
(2,537,857)
(2,537,857)
-
645,506
8,359,110
505,658
-
192,030
24,607,277
34,309,581
31,771,724 25,276,863
6.3
25
26
Amortization charge for the year has been allocated as follows:
Cost of sales
Distribution expenses
Administrative expenses 27
20,160,249
232,264
5,180,067
25,572,580
16,598,270
215,209
2,970,213
19,783,692
Note
2017 2016
Rupees Rupees
70 Systems Limited Annual Report 2017 71
7.
7.1 49,700,030
49,700,030
7.2 1,377,950
1,377,950
LONG TERM INVESTMENTS
Investment in related parties
In subsidiaries - at cost - unquoted
E-Processing Systems (Private) Limited
140,001 (2016: 140,001) fully paid
ordinary shares of Rs. 10/- each
TechVista Systems FZ- LLC
50 (2016:50) fully paid ordinary shares of AED 1,000/- each
51,077,980
51,077,980
7.1 This represents 53% (2016: 70%) share in Company's subsidiary E-Processing Systems (Private) Limited, a company engaged in the business of purchase and sale of airtime and related services in Pakistan. Break-up value per share as at 31 December 2017 is Rs. 41 (2016: Rs. Nil) per share.
7.2 This represents 100% share in Company's subsidiary, TechVista Systems FZ- LLC, a company set up in Dubai Technology and Media Free Zone Authority engaged in providing a host of services including enterprise application integration and software development and has been registered as a limited liability company on 03 April 2013. Break-up value per share at 31 December 2017 is Rs. 1.23 (2016: Nil) million per share.
2017 2016
Rupees Rupees
Note
2017 2016
Rupees Rupees
10.
10.1 959,900,736
1,054,908,632
180,970,428
242,451,609
1,140,871,164
1,297,360,241
8,869,189
-
38,417,236
26,725,153
47,286,425
26,725,153
1,188,157,589
1,324,085,394
10.2 (36,732,888)
(11,179,257)
TRADE DEBTS
Considered good - unsecured:
Export
Local
Considered doubtful - unsecured:
Export
Local
Less: Provision for doubtful debts
Less: written off (10,553,537)
(15,545,896)
(47,286,425)
(26,725,153)
1,140,871,164
1,297,360,241
10.211,179,257 11,971,419
27,632,931 793,118
(2,079,300) (1,585,280)
25,553,631 (792,162)
Balance as at 01 January
Provision made during the year
Less: provision reversed during the year
Net charge for the year
Balance as at 31 December 36,732,888 11,179,257
10.1 This includes receivable against sale of services from related parties, Visionet Systems Incorporation and TechVista Systems FZ LLC amounting to Rs. 329 (2016: Rs. 646.4) million and Rs. 617.68 (2016: Rs. 366.9) million respectively.
2017 2016
Rupees Rupees
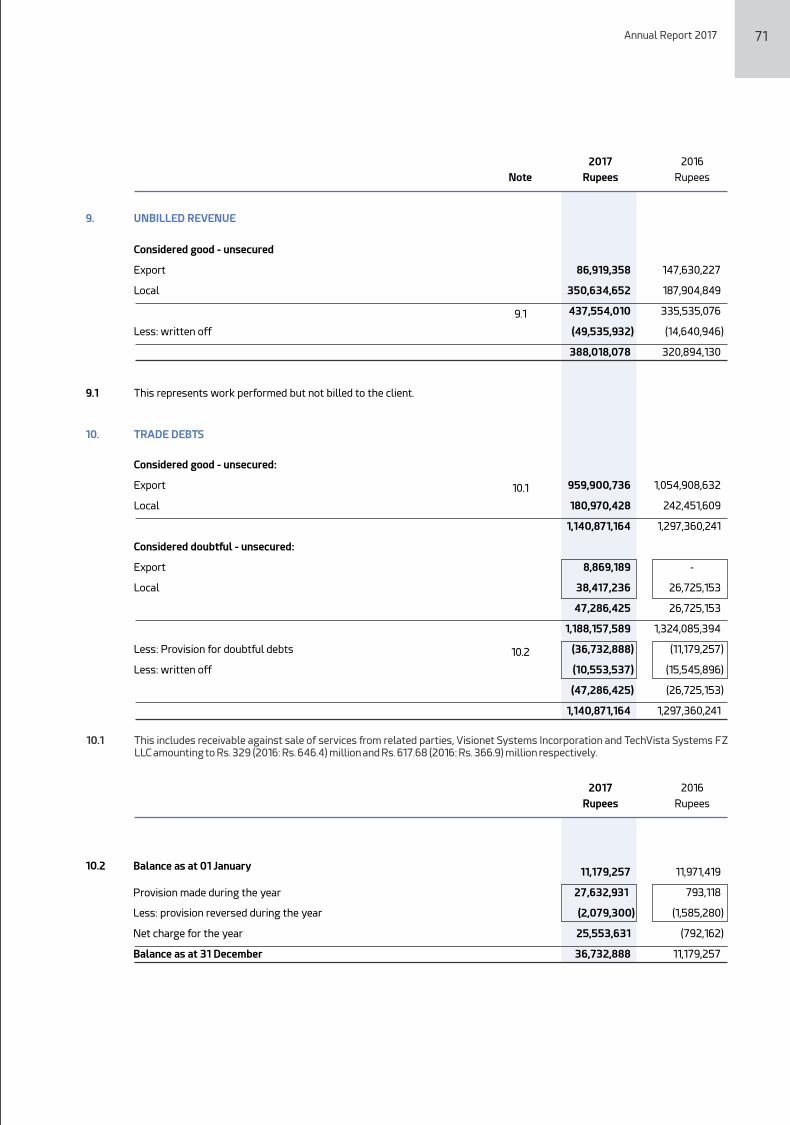
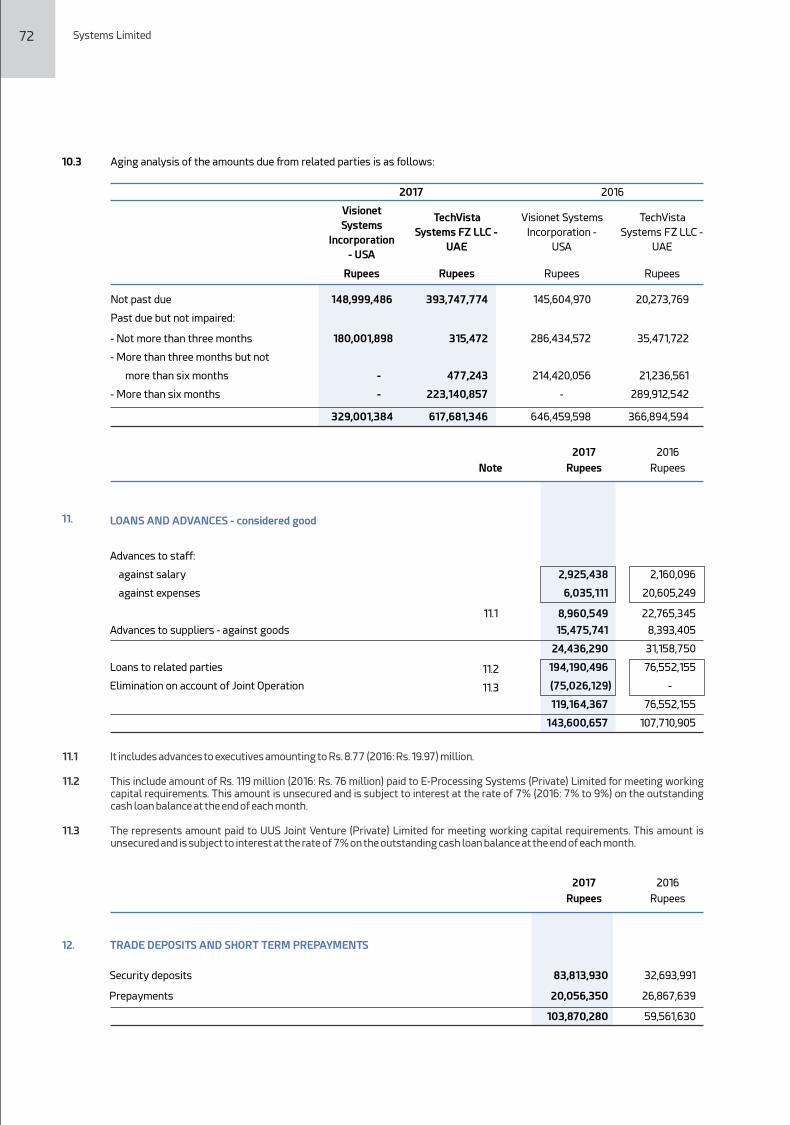
11.
2,925,438
6,035,111
11.1 8,960,549
15,475,741
24,436,290
11.2 194,190,496
11.3 (75,026,129)
119,164,367
143,600,657
2,160,096
20,605,249
22,765,345
8,393,405
31,158,750
76,552,155
-
76,552,155
107,710,905
LOANS AND ADVANCES - considered good
Advances to staff:
against salary
against expenses
Advances to suppliers - against goods
Loans to related parties
Elimination on account of Joint Operation
72 Systems Limited Annual Report 2017 73
10.3 Aging analysis of the amounts due from related parties is as follows:
Not past due
Past due but not impaired:
- Not more than three months
- More than three months but not
more than six months
- More than six months
2017 2016
Visionet
Systems
Incorporation
- USA
TechVista
Systems FZ LLC -
UAE
148,999,486 393,747,774
180,001,898
315,472
-
477,243
-
223,140,857
329,001,384
617,681,346
RupeesRupees
Visionet Systems
Incorporation -
USA
TechVista
Systems FZ LLC -
UAE
145,604,970 20,273,769
286,434,572
35,471,722
214,420,056
21,236,561
-
289,912,542
646,459,598
366,894,594
Rupees
Rupees
Note
2017 2016
Rupees Rupees
11.1 It includes advances to executives amounting to Rs. 8.77 (2016: Rs. 19.97) million.
11.2 This include amount of Rs. 119 million (2016: Rs. 76 million) paid to E-Processing Systems (Private) Limited for meeting working capital requirements. This amount is unsecured and is subject to interest at the rate of 7% (2016: 7% to 9%) on the outstanding cash loan balance at the end of each month.
11.3 The represents amount paid to UUS Joint Venture (Private) Limited for meeting working capital requirements. This amount is unsecured and is subject to interest at the rate of 7% on the outstanding cash loan balance at the end of each month.
12. TRADE DEPOSITS AND SHORT TERM PREPAYMENTS
Security deposits 83,813,930
32,693,991
Prepayments 20,056,350
26,867,639
103,870,280
59,561,630
13. OTHER RECEIVABLES
These represents receivables from following related parties.
Considered good - unsecured:
Visionet Systems Incorporation - USA 13.1
TechVista FZ LLC - UAE 13.2
4,118,251
179,545,449
183,663,700
2,593,326
147,772,044
150,365,370
14. SHORT TERM INVESTMENTS
Held to maturity
Habib Metropolitan Bank 225,000,000
253,000,000
14.1 225,000,000
253,000,000
15.
98,958,341 55,143,956
57,677,408 59,121,786
31 (14,551,265) (15,307,401)
142,084,484 98,958,341
16.
93,105 47,660
55,298,198 38,931,750
16.1 388,335,699 142,712,134
443,633,897 181,643,884
TAX REFUNDS DUE FROM THE GOVERNMENT
Balance as at 01 January
Income tax paid during the year
Provision for the year
Balance as at 31 December
CASH AND BANK BALANCES
Cash in hand
Cash at bank:
Local currency:
Current accounts
Saving accounts
Foreign currency - current accounts 528,390 1,508,644
444,255,392 183,200,188
16.1 These carry markup at the rate of 3.75% to 4% (2016: 3.29% to 4.04%) per annum.
2017 2016
Rupees Rupees
Note
2017 2016
Rupees Rupees
13.1 This represents amount receivable against expenses incurred on behalf of Visionet Systems Incorporation and are payable on demand by the Company. These receivables are unsecured and interest free.
13.2 This represents amount receivable against expenses incurred on behalf of TechVista Systems FZ - LLC and are payable on demand by the Company. These receivables are unsecured and interest free.
Note
2017 2016
Rupees Rupees
14.1 This represents Term Deposit Receipts (TDRs) carrying markup at rates ranging from 3.93% to 5.85% (2016: 5.85% to 6.5%) per annum.
Note
2017 2016
Rupees Rupees
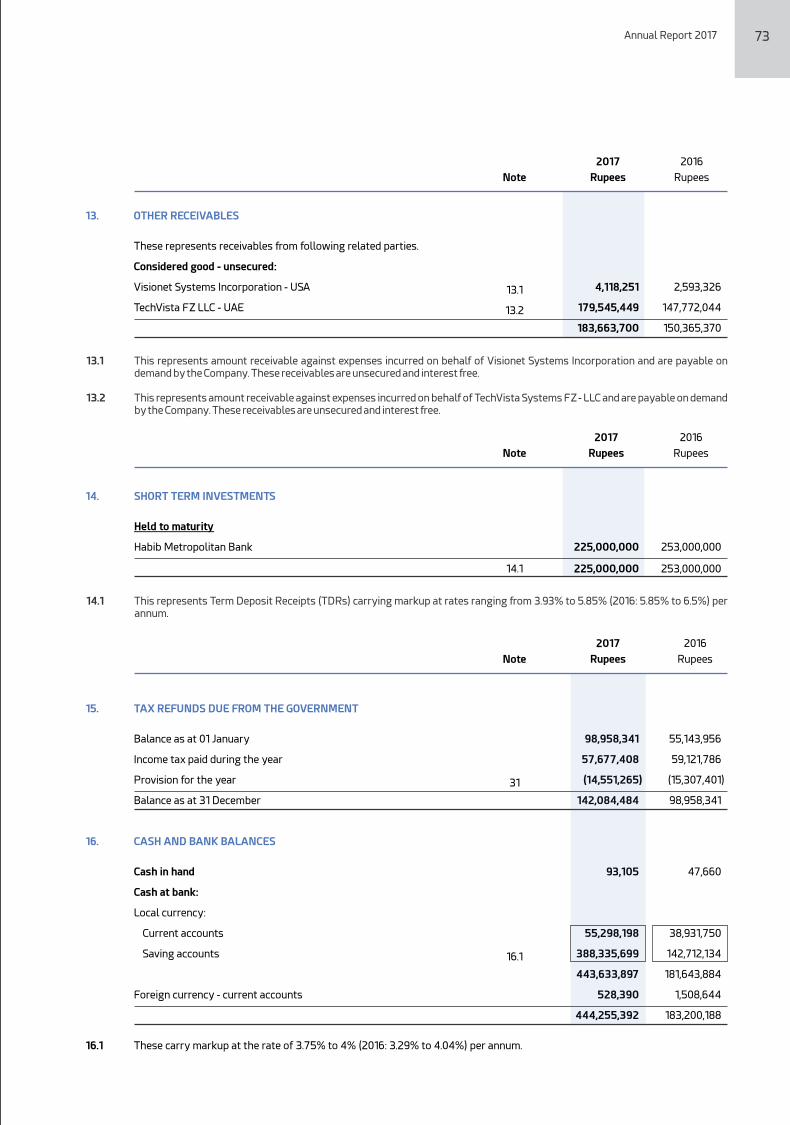
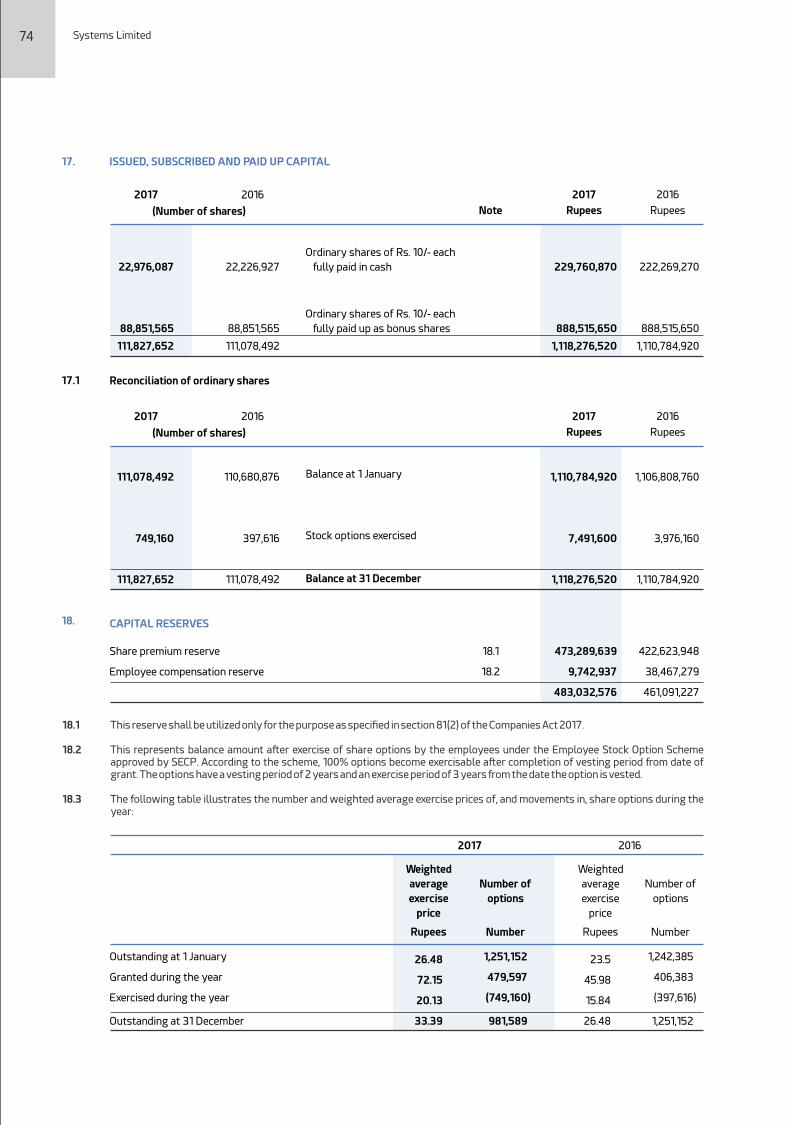
22. SHORT TERM BORROWINGS
MCB Bank Limited 22.1 200,000,000 -
Weighted
average
exercise
price
Number of
options
Rupees Number
Outstanding at 1 January 23.5 1,242,385
Granted during the year 45.98 406,383
Exercised during the year 15.84 (397,616)
Outstanding at 31 December
Weighted
average
exercise
price
Rupees
Number of
options
Number
26.48 1,251,152
72.15 479,597
20.13 (749,160)
33.39 981,589 26.48 1,251,152
2017 2016
18.
18.1 473,289,639 422,623,948
CAPITAL RESERVES
Share premium reserve
Employee compensation reserve 18.2 9,742,937 38,467,279
483,032,576 461,091,227
74 Systems Limited Annual Report 2017 75
17. ISSUED, SUBSCRIBED AND PAID UP CAPITAL
2017 2016
22,976,087
88,851,565 111,827,652
22,226,927
88,851,565 111,078,492
229,760,870
888,515,650 1,118,276,520
222,269,270
888,515,650 1,110,784,920
17.1 Reconciliation of ordinary shares
111,078,492
110,680,876
1,110,784,920
1,106,808,760
749,160
397,616
7,491,600
3,976,160
111,827,652 111,078,492 1,118,276,520 1,110,784,920
Balance at 1 January
Ordinary shares of Rs. 10/- each
fully paid in cash
Ordinary shares of Rs. 10/- each
fully paid up as bonus shares
Balance at 31 December
Stock options exercised
(Number of shares) Note
2017 2016
Rupees Rupees
2017 2016
(Number of shares)
2017 2016
Rupees Rupees
18.1 This reserve shall be utilized only for the purpose as specied in section 81(2) of the Companies Act 2017.
18.2 This represents balance amount after exercise of share options by the employees under the Employee Stock Option Scheme approved by SECP. According to the scheme, 100% options become exercisable after completion of vesting period from date of grant. The options have a vesting period of 2 years and an exercise period of 3 years from the date the option is vested.
18.3 The following table illustrates the number and weighted average exercise prices of, and movements in, share options during the year:
19. LONG TERM ADVANCES
This represents advances received from staff and will be adjusted as per Company's car policy against sale of vehicles. These advances are interest free and not being carried at amortized cost as the related impact would be immaterial.
20.
14,752,641
3,759,560
11,604,035
152,684,704
20.1
17,930,514
10,345,091
6,913,335
5,007,552
3,691,694
226,689,126
20.1
17,930,514
-
TRADE AND OTHER PAYABLES
Creditors
Advance from customers
Retention money
Accrued liabilities
Worker's Welfare Fund (WWF)
Provident fund payable
Withholding income tax payable
Sales tax payable
Unclaimed dividend
Worker's Welfare Fund (WWF)
Opening balance
Reversed during the year
Closing balance
154,730,974
1,541,005
335,116
151,367,486
-
16,565,033
8,946,059
-
-
333,485,673
17,930,514
(17,930,514)
- 17,930,514
Note
2017 2016
Rupees Rupees
21. UNEARNED REVENUE
This represents professional / software development services, license and license support services and other fees received in advance.
Note
2017 2016
Rupees Rupees
22.1 Short term borrowings are availed from MCB Bank Limited against aggregate sanctioned limit of Rs. 400 million (2016: Rs. Nil). The rates of mark up range between KIBOR plus 0.1% to KIBOR plus 0.4% per annum.
23. CONTINGENCIES AND COMMITMENTS
Contingencies
23.1 The Company has led an undertaking pursuant clause 94 part IV of second schedule to Income Tax Ordinance, 2001, thereby opting out of minimum tax on services under section 153(1)(b) of the Income Tax Ordinance, 2001. The Additional Commissioner Inland Revenue has declined to accept the undertaking against which the Company has preferred an appeal before Commissioner Inland Revenue (Appeals) which is pending adjudication, which might result in tax liability of Rs. 30.25 million.
23.2 The Additional Commissioner Inland Revenue issued order under section 122 (5A) of the Ordinance for tax year 2014, on the basis of wrong proration of expenses, capital gain etc. and created demand of Rs. 48,591,443. The company preferred appeal against the order, which the Commissioner Appeals has decided in favor of the company. However, the tax department has led second appeal before the Appellate Tribunal which is pending adjudication.
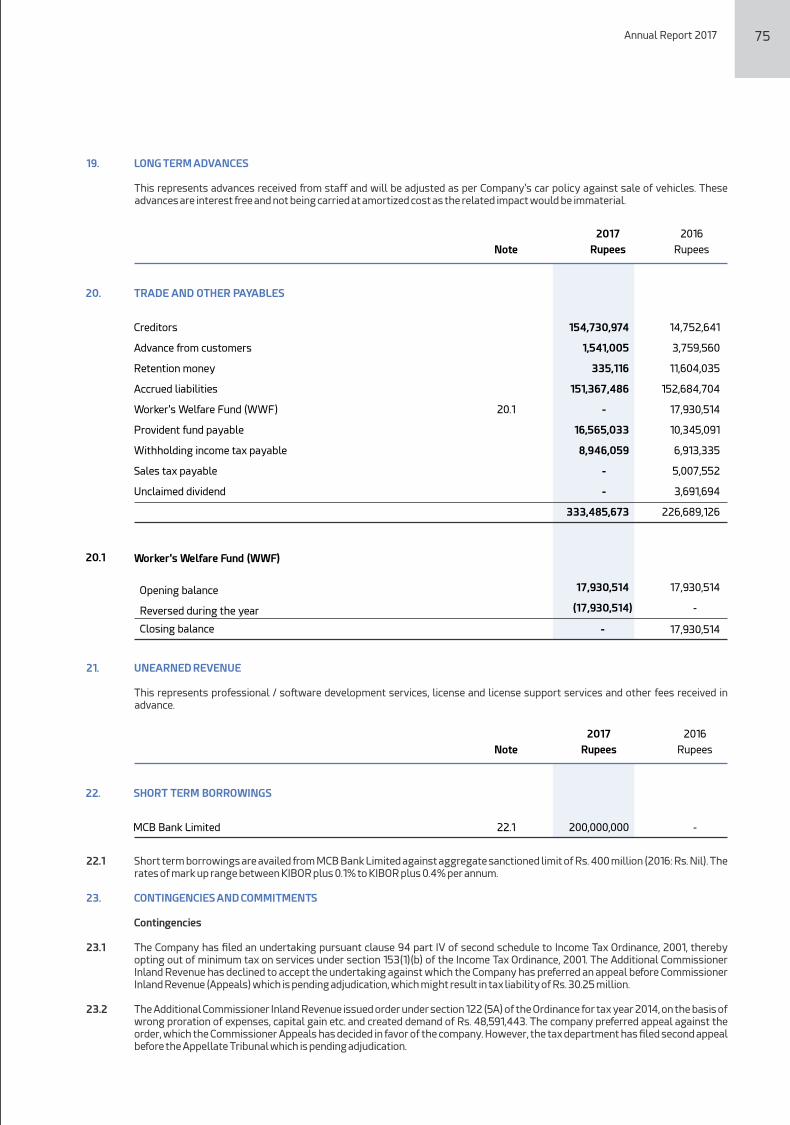
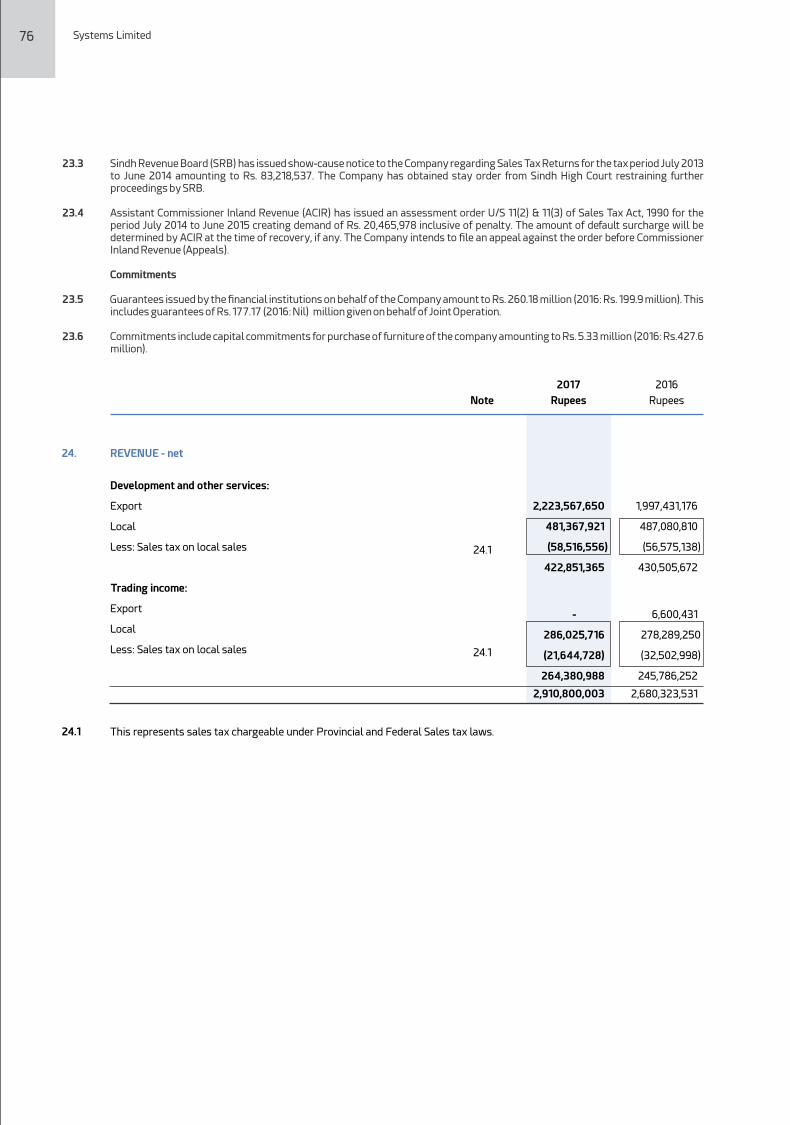
25.
25.1 1,445,959,161
1,926,442
11,332,942
52,015,588
35,496,122
85,578,941
11,292,303
48,228,263
9,778,863
6,867,582
4,842,198
4,030,047
5.3 58,352,056
6.3 20,160,249
1,795,860,757
252,831,178
2,048,691,935
1,343,410,550
3,038,957
8,290,865
71,206,302
41,317,630
60,156,288
12,848,720
41,297,463
7,451,537
6,163,299
4,712,598
2,404,599
58,421,135
16,598,270
1,677,318,213
207,301,610
1,884,619,823
25.1
COST OF REVENUE
Salaries, allowances and amenities
Printing and stationery
Computer supplies
Rent, rates and taxes
Electricity, gas and water
Traveling and conveyance
Repair and maintenance
Postage, telephone and telegrams
Vehicle running and maintenance
Entertainment
Fee and subscriptions
Insurance
Depreciation
Amortization
Purchase of software for trading
This includes employees retirement benet expense amounting to Rs. 66.7 (2016: Rs. 64.43) million.
26.
26.1 106,242,686
28,615,072
690,586
521,332
271,557
304,924
378,629
799,727
248,079
382,130
1,809,850
2,407,725
95,515
219,638
381,422
581,152
429,270
480,223
289,040
346,957
24,406
54,456
525,936
57,828
1,464,215
1,320,961
5.3 435,177
873,869
6.3 232,264
215,209
DISTRIBUTION EXPENSES
Salaries, allowances and amenities
Printing and stationery
Computer supplies
Rent, rates and taxes
Electricity, gas and water
Traveling and conveyance
Repair and maintenance
Postage, telephone and telegrams
Vehicle running and maintenance
Entertainment
Insurance
Fee and subscriptions
Shows/Seminars/Advertising
Depreciation
Amortization
Tender documents 194,303
105,996
113,712,935
37,287,199
76 Systems Limited Annual Report 2017 77
23.3 Sindh Revenue Board (SRB) has issued show-cause notice to the Company regarding Sales Tax Returns for the tax period July 2013 to June 2014 amounting to Rs. 83,218,537. The Company has obtained stay order from Sindh High Court restraining further proceedings by SRB.
23.4 Assistant Commissioner Inland Revenue (ACIR) has issued an assessment order U/S 11(2) & 11(3) of Sales Tax Act, 1990 for the period July 2014 to June 2015 creating demand of Rs. 20,465,978 inclusive of penalty. The amount of default surcharge will be determined by ACIR at the time of recovery, if any. The Company intends to le an appeal against the order before Commissioner Inland Revenue (Appeals).
Commitments
23.5 Guarantees issued by the nancial institutions on behalf of the Company amount to Rs. 260.18 million (2016: Rs. 199.9 million). This includes guarantees of Rs. 177.17 (2016: Nil) million given on behalf of Joint Operation.
23.6 Commitments include capital commitments for purchase of furniture of the company amounting to Rs. 5.33 million (2016: Rs.427.6 million).
24.
24.1
24.1
2,223,567,650
481,367,921
(58,516,556)
422,851,365
-
286,025,716
(21,644,728)
264,380,988
2,910,800,003
1,997,431,176
487,080,810
(56,575,138)
430,505,672
6,600,431
278,289,250
(32,502,998)
245,786,252
2,680,323,531
24.1
REVENUE - net
Development and other services:
Export
Local
Less: Sales tax on local sales
Trading income:
Export
Local
Less: Sales tax on local sales
This represents sales tax chargeable under Provincial and Federal Sales tax laws.
Note
2017 2016
Rupees Rupees
Note
2017 2016
Rupees Rupees
Note
2017 2016
Rupees Rupees
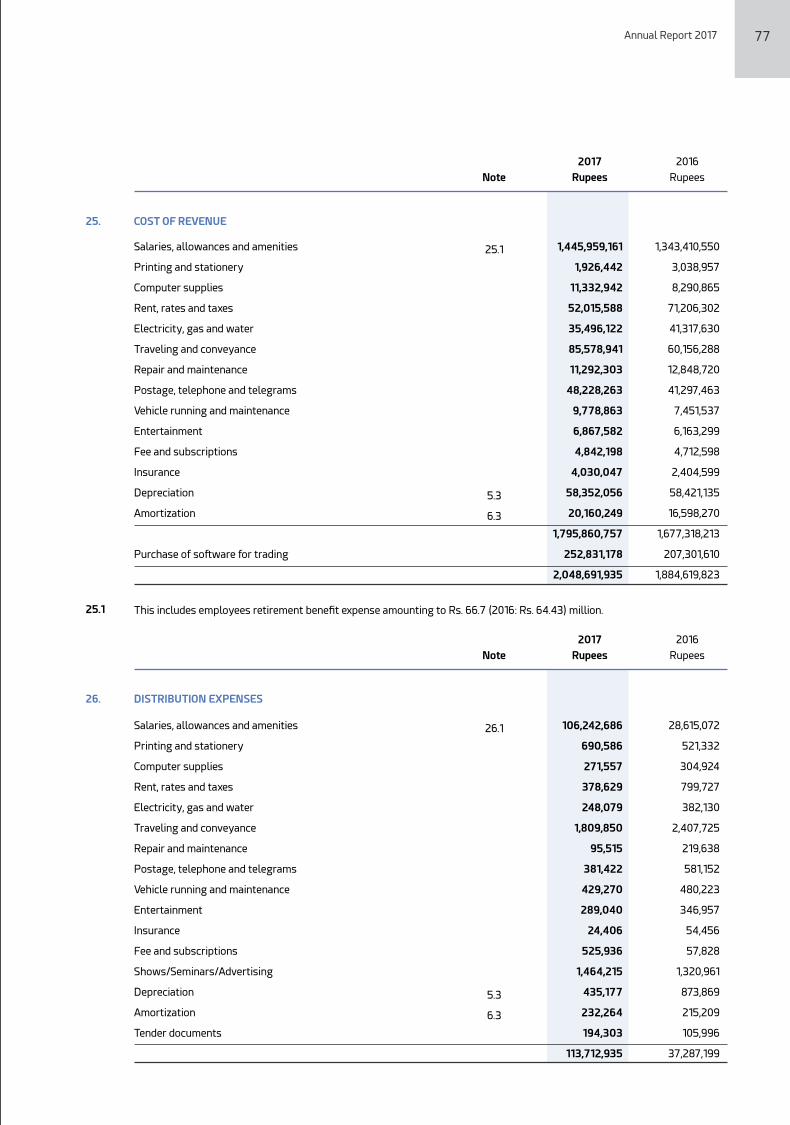
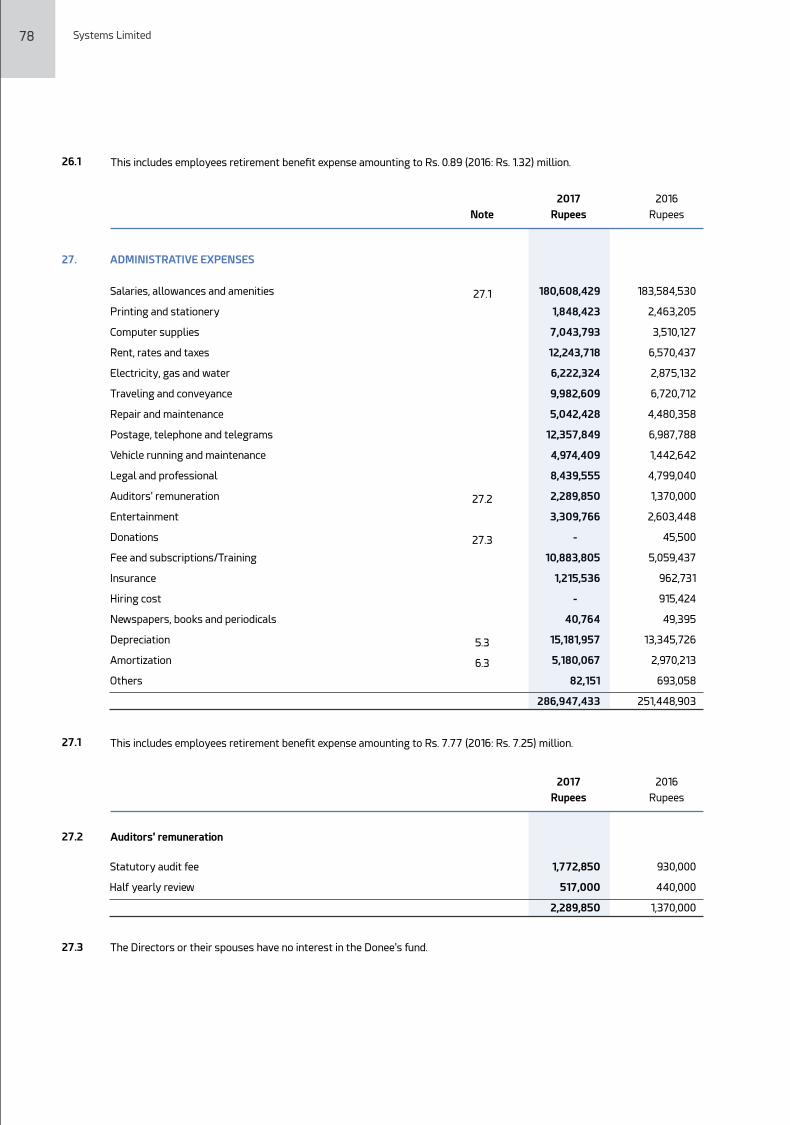
31. TAXATION
Income tax - current year 31.1 & 31.2 14,551,265
15,307,401
Deferred tax (6,494,861)
(24,467,353)
8,056,404
(9,159,952)
27.2 Auditors' remuneration
Statutory audit fee 1,772,850 930,000
Half yearly review 517,000 440,000
2,289,850 1,370,000
27.3 The Directors or their spouses have no interest in the Donee's fund.
27.
27.1
27.2
27.3
5.3
6.3
180,608,429
1,848,423
7,043,793
12,243,718
6,222,324
9,982,609
5,042,428
12,357,849
4,974,409
8,439,555
2,289,850
3,309,766
-
10,883,805
1,215,536 -
40,764
15,181,957
5,180,067
82,151
286,947,433
183,584,530
2,463,205
3,510,127
6,570,437
2,875,132
6,720,712
4,480,358
6,987,788
1,442,642
4,799,040
1,370,000
2,603,448
45,500
5,059,437
962,731
915,424
49,395
13,345,726
2,970,213
693,058
251,448,903
27.1
ADMINISTRATIVE EXPENSES
Salaries, allowances and amenities
Printing and stationery
Computer supplies
Rent, rates and taxes
Electricity, gas and water
Traveling and conveyance
Repair and maintenance
Postage, telephone and telegrams
Vehicle running and maintenance
Legal and professional
Auditors' remuneration
Entertainment
Donations
Fee and subscriptions/Training
Insurance
Hiring cost
Newspapers, books and periodicals
Depreciation
Amortization
Others
This includes employees retirement benet expense amounting to Rs. 7.77 (2016: Rs. 7.25) million.
78 Systems Limited Annual Report 2017 79
This includes employees retirement benet expense amounting to Rs. 0.89 (2016: Rs. 1.32) million.26.1
Note
2017 2016
Rupees Rupees
2017 2016
Rupees Rupees
Note
2017 2016
Rupees Rupees
28.
10.2
29.
30.
OTHER OPERATING EXPENSES
Provision for doubtful debts
Unbilled revenue and bad debts written off
OTHER INCOME
Income from nancial assets:
Prot on deposit accounts
Gain on short term investments
Exchange gain on translation of export debts
Interest on loan to subsidiary
Income from non-nancial assets:
Gain on disposal of property and equipment
Others
FINANCE COSTS
Markup on guarantee commission
Bank charges and commission
Markup
27,632,931
60,089,469
87,722,400
3,968,819
8,281,319
75,658,855
3,522,714
91,431,707
7,454,520
19,529,924
26,984,444
118,416,151
1,159,811
6,501,684
3,047,514
10,709,009
793,118
30,186,842
30,979,960
7,891,674
13,373,923
2,166,414
2,061,704
25,493,715
5,948,936
1,702,785
7,651,721
33,145,436
681,483
2,531,605
-
3,213,088
31.1 This represents tax chargeable under Normal Tax Regime on local sale of software and services. The income of the Company from export of software is exempt under clause 133 Part 1 of Second Schedule to the Income Tax Ordinance, 2001.
31.2 Reconciliation between accounting prot and tax expense for the year ended 31 December 2017 is meaningless in view of the minimum tax under section 153 read with clause 94 of Part IV of Second Schedule of Income Tax Ordinance, 2001.
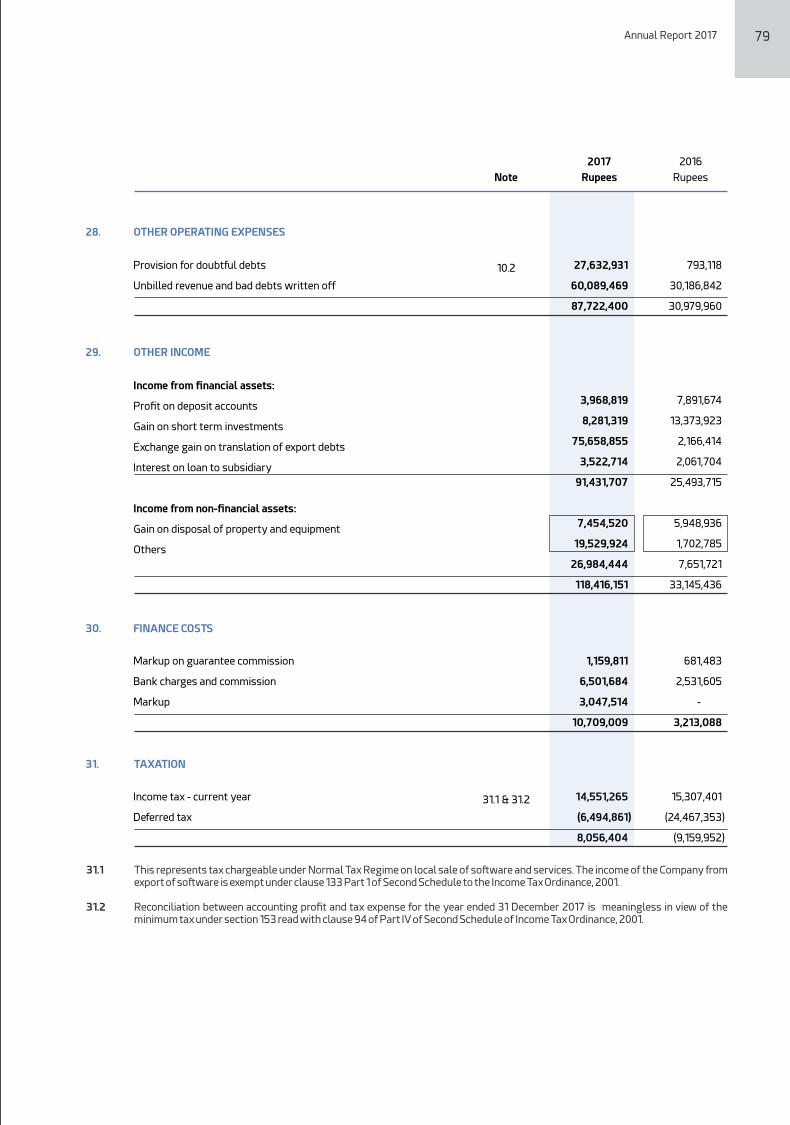
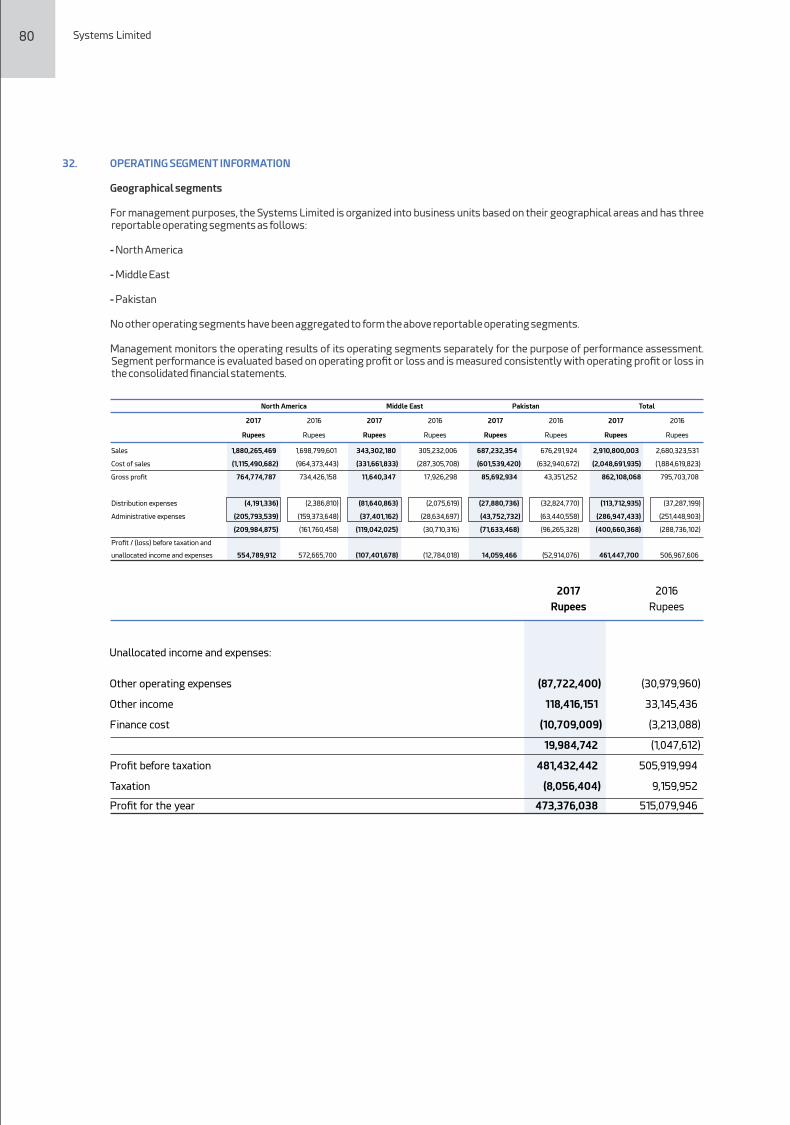
80 Systems Limited Annual Report 2017 81
32. OPERATING SEGMENT INFORMATION
Geographical segments
For management purposes, the Systems Limited is organized into business units based on their geographical areas and has three reportable operating segments as follows:
- North America
- Middle East
- Pakistan
No other operating segments have been aggregated to form the above reportable operating segments.
Management monitors the operating results of its operating segments separately for the purpose of performance assessment. Segment performance is evaluated based on operating prot or loss and is measured consistently with operating prot or loss in the consolidated nancial statements.
2017 2016
Sales 1,880,265,469
1,698,799,601
343,302,180
305,232,006
687,232,354
676,291,924
2,910,800,003
2,680,323,531
Cost of sales (1,115,490,682)
(964,373,443)
(331,661,833)
(287,305,708)
(601,539,420)
(632,940,672)
(2,048,691,935)
(1,884,619,823)
Gross prot 764,774,787
734,426,158
11,640,347
17,926,298
85,692,934
43,351,252
862,108,068
795,703,708
Distribution expenses (4,191,336) (2,386,810)
(81,640,863)
(2,075,619)
(27,880,736)
(32,824,770)
(113,712,935)
(37,287,199)
Administrative expenses (205,793,539) (159,373,648) (37,401,162) (28,634,697) (43,752,732) (63,440,558) (286,947,433) (251,448,903)
(209,984,875) (161,760,458) (119,042,025) (30,710,316) (71,633,468) (96,265,328) (400,660,368) (288,736,102)
Prot / (loss) before taxation and
unallocated income and expenses 554,789,912 572,665,700 (107,401,678) (12,784,018) 14,059,466 (52,914,076) 461,447,700 506,967,606
Rupees
North America Middle East Pakistan Total
Rupees
2016
Rupees
2017
Rupees
2017
Rupees
2016
Rupees
2017
Rupees
2016
Rupees
Unallocated income and expenses:
Other operating expenses (30,979,960)
Other income 33,145,436
Finance cost (3,213,088)
(1,047,612)
Prot before taxation 505,919,994
Taxation 9,159,952
Prot for the year 515,079,946
(87,722,400)
118,416,151
(10,709,009)
19,984,742
481,432,442
(8,056,404)
473,376,038
2017 2016
Rupees Rupees
32.1 Allocation of assets and liabilities
Segment operating assets
Property and equipment
Intangibles
Long term investments
Long term deposits
Deferred taxation - net
Unbilled revenue
Trade debts
Loans and advances
Trade deposits and short term prepayments
Interest accrued
Other receivable
Short term investments
Tax refunds due from government
Cash and bank balances
Total operating assets
Segment operating liabilities
Long term advances
Trade and other payables
Unearned revenue
Mark-up accrued on short term borrowings
Short term borrowings
Current portion of long term advances
Total operating liabilities
North America Middle East Pakistan Total
2016
557,598,452
51,467,435
51,077,980
6,130,852
25,276,863
320,894,130
1,281,814,345
107,710,905
59,561,630
11,863,416
150,365,370
253,000,000
98,958,341
183,200,188
3,158,919,907
10,910,791
226,689,126
14,387,586
-
-
6,109,697
258,097,200
Rupees
2017
884,773,411
60,306,397
51,077,980
17,336,739
31,771,724
388,018,078
1,140,871,164
143,600,657
103,870,280
13,486,671
183,663,700
225,000,000
142,084,484
444,255,392
3,830,116,677
12,218,784
333,485,673
65,532,595
2,795,246
200,000,000
4,906,222
618,938,520
Rupees
884,773,411
60,306,397
51,077,980
17,336,739
31,771,724
312,323,174
194,188,434
143,600,657
103,870,280
13,486,671
-
225,000,000
142,084,484
444,255,392
2,624,075,343
12,218,784
333,485,673
65,532,595
2,795,246
200,000,000
4,906,222
618,938,520
2017
Rupees
557,598,452
51,467,435
51,077,980
6,130,852
25,276,863
173,263,903
268,460,153
107,710,905
59,561,630
11,863,416
-
253,000,000
98,958,341
183,200,188
1,847,570,118
10,910,791
226,689,126
14,387,586
-
-
6,109,697
258,097,200
2016
Rupees
-
-
-
-
-
75,694,904
617,681,346
-
-
-
179,545,449
-
-
-
872,921,699
-
-
-
-
-
-
-
2017
Rupees
-
-
-
-
-
147,630,227
366,894,594
-
-
-
147,772,044
-
-
-
662,296,865
-
-
-
-
-
-
-
2016
Rupees
-
-
-
-
-
-
329,001,384
-
-
-
4,118,251
-
-
-
333,119,635
-
-
-
-
-
-
-
2017
Rupees
-
-
-
-
-
-
646,459,598
-
-
-
2,593,326
-
-
-
649,052,924
-
-
-
-
-
-
-
2016
Rupees
33. TRANSACTIONS WITH RELATED PARTIES
The related parties of the Company comprise subsidiary, associated companies, companies in which directors are interested, staff retirement funds and directors and key management personnel (Note 34). The Company in the normal course of business carries out transactions with various related parties. Amounts due from and to related parties are shown under respective notes to the nancial statements. Other signicant transactions with related parties are as follows:
2017 2016
Undertaking Relation Rupees Rupees
Subsidiary 42,612,213
54,946,797
3,522,714
2,061,704
Subsidiary Sales 313,872,760
256,448,595
122,599,615
51,812,579
Sales 1,839,197,405
1,698,799,601
14,315,997
51,812,580
Joint Operation 75,026,039
-
272,690
-
75,408,409 71,809,824
UUS Joint Venture (Private) Limited Payment for expenses
Interest income
Staff retirement funds
E-Processing Systems (Private) Limited
TechVista Systems FZ LLC - UAE
Visionet Systems Incorporation - USA
Interest income
Payment for expenses
Contribution
Nature of transaction
Payment for expenses
Common
Directorship Reimbursement of expenses
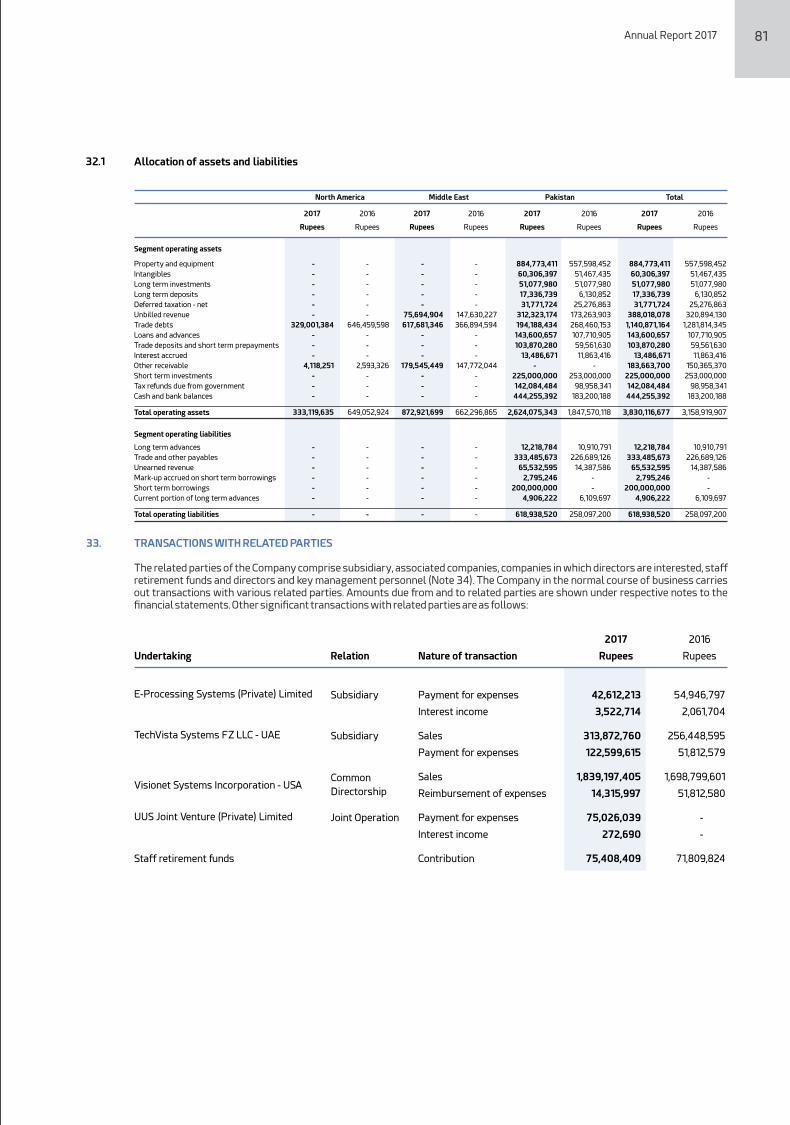
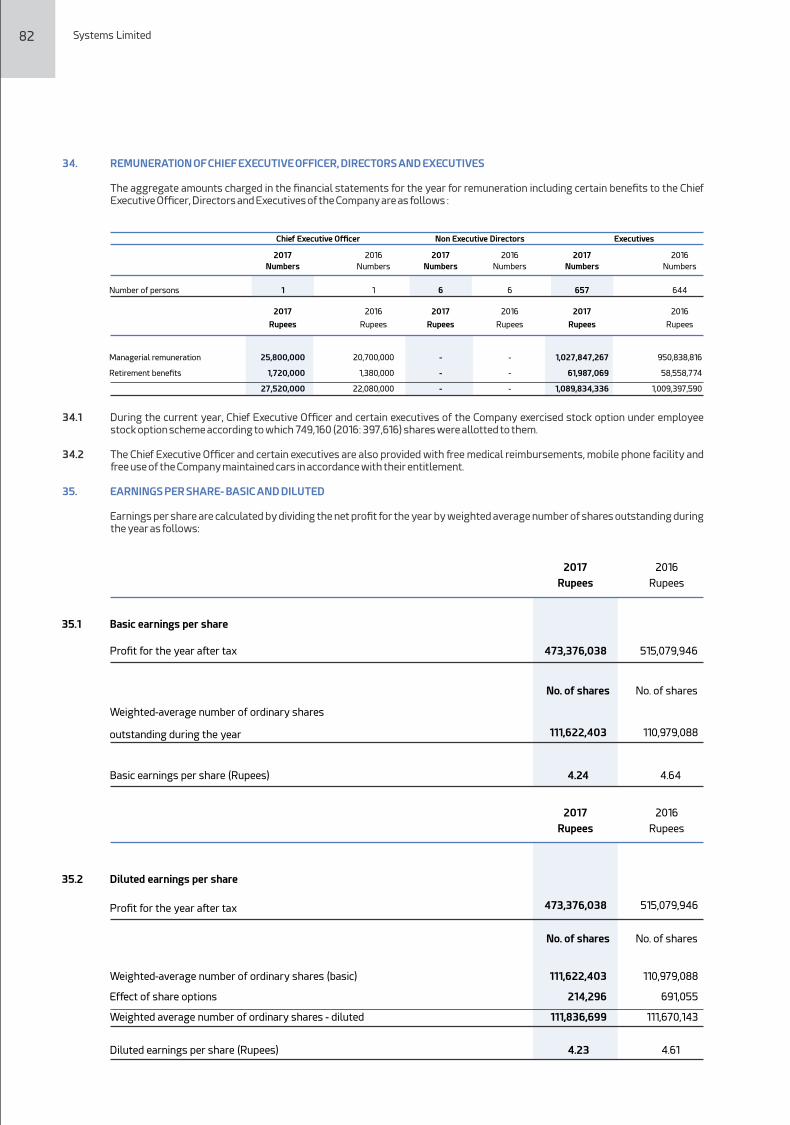
505,919,994
72,640,730)
19,783,692
(2,166,414)
(13,373,923)
38,211,812
(5,948,936)
793,118
30,186,842
(2,061,704)
-
3,213,088
647,198,299
(172,103,276)
(229,377,095)
36,896,860
(11,460,045)
(62,344,669)
(1,779,009)
(440,167,234)
207,031,065
36. CASH GENERATED FROM OPERATIONS
Prot before taxation
Adjustment for:
Depreciation on property and equipment 5.3
Amortization of intangibles 6
Exchange gain on translation of export debts 29
Gain on short term investments 29
Share based payment expense
Gain on disposal of property and equipment 29
Provision for doubtful debts 28
Bad debts - written off 28
Interest on loan to subsidiary 29
Reversal of Worker's Welfare Fund 20.1
Finance costs 30
Working capital changes
(Increase) / Decrease in current assets
Unbilled revenue - net
Trade debts
Loans and advances
Trade deposits and short term prepayments
Other receivables
Increase / (Decrease) in Trade and other payables
Cash generated from operations
481,432,442
73,969,190
25,572,580
(75,658,855)
(8,281,319)
14,344,060
(7,454,520)
27,632,931
60,089,469
(3,522,714)
(17,930,514)
10,709,009
580,901,759
(15,978,939)
144,425,532
(35,889,752)
(44,308,650)
(33,298,330)
127,701,889
142,651,750
723,553,509
82 Systems Limited Annual Report 2017 83
Note
2017 2016
Rupees Rupees
37. FINANCIAL RISK MANAGEMENT
Financial instruments comprise deposits, unbilled revenue, interest accrued, trade debts, advances to employees against salaries, loans, other receivables, cash and bank balances and short term investments ,trade and other payables and mark up accrued on short term borrowings..
The Company has exposure to the following risks from its use of nancial instruments:
- Market risk
- Credit risk
- Liquidity risk
The Board of Directors has the overall responsibility for the establishment and oversight of Company’s risk management framework. The Board is also responsible for developing and monitoring the Company's risk management policies.
This note represents information about the Company’s exposure to each of the above risks, it's objectives, policies and processes for measuring and managing risk, and it's management of capital.
The Company's risk management policies are established to identify and analyze the risks faced by the Company, to set appropriate risk limits and controls, and to monitor risks and adherence to limits. Risk management policies and systems are reviewed regularly to react to changes in market conditions and the Company's activities.
Managerial remuneration 25,800,000
20,700,000
-
-
1,027,847,267
950,838,816
Retirement benets 1,720,000
1,380,000
-
-
61,987,069
58,558,774
27,520,000
22,080,000
-
-
1,089,834,336
1,009,397,590
Rupees
2017 2016 2017 20172016 2016
Rupees RupeesRupees Rupees Rupees
34.1 During the current year, Chief Executive Officer and certain executives of the Company exercised stock option under employee stock option scheme according to which 749,160 (2016: 397,616) shares were allotted to them.
34.2 The Chief Executive Officer and certain executives are also provided with free medical reimbursements, mobile phone facility and free use of the Company maintained cars in accordance with their entitlement.
35. EARNINGS PER SHARE- BASIC AND DILUTED
Earnings per share are calculated by dividing the net prot for the year by weighted average number of shares outstanding during the year as follows:
35.1 Basic earnings per share
Prot for the year after tax 473,376,038 515,079,946
Weighted-average number of ordinary shares
outstanding during the year 111,622,403 110,979,088
Basic earnings per share (Rupees) 4.24 4.64
35.2 Diluted earnings per share
Prot for the year after tax 473,376,038 515,079,946
Weighted-average number of ordinary shares (basic) 111,622,403 110,979,088
Effect of share options 214,296 691,055
Weighted average number of ordinary shares - diluted 111,836,699 111,670,143
Diluted earnings per share (Rupees) 4.23 4.61
No. of shares
2017 2016
Rupees Rupees
No. of shares
2017 2016
Rupees Rupees
No. of shares No. of shares
34. REMUNERATION OF CHIEF EXECUTIVE OFFICER, DIRECTORS AND EXECUTIVES
The aggregate amounts charged in the nancial statements for the year for remuneration including certain benets to the Chief Executive Officer, Directors and Executives of the Company are as follows :
2017 2016 2017 2017
Number of persons 1 1 6 6 657 644
Numbers
ExecutivesChief Executive Officer Non Executive Directors
Numbers NumbersNumbers NumbersNumbers
2016 2016
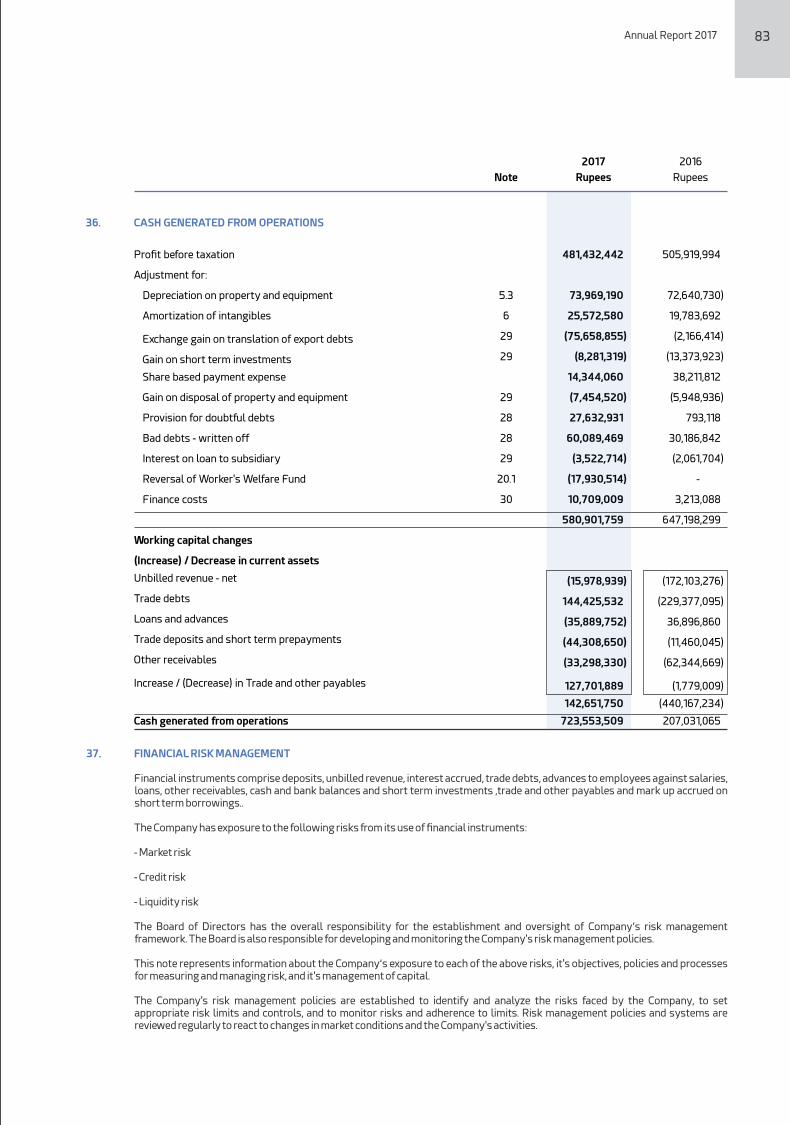
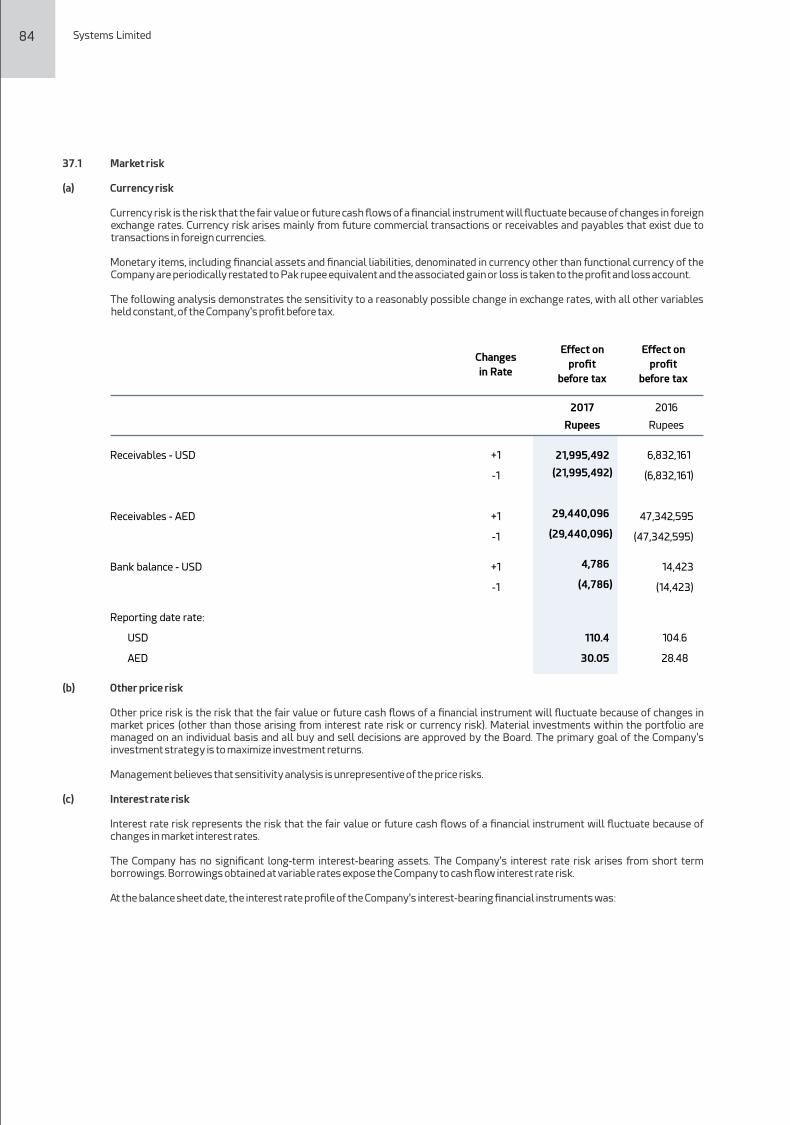
Short term investments +1
-1
+1
-1
Bank balances - deposit accounts +1
-1
+1
-1
2017
2016
Changes
in interest
rate
Effects on prot
before tax
2017
2016
84 Systems Limited Annual Report 2017 85
20162017
Rupees Rupees
Receivables - USD +1 21,995,492
6,832,161
-1 (21,995,492)
(6,832,161)
Receivables - AED +1 29,440,096
47,342,595
-1 (29,440,096)
(47,342,595)
Bank balance - USD +1 4,786
14,423
-1 (4,786)
(14,423)
Reporting date rate:
USD 110.4 104.6
AED 30.05 28.48
Changes
in Rate
Effect on
prot
before tax
Effect on
prot
before tax
37.1 Market risk
(a) Currency risk
Currency risk is the risk that the fair value or future cash ows of a nancial instrument will uctuate because of changes in foreign exchange rates. Currency risk arises mainly from future commercial transactions or receivables and payables that exist due to transactions in foreign currencies.
Monetary items, including nancial assets and nancial liabilities, denominated in currency other than functional currency of the Company are periodically restated to Pak rupee equivalent and the associated gain or loss is taken to the prot and loss account.
The following analysis demonstrates the sensitivity to a reasonably possible change in exchange rates, with all other variables held constant, of the Company's prot before tax.
(b) Other price risk
Other price risk is the risk that the fair value or future cash ows of a nancial instrument will uctuate because of changes in market prices (other than those arising from interest rate risk or currency risk). Material investments within the portfolio are managed on an individual basis and all buy and sell decisions are approved by the Board. The primary goal of the Company's investment strategy is to maximize investment returns.
Management believes that sensitivity analysis is unrepresentive of the price risks.
(c) Interest rate risk
Interest rate risk represents the risk that the fair value or future cash ows of a nancial instrument will uctuate because of changes in market interest rates.
The Company has no signicant long-term interest-bearing assets. The Company's interest rate risk arises from short term borrowings. Borrowings obtained at variable rates expose the Company to cash ow interest rate risk.
At the balance sheet date, the interest rate prole of the Company's interest-bearing nancial instruments was:
2017 2016
Rupees Rupees
Floating rate instruments
Financial assets
Short term investments
Bank balances - deposit accounts
253,000,000
142,712,134
395,712,134
Financial liabilities
Short term borrowings
225,000,000
388,335,699
613,335,699
200,000,000 -
Fair value sensitivity analysis for xed rate instruments
The Company does not account for any xed rate nancial assets and liabilities at fair value through prot or loss. Therefore, a change in interest rate at the balance sheet date would not affect prot or loss of the Company.
Cash ow sensitivity analysis for variable rate instruments
The following analysis demonstrates the sensitivity to a change in interest rates, with all other variables held constant, of the Company's prot before tax. This analysis is prepared assuming the amounts of oating rate instruments outstanding at balance sheet dates were outstanding for the whole year.
37.2 Credit risk
Credit risk represents the accounting loss that would be recognized at the reporting date if counter-parties failed completely to perform as contracted. The Company does not have signicant exposure to any individual counter-party. To reduce exposure to credit risk the Company has developed a formal approval process whereby credit limits are applied to its customers. The management also continuously monitors the credit exposure towards the customers and makes provision against those balances considered doubtful of recovery. Outstanding customer receivables are regularly monitored.
The credit risk on liquid funds is limited because the counter parties are banks and mutual funds with reasonably high credit ratings. The Company believes that it is not exposed to major concentration of credit risk as its exposure is spread over a large number of counter parties and subscribers in case of trade debts.
The carrying amount of nancial assets represents the maximum credit exposure. The maximum exposure to credit risk at the reporting date was as follows:
2,250,000
(2,250,000)
2,530,000
(2,530,000)
3,883,357
(3,883,357)
1,427,121
(1,427,121)
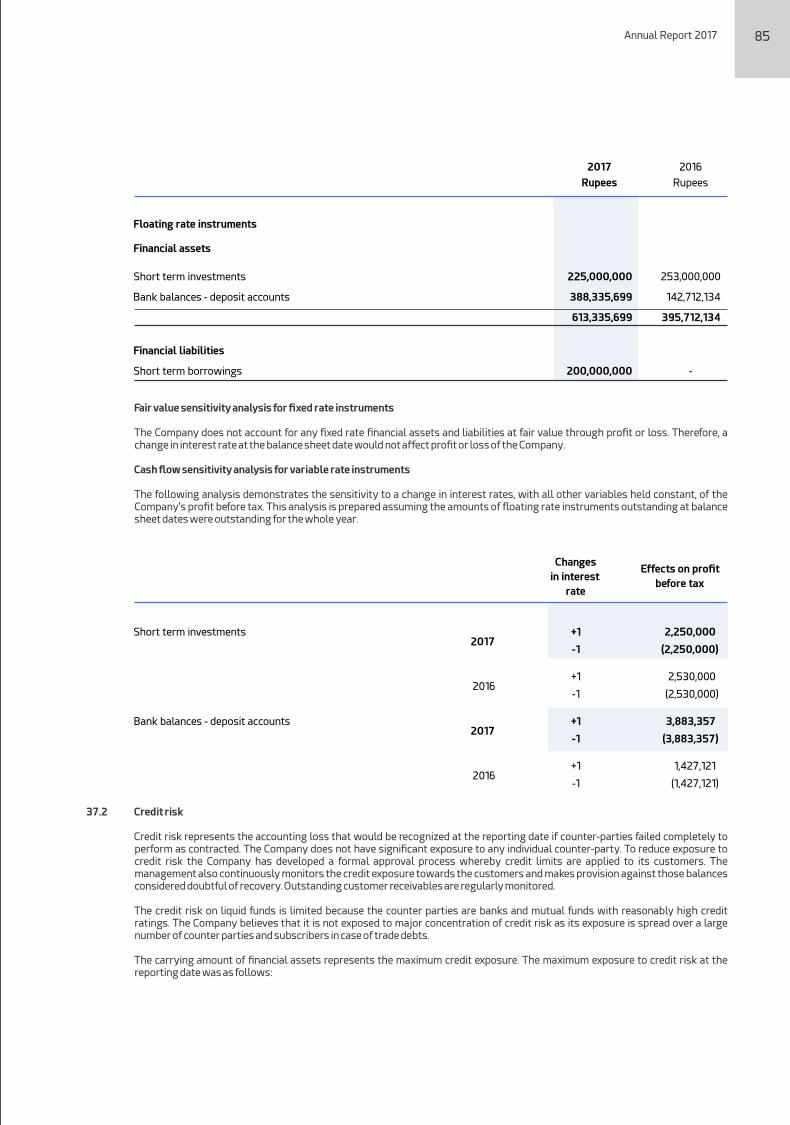
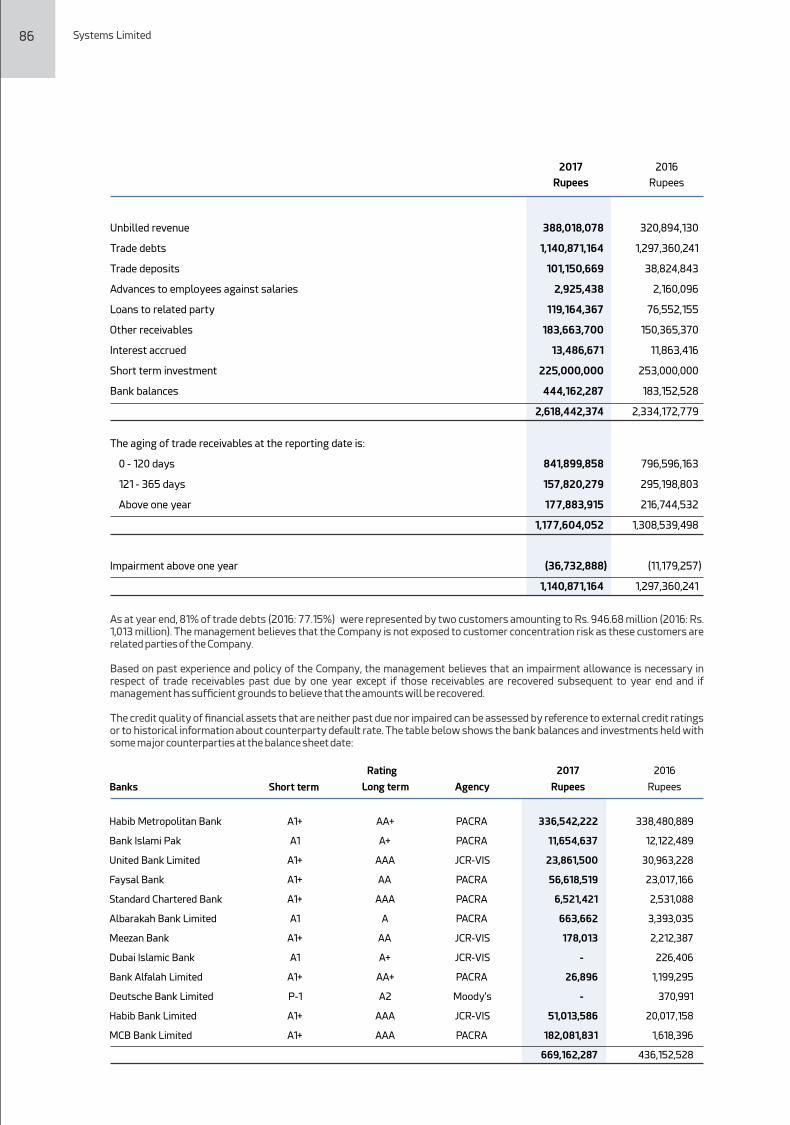
37.5 Financial instruments by categories
Assets as per balance sheet
Long term deposits
Unbilled revenue
Trade debts
Loans and advances
Security deposits
Interest accrued
Other receivables
Short term investments
Cash and bank balances
2017
Carrying
amount
Contractual cash
ows
Less than
one year
One to
ve years
More than ve
years
Trade and other payables 324,204,498
324,204,498
324,204,498
-
-
Short term borrowings 200,000,000
200,000,000
200,000,000
-
-
Mark-up accrued on short
term borrowings 2,795,246
2,795,246
2,795,246
-
-
526,999,744 526,999,744 526,999,744 - -
The following are the contractual maturities of nancial liabilities as at 31 December 2016:
Trade and other payables 189,318,605
189,318,605
189,318,605
-
-
189,318,605
189,318,605
189,318,605
-
-
RupeesRupeesRupeesRupeesRupees
Carrying
amount
Contractual cash
ows
Less than
one year
One to
ve years
More than ve
years
RupeesRupeesRupeesRupeesRupees
86 Systems Limited Annual Report 2017 87
2017 2016
Rupees Rupees
Unbilled revenue
Trade debts
Trade deposits
Advances to employees against salaries
Loans to related party
Other receivables
Interest accrued
Short term investment
Bank balances
The aging of trade receivables at the reporting date is:
0 - 120 days
121 - 365 days
Above one year
Impairment above one year
388,018,078
1,140,871,164
101,150,669
2,925,438
119,164,367
183,663,700
13,486,671
225,000,000
444,162,287
2,618,442,374
841,899,858
157,820,279
177,883,915
1,177,604,052
(36,732,888)
1,140,871,164
320,894,130
1,297,360,241
38,824,843
2,160,096
76,552,155
150,365,370
11,863,416
253,000,000
183,152,528
2,334,172,779
796,596,163
295,198,803
216,744,532
1,308,539,498
(11,179,257)
1,297,360,241
As at year end, 81% of trade debts (2016: 77.15%) were represented by two customers amounting to Rs. 946.68 million (2016: Rs. 1,013 million). The management believes that the Company is not exposed to customer concentration risk as these customers are related parties of the Company.
Based on past experience and policy of the Company, the management believes that an impairment allowance is necessary in respect of trade receivables past due by one year except if those receivables are recovered subsequent to year end and if management has sufficient grounds to believe that the amounts will be recovered.
The credit quality of nancial assets that are neither past due nor impaired can be assessed by reference to external credit ratings or to historical information about counterparty default rate. The table below shows the bank balances and investments held with some major counterparties at the balance sheet date:
2017 2016
Short term Long term Agency
Habib Metropolitan Bank A1+ AA+ PACRA 336,542,222
338,480,889
Bank Islami Pak A1 A+ PACRA 11,654,637
12,122,489
United Bank Limited A1+ AAA JCR-VIS 23,861,500
30,963,228
Faysal Bank A1+ AA PACRA 56,618,519
23,017,166
Standard Chartered Bank A1+ AAA PACRA 6,521,421
2,531,088
Albarakah Bank Limited A1 A PACRA 663,662
3,393,035
Meezan Bank A1+ AA JCR-VIS 178,013
2,212,387
Dubai Islamic Bank A1 A+ JCR-VIS -
226,406
Bank Alfalah Limited A1+ AA+ PACRA 26,896
1,199,295
Deutsche Bank Limited P-1 A2 Moody's -
370,991
Habib Bank Limited A1+ AAA JCR-VIS 51,013,586
20,017,158
MCB Bank Limited A1+ AAA PACRA 182,081,831 1,618,396
669,162,287 436,152,528
Rupees
Rating
Banks Rupees
37.3 Liquidity risk
Liquidity risk is the risk that the Company will not be able to meet its nancial obligations as they fall due. The Company's approach to managing liquidity is to ensure as far as possible to always have sufficient liquidity to meet its liabilities when due. The following are the contractual maturities of nancial liabilities:
The following are the contractual maturities of nancial liabilities as at 31 December 2017:
37.4 Fair values of nancial assets and liabilities
Fair value of available-for-sale nancial assets is derived from quoted market prices in active markets, if available.
The carrying values of other nancial assets and nancial liabilities reected in nancial statements approximate their fair values. Fair value is determined on the basis of objective evidence at each reporting date.
Cash and
cash
equivalents
-
-
-
-
-
-
-
-
444,255,392
444,255,392
Rupees
Loans and
receivable
17,336,739
388,018,078
1,140,871,164
143,600,657
83,813,930
13,486,671
183,663,700
-
-
1,970,790,939
Rupees
Held to
maturity
-
-
-
-
-
-
-
225,000,000
-
225,000,000
Rupees
17,336,739
388,018,078
1,140,871,164
143,600,657
83,813,930
13,486,671
183,663,700
225,000,000
444,255,392
2,640,046,331
Total
Rupees
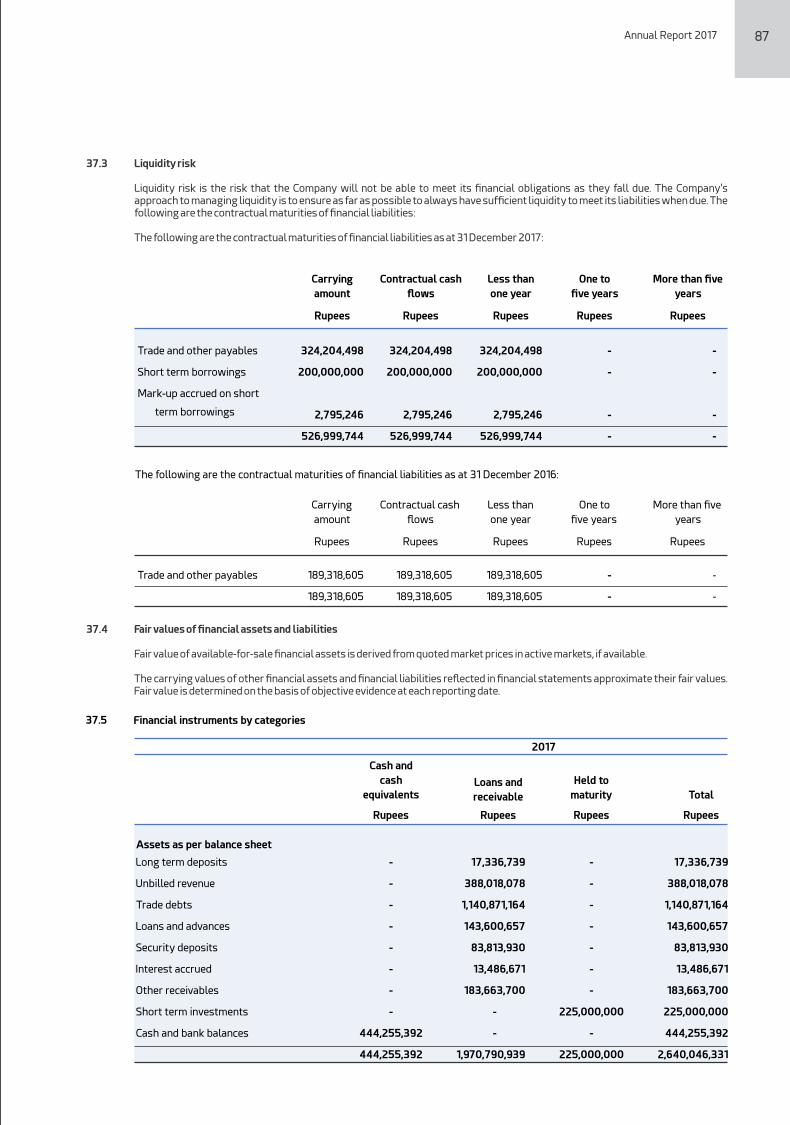
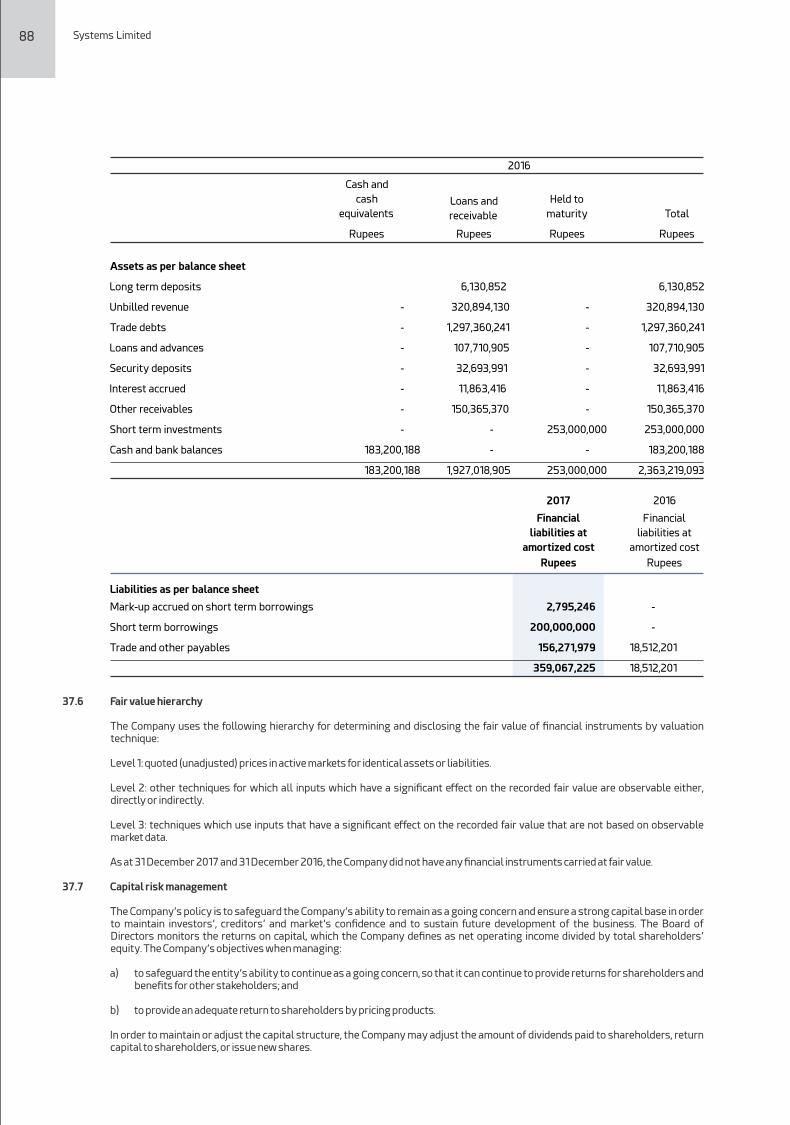
31.2%
7.2%
34.3%
72.7%
% of
investment
as size of
the fund
Rupees
95,435,330
22,000,000
105,000,000
222,435,330
Investments
104,720,966
22,000,000
106,241,364
232,962,330
Rupees
37.8%
7.9%
38.3%
84.0%
% of
investment
as size of
the fund
Investments
Mutual Funds
Defense saving certicates
Term Deposit Receipts
38.3 The above information is based on unaudited nancial statements of the provident fund.
20162017
Description
2017 2016
Rupees Rupees
Un-audited Un-audited
Size of the fund (net assets) 305,732,683
277,284,610
Cost of investment made (actual investments made) 38.2 222,435,330
232,962,330
Percentage of investment made (cost of investments) 72.75% 84.02%
Fair value of investments 309,373,999
298,488,342
The debt - to- equity ratio as to 31 December is as follows
Net debt
Total equity
Capital gearing
ratio
-
3,211,178,157
-
-
2,916,368,603
-
2017 2016
Financial
liabilities at
amortized cost
Financial
liabilities at
amortized cost
Liabilities as per balance sheet
Rupees Rupees
Mark-up accrued on short term borrowings 2,795,246 -
Short term borrowings 200,000,000 -
Trade and other payables 156,271,979 18,512,201
359,067,225 18,512,201
88 Systems Limited Annual Report 2017 89
2016
Cash and
cash
equivalents
Rupees
Loans and
receivable
Rupees
Held to
maturity
Rupees
Total
Rupees
Long term deposits 6,130,852 6,130,852
Unbilled revenue - 320,894,130 - 320,894,130
Trade debts - 1,297,360,241 - 1,297,360,241
Loans and advances - 107,710,905 - 107,710,905
Security deposits - 32,693,991 - 32,693,991
Interest accrued - 11,863,416 - 11,863,416
Other receivables - 150,365,370 - 150,365,370
Short term investments - - 253,000,000 253,000,000
Cash and bank balances 183,200,188 - - 183,200,188
183,200,188 1,927,018,905 253,000,000 2,363,219,093
Assets as per balance sheet
37.6 Fair value hierarchy
The Company uses the following hierarchy for determining and disclosing the fair value of nancial instruments by valuation technique:
Level 1: quoted (unadjusted) prices in active markets for identical assets or liabilities.
Level 2: other techniques for which all inputs which have a signicant effect on the recorded fair value are observable either, directly or indirectly.
Level 3: techniques which use inputs that have a signicant effect on the recorded fair value that are not based on observable market data.
As at 31 December 2017 and 31 December 2016, the Company did not have any nancial instruments carried at fair value.
37.7 Capital risk management
The Company’s policy is to safeguard the Company’s ability to remain as a going concern and ensure a strong capital base in order to maintain investors’, creditors’ and market’s condence and to sustain future development of the business. The Board of Directors monitors the returns on capital, which the Company denes as net operating income divided by total shareholders’ equity. The Company’s objectives when managing:
a) to safeguard the entity’s ability to continue as a going concern, so that it can continue to provide returns for shareholders and benets for other stakeholders; and
b) to provide an adequate return to shareholders by pricing products.
In order to maintain or adjust the capital structure, the Company may adjust the amount of dividends paid to shareholders, return capital to shareholders, or issue new shares.
Consistent with the industry norms, the Company monitors its capital on the basis of gearing ratio. The ratio is calculated as net debt divided by total capital. Net debt is calculated as total borrowings as shown in the balance sheet less cash and cash equivalent. Total capital is calculated as ‘equity’ as shown in the balance sheet plus net debt (as dened above).
2017 2016
Rupees Rupees
Since the Company, has healthy cash ows at year end which is primarily because of higher revenue resulting in prots and increased equity due to new shares issued, therefore, it does not carry any long term debts at 31 December 2017 except a short term running nance facility of Rs. 200 million.
The Company is not subject to any externally-imposed capital requirements.
38. PROVIDENT FUND TRUST
38.1 The Company has maintained an employee provident fund trust and investments out of provident fund have been made in accordance with the provisions of section 218 of the Companies Act 2017, and the rules formulated for this purpose. The salient information of the fund is as follows:
Note
38.2 Break-up of investments of provident fund
Break-up of investments in terms of amount and percentage of the size of the provident fund are as follows:
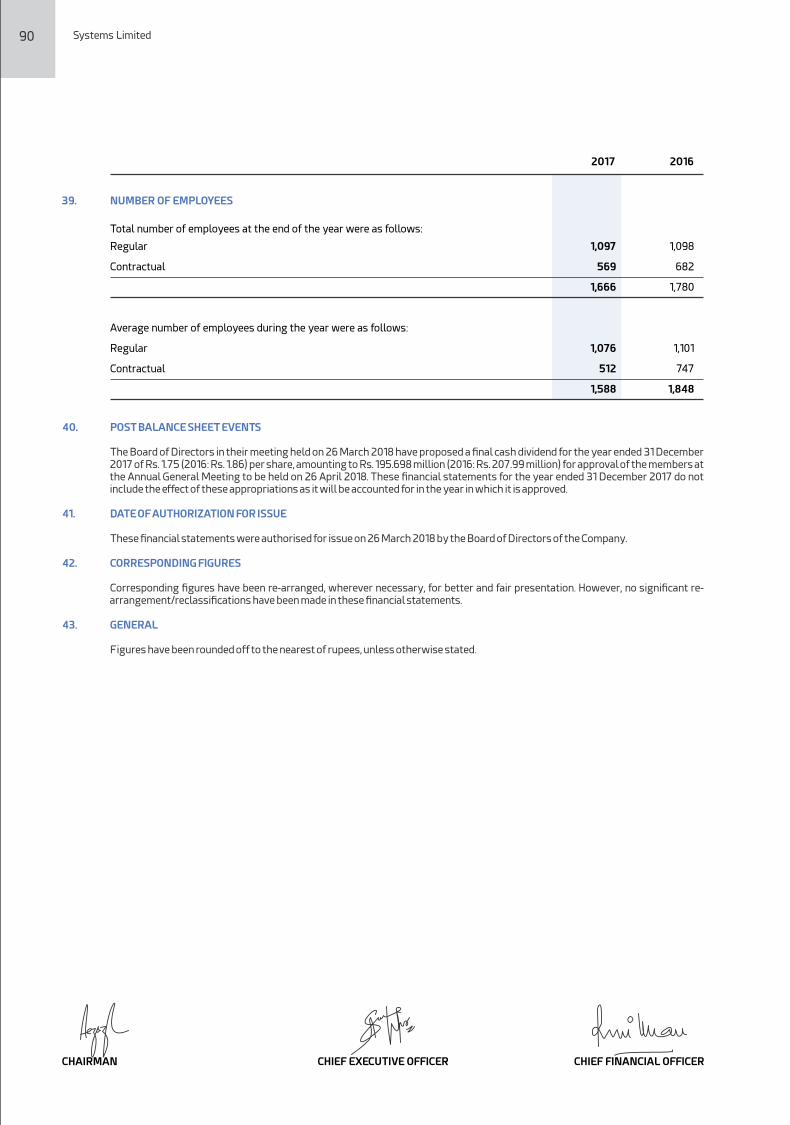
90 Systems Limited
39. NUMBER OF EMPLOYEES
2017 2016
Total number of employees at the end of the year were as follows:
Regular 1,097 1,098
Contractual 569 682
1,666 1,780
Average number of employees during the year were as follows:
Regular 1,076 1,101
Contractual 512 747
1,588 1,848
40. POST BALANCE SHEET EVENTS
The Board of Directors in their meeting held on 26 March 2018 have proposed a nal cash dividend for the year ended 31 December 2017 of Rs. 1.75 (2016: Rs. 1.86) per share, amounting to Rs. 195.698 million (2016: Rs. 207.99 million) for approval of the members at the Annual General Meeting to be held on 26 April 2018. These nancial statements for the year ended 31 December 2017 do not include the effect of these appropriations as it will be accounted for in the year in which it is approved.
41. DATE OF AUTHORIZATION FOR ISSUE
These nancial statements were authorised for issue on 26 March 2018 by the Board of Directors of the Company.
42. CORRESPONDING FIGURES
Corresponding gures have been re-arranged, wherever necessary, for better and fair presentation. However, no signicant re-arrangement/reclassications have been made in these nancial statements.
43. GENERAL
Figures have been rounded off to the nearest of rupees, unless otherwise stated.
CHIEF EXECUTIVE OFFICER CHIEF FINANCIAL OFFICERCHAIRMAN
Systems LimitedConsolidated Financial Statements
92 Systems Limited
Auditors’ Report to the Members
We have audited the annexed consolidated nancial statements comprising consolidated Balance Sheet of Systems Limited (the Holding Company) and its subsidiary companies (together referred to as Group) as at 31 December 2017 and the related consolidated Prot and Loss Account, consolidated Statement of Comprehensive Income, consolidated Cash Flow Statement and consolidated Statement of Changes in Equity together with the notes forming part thereof, for the year then ended. We have also expressed separate opinions on the nancial statements of the Holding Company and its subsidiary company namely E-Processing Systems (Private) Limited and subsidiary company namely TechVista Systems FZ-LLC which was audited by another rm of auditors whose audit report has been furnished to us and our opinion, in so far as it relates to the amounts included for such company, is based solely on the report of such other auditors.
These nancial statements are the responsibility of the Holding Company's management. Our responsibility is to express an opinion on these nancial statements based on our audit.
Our audit was conducted in accordance with the International Standards on Auditing and accordingly included such tests of accounting records and such other auditing procedures as we considered necessary in the circumstances.
In our opinion, the consolidated nancial statements present fairly the nancial position of the Holding Company and its subsidiary companies as at 31 December 2017 and the results of their operations for the year then ended.
Chartered Accountants
Engagement Partner: Naseem Akbar
Date: 29 March 2018Lahore
Annual Report 2017 93
Consolidated Balance Sheetas at 31 December 2017
2017 2016
Note Rupees Rupees
5
6
7
8
9
10
11
12
13
14
15
16
17
18
19
20
21
22
896,628,030
146,681,884
20,342,739
31,771,724 1,095,424,377
491,012,735
1,009,749,395
63,760,802
125,030,318
374,882
136,723,252
225,000,000
141,044,878
697,875,255
2,890,571,517
3,985,995,894
2,000,000,000
1,118,276,520
484,864,324
1,609,551,095
3,212,691,939
11,930,892
3,224,622,831
12,218,784
9,010,703
21,229,487
431,207,930
90,810,264
2,795,246
210,423,914
4,906,222
740,143,576
3,985,995,894
571,175,127
118,945,145
9,136,852
25,276,863 724,533,987
393,659,781
1,108,405,149
33,871,434
67,903,663
2,274,342
150,344,859
253,000,000
98,958,341
274,133,403
2,382,550,972
3,107,084,959
1,500,000,000
1,110,784,920
460,774,513
1,244,108,681
2,815,668,114
(15,568,020)
2,800,100,094
10,910,791
4,009,766
14,920,557
271,567,025
14,387,586
-
-
6,109,697
292,064,308
3,107,084,959
ASSETS
Non-current assets
Property and equipment
Intangibles
Long term deposits
Deferred taxation - net
Current assets
Unbilled revenue
Trade debts
Loans and advances
Trade deposits and short term prepayments
Interest accrued
Other receivable
Short term investments
Tax refunds due from the Government
Cash and bank balances
TOTAL ASSETS
EQUITY AND LIABILITIES
Share capital and reserves
Authorized share capital
200,000,000 (2016: 150,000,000) ordinary shares of Rs. 10 each
Issued, subscribed and paid up share capital
Capital reserves
Unappropriated prot
Non-controlling interest
Non-current liabilities
Long term advances
Provision for gratuity
Current liabilities
Trade and other payables
Unearned revenue
Mark-up accrued on short term borrowings
Short term borrowings
Current portion of long term advances
TOTAL EQUITY AND LIABILITIES
CONTINGENCIES AND COMMITMENTS
The annexed notes from 1 to 42 form an integral part of these consolidated nancial statements.
CHIEF EXECUTIVE OFFICER CHIEF FINANCIAL OFFICERCHAIRMAN
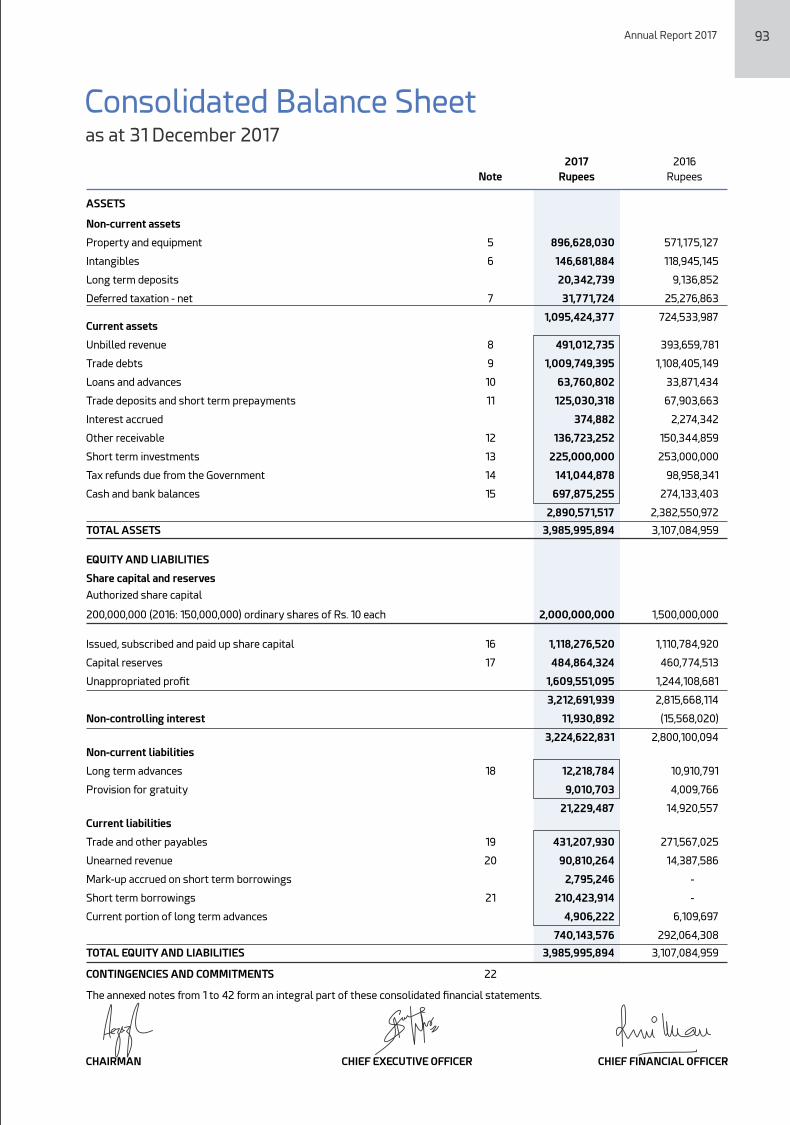
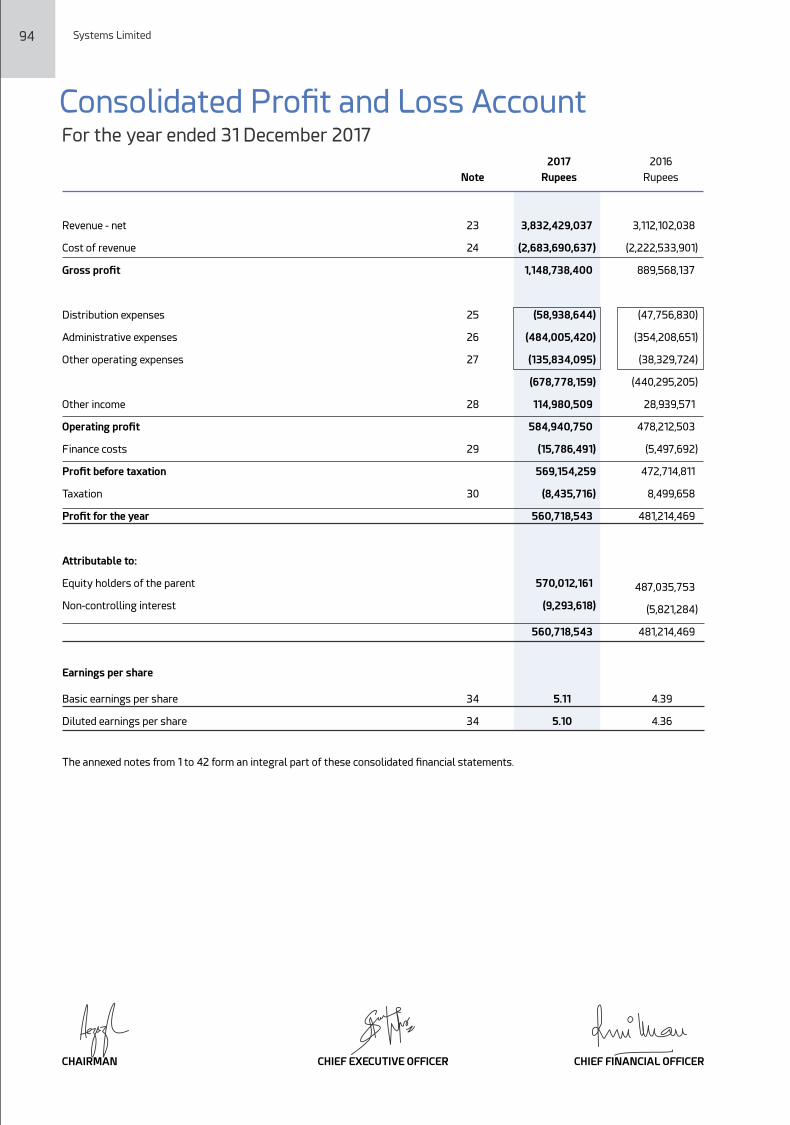
3,832,429,037
(2,683,690,637)
1,148,738,400
(58,938,644)
(484,005,420)
(135,834,095)
(678,778,159)
114,980,509
584,940,750
(15,786,491)
569,154,259
(8,435,716)
560,718,543
570,012,161
(9,293,618)
560,718,543
94 Systems Limited
Consolidated Prot and Loss AccountFor the year ended 31 December 2017
2017 2016
Note Rupees Rupees
23
24
25
26
27
28
29
30
3,112,102,038
(2,222,533,901)
889,568,137
(47,756,830)
(354,208,651)
(38,329,724)
(440,295,205)
28,939,571
478,212,503
(5,497,692)
472,714,811
8,499,658
481,214,469
487,035,753
(5,821,284)
481,214,469
34 5.11 4.39
34 5.10 4.36
Revenue - net
Cost of revenue
Gross prot
Distribution expenses
Administrative expenses
Other operating expenses
Other income
Operating prot
Finance costs
Prot before taxation
Taxation
Prot for the year
Attributable to:
Equity holders of the parent
Non-controlling interest
Earnings per share
Basic earnings per share
Diluted earnings per share
The annexed notes from 1 to 42 form an integral part of these consolidated nancial statements.
Prot for the year
Other comprehensive income
Exchange differences on translation of foreign operation
Total comprehensive income for the year, net of tax
Attributable to:
Equity holders of the parent
Non-controlling interest
The annexed notes from 1 to 42 form an integral part of these consolidated nancial statements.
Other comprehensive income to be reclassied to prot and loss account in
subsequent periods (net of tax):
Other comprehensive income not to be reclassied to prot or loss in subsequent
periods:
560,718,543
2,148,462
562,867,005
572,160,623
(9,293,618)
562,867,005
-
481,214,469
(349,796)
480,864,673
486,685,957
(5,821,284)
480,864,673
-
Annual Report 2017 95
Consolidated Statement of Comprehensive Income
2017 2016
Rupees Rupees
For the year ended 31 December 2017
CHIEF EXECUTIVE OFFICER CHIEF FINANCIAL OFFICERCHAIRMAN CHIEF EXECUTIVE OFFICER CHIEF FINANCIAL OFFICERCHAIRMAN
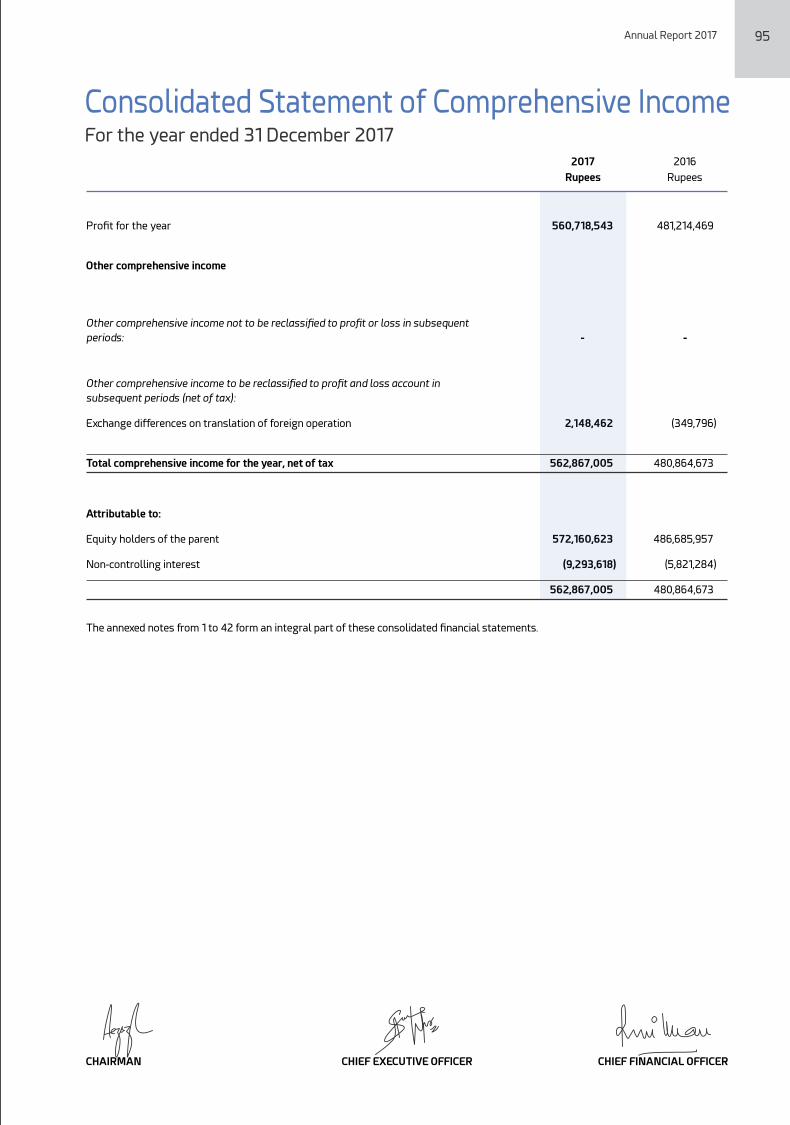
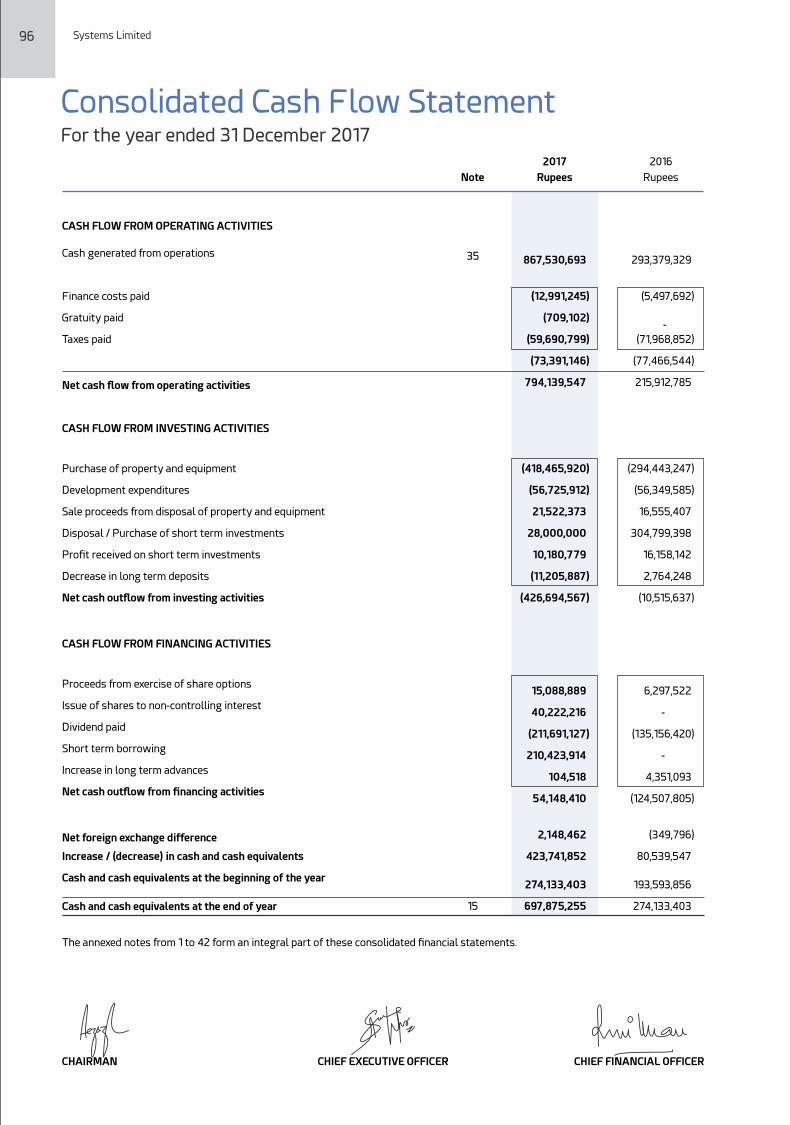
CASH FLOW FROM OPERATING ACTIVITIES
Cash generated from operations
Finance costs paid
Gratuity paid
Taxes paid
Net cash ow from operating activities
CASH FLOW FROM INVESTING ACTIVITIES
Purchase of property and equipment
Development expenditures
Sale proceeds from disposal of property and equipment
Disposal / Purchase of short term investments
Prot received on short term investments
Decrease in long term deposits
Net cash outow from investing activities
CASH FLOW FROM FINANCING ACTIVITIES
Proceeds from exercise of share options
Issue of shares to non-controlling interest
Dividend paid
Short term borrowing
Increase in long term advances
Net cash outow from nancing activities
Net foreign exchange difference
Increase / (decrease) in cash and cash equivalents
Cash and cash equivalents at the beginning of the year
Cash and cash equivalents at the end of year
The annexed notes from 1 to 42 form an integral part of these consolidated nancial statements.
96 Systems Limited
Consolidated Cash Flow StatementFor the year ended 31 December 2017
2017 2016
Note Rupees Rupees
293,379,329
(5,497,692)
-
(71,968,852)
(77,466,544)
215,912,785
(294,443,247)
(56,349,585)
16,555,407
304,799,398
16,158,142
2,764,248
(10,515,637)
6,297,522
-
(135,156,420)
-
4,351,093
(124,507,805)
(349,796)
80,539,547
193,593,856
274,133,403
867,530,693
(12,991,245)
(709,102)
(59,690,799)
(73,391,146)
794,139,547
(418,465,920)
(56,725,912)
21,522,373
28,000,000
10,180,779
(11,205,887)
(426,694,567)
15,088,889
40,222,216
(211,691,127)
210,423,914
104,518
54,148,410
2,148,462
423,741,852
274,133,403
697,875,255
35
15
Annual Report 2017 97
Consolidated Statement of Changes in Equity
CH
IEF
EX
EC
UT
IVE
OF
FIC
ER
CH
IEF
FIN
AN
CIA
L O
FF
ICE
RC
HA
IRM
AN
For the year ended 31 December 2017
Ba
lan
ce a
s o
n 0
1 Ja
nu
ary
20
16
Pro
t
for
the
ye
ar
Oth
er
com
pre
he
nsi
ve
inco
me
fo
r th
e y
ea
r
To
tal
com
pre
he
nsi
ve
inco
me
Tra
ns
ac
tio
ns
wit
h o
wn
ers
Issu
e o
f sh
are
ca
pit
al
Exe
rcis
e o
f sh
are
op
tio
ns
Sh
are
ba
sed
pa
ym
en
ts
Fin
al
div
ide
nd
fo
r th
e y
ea
r e
nd
ed
31
De
cem
be
r 2
015
a
t th
e r
ate
of
Rs.
1.2
5 p
er
sha
re
Ba
lan
ce a
s o
n 3
1 D
ece
mb
er
20
16
Pro
t
for
the
ye
ar
Oth
er
com
pre
he
nsi
ve
inco
me
fo
r th
e y
ea
r
To
tal
com
pre
he
nsi
ve
inco
me
Tra
ns
ac
tio
ns
wit
h o
wn
ers
Issu
e o
f sh
are
ca
pit
al
Tra
nsf
er
on
acc
ou
nt
of
issu
an
ce o
f sh
are
ca
pit
al
Exe
rcis
e o
f sh
are
op
tio
ns
Sh
are
ba
sed
pa
ym
en
ts
Fin
al
div
ide
nd
fo
r th
e y
ea
r e
nd
ed
31
De
cem
be
r
20
16 a
t th
e r
ate
of
Rs.
1.8
6 p
er
sha
re
Ba
lan
ce a
s a
t 3
1 D
ece
mb
er
20
17
Th
e a
nn
exe
d n
ote
s fr
om
1 t
o 4
2 f
orm
an
inte
gra
l p
art
of
the
se c
on
soli
da
ted
n
an
cia
l st
ate
me
nts
.
1,10
6,8
08
,76
0
-
-
-
3,9
76
,16
0
-
3,9
76
,16
0
1,
110
,78
4,9
20
-
-
-
-
-
7,4
91,
60
0
-
-
7,4
91,
60
0
1,11
8,2
76
,52
0
411
,30
2,5
86
-
-
-
11,3
21,
36
2
-
-
-
11,3
21,
36
2
4
22
,62
3,9
48
-
-
-
-
-
50
,66
5,6
91
-
-
50
,66
5,6
91
Em
plo
ye
e
com
pe
ns
ati
on
res
erv
e
Fo
reig
n
curr
en
cy
tra
ns
lati
on
res
erv
e
Un
-ap
pro
pri
ate
d
pro
t
89
5,9
21,
04
2
4
87
,03
5,7
53
48
7,0
35
,75
3
---
-
(1
38
,84
8,1
14)
(13
8,8
48
,114
)
1,
24
4,1
08
,68
1
57
0,0
12,1
61
-
57
0,0
12,1
61
-
3,4
29
,68
6
-
-
(20
7,9
99
,43
3)
(20
4,5
69
,74
7)
1,6
09
,55
1,0
95
(9,7
46
,73
6)
(5,8
21,
28
4)
-
(5,8
21,
28
4)
- - - - -
(15
,56
8,0
20
)
(9,2
93
,618
)
-
(9,2
93
,618
)
40
,22
2,2
16
(3,4
29
,68
6)
- - -
36
,79
2,5
30
11,9
30
,89
2
No
n
con
tro
llin
g
inte
res
t
Re
ve
nu
e r
es
erv
e
Iss
ue
d, s
ub
scr
ibe
d
an
d p
aid
up
sh
are
cap
ita
l
Sh
are
pre
miu
m
To
tal
eq
uit
y
att
rib
uta
ble
to
sh
are
ho
lde
rs o
f
pa
ren
t co
mp
an
y
To
tal
9,2
55
,46
7
33
,08
2
2,4
23
,32
0,9
37
2,4
13,5
74
,20
1
-
-
48
7,0
35
,75
3
48
1,2
14,4
69
-
(34
9,7
96
)
(34
9,7
96
)
(34
9,7
96
)
-
(34
9,7
96
)
48
6,6
85
,95
7
48
0,8
64
,67
3
-
-
(9,0
00
,00
0)
-
6,2
97
,52
2
6,2
97
,52
2
38
,211
,812
-
38
,211
,812
38
,211
,812
-
-
-
(13
8,8
48
,114
)
(13
8,8
48
,114
)
29
,211
,812
-
(94
,33
8,7
80
)
(94
,33
8,7
80
)
38
,46
7,2
79
(316
,714
)
2,8
15,6
68
,114
2,8
00
,10
0,0
94
-
-
57
0,0
12,1
61
56
0,7
18,5
43
-
2,1
48
,46
2
2,1
48
,46
2
2,1
48
,46
2
-
2,1
48
,46
2
57
2,1
60
,62
3
56
2,8
67
,00
5
-
-
-
40
,22
2,2
16
-
-
3,4
29
,68
6
-
(43
,06
8,4
02
)
-
15,0
88
,88
9
15,0
88
,88
9
14,3
44
,06
0
-
14,3
44
,06
0
14,3
44
,06
0
--
(20
7,9
99
,43
3)
(20
7,9
99
,43
3)
(28
,72
4,3
42
)-
(17
5,1
36
,79
8)
(13
8,3
44
,26
8)
47
3,2
89
,63
99
,74
2,9
37
1,8
31,
74
83
,212
,69
1,9
39
3,2
24
,62
2,8
31
Ca
pit
al
res
erv
es
Ru
pe
es
Ru
pe
es
Ru
pe
es
Ru
pe
es
Ru
pe
es
Ru
pe
es
Ru
pe
es
Ru
pe
es
CHIEF EXECUTIVE OFFICER CHIEF FINANCIAL OFFICERCHAIRMAN
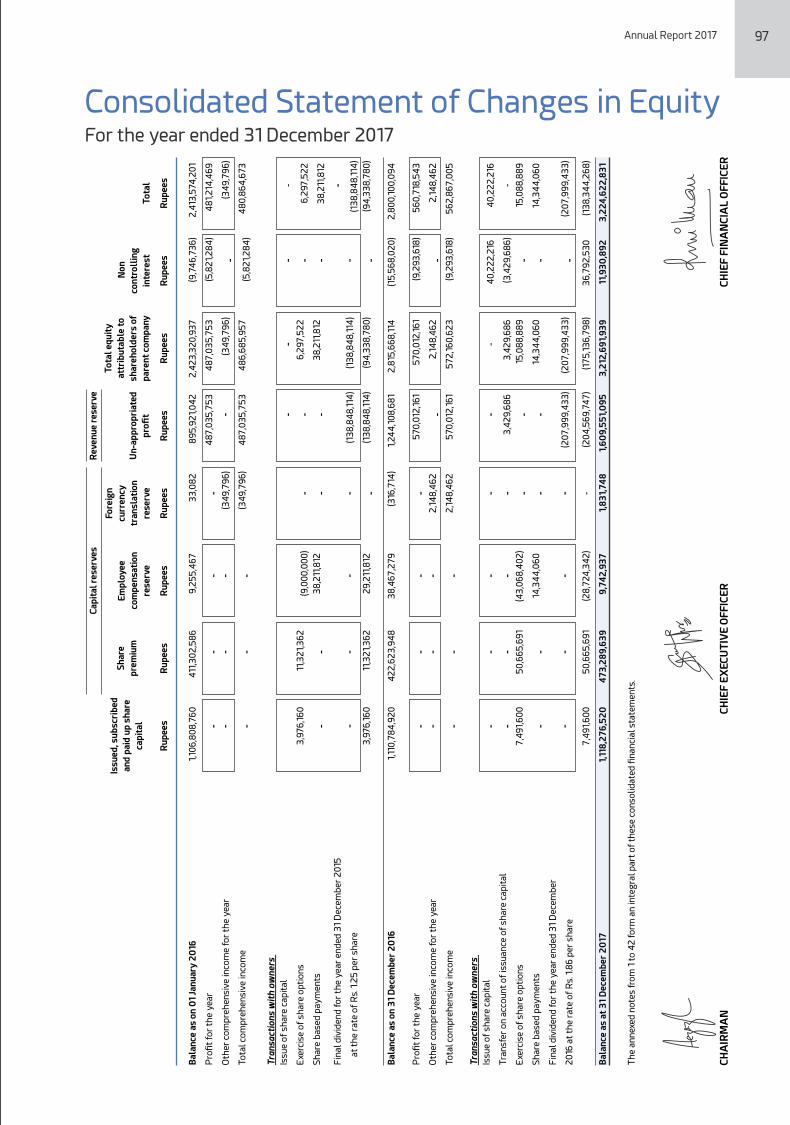
98 Systems Limited
Notes to the Consolidated Financial StatementsFor the year ended 31 December 2017
1. THE GROUP AND ITS OPERATIONS
Holding Company
The Company is a public limited Company incorporated in Pakistan under the repealed Companies Ordinance 1984 (now Companies Act 2017), and is listed on the Pakistan Stock Exchange. The Company is principally engaged in the business of software development, trading of software and business process outsourcing services. The head office of the Company is situated at E-1, Sehjpal Near DHA Phase-VIII (Ex-Air Avenue), Lahore Cantt.
Subsidiary Companies
TechVista Systems FZ LLC, a limited liability Company incorporated in Dubai Technology and Media Free Zone Authority, is a 100% owned subsidiary of Systems Limited. The Company is engaged in the business of developing software and providing ancillary services.
During the year, TechVista Systems FZ LLC has acquired 100% control of TechVista Systems LLC in September 2017. The Company is a Limited Liability Company registered in the Emirate of Dubai under Federal Law No. 2 of 2015. The Company is licensed as a software house.
Audited nancial statements of TechVista Systems FZ LLC (the subsidiary) as at 31 December 2017 disclose that the total assets have exceeded its total liabilities by AED 1,409,252 (2016: Total Liabilities exceeds total assets by AED 2,474,474 ).
E-Processing Systems (Private) Limited, a private limited Company registered under the repealed Companies Ordinance 1984, (now Companies Act 2017) incorporated on 06 February 2013, is a 53% (2016: 70%) owned subsidiary of Systems Limited. The Company is principally engaged in the business of purchase and sale of airtime and related services.
2. STATEMENT OF COMPLIANCE
During the year Companies Act 2017 (the Act) has been promulgated, however, Securities and Exchange Commission of Pakistan vide its circular no. 23 of 2017 dated 04 October 2017 communicated that the companies whose nancial year closes on or before 31 December 2017 shall prepare their nancial statements in accordance with the provisions of the repealed Companies Ordinance, 1984.
Hence, these consloidated nancial statements have been prepared in accordance with approved accounting standards as applicable in Pakistan and the requirements of repealed Companies Ordinance, 1984. Approved accounting standards comprise of such International Financial Reporting Standards (IFRSs) issued by the International Accounting Standards Board (IASB) as are notied under the provisions of the repealed Companies Ordinance, 1984. Wherever, the requirements of the repealed Companies Ordinance, 1984 or directives issued by the Securities and Exchange Commission of Pakistan (SECP) differ with the requirements of these standards, the requirements of repealed Companies Ordinance, 1984 or the requirements of the said directives shall prevail.
3. BASIS OF MEASUREMENT
3.1 Basis of preparation
These consolidated nancial statements have been prepared under the historical cost convention.
3.2 Principles of consolidation
The consolidated nancial statements include the nancial statements of Systems Limited and its subsidiary companies, here-in-after referred to as “the Group”.
3.2.1 Subsidiaries
A Company is a subsidiary, if an entity (the Holding Company) directly or indirectly controls, benecially owns or holds more than fty percent of its voting securities or otherwise has power to elect and appoint more than fty percent of its directors.
Subsidiaries are consolidated from the date on which the Holding Company obtains control, and continue to be consolidated until the date when such control ceases.
The nancial statements of the subsidiaries are prepared for the same reporting period as the Holding Company, using consistent accounting policies.
All inter-Company balances, transactions and unrealized gains and losses resulting from inter-Company transactions and dividends are eliminated in full.
The assets, liabilities, income and expenses of subsidiary companies are consolidated on a line by line basis and carrying value of investments held by the Holding Company is eliminated against the subsidiary companies’ shareholders’ equity in the consolidated nancial statements.
3.2.2 Non-controlling interest
Non-controlling interest is that part of net results of operations and of net assets of the subsidiaries which are not owned by the
Annual Report 2017 99
Group either directly or indirectly. Non-controlling interest is presented as a separate item in the consolidated nancial statements. The Group applies a policy of treating transactions with non-controlling interests as transactions with parties external to the Group. Disposals to non-controlling interest result in gains and losses for the Group and are recorded in the consolidated statement of changes in equity.
3.3 Functional and presentation currency
Items included in these consolidated nancial statements are presented in Pak Rupee, which is the Group's functional and presentation currency.
3.4 Use of estimates and judgments
The Group's signicant accounting policies are stated in Note 4. Not all of these signicant policies require the management to make difficult, subjective or complex judgments or estimates. The following is intended to provide an understanding of the policies the management considers critical because of their complexity, judgment of estimation involved in their application and their impact on these consolidated nancial statements. Estimates and judgments are continually evaluated and are based on historical experience, including expectation of future events that are believed to be reasonable under the circumstances. These judgments involve assumptions or estimates in respect of future events and the actual results may differ from these estimates. The areas involving higher degree of judgments or complexity or areas where assumptions and estimates are signicant to the consolidated nancial statements are as follows:
3.4.1 Provision for taxation (note 4.2)
The Group takes into account the current income tax law and the decisions taken by appellate authorities. Instances where the Group's view differs from the view taken by the income tax department at the assessment stage and where the Group considers that its views on items of material nature are in accordance with law, the amounts are shown as contingent liabilities.
3.4.2 Useful life and residual values of property and equipment (note 4.3)
The Group reviews the useful life of property and equipment on a regular basis. Any change in estimates in future years might affect the carrying amounts of respective items of property and equipment with a corresponding effect on the depreciation charge and impairment.
At the end of this nancial year, the Holding Company reviewed the useful life of the property and equipment on the basis of which useful lives of certain class of assets have been revised as mentioned in note 5. The effect of this revision for current year is amounting to Rs. 2.6 million, however, amount of the effect in future periods is impracticable to estimate.
3.4.3 Provision for doubtful debts (note 4.8.1)
The Group regularly reviews its receivables for impairment, if any. The provision in this regard is made, based on management's estimate, where the prospects of recovery are doubtful.
3.4.4 Stage of completion (note 4.12)
The Group determines stage of completion on the basis of services performed to date as a percentage of total services to be performed.
3.4.5 Provisions (note 4.11)
A provision is recognized in the consolidated balance sheet when the Group has a legal or constructive obligation as a result of a past event, and it is probable that an outow of economic benets will be required to settle the obligation and a reliable estimate can be made of the amount of obligation. The amount recognized as a provision reects the best estimate of the expenditure required to settle the present obligation at the end of the reporting period.
4. SIGNIFICANT ACCOUNTING POLICIES
The signicant accounting policies which have been adopted in the preparation of consolidated nancial statements of the Group are consistent with previous year except as described in Note 4.1, below:
4.1 New, amended standards and interpretations which became effective
The Group has adopted the following accounting standard and the amendments and interpretation of IFRSs which became effective for the current year:
IAS 7 Statement of Cash Flows - Disclosure Initiative - (Amendment)
IAS 12 Income Taxes – Recognition of Deferred Tax Assets for Unrealized losses (Amendments)
Improvements to Accounting Standards Issued by the IASB in September 2014
IFRS 12 Disclosure of Interests in Other Entities - Clarication of the scope of the disclosure requirements in IFRS 12
The adoption of the above amendments, improvements to accounting standards and interpretations did not have any material effect on the nancial statements.
100 Systems Limited
4.1.1 Interests in joint operations
A joint operation is a joint arrangement whereby the parties that have joint control of the arrangement have rights to the assets, and obligations for the liabilities, relating to the arrangement. Joint control is the contractually agreed sharing of control of an arrangement, which exists only when decisions about the relevant activities require unanimous consent of the parties sharing control.
When the Group undertakes its activities under joint operations, the Group as a joint operator recognizes in relation to its interest in a joint operation:
Its assets, including its share of any assets held jointly;
Its liabilities, including its share of any liabilities incurred jointly;
Its revenue from the sale of its share of the output arising from the joint operation;
Its share of the revenue from the sale of the output by the joint operation; and
Its expenses, including its share of any expenses incurred jointly
The Group accounts for the assets, liabilities, revenues and expenses relating to its interest in a joint operation in accordance with the IFRSs applicable to the particular assets, liabilities, revenues and expenses.
When Group transacts with a joint operation in which a Company is a joint operator, the Group is considered to be conducting the transaction with the other parties to the joint operation, and gains and losses resulting from the transactions are recognized in the Group's nancial statements only to the extent of other parties' interests in the joint operation.
When Group transacts with a joint operation in which Group is a joint operator, the Group does not recognize its share of the gains and losses until it resells those assets to a third party.
The Holding Company has interest in joint operation UUS Joint Venture (Private) Limited, a Company set up specically for executing multi-year contract “Package 04A – Airport Information Management System (AIMS)”, a turnkey project for New Islamabad International Airport by Pakistan Civil Aviation Authority.
4.2 Taxation
4.2.1 Current
Provision for current tax is based on the taxable income for the year determined in accordance with the prevailing law for taxation of income. The charge for current tax is calculated using prevailing tax rates or tax rates expected to be applied to the prot for the year, if enacted. The charge for current tax also includes adjustments, where considered necessary, to provision for taxation made in previous years arising from assessments framed during the year for such years.
4.2.2 Deferred
Deferred tax is accounted for using the balance sheet liability method in respect of all temporary differences arising from differences between the carrying amount of assets and liabilities in the nancial statements and the corresponding tax bases used in the computation of the taxable prot. Deferred tax liabilities are generally recognized for all taxable temporary differences and deferred tax assets are recognized to the extent that it is probable that taxable prots will be available against which the deductible temporary differences, unused tax losses and tax credits can be utilized.
Deferred tax is calculated at the rates that are expected to apply to the year when the differences reverse based on tax rates that have been enacted or substantively enacted by the balance sheet date. Deferred tax is charged or credited in the prot and loss account, except in the case of items credited or charged to other comprehensive income in which case it is included in other comprehensive income.
4.3 Property and equipment
4.3.1 Operating xed assets
Operating xed assets are stated at cost less accumulated depreciation and any identied impairment loss. Freehold land is stated at historic cost. Cost of operating xed assets consists of purchase cost, borrowing cost pertaining to construction period and directly attributable cost of bringing the asset to working condition. Subsequent costs are included in the assets' carrying amount or recognized as separate asset, as appropriate, only when it is probable that future economic benets associated with the item will ow to the Group and the cost of the item can be measured reliably. All other repair and maintenance costs are charged to consolidated prot and loss account during the period in which they are incurred.
Depreciation on property and equipment is charged to income by applying straight line method on pro-rata basis so as to write off the historical cost of the assets over their estimated useful lives at the rates given in Note 5. Depreciation charge commences from the month in which the asset is available for use and continues until the month of disposal.
The assets' residual values and useful lives are reviewed at each nancial year end, and adjusted if impact on depreciation is signicant.
Annual Report 2017 101
An item of property and equipment is derecognized upon disposal or when no future economic benets are expected from its use or disposal. Prot or loss on disposal of operating xed assets represented by the difference between the sale proceeds and the carrying amount of the asset is included in income.
4.3.2 Capital work-in-progress
Capital work in progress represents expenditure on property and equipment which are in the course of construction and installation. Transfers are made to relevant property and equipment category as and when assets are available for use.
Capital work-in-progress is stated at cost less identied impairment loss, if any.
4.4 Intangibles
Intangible assets acquired from the market are carried at cost less accumulated amortization and any impairment losses.
Expenditure on research (or the research phase of an internal project) is recognized as an expense in the period in which it is incurred;
Development costs incurred on specic projects are capitalized when all the following conditions are satised:
- Completion of the intangible asset is technically feasible so that it will be available for use or sale.
- The Group intends to complete the intangible asset and use or sell it.
- The Group has the ability to use or sell the intangible asset.
- Intangible asset will generate probable future economic benets.
- The availability of adequate technical, nancial and other resources to complete the development and to use or sell the intangible asset.
- The Group's ability to measure reliably the expenditure attributable to the intangible asset during its development.
The cost of an internally generated intangible asset comprises all directly attributable costs necessary to create, produce and prepare the asset to be capable of operating in the manner intended by the management.
After initial recognition, internally generated intangible assets are carried at cost less accumulated amortization and impairment losses. These are amortized using straight line method at the rate given in note 6. Full month amortization on additions is charged in the month of acquisition and no amortization is charged in month of disposal.
The Group assesses at each balance sheet date whether there is any indication that intangible assets may be impaired. If such indication exists, the carrying amounts of such assets are reviewed to assess whether they are recorded in excess of their recoverable amount. Where carrying amounts exceed the respective recoverable amount, assets are written down to their recoverable amounts and the resulting impairment loss is recognized in consolidated prot and loss account. The recoverable amount is the higher of an asset’s fair value less costs to sell and value in use. Where an impairment loss is recognized, the amortization charge is adjusted in the future periods to allocate the asset’s revised carrying amount over its estimated useful life.
4.5 Impairment
4.5.1 Financial assets including receivables
Financial assets are assessed at each reporting date to determine whether there is objective evidence that they are impaired. A nancial asset is impaired if objective evidence indicates that a loss event has occurred after the initial recognition of the asset and that the loss event had a negative effect on the estimated future cash ows of that asset that can be estimated reliably. Objective evidence that nancial assets are impaired may include default or delinquency by a debtor indicating that a debtor or issuer will enter bankruptcy. All individually signicant receivables are assessed for specic impairment. All individually signicant receivables found not to be specically impaired are then collectively assessed for any impairment that has been incurred but not yet identied. Receivables that are not individually signicant are collectively assessed for impairment by grouping together receivables with similar risk characteristics.
An impairment loss in respect of a nancial asset measured at amortized cost is calculated as the difference between its carrying amount and the present value of the estimated future cash ows discounted at the asset's original effective interest rate. Losses are recognized in consolidated prot and loss and reected in an allowance account against receivables.
4.5.2 Non-nancial assets
The carrying amounts of non-nancial assets other than inventories and deferred tax asset, are reviewed at each reporting date to determine whether there is any indication of impairment. If any such indication exists, then the asset's recoverable amount is estimated. The recoverable amount of an asset or cash-generating unit is the greater of its value in use and its fair value less costs to sell. In assessing value in use, the estimated future cash ows are discounted to their present value using a pre-tax discount rate that reects current market assessment of the time value of money and the risks specic to the asset. For the purpose of impairment testing, assets that cannot be tested individually are grouped together into the smallest group of assets that generates cash inows from continuing use that are largely independent of the cash inows of other assets or group of assets (the “cash generating unit, or CGU”).
102 Systems Limited
The Group's corporate assets do not generate separate cash inows. If there is an indication that a corporate asset may be impaired, then the recoverable amount is determined for the CGU to which the corporate asset belongs. An impairment loss is recognized if the carrying amount of an asset or its CGU exceeds its estimated recoverable amount. Impairment losses are recognized in consolidated prot and loss account.
Impairment loss recognized in prior periods is assessed at each reporting date for any indications that the loss has decreased or no longer exists. An impairment loss is reversed if there has been a change in the estimates used to determine the recoverable amount. An impairment loss is reversed only to the extent that the asset's carrying amount does not exceed the carrying amount that would have been determined, net of depreciation or amortization, if no impairment loss had been recognized.
4.6 Staff benets
The Group has the following plans for its employees:
4.6.1 Provident fund
The Group operates a funded recognized provident fund contribution plan which covers all permanent employees. Equal contributions are made on monthly basis both by the Group and the employees at 10% of basic pay.
4.6.2 Employees' share option scheme
The Group operates an equity settled share based Employees Stock Option Scheme. The compensation committee of the Board evaluates the performance and other criteria of employees and approves the grant of options. These options vest with employees over a specied period subject to fulllment of certain conditions. Upon vesting, employees are eligible to apply and secure allotment of Holding Company's shares at a price determined on the date of grant of options.
When share options are exercised, the proceeds received, net of any transaction costs, are credited to share capital (nominal value) and share premium.
4.6.3 Gratuity
Provision is made for TechVista (the ''Subsidiary'') employees' end of service benets in accordance with the UAE Federal labour laws.
4.7 Investments
Management determines the classication of its investments at the time of purchase depending on the purpose for which the investments are acquired and re-evaluates this classication at the end of each nancial year. Investments intended to be held for less than twelve months from the consolidated balance sheet date or to be sold to raise operating capital are included in current assets, all other investments are classied as non-current.
Investments are either classied as nancial assets at fair value through prot or loss, held-to-maturity investments, available-for-sale investments or investment in subsidiary and associated companies, as appropriate. When investments are recognized initially, they are measured at fair value, plus, in case of investments not at fair value through prot or loss, directly attributable transaction cost.
4.7.1 Investments at fair value through prot or loss
Investments that are acquired principally for the purpose of generating prot from short term uctuations in price are classied as investments at fair value through prot or loss. Investments at fair value through prot or loss are initially recognized at cost (excluding transaction cost), being the fair value of the consideration given. Subsequent to initial recognition they are recognized at fair value unless fair value cannot be reliably measured. Any surplus or decit on revaluation of investment is recognized in the consolidated prot or loss account.
All purchases and sale of investments are recognized on trade date, which is the date the Group commits to purchase, or sell the investment.
4.7.2 Investments held to maturity
Held-to-maturity investments are non-derivative nancial assets. Investments having xed maturity are classied as held-to-maturity where the Group has positive intension and ability to hold the investment till maturity. These investments are initially measured at fair value plus directly attributable transaction costs. Subsequently, these are carried at amortised cost using effective interest rate method less impairment losses, if any. Amortised cost is re-calculated by taking into account any discount or premium on acquisition and fees or costs that are integral part of effective interest rate (EIR). The effective interest rate amortization is included in prot and loss account. The losses arising from impairment are also recognized in prot and loss.
4.7.3 Foreign currency transactions and translation
Assets and liabilities in foreign currencies are translated into Pak Rupees at the rate of exchange prevailing at the balance sheet date. Transactions during the year are converted into Rupees at the exchange rate prevailing at the date of such transaction. All exchange differences are charged to consolidated prot and loss account.
Annual Report 2017 103
On consolidation, the assets and liabilities of foreign operations are translated into Pak Rupees at the rate of exchange prevailing at the reporting date and their prot and loss account are translated at average rates prevailing during the year. The exchange differences arising on translation for consolidation are recognized in consolidated other comprehensive income. On disposal of a foreign operation, the component of consolidated other comprehensive income relating to that particular foreign operation is recognized in consolidated prot and loss account.
4.8 Trade debts
Trade debts from local customers are stated at cost less provision for doubtful debts while foreign debtors are stated at translated amount by applying exchange rate applicable on the balance sheet reporting date.
4.8.1 Provision for doubtful debts
The Group reviews its trade and other receivables on each balance sheet date to assess whether a provision should be recorded in the consolidated prot and loss account relating to doubtful receivable. Judgment by the management is made of the amount and timing of future cash ows while determining the extent of provision required. Such estimation involves the application of the Group's provision for doubtful debt policy including the assessment of credit history of the counterparty. Actual cash ows may differ resulting in subsequent change in provisions.
4.9 Advances, deposits and other receivables
These are recognized at nominal amount which is fair value of considerations to be received in future.
4.10 Trade and other payables
Liabilities for trade and other accounts payable are carried at cost which is the fair value of the consideration to be paid in future for goods and services.
4.11 Provisions and contingencies
Provisions are recognized in the consolidated balance sheet when the Group has a legal or constructive obligation as a result of past events and it is probable that outow of resources embodying economic benets will be required to settle the obligation and a reliable estimate of the amount can be made. However, provisions are reviewed at each balance sheet date and adjusted to reect current best estimate. Where outow of resources embodying economic benets is not probable, a contingent liability is disclosed, unless the possibility of outow is remote.
4.12 Revenue recognition
4.12.1 Professional services
Revenue from professional / software services includes xed price contracts and time and material contracts. Revenue from services performed under xed price contracts is recognized in accordance with the percentage of completion method. Revenue from services performed under time and material contracts is recognized as services are provided.
4.12.2 License and license support services
Revenue from license contracts without major customization is recognized when the license agreement is signed, delivery of software has occurred, fee is xed or determinable and collectability is probable. Revenue from license contracts with major modication, customization and development is recognized on percentage of completion method. Revenue from support services is recognized on time proportion basis.
4.12.3 Outsourcing services
Revenue from business process outsourcing services is recognized on completion of processing. Revenue from other outsourcing services is recognized as services are provided.
4.12.4 Consultancy
Revenue from provision of consultancy services is recognized as the work is performed.
4.12.5 Sale of third party software
Revenue from sale of third party software is recognized when the signicant risks and rewards of ownership of the software have passed to the buyer, usually on delivery of the software.
4.12.6 Sale and purchase of air time and related services
Revenue is measured at fair value of the consideration received or receivable and represents amount received and receivable from the sale of air time and related services in normal course of business, net of discounts, if any. Revenue from sale of air time is recognized when air time is transferred to customers.
4.12.7 Unearned revenue
Revenue received in advance is transferred to unearned revenue as per respective revenue recognition policy.
Systems Limited
4.13 Other income
Prot on deposit account and gain on short term investments is recognized on accrual basis. Miscellaneous income is recognized on receipt basis.
4.14 Financial instruments
Financial assets and liabilities are recognized at fair value at the time when the Group becomes a party to the contractual provisions of the instrument by following trade date accounting.
A nancial asset or part thereof is de-recognized when the Group loses control of the contractual rights that comprise the nancial assets or part thereof. Such control is deemed to be lost if the Group realizes the rights to benets specied in the contracts, the rights expire or the Group surrenders those rights. A nancial liability or part thereof is removed from the balance sheet when it is extinguished i.e. when the obligation specied in the contract is discharged, cancelled or expired.
Any gain or loss on subsequent measurement and de-recognition is charged to prot and loss account.
4.14.1 Offsetting of nancial assets and liabilities
A nancial asset and a nancial liability is offset and the net amount is reported in the consolidated balance sheet if the Group has legal enforceable right to set off the recognized amount and intends either to settle on a net basis or to realize the assets and settle the liability simultaneously.
4.15 Finance costs
Finance cost is charged to consolidated prot and loss account in the year in which it is incurred.
4.16 Cash and cash equivalents
Cash and cash equivalents are stated in the consolidated balance sheet at cost. For the purpose of the consolidated cash ow statement, cash and cash equivalents are comprised of cash in hand, cheques/demand drafts in hand and deposits in the bank.
4.17 Operating lease
Leases where a signicant portion of the risks and rewards of ownership are retained by the lessor are classied as operating leases. Payments made under operating leases (net of any incentives received from the lessor) are charged to prot on a straight-line basis over the lease term unless another systematic basis is representative of the time pattern of the Group’s benet.
4.18 Dividends and appropriation reserves
Dividends and other appropriation to reserves are recognised in the nancial statements in the period in which these are approved. However, if they are approved after the reporting period but before the nancial statements are authorized for issue, they are disclosed in the notes to the nancial statements.
4.19 Earnings per share
The Group presents basic and diluted earnings per share (EPS). Basic EPS is calculated by dividing the prot after tax attributable to ordinary shareholders of the Group by the weighted average number of ordinary shares outstanding during the period. Diluted EPS is calculated by dividing the prot attributable to ordinary equity holders of the parent (after adjustment) by the weighted average number of ordinary shares outstanding during the year plus the weighted average number of ordinary shares that would be issued on conversion of all the dilutive potential ordinary shares into ordinary shares.
4.20 Segment reporting
Segment reporting is based on the operating (business) segments of the Group. An operating segment is a component of the Group that engages in business activities from which it may earn revenues and incur expenses, including revenues and expenses that relate to transactions with any of the Group’s other components. An operating segment’s operating results are reviewed regularly by the Chief Executive Officer (the CEO) to assess segment's performance, and for which discrete nancial information is available. Segment results that are reported to the CEO include items directly attributable to a segment as well as those that can be allocated on a reasonable basis. Unallocated items comprise mainly other operating expenditures, other income, nance cost, corporate assets, income tax assets and liabilities. Segment capital expenditure is the total cost incurred during the year to acquire property and equipment.
4.21 Standards, Interpretations and Amendments to Published Approved Accounting Standards that are not yet effective
The following standards, amendments and interpretations with respect to the approved accounting standards as applicable in Pakistan would be effective from the dates mentioned below against the respective standard or interpretation:
Annual Report 2017
IASB effective date
Standard
(Annual periods
beginning on or after)
IFRS 14 -Financial Instruments: Regulatory Deferral Accounts 01 January 2016
IFRS 17 -Insurance Contracts 01 January 2021
IFRS 16 – Leases 01 January 2019
Effective Date
Standard or Interpretation
(Annual periods
beginning on or after)
IFRS 2: Share-based Payments – Classication and Measurement of Share-based Payments
Transactions (Amendments)
IFRS 10 Consolidated Financial Statements and IAS 28 Investment in Associates and Joint
Ventures - Sale or Contribution of Assets between an Investor and its Associate or Joint
Venture (Amendment)
IFRS 9 Financial Instruments: Classication and Measurement
IFRS 9 Prepayment Features with Negative Compensation – Amendments)
IFRS 4 Insurance Contracts: Applying IFRS 9 Financial Instruments with IFRS 4 Insurance
Contracts – (Amendments)
IFRS 15 Revenue from Contracts with Customers
IFRIC 22 Foreign Currency Transactions and Advance Consideration
01 January 2018
Not yet nalized
01 July 2018
01 January 2018
01 January 2018
01 July 2018
01 January 2018
01 January 2019IFRIC 23 Uncertainty over Income Tax Treatments
The Group expects that the adoption of the above revisions and amendments of the standards will not materially affect the Group's nancial statements in the period of initial application or later periods. However, for IFRS 15 the Group's expectation is based on an initial assessment made by the management.
In addition to the above standards and amendments, improvements to various accounting standards have also been issued by the IASB in December 2016 . Such improvements are generally effective for accounting periods beginning on or after 01 January 2018 and 01 January 2019 .The Group expects that such improvements to the standards will not have any impact on the Group's nancial statements in the period of initial application .
In addition to the above, the following new standards have been issued by IASB which are yet to be notied by the SECP for the purpose of applicability in Pakistan:
5. PROPERTY AND EQUIPMENT
Operating xed assets 5.1 844,353,949 189,448,990
Capital work in progress 5.2 52,274,081 381,726,137
896,628,030 571,175,127
2017 2016
Note Rupees Rupees
104 105
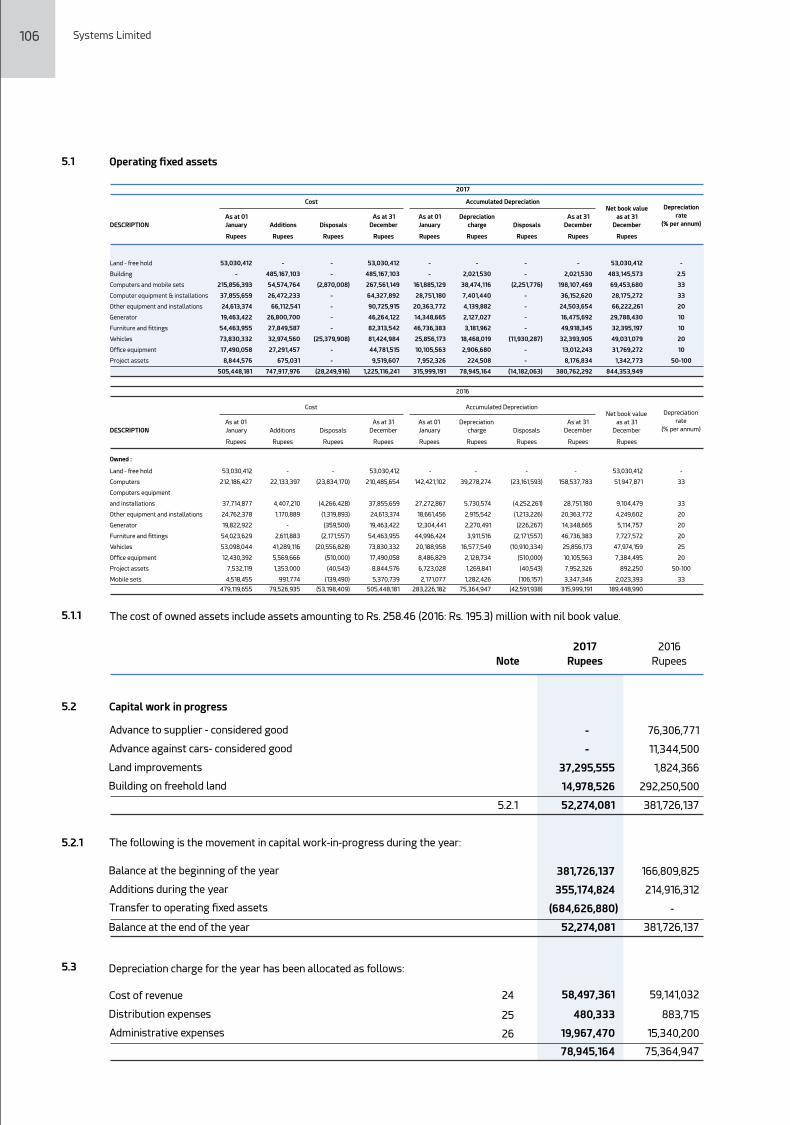
Systems Limited
5.1 Operating xed assets
-
-
(2,251,776)
-
-
-
-
(11,930,287)
-
-
(14,182,063)
-
2,021,530
198,107,469
36,152,620
24,503,654
16,475,692
49,918,345
32,393,905
13,012,243
8,176,834
380,762,292
53,030,412
483,145,573
69,453,680
28,175,272
66,222,261
29,788,430
32,395,197
49,031,079
31,769,272
1,342,773
844,353,949
-
2,021,530
38,474,116
7,401,440
4,139,882
2,127,027
3,181,962
18,468,019
2,906,680
224,508
78,945,164
-
2.5
33
33
20
10
10
20
10
50-100
-
-
161,885,129
28,751,180
20,363,772
14,348,665
46,736,383
25,856,173
10,105,563
7,952,326
315,999,191
53,030,412
485,167,103
267,561,149
64,327,892
90,725,915
46,264,122
82,313,542
81,424,984
44,781,515
9,519,607
1,225,116,241
-
-
(2,870,008)
-
-
-
-
(25,379,908)
-
-
(28,249,916)
-
485,167,103
54,574,764
26,472,233
66,112,541
26,800,700
27,849,587
32,974,560
27,291,457
675,031
747,917,976
53,030,412
-
215,856,393
37,855,659
24,613,374
19,463,422
54,463,955
73,830,332
17,490,058
8,844,576
505,448,181
Disposals
Rupees
As at 31
December
Rupees
Net book value
as at 31
December
Rupees
Depreciation
charge
Rupees
Depreciation
rate
(% per annum)
Rupees
As at 01
January
Rupees
As at 31
December
Rupees
Disposals
Rupees
Additions
Rupees
As at 01
January
Cost Accumulated Depreciation
Disposals
Rupees
As at 31
December
Rupees
Net book value
as at 31
December
Rupees
Depreciation
charge
Rupees
Depreciation
rate
(% per annum)
Rupees
As at 01
January
Rupees
As at 31
December
Rupees
Disposals
Rupees
Additions
Rupees
As at 01
January
Cost Accumulated Depreciation
Land - free hold
Building
Computers and mobile sets
Computer equipment & installations
Other equipment and installations
Generator
Furniture and ttings
Vehicles
Office equipment
Project assets
Owned :
Land - free hold 53,030,412 - - 53,030,412 - - - - 53,030,412 -
Computers 212,186,427 22,133,397 (23,834,170) 210,485,654 142,421,102 39,278,274 (23,161,593) 158,537,783 51,947,871 33
Computers equipment
and installations 37,714,877 4,407,210 (4,266,428) 37,855,659 27,272,867 5,730,574 (4,252,261) 28,751,180 9,104,479 33
Other equipment and installations 24,762,378 1,170,889 (1,319,893) 24,613,374 18,661,456 2,915,542 (1,213,226) 20,363,772 4,249,602 20
Generator 19,822,922 - (359,500) 19,463,422 12,304,441 2,270,491 (226,267) 14,348,665 5,114,757 20
Furniture and ttings 54,023,629 2,611,883 (2,171,557) 54,463,955 44,996,424 3,911,516 (2,171,557) 46,736,383 7,727,572 20
Vehicles 53,098,044 41,289,116 (20,556,828) 73,830,332 20,188,958 16,577,549 (10,910,334) 25,856,173 47,974,159 25
Office equipment 12,430,392 5,569,666 (510,000) 17,490,058 8,486,829 2,128,734 (510,000) 10,105,563 7,384,495 20
Project assets 7,532,119 1,353,000 (40,543) 8,844,576 6,723,028 1,269,841 (40,543) 7,952,326 892,250 50-100
Mobile sets 4,518,455 991,774 (139,490) 5,370,739 2,171,077 1,282,426 (106,157) 3,347,346 2,023,393 33
479,119,655 79,526,935 (53,198,409) 505,448,181 283,226,182 75,364,947 (42,591,938) 315,999,191 189,448,990
2017
DESCRIPTION
2016
DESCRIPTION
5.1.1 The cost of owned assets include assets amounting to Rs. 258.46 (2016: Rs. 195.3) million with nil book value.
2017 2016
Note Rupees Rupees
5.2 Capital work in progress
Advance to supplier - considered good
Advance against cars- considered good
Land improvements
Building on freehold land
5.2.1
5.2.1 The following is the movement in capital work-in-progress during the year:
Balance at the beginning of the year
Additions during the year
Transfer to operating xed assets (684,626,880)
Balance at the end of the year
5.3 Depreciation charge for the year has been allocated as follows:
Cost of revenue 24
Distribution expenses 25
Administrative expenses 26
-
-
37,295,555
14,978,526
52,274,081
381,726,137
355,174,824
52,274,081
58,497,361
480,333
19,967,470
78,945,164
76,306,771
11,344,500
1,824,366
292,250,500
381,726,137
166,809,825
214,916,312 -
381,726,137
59,141,032
883,715
15,340,200
75,364,947
Annual Report 2017
5.4 Disposal of property and equipment
Vehicles
Suzuki Swift DLX
Suzuki Cultus
Suzuki Swift DLX
Suzuki Cultus
Honda City Aspire 1500
Honda City Aspire 1500
Toyota Corolla
Honda City
Suzuki Swift
Honda City
Honda City
Honda City
Honda City
Toyota Corolla Grande
Toyota Altis 1.8
Honda City
Honda Civic P/T
Computers and mobile sets
Laptop
Mobile sets
Mode of
disposal
Company Policy
Company Policy
Company Policy
Company Policy
Company Policy
Company Policy
Company Policy
Company Policy
Company Policy
Company Policy
Company Policy
Company Policy
Company Policy
Company Policy
Company Policy
Company Policy
Company Policy
Negotiation
Negotiation
Particulars
of buyer
Employees
Ra Ullah Butt
Mudasser Ansari
Abid Hanif
Abdul hafeez
Anjum Niaz
Ehtesham Opal
Khurram Majeed
Mehmood Kamal
Imran Javaid Zia
Salman Zulqar
Kashif Ali
Nauman Ahmad Farooqi
Zeeshsan Alam
Harris Mehmood
Abid Hanif
Kamran Shaukat
Nauman Ahmad Farooqi
Others
Various
Various
2017
Particulars
999,985
999,984
895,833
788,709
635,273
700,098
(24,763)
(757,848)
272,694
222,688
354,166
1,550,026
999,985
31,812
(36,885)
-
(53,698)
7,578,059
(123,539)
7,454,520
Gain
Rupees
Sale
proceeds
999,985
999,984
1,000,000
1,023,190
1,097,928
1,162,512
1,035,206
413,569
1,297,008
1,527,000
1,555,526
1,550,026
999,985
1,240,687
1,401,646
1,414,417
2,309,010
21,027,679
494,694
21,522,373
Rupees
Written
down value
-
-
104,167
234,481
462,655
462,414
1,059,969
1,171,417
1,024,314
1,304,312
1,201,360
-
-
1,208,875
1,438,531
1,414,417
2,362,708
13,449,620
618,233
14,067,853
Rupees
Accumulated
depreciation
1,018,630
1,014,062
895,833
788,709
1,123,591
1,123,005
1,317,531
390,473
304,526
222,688
139,693
1,582,328
1,015,750
318,125
331,969
128,583
214,791
11,930,287
2,251,776
14,182,063
Rupees
1,018,630
1,014,062
1,000,000
1,023,190
1,586,246
1,585,419
2,377,500
1,561,890
1,328,840
1,527,000
1,341,053
1,582,328
1,015,750
1,527,000
1,770,500
1,543,000
2,577,500
25,379,908
2,870,008
28,249,916
Cost
Rupees
Vehicles Directors
Honda Civic 2,515,733
1,643,086
872,647
872,645
(2)
Company Policy Asif Peer
Employees
Motor Cycle 54,000
54,000
-
16,000
16,000
Company Policy Imdad Hussain Qazi
Toyota Corolla 1,612,130
1,612,130
-
1,550,005
1,550,005
Company Policy Zahid Janjua
Toyota Corolla 1,071,415
1,071,415
-
1,000,000
1,000,000
Company Policy Haris Mehmood
Honda Civic 2,218,840
1,756,580
462,260
462,258
(2)
Company Policy Sajid Hamid
Honda City 1,000,000
750,000
250,000
-
(250,000)
Company Policy Abid Sultan
Suzuki Swift 1,030,340
515,170
515,170
916,168
400,998
Company Policy Mustafa Chohan
Toyota Corolla 1,825,810
646,641
1,179,169
1,106,549
(72,620)
Company Policy Shoiab Hamid
Toyota Corolla 2,056,810 642,753 1,414,057 1,374,995 (39,062) Company Policy Affan Sajjad
Toyota Corolla 1,380,820 402,739 978,081 969,780 (8,301) Company Policy Naila Sabahat
Honda City 1,361,850 312,091 1,049,759 1,049,759 - Company Policy Omer Sardar
Toyota Corolla 1,810,800 339,525 1,471,275 1,475,000 3,725 Company Policy Sabahat Bukhari
Honda City 1,527,000 127,250 1,399,750 1,441,030 41,280 Company Policy Haseeb Ullah Khan
19,465,548 9,873,380 9,592,168 12,234,189 2,642,021
Computer Others
Laptop 3,695,422 3,022,854 672,568 732,724 60,156 Negotiation Various
Lcd screen 839,044 839,044 - 46,785 46,785 Negotiation Various
Mobile Set 139,490 106,157 33,333 35,000 1,667 Negotiation Various
Monitor 3,217,126 3,217,126 - - - Negotiation Various
Personal computer 14,731,440 14,731,440 - 65,135 65,135 Negotiation Various
Printer 397,535 397,535 - 1,000 1,000 Negotiation Various
Server 994,145 994,145 - 12,500 12,500 Negotiation Various
24,014,202 23,308,301 705,901 893,144 187,243
Other
Miscellaneous 9,718,659 9,410,257 308,402 3,428,074 3,119,672 Negotiation Various
2016 53,198,409 42,591,938 10,606,471 16,555,407 5,948,936
Mode of
disposal
Particulars
of buyerGain
Rupees
Sale
proceeds
Rupees
Written
down value
Rupees
Accumulated
depreciation
Rupees
Cost
Rupees
2017
2016
Particulars
2,805,408 2,231,758 573,650 440,521 (133,129)
64,600 20,017 44,583 54,173 9,590
106 107
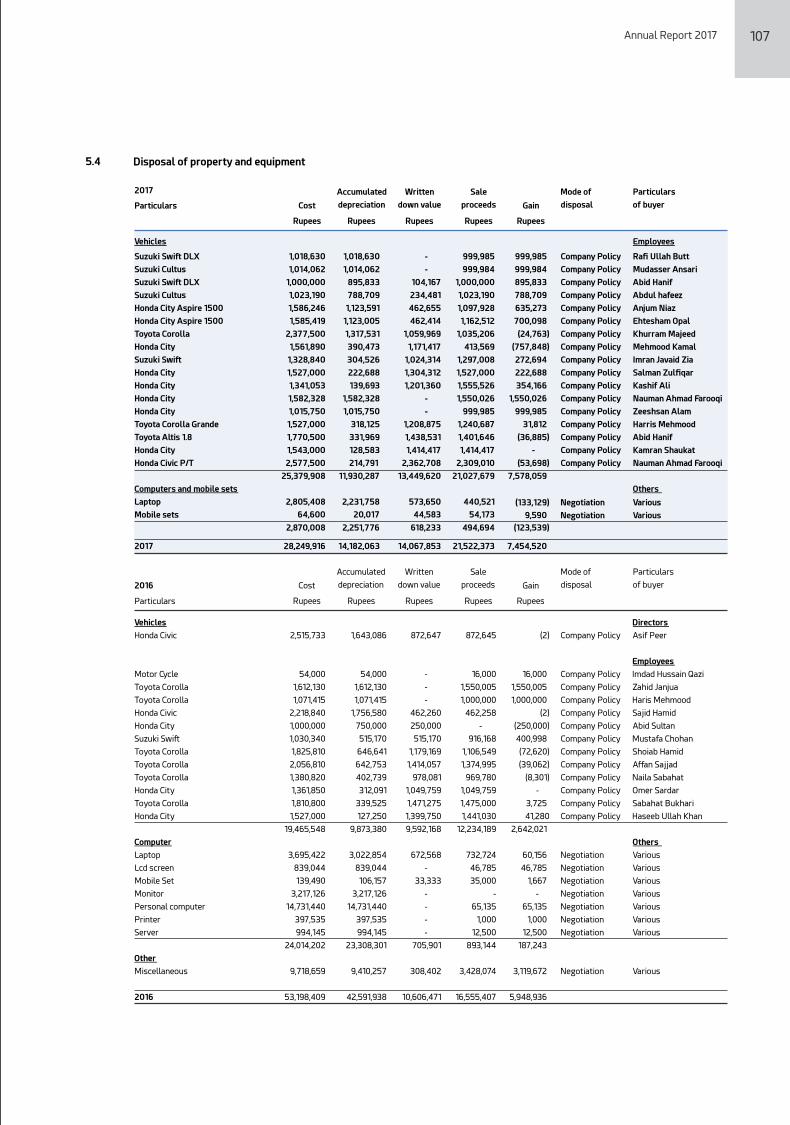
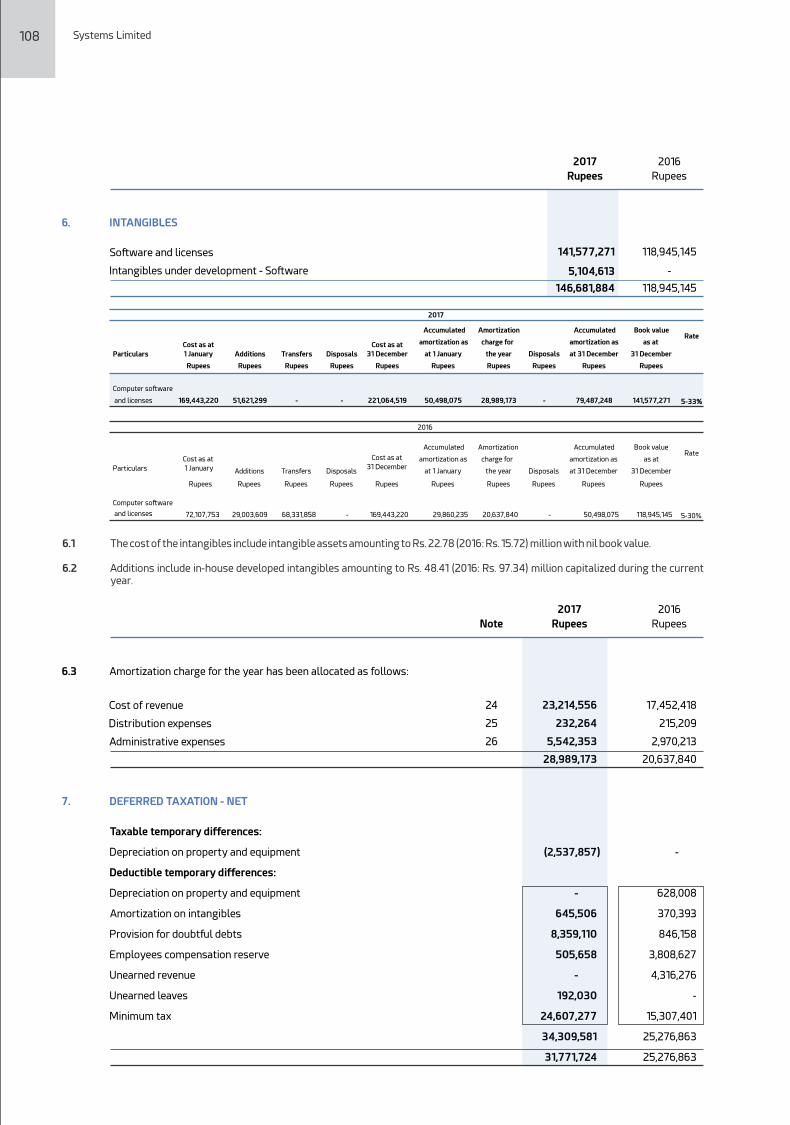
Systems Limited
6. INTANGIBLES
Software and licenses
Intangibles under development - Software
141,577,271
5,104,613
146,681,884
118,945,145
-
118,945,145
2017 2016
Rupees Rupees
Accumulated Amortization Accumulated Book value
Transfers
amortization as charge for amortization as as at
at 1 January the year at 31 December 31 December
Computer software
and licenses 169,443,220 51,621,299
- - 221,064,519 50,498,075 28,989,173 - 79,487,248 141,577,271 5-33%
Accumulated Amortization Accumulated Book value
Transfers
amortization as charge for amortization as as at
at 1 January the year at 31 December 31 December
Computer software
and licenses 72,107,753 29,003,609 68,331,858 - 169,443,220 29,860,235 20,637,840 - 50,498,075 118,945,145 5-30%
Particulars
2017
RateCost as at
1 January Additions Disposals
Cost as at
31 December Disposals
Rupees
Rupees
Particulars
2016
RateCost as at
1 January Additions Disposals
Cost as at
31 DecemberDisposals
RupeesRupeesRupeesRupeesRupeesRupeesRupeesRupeesRupees
Rupees Rupees Rupees Rupees Rupees Rupees Rupees Rupees Rupees
6.1 The cost of the intangibles include intangible assets amounting to Rs. 22.78 (2016: Rs. 15.72) million with nil book value.
6.2 Additions include in-house developed intangibles amounting to Rs. 48.41 (2016: Rs. 97.34) million capitalized during the current year.
6.3 Amortization charge for the year has been allocated as follows:
Cost of revenue 24
Distribution expenses 25
Administrative expenses 26
23,214,556
232,264
5,542,353
28,989,173
17,452,418
215,209
2,970,213
20,637,840
2017 2016
Note Rupees Rupees
7. DEFERRED TAXATION - NET
Taxable temporary differences:
Depreciation on property and equipment (2,537,857) -
Deductible temporary differences:
Depreciation on property and equipment - 628,008
Amortization on intangibles 645,506 370,393
Provision for doubtful debts 8,359,110 846,158
Employees compensation reserve 505,658 3,808,627
Unearned revenue - 4,316,276
Unearned leaves 192,030 -
Minimum tax 24,607,277 15,307,401
34,309,581 25,276,863
31,771,724 25,276,863
Annual Report 2017
8.
220,395,878
187,904,849
8.1 408,300,727
(14,640,946)
393,659,781
8.1
9.
9.1 847,794,332
260,610,817
1,108,405,149
7,349,764
28,310,433
35,660,197
1,144,065,346
9.2 (11,179,257)
(24,480,940)
(35,660,197)
189,914,015
350,634,652
540,548,667
(49,535,932)
491,012,735
776,861,749
232,887,646
1,009,749,395
59,261,536
38,417,236
97,678,772
1,107,428,167
(42,020,516)
(55,658,256)
(97,678,772)
1,009,749,395 1,108,405,149
UNBILLED REVENUE
Considered good - unsecured
Export
Local
Less: Unbilled revenue written off
TRADE DEBTS
Considered good - unsecured
Export
Local
Considered doubtful - unsecured
Export
Local
Less: Provision for doubtful debts
Less: Bad debt written off
This represents work performed but not billed to the client.
9.2 Balance as at 01 January 11,179,257
11,971,419
Provision made during the year 32,920,558
793,118
Less: provision reversed during the year (2,079,299)
(1,585,280)
Net charge for the year 30,841,259
(792,162)
Balance as at 31 December 42,020,516
11,179,257
2017 2016
Note Rupees Rupees
9.1 This includes receivable against sale of services from Visionet Systems Incorporation - USA amounting to Rs. 329 (2016: 646.46) million.
2017 2016
Rupees Rupees
108 109
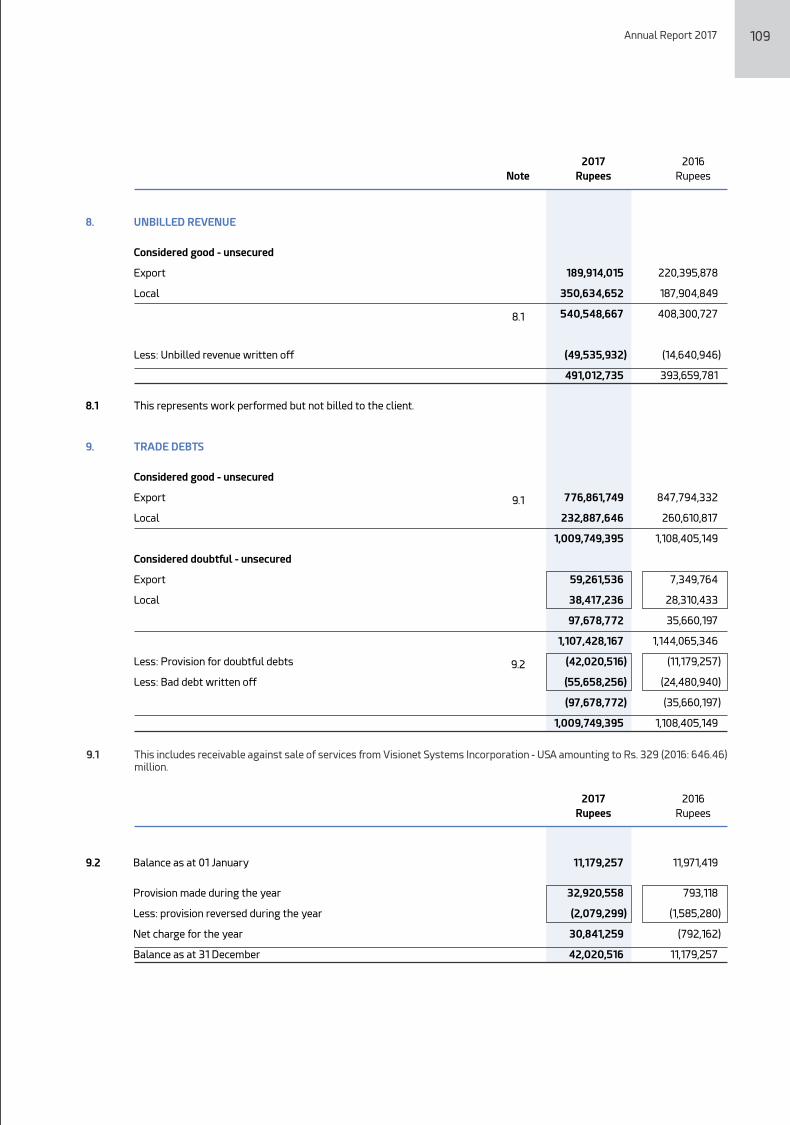
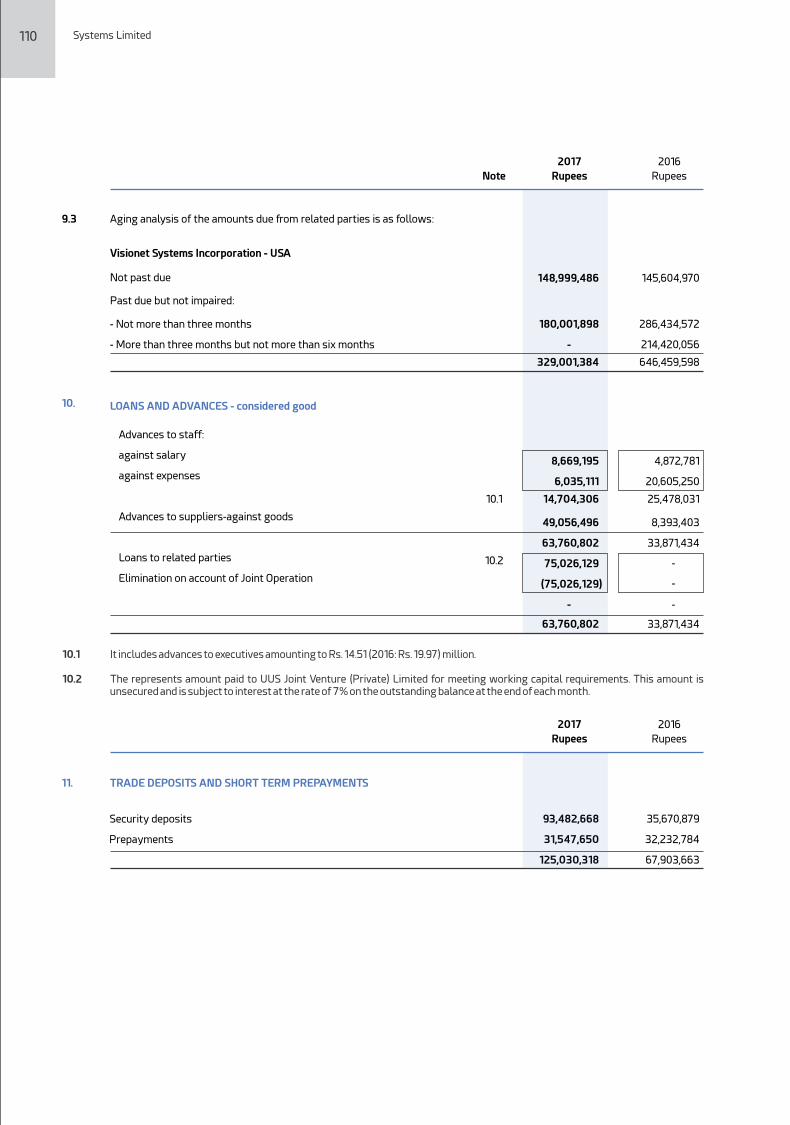
11. TRADE DEPOSITS AND SHORT TERM PREPAYMENTS
Security deposits 93,482,668
35,670,879
Prepayments 31,547,650
32,232,784
125,030,318
67,903,663
110 Systems Limited
2017 2016
Note Rupees Rupees
9.3
10.
10.1
10.2
Aging analysis of the amounts due from related parties is as follows:
Visionet Systems Incorporation - USA
Not past due
Past due but not impaired:
- Not more than three months
- More than three months but not more than six months
LOANS AND ADVANCES - considered good
Advances to staff:
against salary
against expenses
Advances to suppliers-against goods
Loans to related parties
Elimination on account of Joint Operation
148,999,486
180,001,898
-
329,001,384
8,669,195
6,035,111
14,704,306
49,056,496
63,760,802
75,026,129
(75,026,129)
-
63,760,802
145,604,970
286,434,572
214,420,056
646,459,598
4,872,781
20,605,250
25,478,031
8,393,403
33,871,434
-
-
-
33,871,434
10.1 It includes advances to executives amounting to Rs. 14.51 (2016: Rs. 19.97) million.
10.2 The represents amount paid to UUS Joint Venture (Private) Limited for meeting working capital requirements. This amount is unsecured and is subject to interest at the rate of 7% on the outstanding balance at the end of each month.
2017 2016
Rupees Rupees
12. OTHER RECEIVABLES
These represents receivables from following related parties.
Considered good - unsecured
Visionet Systems Incorporation - USA 12.1
2,593,326
TechVista Information Technology - Qatar 12.2
129,120,377
TechVista Information Technology - Australia 12.3
18,277,609
TechVista Systems LLC 12.4
353,547
150,344,859
4,118,251
132,605,001
-
-
136,723,252
Annual Report 2017 111
2017 2016
Note Rupees Rupees
12.1 This represents amount receivable against expenses incurred on behalf of Visionet Systems Incorporation and are payable on demand by the company. These receivables are unsecured and interest free.
12.2 This represents amount receivable against expenses incurred on behalf of TechVista Information Technology - Qatar and are payable on demand by the company. These receivables are unsecured and interest free.
12.3 This represents amount receivable against expenses incurred on behalf of TechVista Information Technology - Australia and are payable on demand by the company. These receivables are unsecured and interest free.
12.4 This represents amount receivable against expenses incurred on behalf of TechVista Systems LLC and are payable on demand by the company. These receivables are unsecured and interest free.
13. SHORT TERM INVESTMENTS
Held to maturity
Habib Metropolitan Bank 13.1 225,000,000
253,000,000
14. TAX REFUNDS DUE FROM THE GOVERNMENT
Balance as at 01 January 98,958,341 55,143,956
Income tax paid during the year 57,594,871 59,782,080
Provision for the year 30 (15,508,334) (15,967,695)
Balance as at 31 December 141,044,878 98,958,341
2017 2016
Note Rupees Rupees
13.1 These are Term Deposit Receipts (TDRs) carrying markup at rates ranging from 3.93% to 5.85% (2016: 5.85% to 6.5% ) per annum.
2017 2016
Note Rupees Rupees
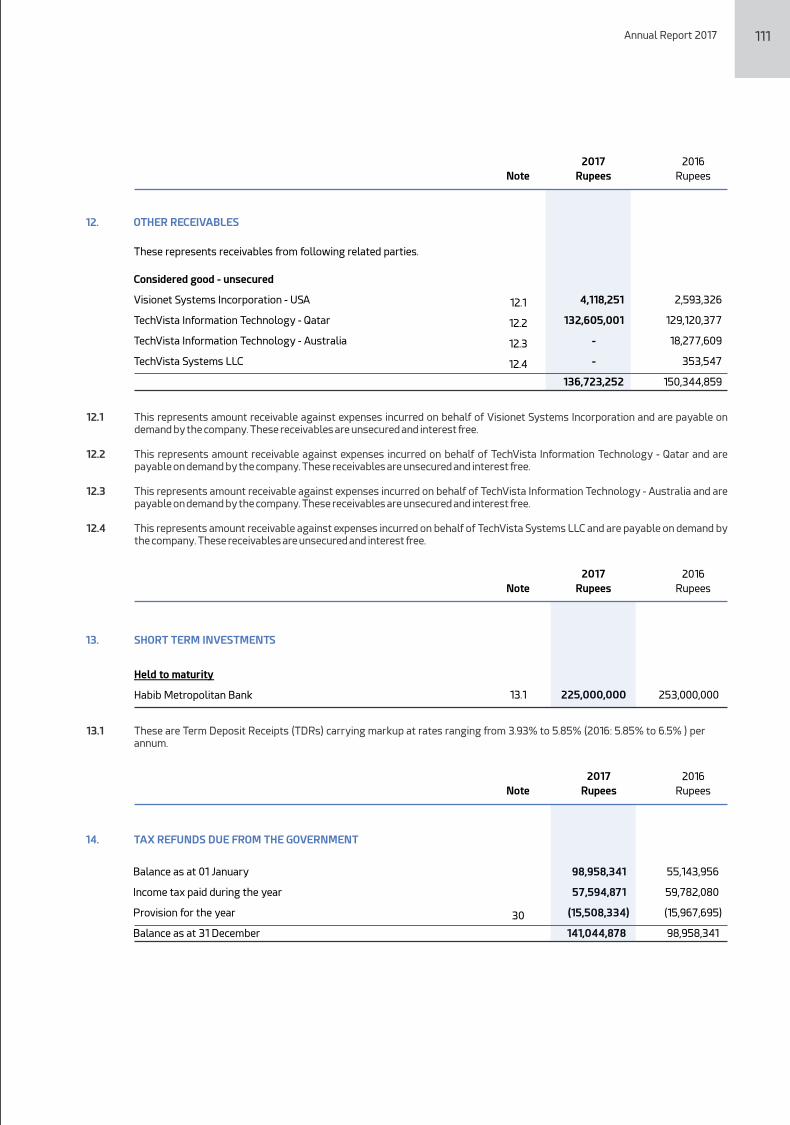
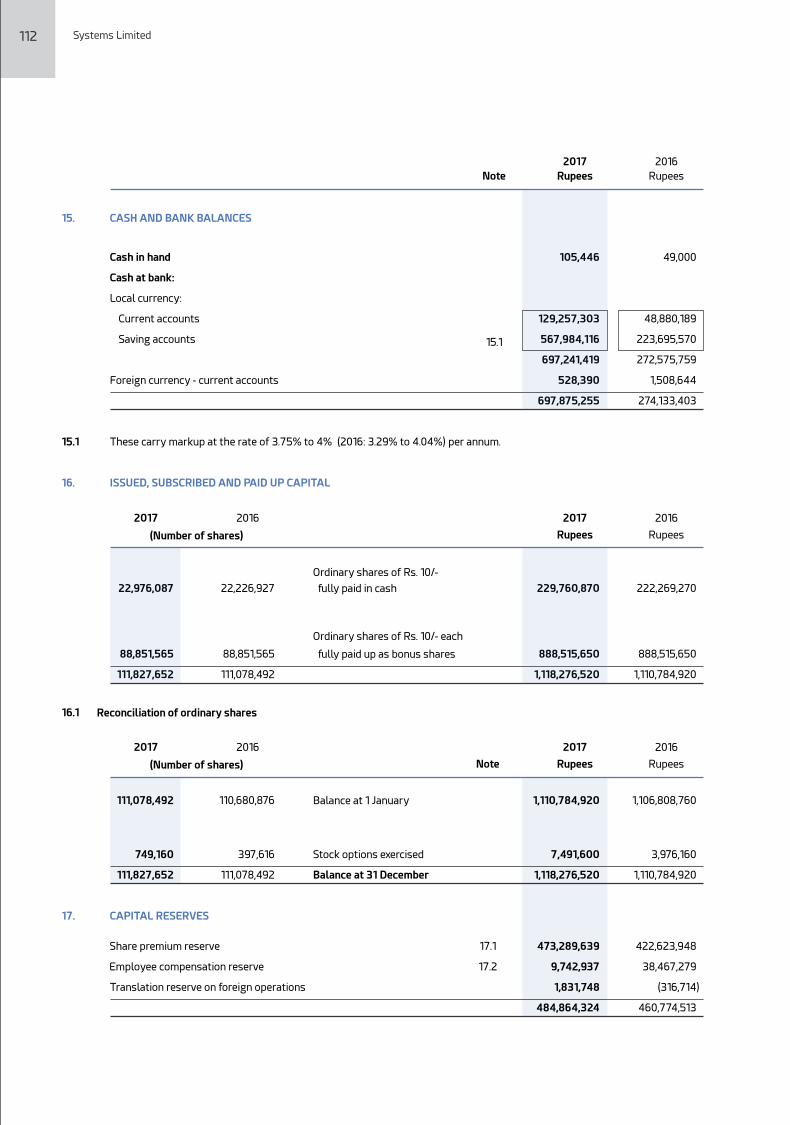
15.1
16.
2017 2016 2017 2016
(Number of shares) Rupees Rupees
Ordinary shares of Rs. 10/-
22,976,087
22,226,927
fully paid in cash 229,760,870
222,269,270
Ordinary shares of Rs. 10/- each
fully paid up as bonus shares88,851,565
88,851,565
888,515,650
888,515,650
111,827,652 111,078,492 1,118,276,520 1,110,784,920
16.1 Reconciliation of ordinary shares
111,078,492 110,680,876 1,110,784,920 1,106,808,760
749,160
397,616
7,491,600
3,976,160
111,827,652
111,078,492
Balance at 1 January
Stock options exercised
Balance at 31 December 1,118,276,520
1,110,784,920
17. CAPITAL RESERVES
Share premium reserve 17.1 473,289,639
422,623,948
Employee compensation reserve 17.2 9,742,937
38,467,279
Translation reserve on foreign operations 1,831,748
(316,714)
484,864,324
460,774,513
15.
15.1
These carry markup at the rate of 3.75% to 4% (2016: 3.29% to 4.04%) per annum.
ISSUED, SUBSCRIBED AND PAID UP CAPITAL
CASH AND BANK BALANCES
Cash in hand
Cash at bank:
Local currency:
Current accounts
Saving accounts
Foreign currency - current accounts
105,446
129,257,303
567,984,116
697,241,419
528,390
697,875,255
49,000
48,880,189
223,695,570
272,575,759
1,508,644
274,133,403
112 Systems Limited
2017 2016
Note Rupees Rupees
2017 2016 2017 2016
(Number of shares) Rupees RupeesNote
Annual Report 2017 113
17.1 This reserve shall be utilized only for the purpose as specied in section 81(2) of the Companies Act 2017.
17.2 This represents balance amount after exercise of share options by the employees under the Employee Stock Option Scheme approved by SECP. According to the scheme, 100% options become exercisable after completion of vesting period from date of grant. The options have a vesting period of 2 years and an exercise period of 3 years from the date the option is vested.
17.3 The following table illustrates the number and weighted average exercise prices of, and movements in, share options during the year:
Outstanding at 1 January
Granted during the year
Exercised during the year
Outstanding at 31 December
19.
19.1
19.1
TRADE AND OTHER PAYABLES
Creditors
Advance from customers
Retention Money
Accrued liabilities
Provision for Worker's Welfare Fund (WWF)
Provident fund payable
Withholding income tax payable
Sales tax payable
Other payables
Worker's Welfare Fund (WWF)
Opening balance
Reversed during the year
Closing balance
160,799,406
1,541,005
335,116
234,218,365 -
16,565,033
9,451,235
-
8,297,770
431,207,930
17,930,514
(17,930,514)
-
16,868,179
4,270,423
11,604,035
194,071,875
17,930,514
10,345,091
7,117,368
5,007,552
4,351,988
271,567,025
17,930,514
-
17,930,514
Weighted average
exercise price
Number ofoptions
Rupees Number
23.5 1,242,385
45.98 406,383
15.84 (397,616)
26.48
72.15
20.13
33.39
1,251,152
479,597
(749,160)
981,589 26.48 1,251,152
2017 2016
Weighted average
exercise price
Number ofoptions
Number Rupees
18. LONG TERM ADVANCES
This represents advances received from staff and will be adjusted as per Group's car policy against sale of vehicles. These advances are interest free and not being carried at amortized cost as the related impact would be immaterial.
2017 2016
Note Rupees Rupees
20. UNEARNED REVENUE
This represents professional/software development services, license and license support services and others fee received in advance.
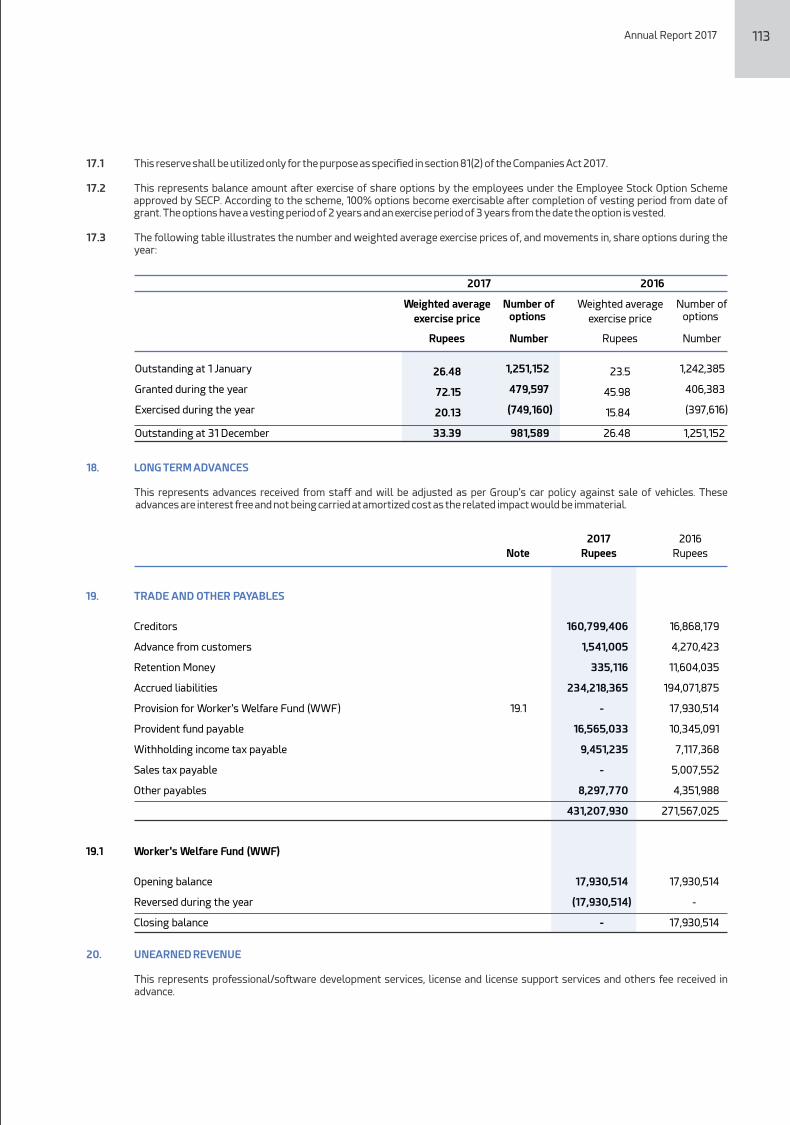
15.1
16.
2017 2016 2017 2016
(Number of shares) Rupees Rupees
Ordinary shares of Rs. 10/-
22,976,087
22,226,927
fully paid in cash 229,760,870
222,269,270
Ordinary shares of Rs. 10/- each
fully paid up as bonus shares88,851,565
88,851,565
888,515,650
888,515,650
111,827,652 111,078,492 1,118,276,520 1,110,784,920
16.1 Reconciliation of ordinary shares
111,078,492 110,680,876 1,110,784,920 1,106,808,760
749,160
397,616
7,491,600
3,976,160
111,827,652
111,078,492
Balance at 1 January
Stock options exercised
Balance at 31 December 1,118,276,520
1,110,784,920
17. CAPITAL RESERVES
Share premium reserve 17.1 473,289,639
422,623,948
Employee compensation reserve 17.2 9,742,937
38,467,279
Translation reserve on foreign operations 1,831,748
(316,714)
484,864,324
460,774,513
15.
15.1
These carry markup at the rate of 3.75% to 4% (2016: 3.29% to 4.04%) per annum.
ISSUED, SUBSCRIBED AND PAID UP CAPITAL
CASH AND BANK BALANCES
Cash in hand
Cash at bank:
Local currency:
Current accounts
Saving accounts
Foreign currency - current accounts
105,446
129,257,303
567,984,116
697,241,419
528,390
697,875,255
49,000
48,880,189
223,695,570
272,575,759
1,508,644
274,133,403
112 Systems Limited
2017 2016
Note Rupees Rupees
2017 2016 2017 2016
(Number of shares) Rupees RupeesNote
Annual Report 2017 113
17.1 This reserve shall be utilized only for the purpose as specied in section 81(2) of the Companies Act 2017.
17.2 This represents balance amount after exercise of share options by the employees under the Employee Stock Option Scheme approved by SECP. According to the scheme, 100% options become exercisable after completion of vesting period from date of grant. The options have a vesting period of 2 years and an exercise period of 3 years from the date the option is vested.
17.3 The following table illustrates the number and weighted average exercise prices of, and movements in, share options during the year:
Outstanding at 1 January
Granted during the year
Exercised during the year
Outstanding at 31 December
19.
19.1
19.1
TRADE AND OTHER PAYABLES
Creditors
Advance from customers
Retention Money
Accrued liabilities
Provision for Worker's Welfare Fund (WWF)
Provident fund payable
Withholding income tax payable
Sales tax payable
Other payables
Worker's Welfare Fund (WWF)
Opening balance
Reversed during the year
Closing balance
160,799,406
1,541,005
335,116
234,218,365 -
16,565,033
9,451,235
-
8,297,770
431,207,930
17,930,514
(17,930,514)
-
16,868,179
4,270,423
11,604,035
194,071,875
17,930,514
10,345,091
7,117,368
5,007,552
4,351,988
271,567,025
17,930,514
-
17,930,514
Weighted average
exercise price
Number ofoptions
Rupees Number
23.5 1,242,385
45.98 406,383
15.84 (397,616)
26.48
72.15
20.13
33.39
1,251,152
479,597
(749,160)
981,589 26.48 1,251,152
2017 2016
Weighted average
exercise price
Number ofoptions
Number Rupees
18. LONG TERM ADVANCES
This represents advances received from staff and will be adjusted as per Group's car policy against sale of vehicles. These advances are interest free and not being carried at amortized cost as the related impact would be immaterial.
2017 2016
Note Rupees Rupees
20. UNEARNED REVENUE
This represents professional/software development services, license and license support services and others fee received in advance.
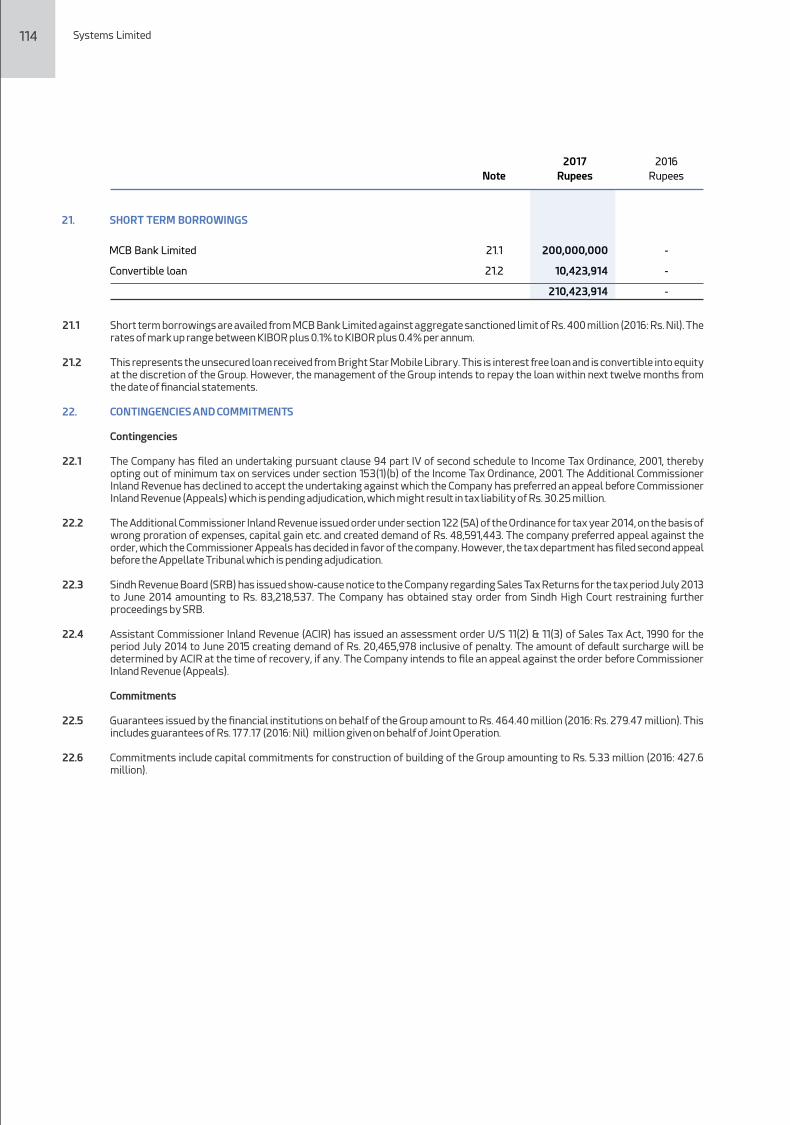
21. SHORT TERM BORROWINGS
MCB Bank Limited 21.1
-
Convertible loan 21.2
-
-
200,000,000
10,423,914
210,423,914
Systems Limited
2017 2016
Note Rupees Rupees
21.1 Short term borrowings are availed from MCB Bank Limited against aggregate sanctioned limit of Rs. 400 million (2016: Rs. Nil). The rates of mark up range between KIBOR plus 0.1% to KIBOR plus 0.4% per annum.
21.2 This represents the unsecured loan received from Bright Star Mobile Library. This is interest free loan and is convertible into equity at the discretion of the Group. However, the management of the Group intends to repay the loan within next twelve months from the date of nancial statements.
22. CONTINGENCIES AND COMMITMENTS
Contingencies
22.1 The Company has led an undertaking pursuant clause 94 part IV of second schedule to Income Tax Ordinance, 2001, thereby opting out of minimum tax on services under section 153(1)(b) of the Income Tax Ordinance, 2001. The Additional Commissioner Inland Revenue has declined to accept the undertaking against which the Company has preferred an appeal before Commissioner Inland Revenue (Appeals) which is pending adjudication, which might result in tax liability of Rs. 30.25 million.
22.2 The Additional Commissioner Inland Revenue issued order under section 122 (5A) of the Ordinance for tax year 2014, on the basis of wrong proration of expenses, capital gain etc. and created demand of Rs. 48,591,443. The company preferred appeal against the order, which the Commissioner Appeals has decided in favor of the company. However, the tax department has led second appeal before the Appellate Tribunal which is pending adjudication.
22.3 Sindh Revenue Board (SRB) has issued show-cause notice to the Company regarding Sales Tax Returns for the tax period July 2013 to June 2014 amounting to Rs. 83,218,537. The Company has obtained stay order from Sindh High Court restraining further proceedings by SRB.
22.4 Assistant Commissioner Inland Revenue (ACIR) has issued an assessment order U/S 11(2) & 11(3) of Sales Tax Act, 1990 for the period July 2014 to June 2015 creating demand of Rs. 20,465,978 inclusive of penalty. The amount of default surcharge will be determined by ACIR at the time of recovery, if any. The Company intends to le an appeal against the order before Commissioner Inland Revenue (Appeals).
Commitments
22.5 Guarantees issued by the nancial institutions on behalf of the Group amount to Rs. 464.40 million (2016: Rs. 279.47 million). This includes guarantees of Rs. 177.17 (2016: Nil) million given on behalf of Joint Operation.
22.6 Commitments include capital commitments for construction of building of the Group amounting to Rs. 5.33 million (2016: 427.6 million).
24.
24.1 1,840,061,211 1,620,264,152
58,811,145 6,201,067
4,371,352 4,274,310
1,926,442 3,038,957
11,440,616 8,302,015
52,015,588 71,206,302
35,496,110 41,317,630
85,896,872 60,197,206
11,292,303
12,851,935
48,353,263
42,325,186
9,778,863
7,451,537
6,867,582
6,165,089
-
367,500
-
-
11,545,341
4,752,876
4,030,047
2,404,599
5.3 58,497,361
59,141,032
6.3 23,214,556
17,452,418
10,681,144
13,022,805
2,274,279,796
1,980,736,616
COST OF REVENUE
Salaries, allowances and amenities
Commission paid
E - link connectivity charges
Printing and stationery
Computer supplies
Rent, rates and taxes
Electricity, gas and water
Traveling and conveyance
Repair and maintenance
Postage, telephone and telegrams
Vehicle running and maintenance
Entertainment
Third party consultancy
Trade margin
Fee and subscriptions
Insurance
Depreciation
Amortization
Others
Purchase of software and hardware for trading 409,410,841
241,797,285
2,683,690,637
2,222,533,901
Annual Report 2017
23.
23.1
REVENUE - net
Development and other services:
Export
Local
Less: Sales tax on local sales
Trading income:
Software and hardware sale - export
Software and hardware sale - local
Less: Sales tax on local sales 23.1
2,420,956,002
495,334,491
(56,575,138)
438,759,353
6,600,431
278,289,250
(32,502,998)
245,786,252
3,112,102,038
2,880,761,561
557,933,407
(58,516,556)
499,416,851
187,869,637
286,025,716
(21,644,728)
264,380,988
3,832,429,037
2017 2016
Note Rupees Rupees
23.1 This represents sales tax chargeable under Provincial and Federal Sales tax laws.
2017 2016
Note Rupees Rupees
114 115
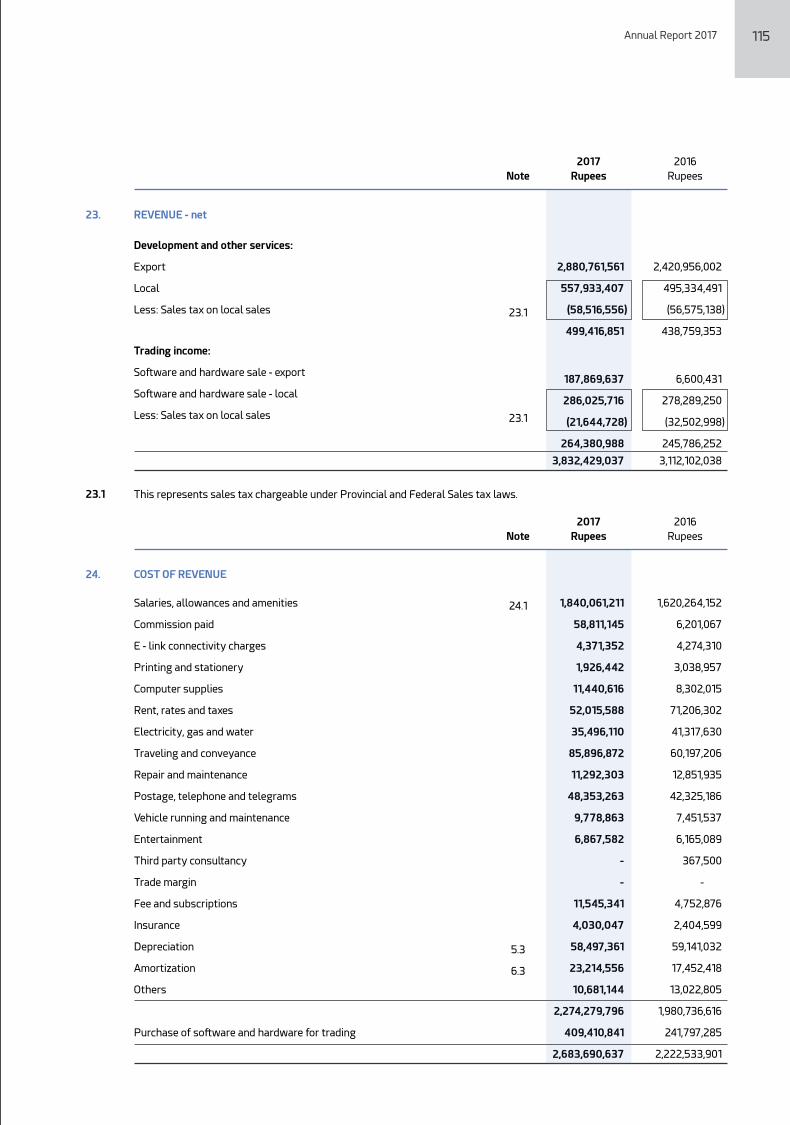
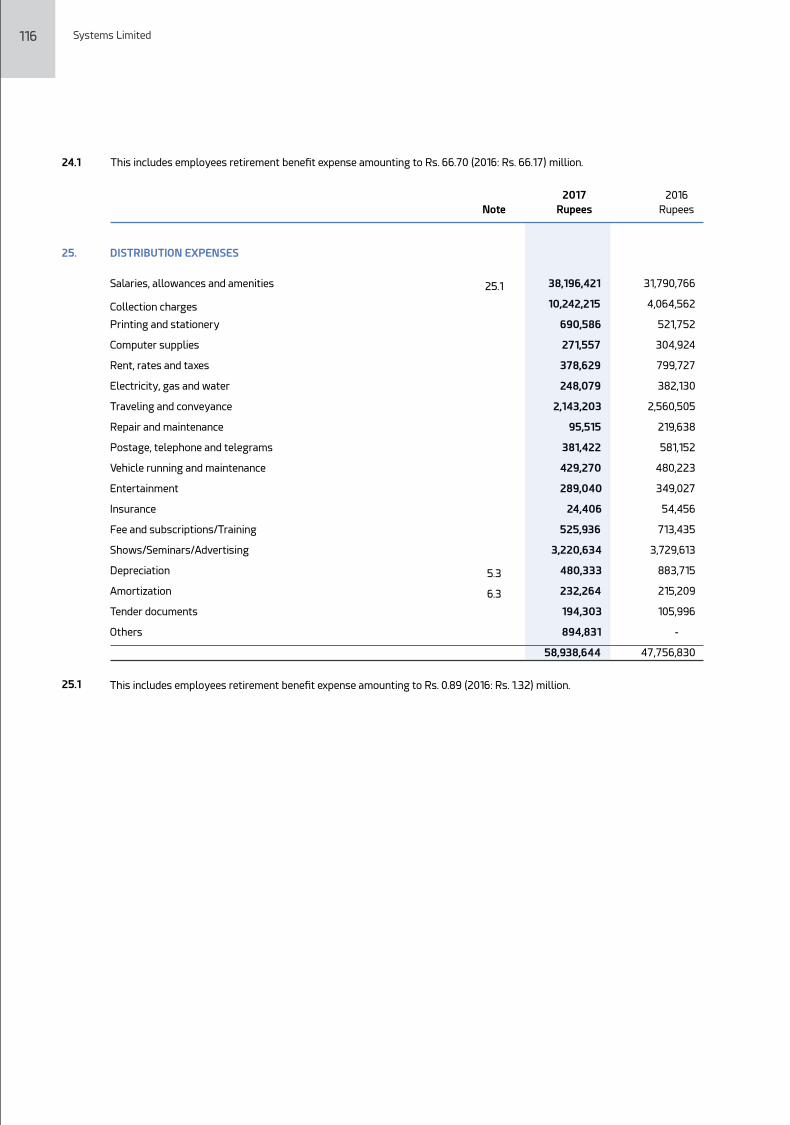
Systems Limited
24.1 This includes employees retirement benet expense amounting to Rs. 66.70 (2016: Rs. 66.17) million.
2017 2016
Note Rupees Rupees
25.
25.1 38,196,421
31,790,766
10,242,215
4,064,562
690,586
521,752
271,557
304,924
378,629
799,727
248,079
382,130
2,143,203
2,560,505
95,515
219,638
381,422
581,152
429,270
480,223
289,040
349,027
24,406
54,456
525,936
713,435
3,220,634
3,729,613
5.3 480,333
883,715
6.3 232,264
215,209
194,303 105,996
DISTRIBUTION EXPENSES
Salaries, allowances and amenities
Collection charges
Printing and stationery
Computer supplies
Rent, rates and taxes
Electricity, gas and water
Traveling and conveyance
Repair and maintenance
Postage, telephone and telegrams
Vehicle running and maintenance
Entertainment
Insurance
Fee and subscriptions/Training
Shows/Seminars/Advertising
Depreciation
Amortization
Tender documents
Others 894,831 -
58,938,644 47,756,830
This includes employees retirement benet expense amounting to Rs. 0.89 (2016: Rs. 1.32) million.25.1
26.
26.1 349,859,561 265,562,620
1,853,882 2,464,905
7,134,847 3,515,077
14,772,372 8,879,177
9,164,340
6,462,032
17,720,023
14,372,141
5,276,340
4,462,658
15,505,482
9,157,562
4,974,409
1,442,642
11,568,990
7,331,183
26.2 2,652,850
1,695,000
3,392,477
2,620,922
26.3 -
45,500
10,959,472
5,078,215
2,028,685
962,731
-
915,424
40,764
49,395
5.3 19,967,470
15,340,200
6.3 5,542,353
2,970,213
ADMINISTRATIVE EXPENSES
Salaries, allowances and amenities
Printing and stationery
Computer supplies
Rent, rates and taxes
Electricity, gas and water
Traveling and conveyance
Repair and maintenance
Postage, telephone and telegrams
Vehicle running and maintenance
Legal and professional
Auditors' remuneration
Entertainment
Donations
Fee and subscriptions/Training
Insurance
Hiring cost
Newspapers, books and periodicals
Depreciation
Amortization
Others 1,591,103
881,054
484,005,420
354,208,651
Annual Report 2017
2017 2016
Note Rupees Rupees
26.1 This includes employees retirement benet expense amounting to Rs. 13.03 (2016: Rs. 7.25) million.
26.2 Auditors' remuneration
Statutory audit fee 2,110,850
1,092,500
Half yearly review 542,000
602,500
2,652,850
1,695,000
26.3 The Directors or their spouses have no interest in the Donee's fund.
27. OTHER OPERATING EXPENSES
Provision for doubtful debts 32,681,252
793,118
Bad debts - direct written off 103,152,843
37,536,606
135,834,095
38,329,724
2017 2016
Rupees Rupees
116 117
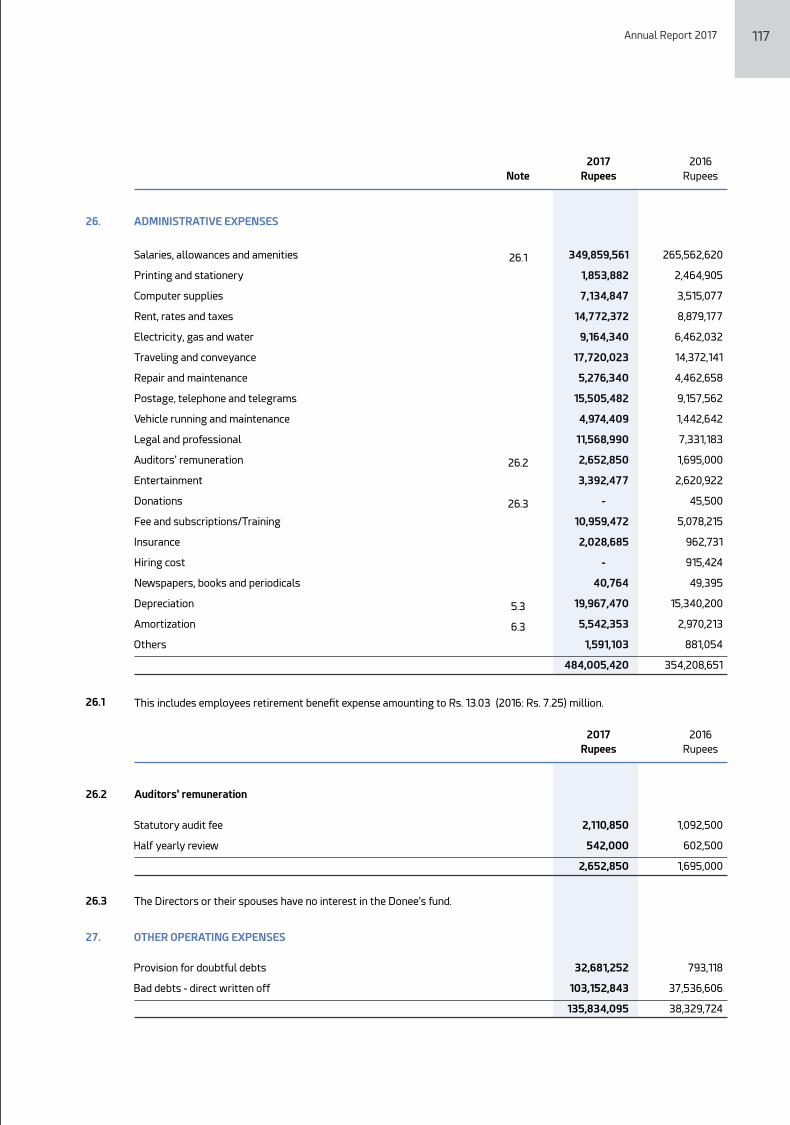
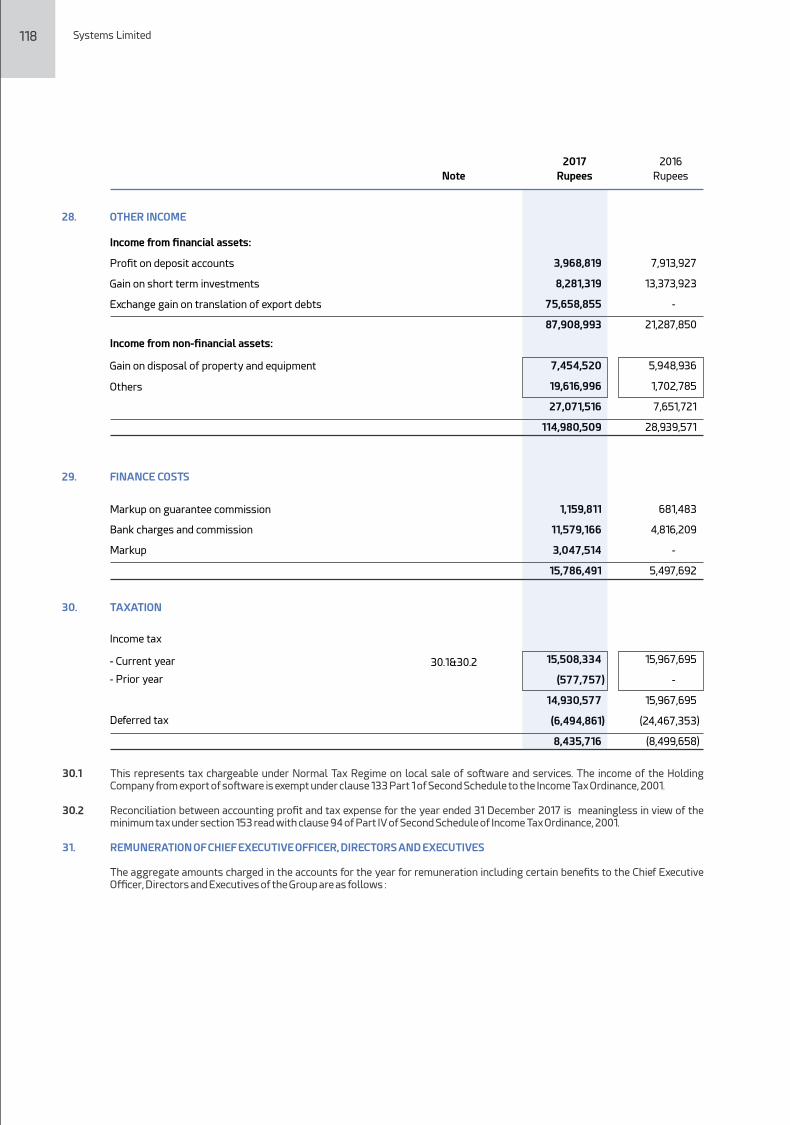
28.
3,968,819 7,913,927
8,281,319 13,373,923
75,658,855 -
87,908,993 21,287,850
7,454,520 5,948,936
19,616,996 1,702,785
27,071,516 7,651,721
114,980,509 28,939,571
29.
1,159,811 681,483
11,579,166 4,816,209
3,047,514 -
15,786,491
5,497,692
30.
30.1&30.2 15,508,334
15,967,695
(577,757)
-
14,930,577
15,967,695
OTHER INCOME
Income from nancial assets:
Prot on deposit accounts
Gain on short term investments
Exchange gain on translation of export debts
Income from non-nancial assets:
Gain on disposal of property and equipment
Others
FINANCE COSTS
Markup on guarantee commission
Bank charges and commission
Markup
TAXATION
Income tax
- Current year
- Prior year
Deferred tax (6,494,861)
(24,467,353)
8,435,716
(8,499,658)
Systems Limited
2017 2016
Note Rupees Rupees
30.1 This represents tax chargeable under Normal Tax Regime on local sale of software and services. The income of the Holding Company from export of software is exempt under clause 133 Part 1 of Second Schedule to the Income Tax Ordinance, 2001.
30.2 Reconciliation between accounting prot and tax expense for the year ended 31 December 2017 is meaningless in view of the minimum tax under section 153 read with clause 94 of Part IV of Second Schedule of Income Tax Ordinance, 2001.
31. REMUNERATION OF CHIEF EXECUTIVE OFFICER, DIRECTORS AND EXECUTIVES
The aggregate amounts charged in the accounts for the year for remuneration including certain benets to the Chief Executive Officer, Directors and Executives of the Group are as follows :
Annual Report 2017
Managerial remuneration 31.1
Retirement benets
38,710,500
1,720,000
40,430,500
Rupees
2017
35,113,965
1,380,000
36,493,965
Rupees
2016
1,156,676,713
61,798,532
1,218,475,245
2016
Rupees
6,000,000
-
6,000,000
2016
Rupees
6,000,000
-
6,000,000
2017
Rupees
-
-
-
2016
Rupees
-
-
-
2017
Rupees
1,518,167,560
67,248,614
1,585,416,174
2017
RupeesNote
31.1 Managerial remuneration of Chief Executive Officer includes incentive on account of bonus amounting to Rs. Nil (2016: Rs. Nil) million and remuneration from subsidiary company Tech Vista Systems FZ LLC amounting to Rs. 12,910,500 (2016: Rs. 14,413,965)
31.2 The Chief Executive Officer and certain executives are also provided with free medical reimbursements, mobile phone facility and free use of the Group maintained cars in accordance with their entitlement.
31.3 During the current year, Chief Executive Officer and certain executives of the Group exercised stock option under employee stock option scheme according to which 749,160 (2016: 397,616) shares were allotted to them respectively.
32. OPERATING SEGMENT INFORMATION
Geographical segments
For management purposes, the Group is organized into business units based on their geographical areas and has three reportable operating segments as follows:
a. North America
b. Middle East
c. Pakistan
No other operating segments have been aggregated to form the above reportable operating segments.
Management monitors the operating results of its operating segments separately for the purpose of performance assessment. Segment performance is evaluated based on operating prot or loss and is measured consistently with operating prot or loss in the consolidated nancial statements.
Transfer prices between operating segments are on arm’s length basis in a manner similar to transactions with third parties.
Sales
Cost of revenue
Gross prot
Distribution cost
Administrative expenses
Prot / (loss) before taxation and
unallocated income and expenses
2017 2016
1,880,265,469 1,698,799,601
1,581,315,301
985,205,426
763,797,840
684,545,606 (392,949,573) (256,448,595) 3,832,429,037 3,112,102,038
(1,115,490,682) (964,373,443)
(1,213,708,255)
(867,860,150)
(668,364,460)
(646,748,903) 313,872,760 256,448,595 (2,683,690,637) (2,222,533,901)
764,774,787 734,426,158
367,607,046
117,345,276
95,433,380
37,796,703
1,148,738,400 889,568,137
(4,191,336) (2,386,810)
(83,332,282)
(4,462,505)
(50,491,839)
(40,907,515)
79,076,813 - (58,938,644) (47,756,830)
(205,793,539) (159,373,648)
(225,430,287)
(128,580,307)
(52,781,594)
(66,254,696)
-
- (484,005,420) (354,208,651)
(209,984,875) (161,760,458) (308,762,569) (133,042,812) (103,273,433) (107,162,211) (542,944,064) (401,965,481)
554,789,912 572,665,700 58,844,477 (15,697,536) (7,840,053) (69,365,508) 605,794,336 487,602,656
Rupees
North America Middle East Pakistan Inter segment eliminations Total
Rupees
2017
Rupees
2016
Rupees
2016
Rupees
2017
Rupees
2016
Rupees
2017
Rupees
2016
Rupees
2017
Rupees
Number of persons
Chief Executive Officer Executive Director Non Executive Directors
2017
1
Numbers
2016
1
Numbers
695
2016
Numbers
2016
1
Numbers
2017
1
Numbers
2016
6
Numbers
2017
6
Numbers
781
2017
Numbers
Executives
2017 2016
Rupees Rupees
(135,834,095)
114,980,509
(15,786,491)
(36,640,077)
569,154,259
(8,435,716)
560,718,543
(38,329,724)
28,939,571
(5,497,692)
(14,887,845)
472,714,811
8,499,658
481,214,469
32.1
Unallocated income and expenses:
Other operating expenses
Other income
Finance cost
Prot before taxation
Taxation
Prot for the year
Inter segment sales and purchases have been eliminated.
118 119
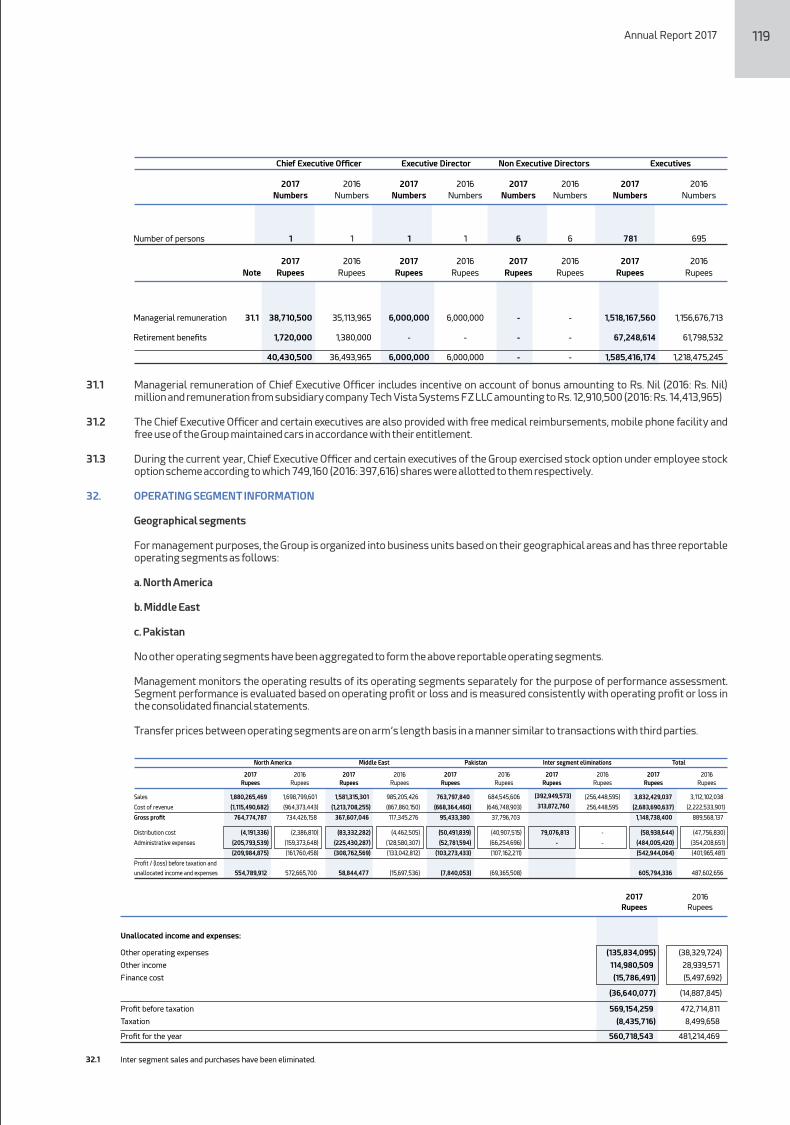
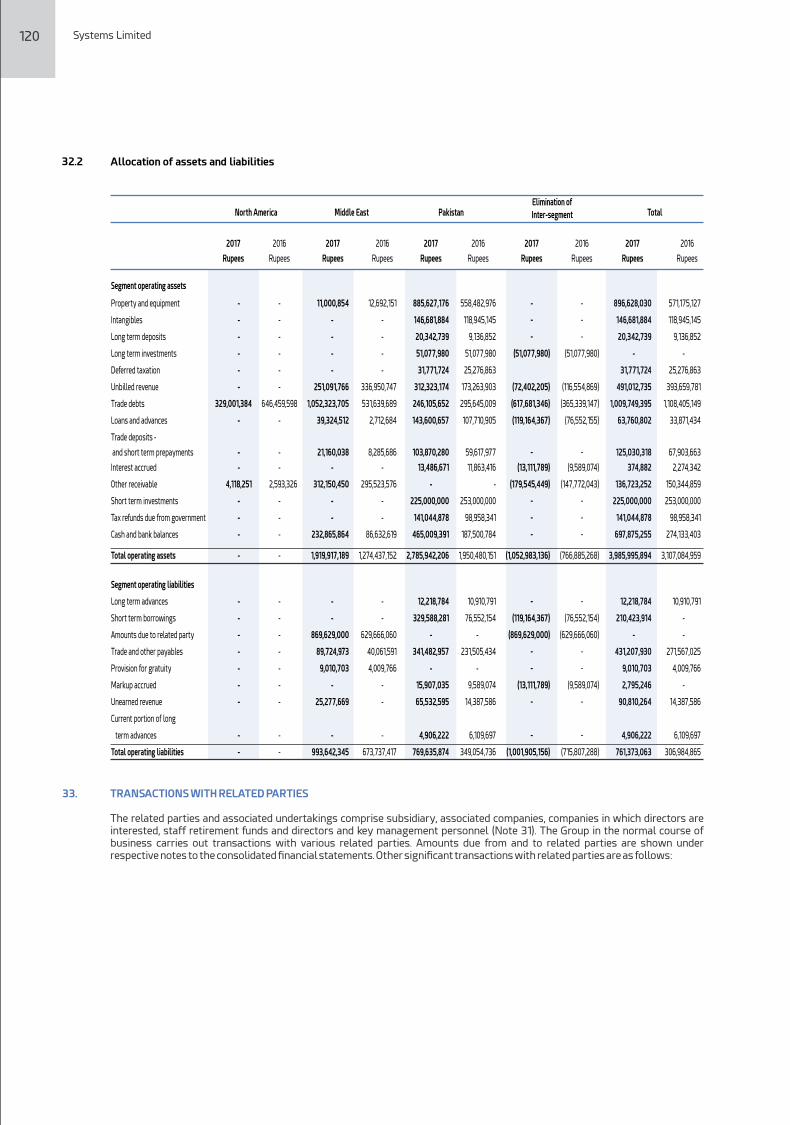
Systems Limited
33. TRANSACTIONS WITH RELATED PARTIES
The related parties and associated undertakings comprise subsidiary, associated companies, companies in which directors are interested, staff retirement funds and directors and key management personnel (Note 31). The Group in the normal course of business carries out transactions with various related parties. Amounts due from and to related parties are shown under respective notes to the consolidated nancial statements. Other signicant transactions with related parties are as follows:
Segment operating assets
Property and equipment
Intangibles
Long term deposits
Long term investments
Deferred taxation
Unbilled revenue
Trade debts
Loans and advances
Trade deposits -
and short term prepayments
Interest accrued
Other receivable
Short term investments
Tax refunds due from government
Cash and bank balances
Total operating assets
Segment operating liabilities
Long term advances
Short term borrowings
Amounts due to related party
Trade and other payables
Provision for gratuity
Markup accrued
Unearned revenue
Current portion of long
term advances
Total operating liabilities
North America Middle East Pakistan TotalElimination of
Inter-segment
2016
571,175,127
118,945,145
9,136,852
-
25,276,863
393,659,781
1,108,405,149
33,871,434
67,903,663
2,274,342
150,344,859
253,000,000
98,958,341
274,133,403
3,107,084,959
10,910,791
-
-
271,567,025
4,009,766
-
14,387,586
6,109,697
306,984,865
Rupees
2017
896,628,030
146,681,884
20,342,739
-
31,771,724
491,012,735
1,009,749,395
63,760,802
125,030,318
374,882
136,723,252
225,000,000
141,044,878
697,875,255
3,985,995,894
12,218,784
210,423,914
-
431,207,930
9,010,703
2,795,246
90,810,264
4,906,222
761,373,063
Rupees
(51,077,980)
(116,554,869)
(365,339,147)
(76,552,155)
(9,589,074)
(147,772,043)
(766,885,268)
(76,552,154)
(629,666,060)
(9,589,074)
(715,807,288)
2016
Rupees
-
-
-
-
-
-
-
-
-
-
-
-
(51,077,980)
(72,402,205)
(617,681,346)
(119,164,367)
(13,111,789)
(179,545,449)
(1,052,983,136)
(119,164,367)
(869,629,000)
(13,111,789)
(1,001,905,156)
-
-
-
-
-
-
-
-
-
-
-
-
2017
Rupees
558,482,976
118,945,145
9,136,852
51,077,980
25,276,863
173,263,903
295,645,009
107,710,905
59,617,977
11,863,416
-
253,000,000
98,958,341
187,500,784
1,950,480,151
10,910,791
76,552,154
-
231,505,434
-
9,589,074
14,387,586
6,109,697
349,054,736
2016
Rupees
885,627,176
146,681,884
20,342,739
51,077,980
31,771,724
312,323,174
246,105,652
143,600,657
103,870,280
13,486,671
-
225,000,000
141,044,878
465,009,391
2,785,942,206
12,218,784
329,588,281
-
341,482,957
-
15,907,035
65,532,595
4,906,222
769,635,874
2017
Rupees
12,692,151
-
-
-
-
336,950,747
531,639,689
2,712,684
8,285,686
-
295,523,576
-
-
86,632,619
1,274,437,152
-
-
629,666,060
40,061,591
4,009,766
-
-
-
673,737,417
2016
Rupees
11,000,854
-
-
-
-
251,091,766
1,052,323,705
39,324,512
21,160,038
-
312,150,450
-
-
232,865,864
1,919,917,189
-
-
869,629,000
89,724,973
9,010,703
-
25,277,669
-
993,642,345
2017
Rupees
-
-
-
-
-
-
646,459,598
-
-
-
2,593,326
-
-
-
-
-
-
-
-
-
-
-
-
-
2016
Rupees
-
-
-
-
-
-
329,001,384
-
-
-
4,118,251
-
-
-
-
-
-
-
-
-
-
-
-
-
2017
Rupees
32.2 Allocation of assets and liabilities
Annual Report 2017
Undertaking
1,839,197,405
1,698,799,601
14,315,997
51,812,580
29,621,105
88,563,032
24,949,656
8,147,596
-
-
9,818,866
18,277,609
75,026,039
-
272,690
-
75,408,409
71,809,824
Sales
Reimbursement of expenses
Sales
Reimbursement of expenses
Sales
Reimbursement of expenses
Payment for expenses
Interest income
Contribution
Nature of transaction
Visionet Systems
Incorporation - USA
Relationship
Associate
Associate
Associate
Joint Operation
TechVista Information
Technology, Qatar
TechVista Systems Pty Ltd,
Australia
UUS Joint Venture (Private)Limited.
Staff retirement funds
2017 2016
Rupees Rupees
34.1
570,012,161 487,035,753
111,622,403 110,979,088
5.11 4.39
34.2
570,012,161 487,035,753
111,622,403 110,979,088
214,296 691,055
111,836,699 111,670,143
Basic earnings per share
Prot for the year after tax
Weighted-average number of ordinary shares as at 31 December
Basic earnings per share (Rupees)
Diluted earnings per share
Prot for the year after tax
Weighted-average number of ordinary shares (basic)
Effect of share options
Weighted average number of ordinary shares - diluted
Diluted earnings per share (Rupees) 5.10 4.36
(Number of shares)
34. EARNINGS PER SHARE- BASIC AND DILUTED
Earnings per share are calculated by dividing the net prot for the year by weighted average number of shares outstanding during the year as follows:
2017 2016
Rupees Rupees
2017 2016
Rupees Rupees
(Number of shares)
120 121
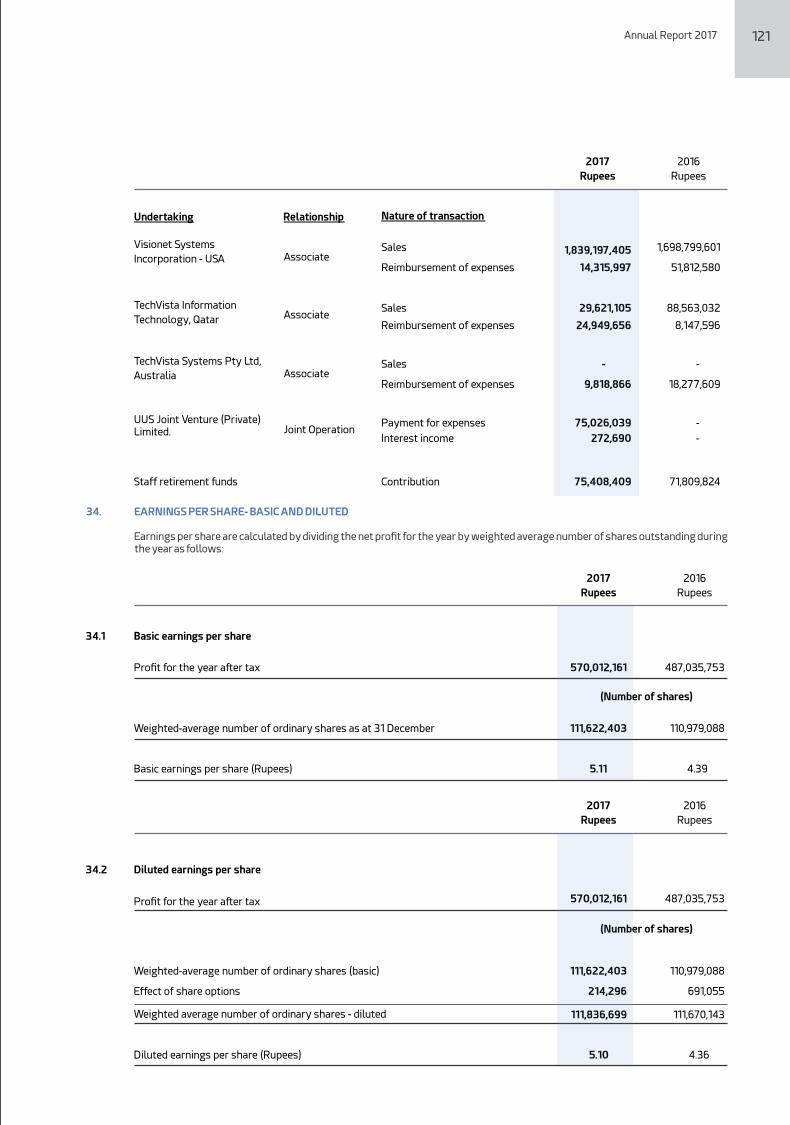
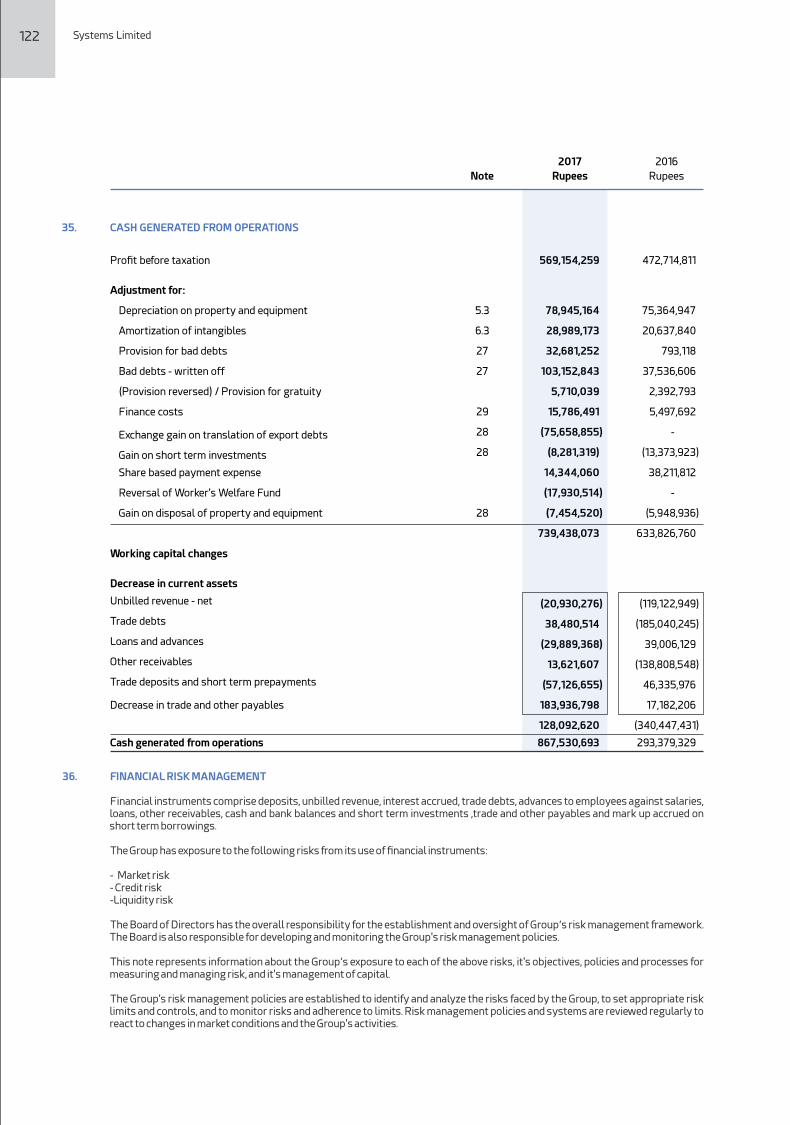
35.
5.3
6.3
27
27
29
28
28
28
CASH GENERATED FROM OPERATIONS
Prot before taxation
Adjustment for:
Depreciation on property and equipment
Amortization of intangibles
Provision for bad debts
Bad debts - written off
(Provision reversed) / Provision for gratuity
Finance costs
Exchange gain on translation of export debts
Gain on short term investments
Share based payment expense
Reversal of Worker's Welfare Fund
Gain on disposal of property and equipment
Working capital changes
Decrease in current assets
Unbilled revenue - net
Trade debts
Loans and advances
Other receivables
Trade deposits and short term prepayments
Decrease in trade and other payables
Cash generated from operations
569,154,259
78,945,164
28,989,173
32,681,252
103,152,843
5,710,039
15,786,491
(75,658,855)
(8,281,319)
14,344,060
(17,930,514)
(7,454,520)
739,438,073
(20,930,276)
38,480,514
(29,889,368)
13,621,607
(57,126,655)
183,936,798
128,092,620
867,530,693
472,714,811
75,364,947
20,637,840
793,118
37,536,606
2,392,793
5,497,692
-
(13,373,923)
38,211,812
-
(5,948,936)
633,826,760
(119,122,949)
(185,040,245)
39,006,129
(138,808,548)
46,335,976
17,182,206
(340,447,431)
293,379,329
Systems Limited
2017 2016
Note Rupees Rupees
36. FINANCIAL RISK MANAGEMENT
Financial instruments comprise deposits, unbilled revenue, interest accrued, trade debts, advances to employees against salaries, loans, other receivables, cash and bank balances and short term investments ,trade and other payables and mark up accrued on short term borrowings.
The Group has exposure to the following risks from its use of nancial instruments:
- Market risk - Credit risk -Liquidity risk
The Board of Directors has the overall responsibility for the establishment and oversight of Group’s risk management framework. The Board is also responsible for developing and monitoring the Group's risk management policies.
This note represents information about the Group’s exposure to each of the above risks, it's objectives, policies and processes for measuring and managing risk, and it's management of capital.
The Group's risk management policies are established to identify and analyze the risks faced by the Group, to set appropriate risk limits and controls, and to monitor risks and adherence to limits. Risk management policies and systems are reviewed regularly to react to changes in market conditions and the Group's activities.
Annual Report 2017
36.1 Market risk
(a) Currency risk
Currency risk is the risk that the fair value or future cash ows of a nancial instrument will uctuate because of changes in foreign exchange rates. Currency risk arises mainly from future commercial transactions or receivables and payables that exist due to transactions in foreign currencies.
Monetary items, including nancial assets and nancial liabilities, denominated in currency other than functional currency of the Group are periodically restated to Pak Rupee equivalent and the associated gain or loss is taken to the consolidated prot and loss account.
The following analysis demonstrates the sensitivity to a reasonably possible change in exchange rates, with all other variables held constant, of the Group's prot before tax.
2017 2016
Rupees Rupees
Receivables - USD +1 1,810,433
6,211,058
-1 (1,810,433)
(6,211,058)
Receivables - AED +1 25,780,694 20,253,918
-1 (25,780,694)
(20,253,918)
Bank balance - USD +1 4,786
14,423
-1 (4,786)
(14,423)
Bank balance - AED +1 7,749,280
3,041,876
-1 (7,749,280) (3,041,876)
Reporting date rate:
USD 110.4 104.5
AED 30.05 28.48
Changes
in Rate
Effects on
Prot
Before Tax
Effects on
Prot
Before Tax
(b) Other price risk
Other price risk is the risk that the fair value or future cash ows of a nancial instrument will uctuate because of changes in market prices (other than those arising from interest rate risk or currency risk). Material investments within the portfolio are managed on an individual basis and all buy and sell decisions are approved by the Board of Directors. The primary goal of the Group's investment strategy is to maximize investment returns.
The Group is not exposed to other price risk as its investments are xed with respect to price and maturity.
(c) Interest rate risk
Interest rate risk represents the risk that the fair value or future cash ows of a nancial instrument will uctuate because of changes in market interest rates.
The Group does not account for any xed rate nancial assets and liabilities at fair value through prot or loss. Therefore, a change in interest rate at the balance sheet date would not affect consolidated prot or loss of the Group.
At the balance sheet date, the interest rate prole of the Group interest-bearing nancial instruments was:
122 123
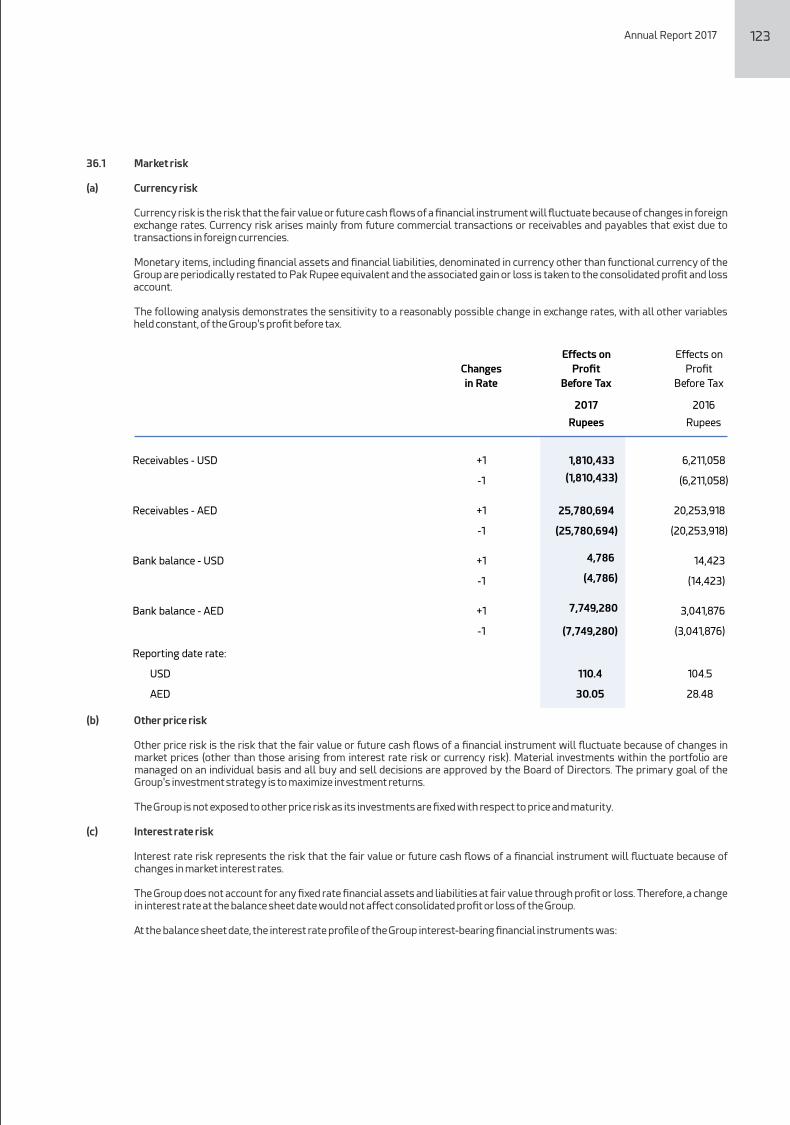
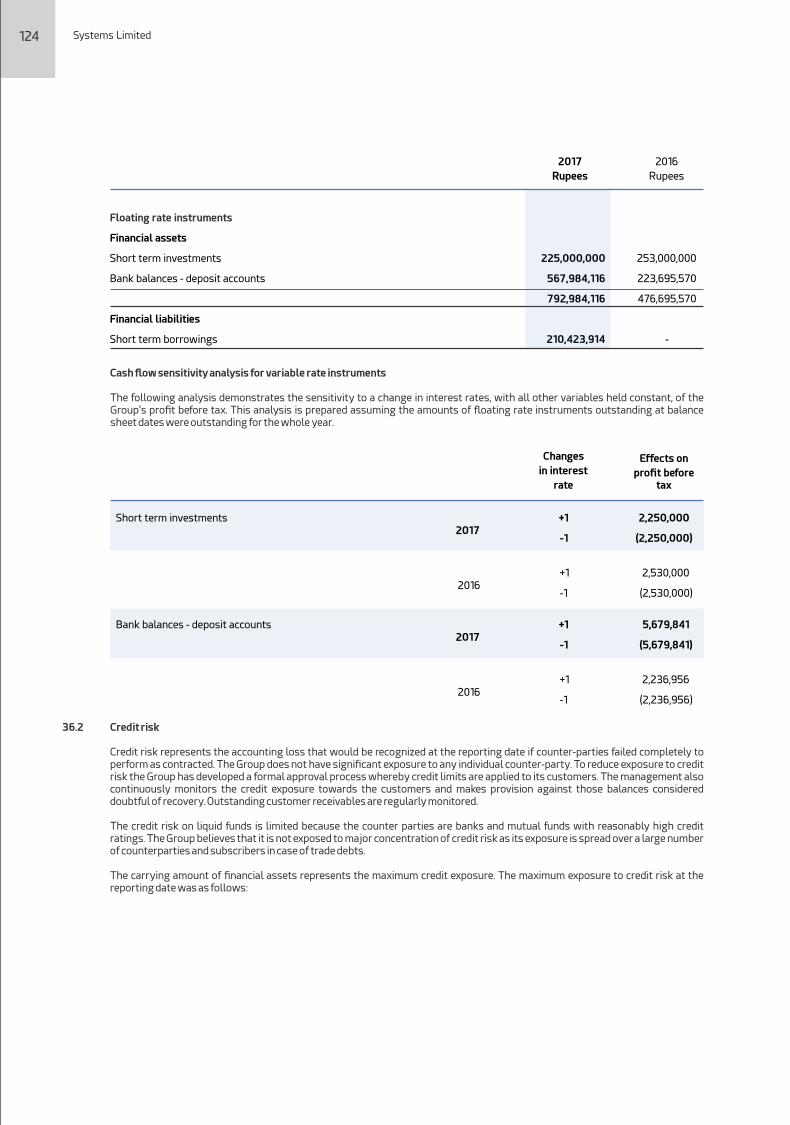
Short term investments
Bank balances - deposit accounts
Effects on
prot beforetax
+1 2,250,000
-1 (2,250,000)
+1 2,530,000
-1 (2,530,000)
+1 5,679,841
-1 (5,679,841)
+1 2,236,956
-1 (2,236,956)
Changes
in interest
rate
2017
2016
2017
2016
Systems Limited
2017 2016
Rupees Rupees
Floating rate instruments
Financial assets
Short term investments 225,000,000 253,000,000
Bank balances - deposit accounts 567,984,116 223,695,570
792,984,116 476,695,570
Financial liabilities
Short term borrowings 210,423,914 -
Cash ow sensitivity analysis for variable rate instruments
The following analysis demonstrates the sensitivity to a change in interest rates, with all other variables held constant, of the Group's prot before tax. This analysis is prepared assuming the amounts of oating rate instruments outstanding at balance sheet dates were outstanding for the whole year.
36.2 Credit risk
Credit risk represents the accounting loss that would be recognized at the reporting date if counter-parties failed completely to perform as contracted. The Group does not have signicant exposure to any individual counter-party. To reduce exposure to credit risk the Group has developed a formal approval process whereby credit limits are applied to its customers. The management also continuously monitors the credit exposure towards the customers and makes provision against those balances considered doubtful of recovery. Outstanding customer receivables are regularly monitored.
The credit risk on liquid funds is limited because the counter parties are banks and mutual funds with reasonably high credit ratings. The Group believes that it is not exposed to major concentration of credit risk as its exposure is spread over a large number of counterparties and subscribers in case of trade debts.
The carrying amount of nancial assets represents the maximum credit exposure. The maximum exposure to credit risk at the reporting date was as follows:
Habib Metropolitan Bank
Bank Islami Pak
United Bank Limited
Faysal Bank
Standard Chartered Bank
Albarakah Bank Limited
Meezan Bank
Dubai Islamic Bank
Bank Alfalah Limited
Deutsche Bank Limited
Habib Bank Limited
MCB Bank Limited
Askari Bank
Habib Bank AG Zurich
Banks
2017 2016
Short term Long term Agency
A1+ AA+ PACRA 336,542,222
338,480,889
A1 A+ PACRA 11,654,637
12,122,489 A1+ AAA JCR-VIS 34,702,766
33,272,178
A1+ AA PACRA 56,618,519
23,017,166
A1+ AAA PACRA 6,521,421
2,531,088
A1 A PACRA 663,662
3,393,035
A1+ AA JCR-VIS 8,108,416
3,953,887
A1 A+ JCR-VIS -
226,404
A1+ AA+ PACRA 1,745,753
1,448,101
P-1 A2 Moody's - 370,991
A1+ AAA JCR-VIS 62,236,314 106,649,779
A1+ AAA PACRA 182,083,331 1,618,396
A1+ AA+ PACRA 1,797 -
N/A N/A 221,890,971 -
922,769,809 527,084,403
Rating
Rupees Rupees
Annual Report 2017
Unbilled revenue
Trade debts
Trade deposits
Advances to employees against salaries
Other receivables
Interest accrued
Short term investment
Bank balances
The aging of trade receivables at the reporting date is:
0 - 120 days
121 - 365 days
Above one year
Impairment above one year
1,009,749,395
113,825,407
8,669,195
136,723,252
374,882
225,000,000
697,769,809
2,683,124,675
888,595,885
115,344,210
47,829,816
1,051,769,911
(42,020,516)
1,009,749,395
393,659,781
1,108,405,149
35,670,879
4,872,781
150,344,859
2,274,342
253,000,000
274,084,403
2,222,312,194
800,359,102
287,399,361
40,760,987
1,128,519,450
(20,114,301)
1,108,405,149
2017 2016
Rupees Rupees
As at year end, 32% of trade receivables (2016: 58.38%) are represented by one customer amounting to Rs. 329 million (2016: Rs. 646.5 million). The management believes that the Group is not exposed to customer concentration risk as this customer is related party of the Group.
Based on past experience and policy of the Group, the management believes that an impairment allowance is necessary in respect of trade receivables past due by one year except if those receivables are recovered subsequent to year end and if management has sufficient grounds to believe that the amounts will be recovered.
The credit quality of nancial assets that are neither past due nor impaired can be assessed by reference to external credit ratings or to historical information about counterparty default rate. The table below shows the bank balances and investments held with some major counterparties at the balance sheet date:
491,012,375
N/A
124 125
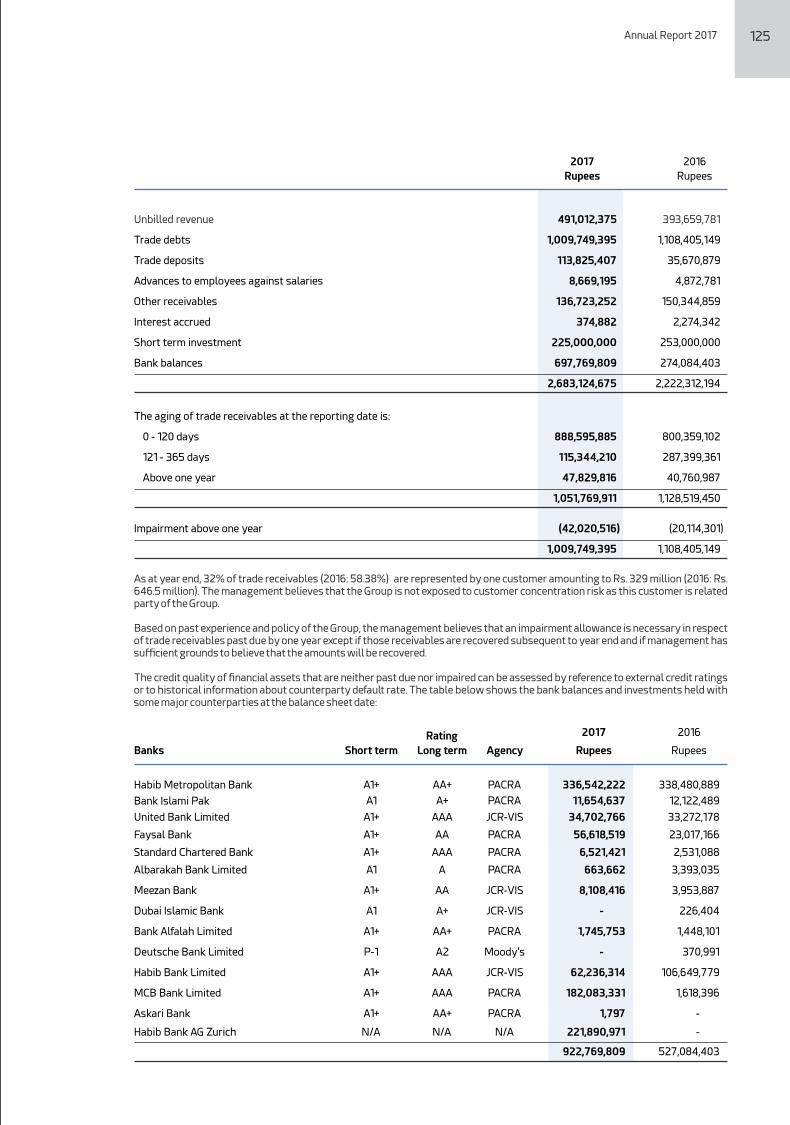
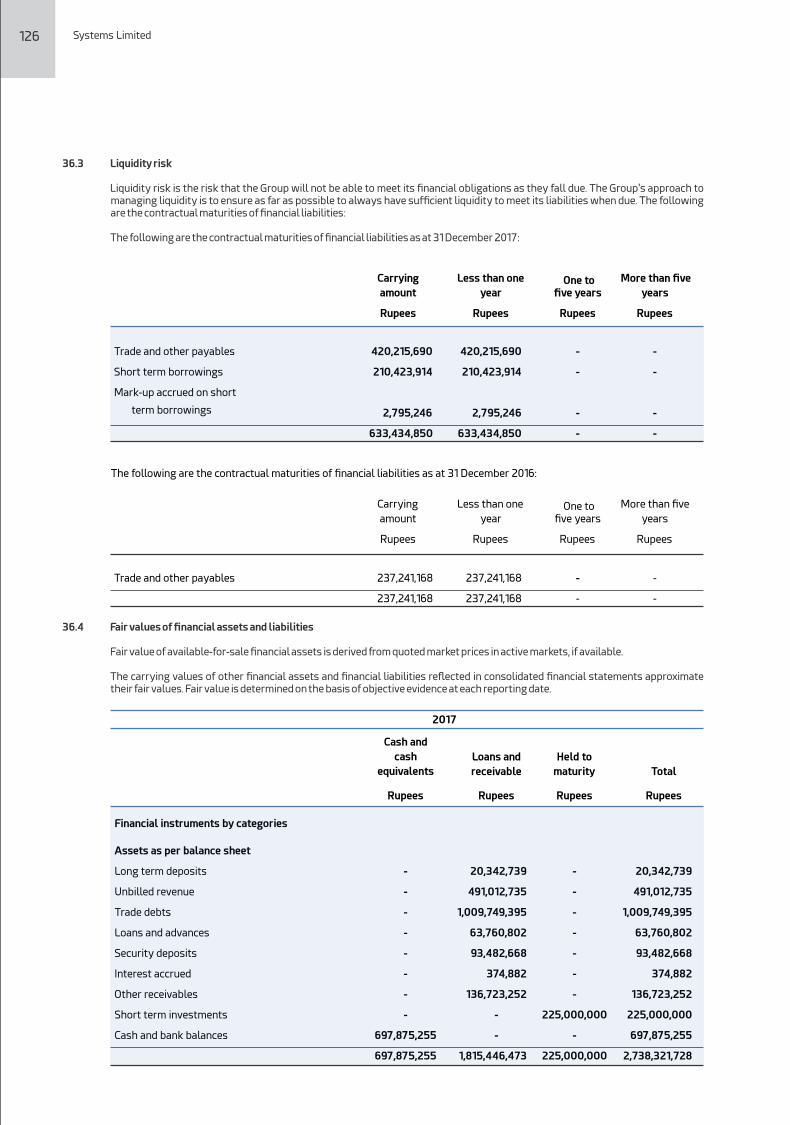
Cash and
cash
equivalents
Financial instruments by categories
Loans and
receivable
Held to
maturity
2017
Total
RupeesRupeesRupeesRupees
Systems Limited
36.3 Liquidity risk
Liquidity risk is the risk that the Group will not be able to meet its nancial obligations as they fall due. The Group's approach to managing liquidity is to ensure as far as possible to always have sufficient liquidity to meet its liabilities when due. The following are the contractual maturities of nancial liabilities:
The following are the contractual maturities of nancial liabilities as at 31 December 2017:
Carrying
amount
Less than one
year One to
ve years
More than ve
years
Trade and other payables 420,215,690
420,215,690
-
-
Short term borrowings 210,423,914
210,423,914
-
-
Mark-up accrued on short
term borrowings 2,795,246
2,795,246
-
-
633,434,850
633,434,850
-
-
RupeesRupeesRupees
Carrying
amount
Less than one
year One to
ve years
More than ve
years
RupeesRupeesRupees
The following are the contractual maturities of nancial liabilities as at 31 December 2016:
Trade and other payables 237,241,168
237,241,168
-
-
237,241,168
237,241,168
-
-
36.4 Fair values of nancial assets and liabilities
Fair value of available-for-sale nancial assets is derived from quoted market prices in active markets, if available.
The carrying values of other nancial assets and nancial liabilities reected in consolidated nancial statements approximate their fair values. Fair value is determined on the basis of objective evidence at each reporting date.
Assets as per balance sheet
Long term deposits - 20,342,739 - 20,342,739
Unbilled revenue - 491,012,735 - 491,012,735
Trade debts - 1,009,749,395 - 1,009,749,395
Loans and advances - 63,760,802 - 63,760,802
Security deposits - 93,482,668 - 93,482,668
Interest accrued - 374,882 - 374,882
Other receivables - 136,723,252 - 136,723,252
Short term investments - - 225,000,000 225,000,000
Cash and bank balances 697,875,255 - - 697,875,255
697,875,255 1,815,446,473 225,000,000 2,738,321,728
Rupees
Rupees
Annual Report 2017
2017 2016
Financial
liabilities at
amortized
cost
Financial
liabilities at
amortized cost
Liabilities as per balance sheet
Rupees Rupees
Mark-up accrued on short term borrowings 2,795,246 -
Short term borrowings 210,423,914 -
Trade and other payables 162,340,411 21,138,602
375,559,571 21,138,602
Long term deposits - 9,136,852 - 9,136,852
Unbilled revenue - 393,659,781 - 393,659,781
Trade debts - 1,108,405,149 - 1,108,405,149
Loans and advances - 33,871,434 - 33,871,434
Security deposits - 35,670,879 - 35,670,879
Interest accrued - 2,274,342 - 2,274,342
Other receivables - 150,344,859 - 150,344,859
Short term investments - - 253,000,000 253,000,000
Cash and bank balances 274,133,403 - - 274,133,403
274,133,403 1,733,363,296 253,000,000 2,260,496,699
Assets as per balance sheet
Cash and
cash
equivalents
Loans and
receivable
Held to
maturity
2016
Total
RupeesRupeesRupeesRupees
36.5 Fair value hierarchy
The Group uses the following hierarchy for determining and disclosing the fair value of nancial instruments by valuation technique:
Level 1: quoted (unadjusted) prices in active markets for identical assets or liabilities.
Level 2: other techniques for which all inputs which have a signicant effect on the recorded fair value are observable either, directly or indirectly.
Level 3: techniques which use inputs that have a signicant effect on the recorded fair value that are not based on observable market data.
As at 31 December 2017 and 31 December 2016, the Group did not have any nancial instruments carried at fair value.
36.6 Capital risk management
The Group’s policy is to safeguard the Group’s ability to remain as a going concern and ensure a strong capital base in order to maintain investors’, creditors’ and market’s condence and to sustain future development of the business. The Board of Directors monitors the returns on capital, which the Group denes as net operating income divided by total shareholders’ equity. The Group’s objectives when managing:
a) to safeguard the group's ability to continue as a going concern, so that it can continue to provide returns for shareholders and benets for other stakeholders; and
b) to provide an adequate return to shareholders by pricing products.
126 127
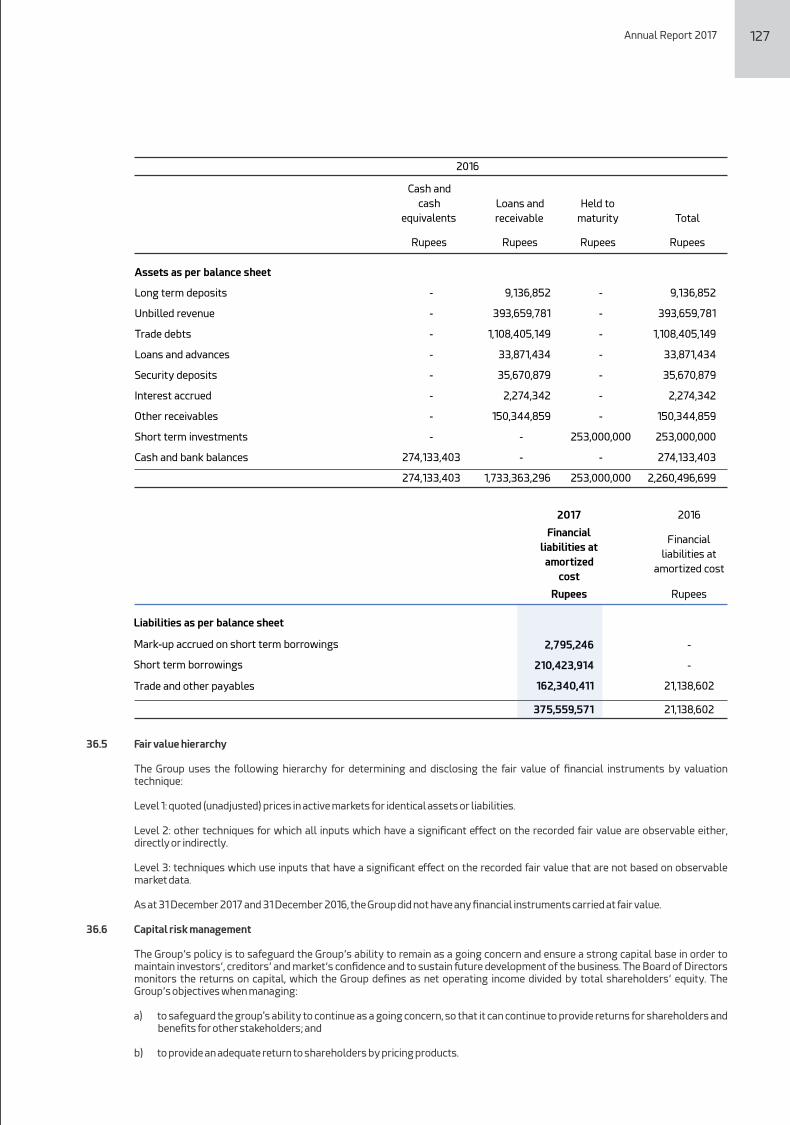
Cash and
cash
equivalents
Financial instruments by categories
Loans and
receivable
Held to
maturity
2017
Total
RupeesRupeesRupeesRupees
Systems Limited
36.3 Liquidity risk
Liquidity risk is the risk that the Group will not be able to meet its nancial obligations as they fall due. The Group's approach to managing liquidity is to ensure as far as possible to always have sufficient liquidity to meet its liabilities when due. The following are the contractual maturities of nancial liabilities:
The following are the contractual maturities of nancial liabilities as at 31 December 2017:
Carrying
amount
Less than one
year One to
ve years
More than ve
years
Trade and other payables 420,215,690
420,215,690
-
-
Short term borrowings 210,423,914
210,423,914
-
-
Mark-up accrued on short
term borrowings 2,795,246
2,795,246
-
-
633,434,850
633,434,850
-
-
RupeesRupeesRupees
Carrying
amount
Less than one
year One to
ve years
More than ve
years
RupeesRupeesRupees
The following are the contractual maturities of nancial liabilities as at 31 December 2016:
Trade and other payables 237,241,168
237,241,168
-
-
237,241,168
237,241,168
-
-
36.4 Fair values of nancial assets and liabilities
Fair value of available-for-sale nancial assets is derived from quoted market prices in active markets, if available.
The carrying values of other nancial assets and nancial liabilities reected in consolidated nancial statements approximate their fair values. Fair value is determined on the basis of objective evidence at each reporting date.
Assets as per balance sheet
Long term deposits - 20,342,739 - 20,342,739
Unbilled revenue - 491,012,735 - 491,012,735
Trade debts - 1,009,749,395 - 1,009,749,395
Loans and advances - 63,760,802 - 63,760,802
Security deposits - 93,482,668 - 93,482,668
Interest accrued - 374,882 - 374,882
Other receivables - 136,723,252 - 136,723,252
Short term investments - - 225,000,000 225,000,000
Cash and bank balances 697,875,255 - - 697,875,255
697,875,255 1,815,446,473 225,000,000 2,738,321,728
Rupees
Rupees
Annual Report 2017
2017 2016
Financial
liabilities at
amortized
cost
Financial
liabilities at
amortized cost
Liabilities as per balance sheet
Rupees Rupees
Mark-up accrued on short term borrowings 2,795,246 -
Short term borrowings 210,423,914 -
Trade and other payables 162,340,411 21,138,602
375,559,571 21,138,602
Long term deposits - 9,136,852 - 9,136,852
Unbilled revenue - 393,659,781 - 393,659,781
Trade debts - 1,108,405,149 - 1,108,405,149
Loans and advances - 33,871,434 - 33,871,434
Security deposits - 35,670,879 - 35,670,879
Interest accrued - 2,274,342 - 2,274,342
Other receivables - 150,344,859 - 150,344,859
Short term investments - - 253,000,000 253,000,000
Cash and bank balances 274,133,403 - - 274,133,403
274,133,403 1,733,363,296 253,000,000 2,260,496,699
Assets as per balance sheet
Cash and
cash
equivalents
Loans and
receivable
Held to
maturity
2016
Total
RupeesRupeesRupeesRupees
36.5 Fair value hierarchy
The Group uses the following hierarchy for determining and disclosing the fair value of nancial instruments by valuation technique:
Level 1: quoted (unadjusted) prices in active markets for identical assets or liabilities.
Level 2: other techniques for which all inputs which have a signicant effect on the recorded fair value are observable either, directly or indirectly.
Level 3: techniques which use inputs that have a signicant effect on the recorded fair value that are not based on observable market data.
As at 31 December 2017 and 31 December 2016, the Group did not have any nancial instruments carried at fair value.
36.6 Capital risk management
The Group’s policy is to safeguard the Group’s ability to remain as a going concern and ensure a strong capital base in order to maintain investors’, creditors’ and market’s condence and to sustain future development of the business. The Board of Directors monitors the returns on capital, which the Group denes as net operating income divided by total shareholders’ equity. The Group’s objectives when managing:
a) to safeguard the group's ability to continue as a going concern, so that it can continue to provide returns for shareholders and benets for other stakeholders; and
b) to provide an adequate return to shareholders by pricing products.
126 127
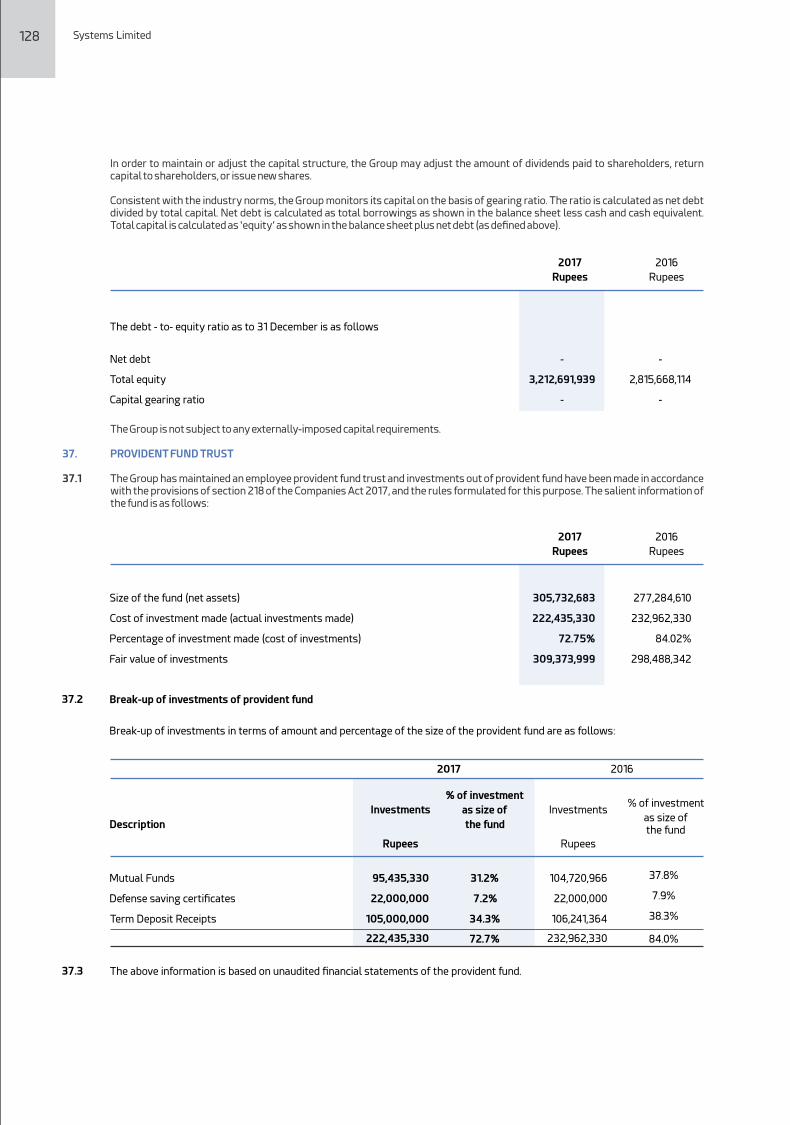
The debt - to- equity ratio as to 31 December is as follows
Net debt - -
Total equity 3,212,691,939 2,815,668,114
Capital gearing ratio - -
128 Systems Limited
In order to maintain or adjust the capital structure, the Group may adjust the amount of dividends paid to shareholders, return capital to shareholders, or issue new shares.
Consistent with the industry norms, the Group monitors its capital on the basis of gearing ratio. The ratio is calculated as net debt divided by total capital. Net debt is calculated as total borrowings as shown in the balance sheet less cash and cash equivalent. Total capital is calculated as ‘equity’ as shown in the balance sheet plus net debt (as dened above).
2017 2016
Rupees Rupees
The Group is not subject to any externally-imposed capital requirements.
37. PROVIDENT FUND TRUST
37.1 The Group has maintained an employee provident fund trust and investments out of provident fund have been made in accordance with the provisions of section 218 of the Companies Act 2017, and the rules formulated for this purpose. The salient information of the fund is as follows:
37.3 The above information is based on unaudited nancial statements of the provident fund.
Size of the fund (net assets) 305,732,683
277,284,610
Cost of investment made (actual investments made) 222,435,330
232,962,330
Percentage of investment made (cost of investments) 72.75% 84.02%
Fair value of investments 309,373,999
298,488,342
37.2 Break-up of investments of provident fund
Break-up of investments in terms of amount and percentage of the size of the provident fund are as follows:
Mutual Funds
Defense saving certicates
Term Deposit Receipts
2016
Description
Rupees
104,720,966
37.8%
22,000,000
7.9%
106,241,364
38.3%
232,962,330 84.0%
Investments % of investment
as size ofthe fund
2017
2017 2016
Rupees Rupees
Rupees
95,435,330
31.2%
22,000,000
7.2%
105,000,000
34.3%
222,435,330 72.7%
Investments as size of
the fund
% of investment
Annual Report 2017 129
38. NUMBER OF EMPLOYEES
2017 2016
Total number of employees at the end of the year were as follows:
Regular 1,247 1,165
Contractual 569 682
1,816 1,847
Average number of employees during the year were as follows:
Regular 1,190 1,163
Contractual 512 747
1,702 1,910
39. POST BALANCE SHEET EVENTS
The Board of Directors in their meeting held on 26 March 2018 have proposed a nal cash dividend for the year ended 31 December 2017 of Rs. 1.75 (2016: Rs. 1.86) per share, amounting to Rs. 195.698 million (2016: Rs. 207.99 million) for approval of the members at the Annual General Meeting to be held on 26 April 2018. These nancial statements for the year ended 31 December 2017 do not include the effect of these appropriations as it will be accounted for in the year in which it is approved.
40. DATE OF AUTHORIZATION FOR ISSUE
These nancial statements were authorised for issue on 26 March 2018 by the Board of Directors of the Company.
41. CORRESPONDING FIGURES
Corresponding gures have been re-arranged, wherever necessary, for better and fair presentation. However, no signicant re-arrangement/reclassications have been made in these nancial statements.
42. GENERAL
Figures have been rounded off to the nearest of rupees, unless otherwise stated.
CHIEF EXECUTIVE OFFICER CHIEF FINANCIAL OFFICERCHAIRMAN
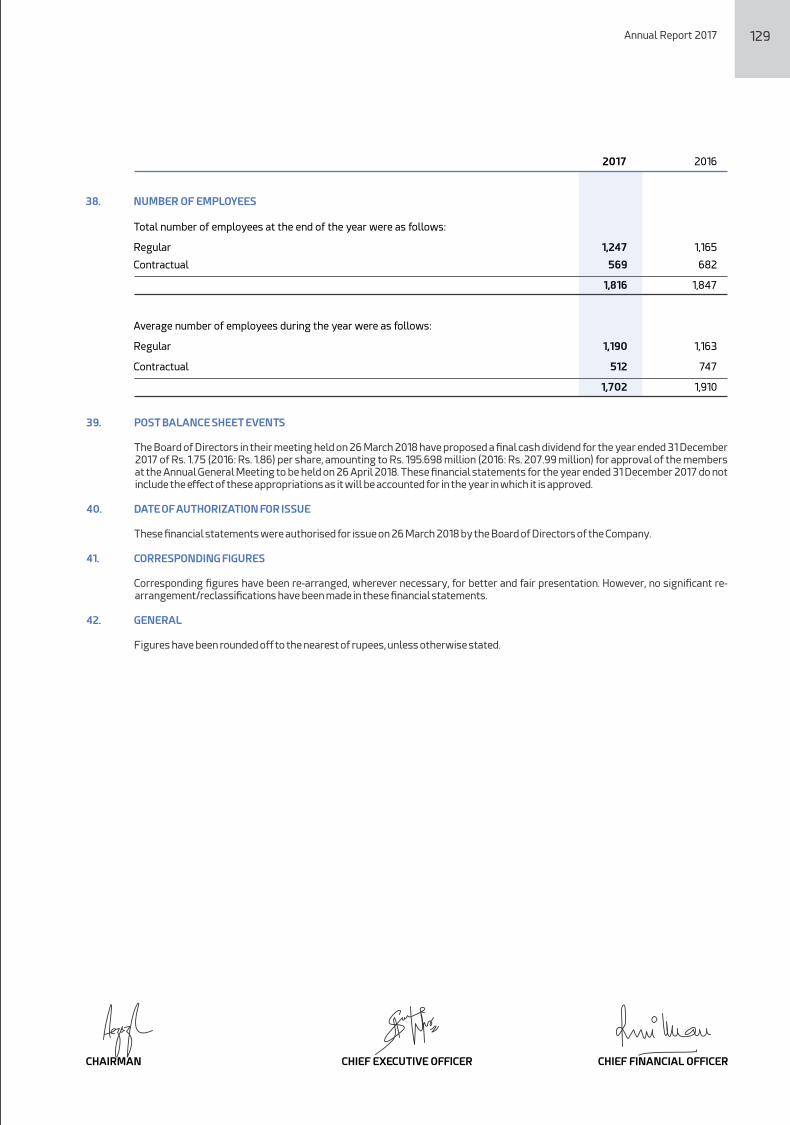

Form of Proxyst41 Annual General Meeting
Signature
Name
Address
CNIC
2.
I/We
son/daughter of
Mr./Ms.
son/daughter of
who is also member of the Company vide Registered Folio No.
a member of Systems Limited and holder of shares as
per Registered Folio No. do hereby appoint Mr./Ms.
son/daughter of or failing him/her
In witness whereof on this day of 2018.
WITNESSES:
Affix RevenueStamp
Member's Signature
NOTES:
Signature
Name
Address
CNIC
1.
1. A member entitled to attend and vote at this meeting may appoint another member as his/her proxy to
attend and vote his/her behalf. Proxies in order to be effective must be received at the Registered Office
of the Company not less than 48 hours before the meeting.
2. The instrument appointing a proxy should be signed by the member or by his attorney duly authorized
in writing. If a member is a corporation, its common seal should be affixed to the instrument.
as my/our Proxy to attend, speak and vote for me/us and on my/our behalf at the Annual General Meeting of the
Company to be held on 26 April 2018 at 10:00 a.m. at Chamber of Commerce Building, 11 Sharae Aiwan-e-Tijarat, Lahore
and at any adjournment thereof.
130 Systems Limited Annual Report 2017 131
This page has been left blank intentionally
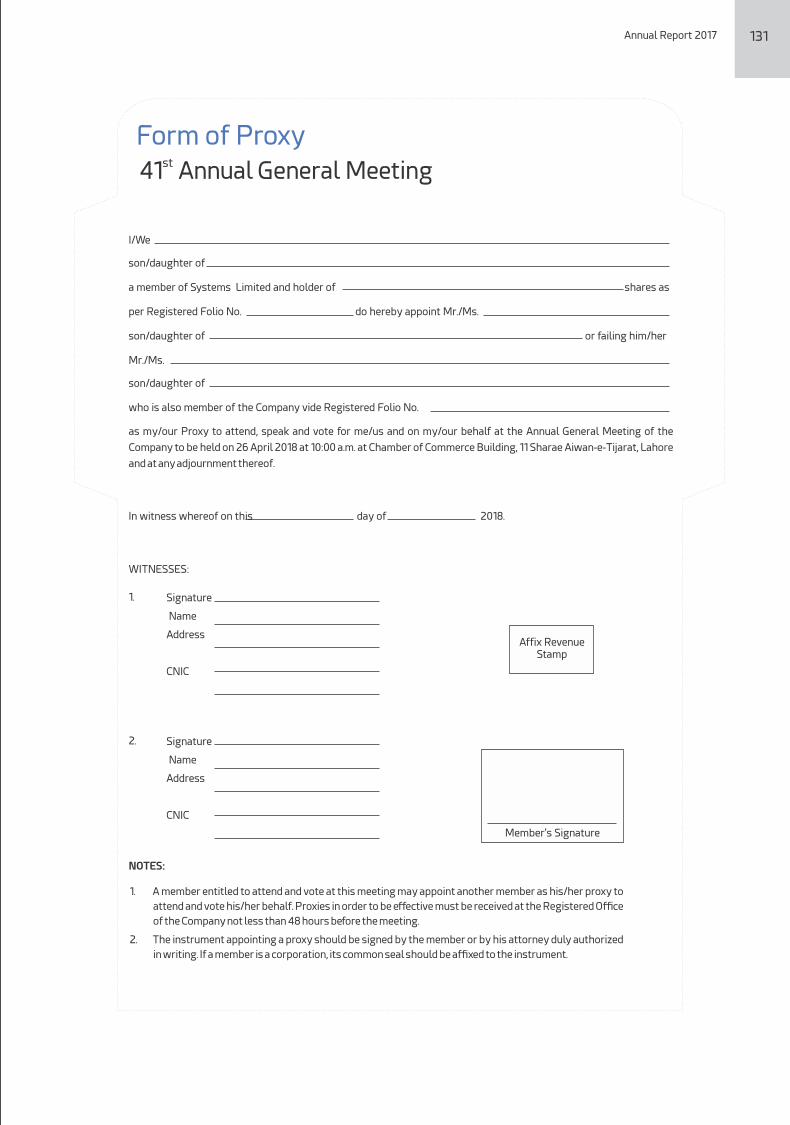
AFFIXCORRECT POSTAGE
The Company Secretary
Systems LimitedE-1, Sehjpal Near DHA Phase -VIII(Ex.- Air Avenue), Lahore Cantt.
132 Systems Limited Annual Report 2017 133
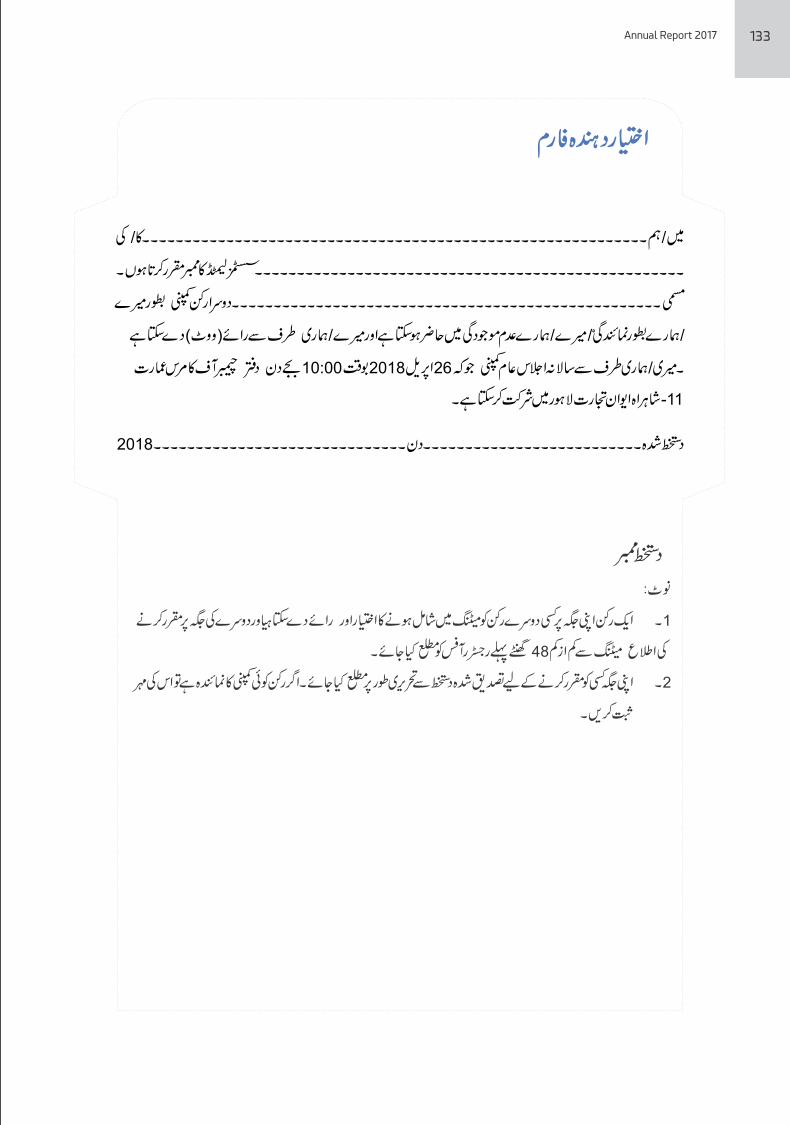
AFFIXCORRECT POSTAGE
The Company Secretary
Systems LimitedE-1, Sehjpal Near DHA Phase -VIII(Ex.- Air Avenue), Lahore Cantt.
132 Systems Limited Annual Report 2017 133

AFFIXCORRECT POSTAGE
The Company Secretary
Systems LimitedE-1, Sehjpal Near DHA Phase -VIII(Ex.- Air Avenue), Lahore Cantt.
134 Systems Limited
Karachi
E-5, Central Commercial Area, Shaheed-e-Millat Road, Karachi, Pakistan T: +92 21 3 454 9385-87 F: +92 21 3 454 9389
Registered & Head Office
Systems Campus
Software Technology Park
E-1, Sehjpal Near DHA Phase -VIII
(Ex.-Air Avenue), Lahore Cantt.
T: +92 42 111-797-836
F: +92 42 3 636 8857
Dubai
TechVista Systems FZ LLC
Office 1905, Regal Tower, Business
Bay, Dubai. UAE
T: + 97 14 369 3525
F: +97 14 456 3761