Embed Size (px)
Citation preview

0, 112, 192
146, 208, 80
112, 48, 160
255, 192, 0
102, 51, 0
192, 80, 77
1
330 Net CO2 emission
(kg per ton of cementitious material)*
*Achieved by Eastern Operations,
2015-16
We achieved the lowest carbon
footprint in the cement world
As the planet
grapples with
climate change…
DALMIA BHARAT LIMITED February , 2017

0, 112, 192
146, 208, 80
112, 48, 160
255, 192, 0
102, 51, 0
192, 80, 77
2
VISION
To be a Leader in Building
Materials that evokes Pride
in all stakeholders through
Customer Centricity,
Innovation, Sustainability
& our Values
Customized
products
Cement for oil
wells/ sleepers/
air strips
PPC/ PSC/ OPC
and SRPC
varieties
To unleash the
potential of
everyone we
touch
Integrity
Humility
Commitment
Trust &
Respect
Member of Cement
Sustainability Initiative
Signatory to United Nations
Global Compact
‘Green Pro Certification’
Setting global
performance standards
Building brand equity
Fourth Largest cement
group in India
Focused growth in
capacity creation
Amongst the most
profitable
cement
companies
0, 112, 192
146, 208, 80
112, 48, 160
255, 192, 0
102, 51, 0
192, 80, 77
3
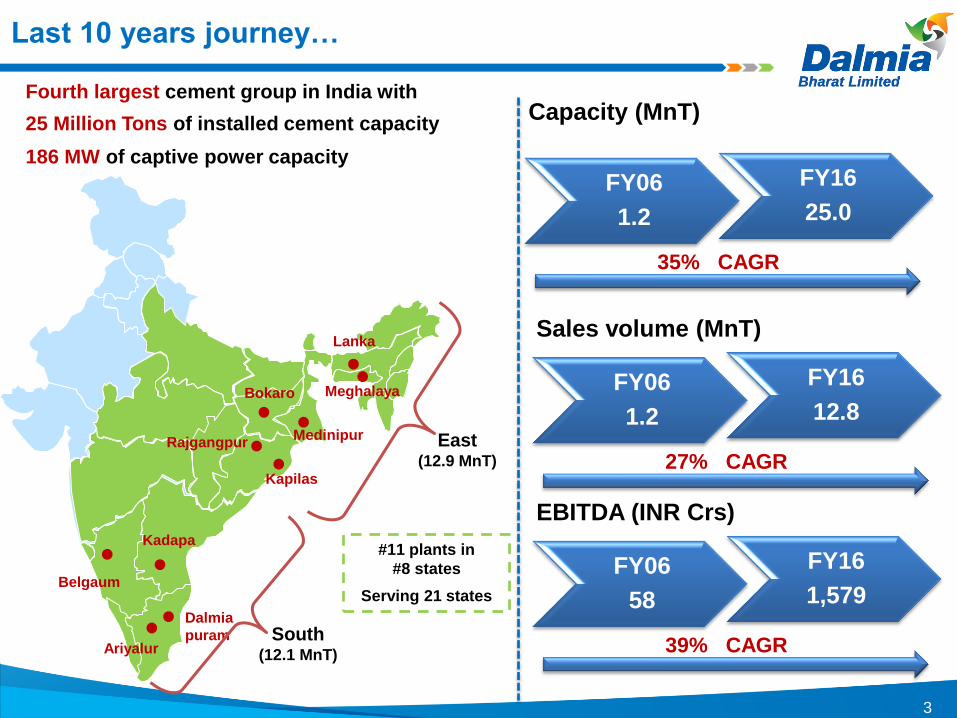
Fourth largest cement group in India with
25 Million Tons of installed cement capacity
186 MW of captive power capacity
#11 plants in
#8 states
Serving 21 states
Kapilas
Rajgangpur
Meghalaya
Lanka
Bokaro
Medinipur
Belgaum
Dalmia
puram Ariyalur
Kadapa
South (12.1 MnT)
East (12.9 MnT)
FY06
1.2
FY16
25.0
Capacity (MnT)
35% CAGR
FY06
1.2
FY16
12.8
Sales volume (MnT)
27% CAGR
FY06
58
FY16
1,579
EBITDA (INR Crs)
39% CAGR
Last 10 years journey…
0, 112, 192
146, 208, 80
112, 48, 160
255, 192, 0
102, 51, 0
192, 80, 77
4
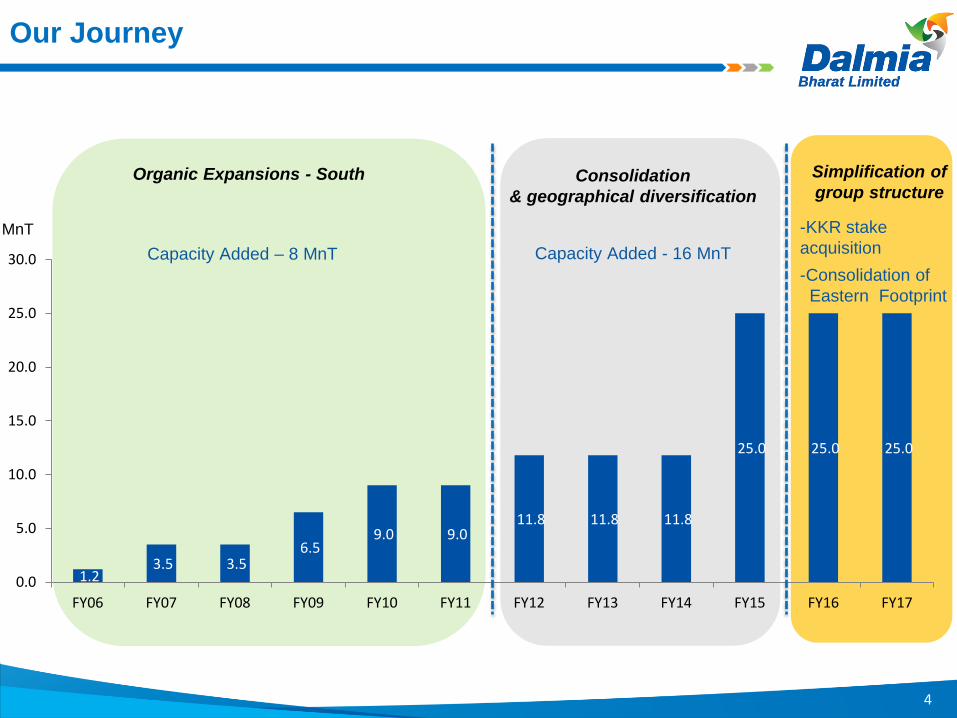
Our Journey
1.2 3.5 3.5
6.5 9.0 9.0
11.8 11.8 11.8
25.0 25.0 25.0
0.0
5.0
10.0
15.0
20.0
25.0
30.0
FY06 FY07 FY08 FY09 FY10 FY11 FY12 FY13 FY14 FY15 FY16 FY17
MnT
Organic Expansions - South Consolidation
& geographical diversification
Simplification of
group structure
Capacity Added – 8 MnT Capacity Added - 16 MnT
-KKR stake
acquisition
-Consolidation of
Eastern Footprint
0, 112, 192
146, 208, 80
112, 48, 160
255, 192, 0
102, 51, 0
192, 80, 77
5
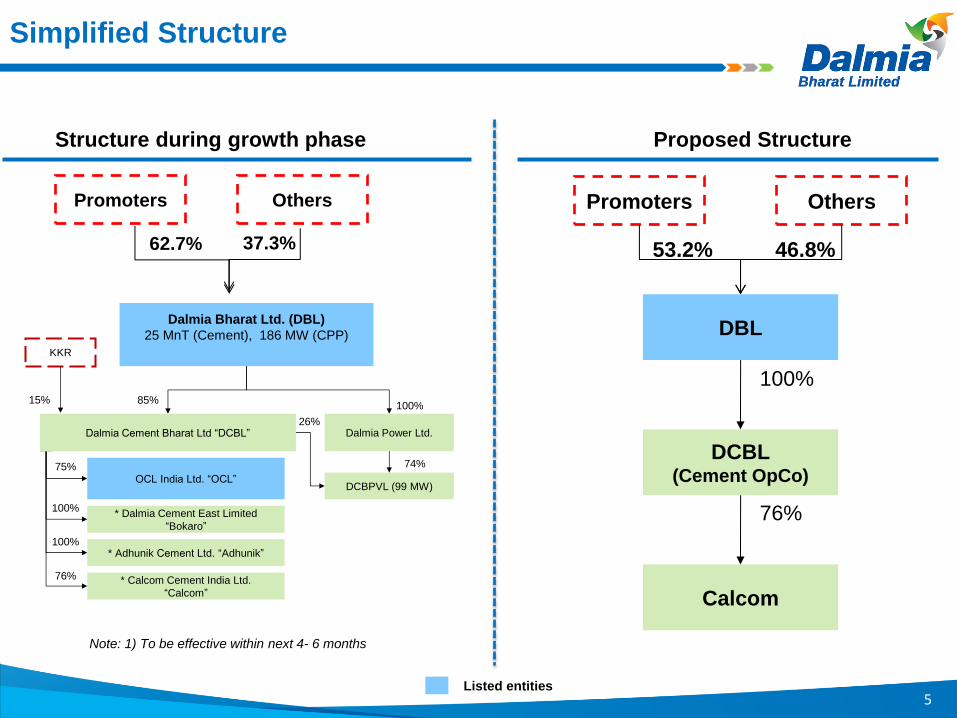
Simplified Structure
Structure during growth phase Proposed Structure
Listed entities
Promoters Others
62.7% 37.3%
DBL
DCBL (Cement OpCo)
Calcom
76%
100%
Promoters Others
53.2% 46.8%
Note: 1) To be effective within next 4- 6 months
Dalmia Bharat Ltd. (DBL)
25 MnT (Cement), 186 MW (CPP)
100%
OCL India Ltd. “OCL”
KKR
85% 15%
75%
* Calcom Cement India Ltd.
“Calcom”
* Adhunik Cement Ltd. “Adhunik”
76%
100%
Dalmia Power Ltd.
DCBPVL (99 MW)
74%
26%
* Dalmia Cement East Limited
“Bokaro”
100%
Dalmia Cement Bharat Ltd “DCBL”

0, 112, 192
146, 208, 80
112, 48, 160
255, 192, 0
102, 51, 0
192, 80, 77
6
Diversification Market
leadership
Disciplined Capital
Allocation
Differentiated Approach
Strategy

0, 112, 192
146, 208, 80
112, 48, 160
255, 192, 0
102, 51, 0
192, 80, 77
7
Diversified Locational Advantages
We are located where it matters!
• Well balanced capacity in Eastern
(52%) and Southern India (48%).
• Servicing markets from least cost
source
Proximity to Core Markets
Lead Distance – 300 kms
Plant sites
Raw material sources
Kapilas Road
Kadapa
Ariyalur Dalmiapuram
Rajgangpur
Bokaro
BCW
Belgaum
Meghalaya
Lanka
Proximity to Serving Markets & Raw
material Sources
Serving Markets

8
Market Leadership
East Capacity (MnT)
South Capacity (MnT)
% Represents our Market share
Represents our serving Markets
South
8%
Scaled from top 5 to top4
East
15%
Ranks 3rd
• Leading player in all the regions
• Leadership position in PSC and Oil well cement
14.8
12.9
11.4
7.8
6.7
Holcim Dalmia Ultratech Nirma Shree
20.5
15.5 14.2
13.0 12.1
Ultratech Ramco Chettinad India Cement Dalmia
North East
21%
Ranks 2nd

0, 112, 192
146, 208, 80
112, 48, 160
255, 192, 0
102, 51, 0
192, 80, 77
Disciplined Capital allocation
2012
2015
2012
2014
Organic Inorganic
2015
Kadapa/ Ariyalur (South)
USD 85 / T
Calcom (North East)
USD 138 / T
OCL (East)
USD 74/ T
Adhunik (North East)
USD 106/ T
Jaypee Bokaro (East)
USD 89/ T
Belgaum (South)
USD 100 / T
2008
Dec 2015
2015
2014
2013
2012
9
Balanced growth through Organic & Inorganic Expansion
140
91
Industry Dalmia
Replacement Cost (USD/ T)
Efficient Deployment of Capital
Average
Acquisition
Cost
~ USD 91/ T

0, 112, 192
146, 208, 80
112, 48, 160
255, 192, 0
102, 51, 0
192, 80, 77
10
Differentiated Approach
Endeavour to grow higher than industry Volume
Premium brand + Low Cost = Sustainable business model
To optimize costs with process flexibility

0, 112, 192
146, 208, 80
112, 48, 160
255, 192, 0
102, 51, 0
192, 80, 77
11
Dalmia volume vs our serving markets growth (YoY)
Source : http://eaindustry.nic.in/home.asp#
20%
23%
10%
21% 22%20% 20%
Q1FY16 Q2FY16 Q3FY16 Q4FY16 Q1FY17 Q2FY17 Q3FY17
Dalmia's Growth
1%
2%
5%
11% 6%3% (1%)
Industry Growth
20%
23%
10%
21% 22%20% 20%
Q1FY16 Q2FY16 Q3FY16 Q4FY16 Q1FY17 Q2FY17 Q3FY17
Dalmia's Growth
5%
6%
4%
10% 4%- 4%
Our Region Growth
Dalmia volume growth vs All India (YoY)
Growing consistently higher than Industry

0, 112, 192
146, 208, 80
112, 48, 160
255, 192, 0
102, 51, 0
192, 80, 77
353
421
Q3FY16 Q3FY17
EBITDA (Crs) EBITDA (Rs/T)
1,0811,350
9MFY16 9MFY17
EBITDA (Crs) EBITDA (Rs/T)
1,562
1,351 1,247
FY15 FY16 9M FY17
Variable Cost (Rs./T)
Sustainable Business Model
12
Unparalleled
gain in strength
Smooth &
uniform finish
Improved Construction
efficiency
Carefree Durability
Unique packaging – water-resistant & tamper-proof
Premium Brand Cost Efficiency
Improved
Profitability
Quarterly EBITDA 9M EBITDA
1203
1202
1225
1264

0, 112, 192
146, 208, 80
112, 48, 160
255, 192, 0
102, 51, 0
192, 80, 77
Containing cost
13
1,421
1,230 1,261
Q3FY16 Q2FY17 Q3FY17
Variable Cost (Rs./T)
Proactively augmented the fuel mix
Fuel mix optimized due to flexibility of usage of multiple fuel types
79%
13%7%
74%
15%11%
64%
10% 11%15%
Pet Coke- Imported Fluid / DomesticPetCoke
Domestic Coal AFR & Others
Q3FY16 Q2FY17 Q3FY17

0, 112, 192
146, 208, 80
112, 48, 160
255, 192, 0
102, 51, 0
192, 80, 77
14
295
430
Dalmia Peer Average
Lead Distance (KM)
70
78
Dalmia Peer Average
Power Consumption (Kwh/T of Cement)
Competitive Advantage
60
77
Dalmia Peer Average
Pet Coke ($/T)- Q3FY17

0, 112, 192
146, 208, 80
112, 48, 160
255, 192, 0
102, 51, 0
192, 80, 77
Pet Coke: Market Price Vs. Our Consumption Rate
15
43 50
63 68
77 80 85 88 85
38 37 40 41 47 50
55 63 63
Apr'16 May'16 June'16 July'16 Aug'16 Sept'16 Oct'16 Nov'16 Dec'16
Market Price ($) Dalmia ($)

0, 112, 192
146, 208, 80
112, 48, 160
255, 192, 0
102, 51, 0
192, 80, 77
Sustainability initiatives
16

0, 112, 192
146, 208, 80
112, 48, 160
255, 192, 0
102, 51, 0
192, 80, 77
17
Global campaign to
encourage energy
productivity.
The first cement
company in the globe to
join the initiative.
World’s largest corporate
sustainability initiative.
Participation at the Paris
Climate Agreement
Signing Ceremony.
Global effort by 25 major
cement producers for
sustainable development.
Lowest carbon footprints
amongst CSI member
companies.
Launched at COP-21 in
Paris with a goal to
expand the effective
carbon pricing policies.
Only Indian cement
company to join this
initiative.
Caring for climate initiative
Launched by UN
Secretary General Ban Ki-
moon in 2007 & jointly
convened by UNGC,
UNFCCC & UNEP.
One of the two Global
cement companies
associated.
Our Global Platform Associations/ Memberships…
Associations Description Achievements Other Key Members
UNFCC – United Nations Framework Convention on Climate Change, UNEP – United Nations Environment Programme
UNGC – United Nations Global Compact

Target is to achieve
‘Water Neutrality’
by 2018
18

0, 112, 192
146, 208, 80
112, 48, 160
255, 192, 0
102, 51, 0
192, 80, 77
Sustained Profitability
19

0, 112, 192
146, 208, 80
112, 48, 160
255, 192, 0
102, 51, 0
192, 80, 77
Financials for the nine months ended 31st Dec, 2016
(Rs. in Cr.)
20
Particulars (Rs. Cr.) 9M FY16 9M FY17 YoY
Total Income from Operations 5,153 5,915 15%
Operating Expenses 4,072 4,565 12%
EBITDA 1,081 1,350 25%
Other Income 166 227 37%
Depreciation 414 452 9%
EBIT 833 1,126 35%
Finance Cost 523 690 32%
Profit Before Tax 310 436 41%
Provision for Tax 177 220 24%
Profit After Tax 95 161 69%
Sales Volume (MnT) 8.91 10.75 21%
EBITDA (Rs./ T) 1,225 1,264 3%
EBITDA Margin (%) 23.9% 25.9% 196bps

0, 112, 192
146, 208, 80
112, 48, 160
255, 192, 0
102, 51, 0
192, 80, 77
Financials for the quarter ended 31st Dec, 2016
21
Particulars (Rs. Cr.) Q3FY16 Q3FY17 YoY
Total Income from Operations 1,698 1,967 16%
Operating Expenses 1,345 1,546 15%
EBITDA 353 421 19%
Other Income 45 71 60%
Depreciation 142 159 13%
EBIT 256 333 30%
Finance Cost 173 220 27%
Profit Before Tax 83 113 36%
Provision for Tax 39 62 62%
Profit After Tax 30 36 19%
Sales Volume (MnT) 2.96 3.56 20%
EBITDA (Rs./ T) 1,203 1,202 0%
EBITDA Margin (%) 23.6% 24.2% 56bps

0, 112, 192
146, 208, 80
112, 48, 160
255, 192, 0
102, 51, 0
192, 80, 77
Continued focus on deleveraging
22
ParticularsAs on March
31, 2016
As on Dec
31, 2016Change
Gross Debt (Rs. Cr.) 8,825 8,235 (590)
Cash (Rs. Cr.) 2,803 2,530 (273)
Net Debt (Rs. Cr.) 6,022 5,705 (317)
*Net Debt/ EBITDA (x) 3.81 3.17
Average Cost of Debt (%) 9.0% 8.7%

0, 112, 192
146, 208, 80
112, 48, 160
255, 192, 0
102, 51, 0
192, 80, 77
23
Further initiatives…
Increased share of super premium cement
Logistics Cost Reduction
Power savings
Process Digitization

0, 112, 192
146, 208, 80
112, 48, 160
255, 192, 0
102, 51, 0
192, 80, 77
Customer App Online ordering
& status update (First in Indian Cement Industry)
Sales force App Dealer performance
management (First in Indian Cement Industry)
Inventory Management Effective management
of Godown stock through
centralized system
Logistics App Vehicle planning
& management
BI Tools Usage of BI tools for effective
decision making
People Management HRIS for HR related
information & analysis
Digital Dalmia…
24

0, 112, 192
146, 208, 80
112, 48, 160
255, 192, 0
102, 51, 0
192, 80, 77
25
Future outlook – what to expect from Dalmia…
Sweat Assets Short Term
Reduce Debt
Short Term
Growth Leadership
In Capacity & Profitability

0, 112, 192
146, 208, 80
112, 48, 160
255, 192, 0
102, 51, 0
192, 80, 77
Macro Economic
Indicators
26
0, 112, 192
146, 208, 80
112, 48, 160
255, 192, 0
102, 51, 0
192, 80, 77
Cultural Transformation in Government
27
Governance Standard of India Reset
Increased Transparency
Bold & Decisive
Hard Working
Embracing Technology

0, 112, 192
146, 208, 80
112, 48, 160
255, 192, 0
102, 51, 0
192, 80, 77
Big Bang Decisions
28
Direct Transfer of LPG Subsidy
Jan DhanYojana
GST
Demonetization
~USD 7 billion (Rs. 50,000 Cr.)
250 million Bank accounts
2% GDP Growth
National Security
Inflation
Policy Decisions Impact
International Image of India Transformed

0, 112, 192
146, 208, 80
112, 48, 160
255, 192, 0
102, 51, 0
192, 80, 77
29
Fiscal Stability
CPI Inflation (%) Trade Deficit (US$ billion)
Current A/c Deficit (US$ billion)
-0.7
-6.1-8.2
-7.1
-0.3 -0.3
Q4FY15 Q1FY16 Q2FY16 Q3FY16 Q4FY16 Q1FY17
Foreign Exchange Reserves (US$ billion)
9.1
10.5
7.6
5.6 5.3 4.4
4.8 4.4
3.6
Apr-13 Sep-13 Mar-14 Sep-14 Mar-15 Sep-15 Mar-16 Sep-16 Nov-16
294
277
304 314
342 350
360 359
Apr-13 Sep-13 Mar-14 Sep-14 Mar-15 Sep-15 Mar-16 Sep-16 Dec-16
(17)
(6)
(11)
(14)
(11)
(10)
(4)
(8)
(10)
Apr-13 Sep-13 Mar-14 Sep-14 Mar-15 Sep-15 Mar-16 Sep-16 Dec-16

0, 112, 192
146, 208, 80
112, 48, 160
255, 192, 0
102, 51, 0
192, 80, 77
Other Large &
Mid-Cap
Players,37%
Small Players,
13%
LafargeHolcim, 13%
Ultratech,23%
Ramco, 4%
Dalmia, 6%
Shree, 6%
Top 5 players,50%
Indian Cement Industry Overview
Second largest cement market in the world
Low per capita consumption of ~ 200 kgs as compared to world average of ~ 400 kgs
Significant consolidation led to 50% capacity under control of top 5 players
Regional play due to high freight costs
Primarily retail sales driven (65%)
Location and branding plays a critical role
FY2016 : All India Capacity Distribution FY2010 : All India Capacity Distribution
Small Players 46%
Other Large & Mid-Cap Players
9%
Dalmia 3%
ACC 10%
Ultratech 10%
Grasim 9%
Ambuja 8%
India Cements 5%
Top 5 Players
42%
30

0, 112, 192
146, 208, 80
112, 48, 160
255, 192, 0
102, 51, 0
192, 80, 77
31
Building greenfield plant will take ~5-7 years...
Capacity additions
140 MnT
65 MnT
32 MnT
FY08-10
FY14-16
FY17-19E
Shock
Drought
Land
acquisition
issues
MMDRA &
EC/ FC Increased time lag
Supply drought driven by credit squeeze
& massive change in regulatory environment

0, 112, 192
146, 208, 80
112, 48, 160
255, 192, 0
102, 51, 0
192, 80, 77
32
Demand drivers
…however there could be moderate demand
growth in the next few quarters
Strong demand expected in 12-24 months
Infrastructure
build out
by Govt.
Rural
Demand
Low cost
Housing

0, 112, 192
146, 208, 80
112, 48, 160
255, 192, 0
102, 51, 0
192, 80, 77
33
Current Dynamics
Acquisition
Green Field
2016
$130/T (Lafarge & Nirma)
$100/T (Belgaum, Dalmia)
2006
$79/T (Ultratech and L&T)
$62/T (Dalmiapuram,
Dalmia)
EBITDA/T
required ~Rs.650/T*
~Rs.1,800/T**
*(Capex -$70/t, CU-80%
ROCE 10%)
**(Capex $ 135/T, CU-80%;
ROCE 10%)

0, 112, 192
146, 208, 80
112, 48, 160
255, 192, 0
102, 51, 0
192, 80, 77
34
Last 10 Years Strong Volume growth 7.3%
Strong Pricing growth 6.4%
India is one of the few markets in the World
with both volume and pricing growth…

0, 112, 192
146, 208, 80
112, 48, 160
255, 192, 0
102, 51, 0
192, 80, 77
35
India offers good returns
in long term…

0, 112, 192
146, 208, 80
112, 48, 160
255, 192, 0
102, 51, 0
192, 80, 77
36
Cement showing better returns…
Note: Sector return is calculated based on stock price return over last 5 and 7 years
Average sector stock returns
41%
7%8%
35%
3% 2%
Cement Energy Capital Goods
5 Year 7 Year

0, 112, 192
146, 208, 80
112, 48, 160
255, 192, 0
102, 51, 0
192, 80, 77
Summarizing
Incremental Demand of 22 MnT by 2022
India: The Place to invest
Cement: The Sector
Dalmia: The Company
37

0, 112, 192
146, 208, 80
112, 48, 160
255, 192, 0
102, 51, 0
192, 80, 77
thankyou