Embed Size (px)
Citation preview
Workshop Proceedings
WAVE SENSOR TECHNOLOGIES
St. Petersburg, FloridaMarch 7-9, 2007
Funded by NOAA’s Coastal Services Center throughthe Alliance for Coastal Technologies (ACT)
Ref. No. [UMCES]CBL 07-105
Alliance for Coastal Technologies Indexing No. ACT-07-03

An ACT Workshop Report
Wave Sensor Technology
St. Petersburg, FloridaMarch 7-9, 2007
Sponsored by the Alliance for Coastal Technologies (ACT) and NOAA’s Center for Coastal Ocean Research in the National Ocean Service.
Hosted by ACT Partner, University of South Florida.
ACT is committed to develop an active partnership of technology developers, deliverers, and users within regional, state, and federal environmental management communities to establish a testbed for demonstrating, evaluating, and verifying innovative technologies in monitoring sensors, platforms, and software for use in coastal habitats.


Wave Sensor Technology .................................................................................................................. i
Table of ConTenTs
EXECUTIVE SUMMARY ..............................................................................................................1
Alliance for Coastal Technologies ...................................................................................................2
Workshop Goals ...............................................................................................................................3
Organization of the Workshop .........................................................................................................3
Plenary Presentation: Observations Of Directional Waves ..............................................................4
Current State of Wave Measurement Technologies .........................................................................4
Workshop Recommendations ..........................................................................................................9
References ......................................................................................................................................11
Acknowledgements ........................................................................................................................11
Appendix A: List of Attendees .......................................................................................................12
Appendix B: An Introduction to Directional Wave Observations .................................................14

Wave Sensor Technology ..................................................................................................................1
The Alliance for Coastal Technologies (ACT) convened a workshop on “Wave Sensor Technolo-gies” in St. Petersburg, Florida on March 7-9, 2007, hosted by the University of South Florida (USF) College of Marine Science, an ACT partner institution. The primary objectives of this workshop were to: 1) define the present state of wave measurement technologies, 2) identify the major impediments to their advancement, and 3) make strategic recommendations for future de-velopment and on the necessary steps to integrate wave measurement sensors into operational coastal ocean observing systems. The participants were from various sectors, including research scientists, technology developers and industry providers, and technology users, such as operational coastal managers and coastal decision makers.
Waves consistently are ranked as a critical variable for numerous coastal issues, from maritime transportation to beach erosion to habitat restoration. For the purposes of this workshop, the par-ticipants focused on measuring “wind waves” (i.e., waves on the water surface, generated by the wind, restored by gravity and existing between approximately 3 and 30-second periods), although it was recognized that a wide range of both forced and free waves exist on and in the oceans. Also, whereas the workshop put emphasis on the nearshore coastal component of wave measurements, the participants also stressed the importance of open ocean surface waves measurement. Wave sensor technologies that are presently available for both environments include bottom-mounted pressure gauges, surface following buoys, wave staffs, acoustic Doppler current profilers, and shore-based remote sensing radar instruments.
One of the recurring themes of workshop discussions was the dichotomous nature of wave data users. The two separate groups, open ocean wave data users and the nearshore/coastal wave data users, have different requirements. Generally, the user requirements increase both in spatial/temporal resolution and precision as one moves closer to shore. Most ocean going mariners are adequately satisfied with measurements of wave period and height and a wave general direction. However, most coastal and nearshore users require at least the first five Fourier parameters (“First 5”): wave energy and the first four directional Fourier coefficients. Furthermore, wave research scientists would like sensors capable of providing measurements beyond the first four Fourier coefficients. It was debated whether or not high precision wave observations in one location can take the place of a less precise measurement at a different location. This could be accomplished by advancing wave models and using wave models to extend data to nearby areas. However, the consensus was that models are no substitution for in situ wave data.
exeCuTive summary
Wave Sensor Technology ..................................................................................................................2
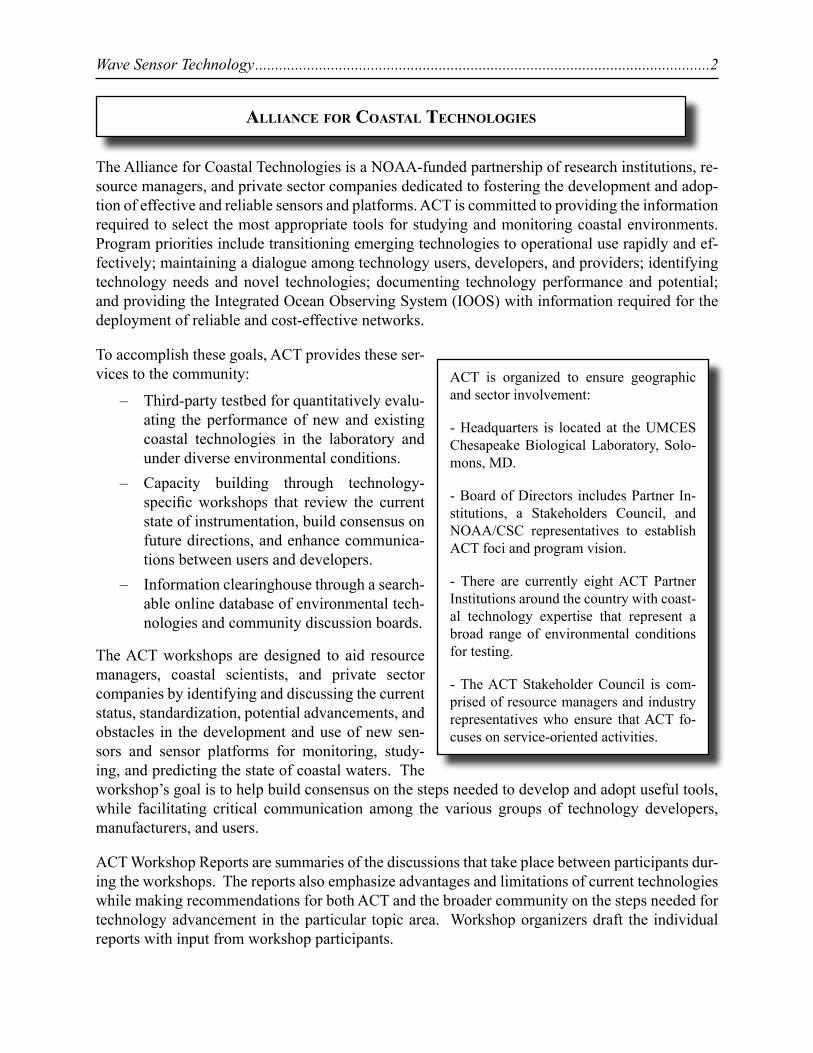
ACT is organized to ensure geographic and sector involvement:
- Headquarters is located at the UMCES Chesapeake Biological Laboratory, Solo-mons, MD.
- Board of Directors includes Partner In-stitutions, a Stakeholders Council, and NOAA/CSC representatives to establish ACT foci and program vision.
- There are currently eight ACT Partner Institutions around the country with coast-al technology expertise that represent a broad range of environmental conditions for testing.
- The ACT Stakeholder Council is com-prised of resource managers and industry representatives who ensure that ACT fo-cuses on service-oriented activities.
allianCe for CoasTal TeChnologies
The Alliance for Coastal Technologies is a NOAA-funded partnership of research institutions, re-source managers, and private sector companies dedicated to fostering the development and adop-tion of effective and reliable sensors and platforms. ACT is committed to providing the information required to select the most appropriate tools for studying and monitoring coastal environments. Program priorities include transitioning emerging technologies to operational use rapidly and ef-fectively; maintaining a dialogue among technology users, developers, and providers; identifying technology needs and novel technologies; documenting technology performance and potential; and providing the Integrated Ocean Observing System (IOOS) with information required for the deployment of reliable and cost-effective networks.
To accomplish these goals, ACT provides these ser-vices to the community:
Third-party testbed for quantitatively evalu- –ating the performance of new and existing coastal technologies in the laboratory and under diverse environmental conditions.Capacity building through technology- –specific workshops that review the current state of instrumentation, build consensus on future directions, and enhance communica-tions between users and developers.Information clearinghouse through a search- –able online database of environmental tech-nologies and community discussion boards.
The ACT workshops are designed to aid resource managers, coastal scientists, and private sector companies by identifying and discussing the current status, standardization, potential advancements, and obstacles in the development and use of new sen-sors and sensor platforms for monitoring, study-ing, and predicting the state of coastal waters. The workshop’s goal is to help build consensus on the steps needed to develop and adopt useful tools, while facilitating critical communication among the various groups of technology developers, manufacturers, and users.
ACT Workshop Reports are summaries of the discussions that take place between participants dur-ing the workshops. The reports also emphasize advantages and limitations of current technologies while making recommendations for both ACT and the broader community on the steps needed for technology advancement in the particular topic area. Workshop organizers draft the individual reports with input from workshop participants.
Wave Sensor Technology ..................................................................................................................3
ACT is committed to exploring the application of new technologies for monitoring coastal eco-system and studying environmental stressors that are increasingly prevalent worldwide. For more information, please visit www.act-us.info.
Workshop goals
The overarching goals of the ACT workshop on Wave Sensor Technologies were to examine pres-ent wave sensing technologies, to explore future requirements for wave measurement systems in coastal and open ocean environments, and to make strategic recommendations for the future de-velopment and integration of these technologies into operational coastal ocean observing systems. Specifically, the participants were charged to address the following questions:
What sensor technologies are presently available for wave measurements, and what are their strengths and weaknesses regarding application to coastal ocean observing systems?
Who are the end users of the data, and what are their specific parameters (e.g., wave height, period, directional spread) and applications of interest? What are their requirements regarding resolu-tion for wave height (i.e., mm, cm), period, direction (degrees of heading), period, time sampling (hourly, 3 hourly, daily), etc? What wave parameters are measured successfully with present technologies?
What are the limitations of present wave measurement technologies? What parameters are not be-ing measured or are not being measured at the needed resolution?
How can the limitations of present wave measurement technologies be addressed or overcome?
How best to incorporate wave measurement technologies into coastal ocean observing systems?
organizaTion of The Workshop
The workshop was sponsored by NOAA’s Alliance for Coastal Technologies and hosted by the University of South Florida (USF) College of Marine Science, an ACT partner institution, on March 7-9, 2007 in St. Petersburg, FL. An advisory committee comprised of leading experts from a cross section of the wave measurement committee assisted USF in planning the workshop. There were 32 invited participants (Appendix A) selected to represent the four sectors of the com-munity: academic researchers, wave sensor operators (those who collect operational waves data), coastal decision makers (those who utilize wave information), and wave sensor vendors (those who manufacture and supply the technologies).
The workshop was opened with an evening dinner reception during which the participants were introduced and given an overall background presentation on ACT by Dr. Mario Tamburri, ACT Executive Director, and an overview of the workshop goals by Dr. Mark Luther, USF. The work-shop discussions commenced with a keynote address summarizing the basic concepts of wave theory and measurement by Dr. Bill O’Reilly, Scripps Institution of Oceanography. The morning
Wave Sensor Technology ..................................................................................................................4
breakout session split the participants into three working groups by sector: industry (instrument manufacturers and providers), research (academic scientists), and technology and data end users (coastal managers). The primary objective of this session was to facilitate focused discussions on the common issues in each sector regarding the workshop questions. After lunch, the groups reconvened in plenary, and a chair from each group provided a summary of the group’s findings. Participants were divided again into three groups for the afternoon session, with members of each sector evenly distributed among the groups. Each group was charged to revisit the same workshop questions and also to address questions and findings that surfaced in the first breakout session. The final morning of the workshop was devoted to a plenary session where the main conclusions from the previous discussions were reviewed and clarified, and a list of recommendations and action items to promote advancement of wave measurement technologies was developed for this report.
plenary presenTaTion: observaTions of DireCTional Waves
A keynote presentation was delivered by Dr. Bill O’Reilly entitled, An Introduction to Directional Wave Observations, during which he discussed the challenges of accurately measuring directional waves and the degree of accuracy required by the two principal user groups of real-time wave data: those interested mostly in a few parameters of the wave field that describe the dominant waves and those interested in the underlying component waves or wave events. The “dominant wave” users typically look at the significant wave height, Hs, peak wave period (also called dominant wave period), Tp, and the mean wave direction at the peak wave period, Dm @ Tp. There are likely few, if any, directional wave instruments currently in use that cannot adequately satisfy this user base. The “component wave” users are more interested in observing the individual wave events in a region. Instrument accuracy is crucial to component wave users, and the selection of directional wave instrumentation requires a more careful evaluation of its performance. The presentation concluded by proposing to the attendees that the “common ground” of all in-situ wave measure-ment methods is the measurement and computation of the first five Fourier parameters (“First 5”) at each wave frequency:
1) Wave energy, S(f), and
2)-5 The Fourier directional coefficients a1(f), b1(f), a2(f), b2(f).
and that the “First 5” parameters offer the best way to compare different wave instruments and measurement technologies.
The presentation may be viewed via a link from the Coastal Data Information Program website at http://cdip.ucsd.edu/?nav=documents&sub=faq&xitem=publications. A complete set of Dr. O’Reilly’s notes are included in Appendix B.
CurrenT sTaTe of Wave measuremenT TeChnologies
The following is a general description of the workshop participants’ discussions in the breakout sessions in response to the workshop questions.
Wave Sensor Technology ..................................................................................................................5
Summary of Existing Technologies
Presently, wave measurement systems can be classified into two large categories: in situ instrumen-tation and remote sensing methods. In situ sensors include submerged pressure sensors, buoys, acoustic sensors (with and without pressure) for measuring wave orbital velocities, non-acoustic sensors for measuring wave orbital velocities, wave staffs, and subsurface arrays of pressure sen-sors. Remote sensing technologies include marine radar (non-coherent and coherent), high fre-quency radar, lidar, satellites, optical sensors, and altimeters. A brief description of each technol-ogy class follows:
Submerged Pressure Sensor - Pressure sensors are mounted at fixed positions underwater. These instruments measure pressure fluctuations associated with the changing height of the water column above the sensor indicating passing waves. These pressure time series can be converted to sea sur-face elevations and wave frequency spectra.
Buoy –Buoys measure motions of the water surface, such as accelerations or slopes of the water surface. Wave heights and periods are obtained from the vertical motions, and wave directions may be obtained from the orbital motions or wave slopes. Buoys are useful for measuring waves far offshore or at remote locations because they do not require a fixed platform, such as a pier or other structure. Data are transmitted via satellite or radio link. Buoys that measure x, y, z are called “translational, or “particle following,” buoys,” and buoys that measure z and sea surface slopes dz/dy, and dz/dx are called “pitch-roll buoys.”
PUV Method – There are several instruments that measure wave subsurface pressure (P) and the two horizontal orbital velocity components (U and V). The PUV method utilizes the velocity and pressure time series to determine wave non-directional and directional information. This method assumes that waves in each frequency band are coming from one primary direction.
Acoustic Surface Detection - More recently, acoustics have been used to measure the surface posi-tion in an effort to make wave measurements from bottom mounted devices. These systems can be considered as inverted echo-sounders. Functioning in much the same way as a depth sounder measures distance from a boat to the sea bottom, an upward looking acoustic device can measure distance from the sea bottom to the sea surface. By making these measurements rapidly and accu-rately, a time series of the surface position can be measured, and non-directional wave parameters can be calculated.
UWV (Ultrasonic Wave Velocity) – Some instruments directly measure components of the wave orbital velocity. A typical transit-time flow measurement system utilizes two ultrasonic transduc-ers that function as both ultrasonic transmitter and receiver. The flow meter operates by alternately transmitting and receiving a burst of sound energy between the two transducers and measuring the transit time that it takes for sound to travel between the two transducers. The difference in the transit time measured is directly and exactly related to the velocity of the water.
Marine Radar – Wave heights are measured by analyzing radar echos from the sea surface. The radar sea-echo amplitude is dependent on the wind generated “roughness” of the sea surface. Grav-ity waves and currents form images on the radar display because they modulate the sea surface
Wave Sensor Technology ..................................................................................................................6
radar cross section by angular modulation, hydrodynamic interaction and shadowing. By the use of proper algorithms, a full three dimensional wave spectrum and the magnitude and direction of near surface currents may be calculated on the basis of digitized radar images. Marine naviga-tion radars utilize only the non-coherent radar back-scatter modulation. The navigation radar is an indirect wave sensor because there is no direct relation between wave height and radar back-scatter modulation amplitude. The calculated wave spectrum is basically un-scaled with respect to wave energy. Additional measurement of the non-directional wave spectrum may be required for calibration purposes or an empirical method of calibration, relating some parameter derived from the measured data to the real wave height, may be employed. Coherent radars measure Doppler-modulation, as well as amplitude modulation, while non-coherent radars only measure amplitude modulation. (http://www.miros.no)
High Frequency (HF) Radar - HF radar is well established as a powerful tool for sea current mea-surements at ranges of 30 to 200 km. It operates in the 3 to 50 MHz frequency band corresponding to a radio wavelength in the range of 10 to 100m. The Doppler shift of the first order Bragg lines of the radar echo is used to derive sea current estimates. For wave measurements, a more complex second order mechanism of backscatter is used. Although it has been claimed that HF radars can measure wave spectra at very long ranges, their success as wave sensors has in the past been lim-ited. A disadvantage of many HF radars is the size of their antennas. Attempts have been made to make the antennas smaller but probably at the cost of greatly reduced antenna efficiency.
Microwave Altimeters – Microwave altimeters emit microwave FM chirp signals and receive re-flections from the water surface. The propagation delay of the electromagnetic signal, due to the distance between the antenna and the water surface, causes a beat signal in the receiver. By means of advanced frequency domain filtering, the beat signal is converted to an accurate distance es-timate. The altimeter has a built-in reference to compensate for any long term drift. Microwave altimeters have been shown to also provide valid non-directional wave observations.
Laser Altimeters - Laser altimeters are small and light weight and operate in the infrared (IR) frequency band. They normally use pulsed waveforms and perform direct measurements of sea surface elevation, which easily can be converted to wave amplitude. The laser beam is very narrow and almost non dispersive. The footprint is small and almost independent of range. Originally it was thought that due to the high frequency of operation, laser altimeters are prone to interference from natural sources of IR emission. Salt and soot deposits on the optical window can greatly de-teriorate the measurement performance. However, recent tests of lasers for use as redundant air gap sensors have demonstrated that they are surprisingly robust. Altimeters deployed as long as 5 months can still work well with no lens maintenance. Laser altimeters have also been shown to provide valid wave directions (Irish et al., 2000).
Wave Data Users and Applications
The nearshore and coastal communities have different wave data requirements and/or technologies than deepwater users. For the purposes of this workshop, the participants agreed to defining “near-shore” or “coastal” as from the coast out to 200 nautical miles. Coastal users include emergency management groups; Coast Guard or other public safety officials; nearshore transportation opera-tors, including harbor pilots and ferry operators; recreational communities, including fishermen
Wave Sensor Technology ..................................................................................................................7
and beachgoers; engineers; and researchers. Presently, the number of parameters and the level of accuracy required vary for each group. Researchers and coastal engineers require wave measure-ment technologies up to par with the current state of the art to measure the higher moments, be-yond the First 5. Higher moments could provide detailed partitioning of the frequency spectra and improve forecasts of rip currents, sneaker waves, rogue waves, and other dangerous phenomena. Their minimum requirements are the First 5, while the remaining nearshore users require the more basic information: wave height, period, and direction. In this region, in situ wave sensors have the ability to measure wave heights with milimeter accuracy from pressure sensors, centimeter ac-curacy from buoys, and wave directions with 5 degree accuracy. Remote sensing technologies can measure wave heights with 0.5-m accuracy and directions with 10-20 degree accuracy.
Deepwater was defined as the open ocean beyond 200 nautical miles. Commercial shipping, offshore oil and gas industries, surf forecasters, researchers, commercial fishing operators, and federal agencies, such as the National Weather Service (NWS), including the National Centers for Environmental Prediction (NCEP), and the US Navy Fleet Numerical Meteorological and Ocean-ography Center (FNMOC) all require wave measurement in deeper waters to assist in wave model-ing and forecasting. Existing technologies for measuring waves in deepwater currently have the ability to measure peak wave direction as accurately as 10 degrees but also as poorly as 90 degrees. Advancement in the accuracy of offshore measurements can improve coastal forecasting as well. Maritime researchers would like a sensor that measures wave directions with accuracies between 2 and 5 degrees at peak frequencies, 10 degrees at low frequencies, and 5 degrees at higher frequen-cies. As with most other open ocean measurements, survivability and robustness, maintenance, deployment vessel availability, communications, power, and ultimately funding issues limit the offshore locations where waves can be measured. One possible solution to this problem may be to facilitate better communication between those in charge of in situ instrument placement and ocean wave modelers to coordinate efforts and ultimately obtain a global picture of wave conditions via combined use of measurements and models in data/sensor/model fusion. Quality of model output and forecasting depends on quality of the models’ data sources. Quality local wind speed and direction with hourly sampling are minimum requirements to achieve better quality offshore and coastal wave model output.
When measuring waves in shallow water, the participants agreed that it would be useful to also measure episodic or longer period water variations, such as storm surge or tides. Storm surge pre-diction and mitigation is an important consideration when planning any coastal monitoring system that measures waves or water level. Knowing these water elevations is also important for very nearshore and surf zone modeling due to influences of water depths on wave characteristics. Addi-tionally, some extreme event users need multiple inexpensive instruments with quick deployment capabilities, and they may not necessarily need real time data. Both accurate wave and water level data are required for proper measurement of extreme conditions. These measurements are crucial for validation of storm surge models and are also useful for shore protection, sediment transport models, and beach erosion studies.
A previous survey of users’ needs for wave data provides additional information. In 1994, the Field Wave Gauging Program under the USACE performed a Wave Data Users’ Need survey to assist in providing wave data and products for use in planning, designing, and operating coastal projects. The survey reported the results through tables and charts but did not interpret the results. Users
Wave Sensor Technology ..................................................................................................................8
surveyed included representatives from academia, state and local government, federal government, private sector, and the Corps of Engineers. A majority of responders used wave data for coastal engineering, coastal process studies, and scientific research, and more than half of them desired wave height, period, direction, pressure time series, directional wave spectra, and the climatologi-cal wave statistics. Data were desired in real time at all depths; deep water (>100m), intermediate water (>20m,<100m), shallow water (<20), and estuaries, bays, and harbors. The survey results can be downloaded at http://chl.erdc.usace.army.mil/chl.aspx?p=s&a=PUBLICATIONS!350
Considerations for Technology Choices
The total cost of ownership for wave sensor technologies was a major topic that all breakout groups considered when discussing how to decide what technology could meet their needs. This cost includes initial cost to purchase sensors and sensor packages, deployment, power, commu-nications, maintenance, and support, categorized as operations and maintenance (O&M). Know-ing the instruments’ life cycle and reliability in a variety of climatological conditions can assist in choosing the most appropriate system. Keeping the cost of accurately measuring the First 5 down is important to most participants. Ultimately the true value of accurate wave measurements should be quantified and compared to the total cost of ownership and presented to potential wave measurement sponsors to drive home the importance of such a monitoring system. Education and outreach is needed to make the public aware of the importance of wave measurements and may make implementation easier. Additional training for non-expert users may facilitate the addition of new wave observing systems. This training outreach component should also include a guide of how the average user can differentiate between the quality of different sensors.
Workshop participants recognized that data providers may be trying to make too many measure-ments with one sensor package. For buoy wave measurements, buoys are assumed to move with the waves and to follow the waves fairly well. For larger buoys or buoys that have additional in-strumentation, buoy response functions may be used to correct for a buoy not being a perfect wave follower. The integration of wind sensors and other meteorological instrumentation may alter the motion, making it difficult to make accurate wave measurements using it. Some participants sug-gested that the present wave buoy sites move away from incorporating additional instrumentation and only address wave measurement to eliminate this bias or to fully disclose these possible errors. This topic was more of a priority for researchers or participants that were more interested in look-ing beyond the First 5. The presence of a less precise in situ measurement is usually more useful than not having data.
Testing and Evaluation of Wave Measurement Technologies
There are a number of papers in the literature about comparisons of individual wave instruments or a few wave instruments (e.g., O’Reilly et al., 1996). Other examples include:
Comparisons conducted by Scripps Institution of Oceanography/Coastal Data Information • Program of an Acoustic Wave and Current Profiler (AWAC) and a Datawell Hippy instru-mented buoy at Diablo Canyon, CA from 12/1/04 to 12/31/04 and at Huntington, CA from 1/23/06 to 3/23/06.
Wave Sensor Technology ..................................................................................................................9
Deployments by SIO/CDIP of a Datawell Hippy at stations 114 and 115 and a Datawell • GPS at station 113 from 9/12/02 to 11/24/02 at Torrey Pines, CA and a Datawell Hippy at station 106 and a Datawell GPS at station 206 from 12/7/05 to 7/7/06 at Waimea, HI.A comparison conducted by NortekUSA of a Nortek AWAC and a Triaxys wave buoy at • the mouth of the Chesapeake Bay on a 12-day deployment during the summer of 2004. (http://www.nortek-as.com/technotes/TN-021Cheasapeake.pdf)A comparison sponsored by the Office of Naval Research of a Triaxys wave buoy and a RD • Instruments 1200 kHz ADCP deployed 10 km off Tybee Island, GA for 72 days beginning in November 2004. (http://wavebuoy.gtsav.gatech.edu/GTSavbuoyadcp05.pdf)
However, many wave sensor comparisons are often outdated, often of short-term duration, and may be in locations that are not representative of a wide range of wave conditions.
There was general agreement that the establishment of a wave sensor verification program, in-cluding facilities for easy ocean access at various locations, would provide a much needed more rigorous and systematic approach to evaluate technology performance. The candidate locations mentioned by the participants included the U.S. Army Corps of Engineers (USACE) Field Re-search Facility in Duck, NC and a west coast site to be determined that will be exposed to long period, energetic waves. A test lasting at least one year would be ideal to evaluate each sensor’s performance at obtaining the First 5. This verification or demonstration would also provide the wave sensor community, including vendors, with appropriate standards for achieving the First 5.
Data Quality Assurance and Quality Control (QA & QC)
Julie Thomas from Scripps Institution of Oceanography provided workshop participants with docu-mentation from the Second Workshop Report on the Quality Assurance of Real-Time Ocean Data: Waves and Currents (QARTOD-II) (NOAA, 2005). It summarized the pre-deployment diagnostic procedures that CDIP uses to identify malfunctioning sensors and a host of post processing checks to identify poor data. Visit http://cdip.ucsd.edu in the Documents section for more details. This document also contained a summary by Chung-Chu Teng from NDBC describing wave formats and processing, including scheme of data acquisition, wave format, spectral analysis methods, and digital filter processing methods. See http://nautilus.baruch.sc.edu/twiki/bin/view.
Workshop reCommenDaTions
The following is a summary of the recommendations that resulted from the closing plenary session where each workshop participant was asked to make one suggestion on how to overcome impedi-ments in the present state of wave sensor technology. Each of the recommendations shown below received support from a majority of the attendees.
Assemble a table of existing wave sensor technologies and evaluate their present abilities • of measuring the First 5 or at least to summarize their advantages and disadvantages.Establish a national network of First 5 buoys that involves close collaboration with the • modeling community to meet multiple end user needs. It is not necessary for all buoys or
Wave Sensor Technology ................................................................................................................10
monitoring sites to provide the First 5, but where this information is needed, it should be provided. Implement test and evaluation facilities that vendors can use to test instruments and ACT • can use for a verification. Initially the US ACoE Field Research Facility at Duck, NC can be utilized followed by development of a west coast facility. This should be followed by further development of geographically distributed test facilities.Develop a training program to educate users about how to deploy wave sensors appropri-• ately. Doing this would ensure that end users would have the right tools for the right ap-plications. These activities could fall under the auspices of ACT. ACT could organize and provide technology training workshops with vendor participation to educate users on the available technology and how to use it. The participants would like this to happen within 12 months of this workshop. Standardize data output and sensor/data interoperability. Doing this would ensure that dif-• ferent wave sensors would be measuring and providing desired variables consistently. Better utilize platforms of opportunity to add spatial density to wave measurements.• Standardize performance of wave sensors. This includes the establishment of a “Golden • Data Set” for data analysis algorithm evaluation (e.g., Maximum Entropy Method (MEM) and Maximum Likelihood Method (MLM)). Doing this could also include the establish-ment of a standard reference sensor for wave sensor calibration.Facilitate industry and user recognition that there are two types of wave measurements • required: long term and short term. Short term monitoring is event or application specific and could include building an infrastructure to measure waves and storm surge on dry land during normal conditions.Formalize and establish better public outreach and education efforts about:•
Basic knowledge of wave generation and properties –Significant socio-economic impacts of wave data –Convincing the public why we need wave measurements –
Develop platforms that can easily integrate multiple instruments without sacrificing the • integrity of wave measurements.Catalog and recognize life cycle costs of wave sensors, coined as total cost of ownership • (TCO).Fill measurement gaps for monitoring waves in nearshore waters (estuaries, bays, ports, • and harbors) where wave conditions are highly variable.
Wave Sensor Technology ................................................................................................................11
referenCes
Irish, J.L., J. M. Wozencraft, A. G. Cunningham. Lidar sensor for measuring directional-spectral character-istics of water waves, EARSeL: Lidar Remote Sensing of Land and Sea, EARSeL, Dresden, Germany, June, 2000.
NOAA, Second Workshop Report on the Quality Assurance of Real-Time Ocean Data: CCPO Technical Report Series No. 05-01. Norfolk, VA. 2005.
O’Reilly, W. C., T. H. C. Herbers, R. J. Seymour, R. T. Guza. A Comparison of Directional Buoy and Fixed Platform Measurements of Pacific Swell. Journal of Atmospheric and Oceanic Technol-ogy, Vol. 13, No. 1, February, 1996.
Steele, K. E., J.C. Lau, and Y. L. Hsu.. Theory and Application of Calibration Techniques for an NDBC Directional Wave Measurements Buoy. IEEE Journal of Oceanic Engineering, Vol. OE-10, NO. 4, October 1985.
Work, P.A., and E. Bystrom. Triaxys wave buoy and RD Instruments 1200 kHz ADCP: Compari-son of primary directional wave parameters, Tybee Roads, GA, 2005..
aCknoWleDgemenTs
The Alliance for Coastal Technologies would like to thank the Waves Sensor Technologies steer-ing committee: Bill Birkemeier, Army Corps of Engineers Coastal and Hydraulics Laboratory; Don Conlee, Nortek USA (formerly with the NOAA National Data Buoy Center); Mark Luther, University of South Florida; Julie Thomas, Scripps Institution of Oceanography; and Neil Trena-man, DHI Water, Environment, and Health. ACT also would like to acknowledge Sherryl Gilbert, University of South Florida; Bill O’Reilly and Julie Thomas, Scripps Institution of Oceanography; and Eric Siegel, Nortek USA, for their contributions to this report. We also would like to thank Guy Meadows, Eddie Shih, Marshall Earle, Mark Bushnell, and Landry Bernard for their helpful comments and suggestions.
Wave Sensor Technology ..............................................................................................................A-1
William BirkemeierU.S. Army Corps of Engineers Research and Develop-
ment Center
Richard BouchardNOAA National Data Buoy Center
Jim BoydNOAA Coastal Services Center
Robert Brantly, P.E.Florida Department of Environmental Protection
Earle Buckley, Ph.D.North Carolina State University/ACT
Mike ColbyNOAA National Weather Service
Don Conlee, Ph.D.NOAA National Data Buoy Center
Randolph DearthBoeing Integrated NCO Solutions/
Earth Information Systems
Paul DevineTeledyne RD Instruments
Marshall Earle, Ph.D.Planning Systems, Inc.
John EdwardsSea-Image Corporation
Brad Guay, Ph.D.U.S. Army Corps of Engineers Coastal Hydraulics Lab
David Gibbons, Ph.D.RBR Ltd.
Sherryl GilbertUniversity of South Florida/ACT
Merrick Haller, Ph.D.Oregon State University
Gary L. Howell, P.E.CivilTek
Carol Janzen, Ph.D.Sea-Bird Electronics, Inc.
Bob Jensen, Ph.D.U.S. Army Corps of Engineers Coastal and
Hydraulics Laboratory
Thomas H. Johengen, Ph.D.University of Michigan/ACT
Jason LawUniversity of South Florida
Mark Luther, Ph.D.University of South Florida/ACT
Guy Meadows, Ph.D.University of Michigan/ACT
Michelle McIntyreUniversity of South Florida/ACT
Cliff Merz, P.E.University of South Florida
Joseph P. Morrow, EITMRD Associates, Inc.
Harry Noteborn, Ph.D.Datawell Research Laboratory
Bill O’Reilly, Ph.D.Scripps Institution of Oceanography
Reo PhillipsAXYS Technologies Inc.
Hugh Roarty, Ph.D.Rutgers University Coastal Ocean
Observation Laboratory
Spencer RogersNorth Carolina Sea Grant
Jeff ScudderUniversity of South Florida
Eddie Shih, Ph.D., P.E.NOAA National Ocean Service
appenDix a: lisT of aTTenDees
Wave Sensor Technology ..............................................................................................................A-2
Eric SiegelNortek USA
Mario Tamburri, Ph.D.Chesapeake Biological Laboratory/ACT
Chung-Chu Teng, Ph.D.NOAA National Data Buoy Center
Julie ThomasScripps Institution of Oceanography
Dennis Trizna, Ph.D.Imaging Science Research
Elizabeth ValentiWorldWinds, Inc.
David ValescoSonTek/YSI, Inc.
Mike WatsonSurfline.com
Lauren WetzellSonTek/YSI, Inc.
Stephen L. Wood, Ph.D., PEFlorida Institute of Technology
appenDix a: lisT of aTTenDees (ConTinueD)
Wave Sensor Technology ..............................................................................................................B-1
1.0 Two-dimensional (2D) Wave Spectra
2D spectra are defined as wave energy S, as a function of wave frequency, f, and wave direction, θ.
S(f,θ) (1)
The wave field observed at any time and location is generally conceptualized as the linear sum of an infinite number of underlying “component waves” that span all possible wave frequencies and arrive from all directions. Each component wave is independent of the others in a completely linear wave field (each component has a random phase relative to the others), and its amplitude is defined by its 2D spectrum volume, S(f,θ)dfdθ.In practice, scientists and engineers work with discrete approximations of S(f,θ)and a finite number of wave components in frequency-direction bins with amplitudes, S(f,θ)·∆f·∆θ.
Present day wave research and applied wave modeling focus on observing and predicting S(f,θ)as it evolves in space and time. While many important wave data users (e.g., mariners) often focus on reduced wave parameters, such as significant wave height and dominant wave period, the accurate prediction of these parameters is dependent on our ability to predict and observe S(f,θ)spatiallyand as a function of time.
For example, in Hawaii, California, and Southeast Florida, island sheltering plays a large role in the regional wave climates. Accurate observations of S(f,θ)are needed offshore of the islands to model the sheltering effects correctly.
For regions with broad shallow shelves, like the Mid-Atlantic States, bottom dissipation and scat-tering broaden the directional spread and decrease the overall amount of wave energy in S(f,θ). As a result, the ability of the waves to drive alongshore currents, move sediment, and generate dangerous rip currents can be sharply reduced at times, but our ability to predict these situations accurately depends on our ability to observe and model S(f,θ).
Finally, along more open but geographically complex coastlines (e.g., New England, Northern California, Oregon, Washington) that have many headlands and partially protected coves, different sections of coastline are exposed to different wave directions. It is often the secondary or tertiary wave events present in the observed wave field that are most important at the sheltered locations most frequented by recreational beachgoers and mariners seeking shelter. To predict waves at these sites with any skill, you need to know as much about S(f,θ)as possible in order to sort wave events.
appenDix b: an inTroDuCTion To DireCTional Wave observaTions
Bill O’Reilly, SIO/CDIP
Wave Sensor Technology ..............................................................................................................B-2
2.0 In-Situ Directional Wave Observations
Ideally, we would like to observe the 3D, x-y-z translation of a sea surface water particle and do in concurrently at as many locations, and with as little error, as possible. In other words, we would like to accurately observe the 3D variation of the sea surface continuously through time.
In practice, accurate 3D observations are difficult to do with either in-situ instruments or remote sensing methods. Typically, 2 of the 3 criteria (measurement accuracy, spatial coverage, time coverage) can be done well by an instrument but not all 3. As a result, in-situ and remote sensing of waves are generally considered to be complimentary approaches to observing the sea surface, rather than redundant approaches.
2.1 The “Big 3”
In situ wave observations typically involve the concurrent measurement of 3 time series:
1) The sea surface vertical displacement (z)
-OR-
Sub-surface vertical water particle velocity (dz/dt)
2) & 3) The sea surface horizontal displacement (x,y)
-OR-
Sea surface slopes (dz/dx, dz/dy)
-OR-
Sub-surface horizontal water particle velocities (U=dx/dt, V=dy/dt)
where the measurement of sub-surface pressure or velocity is a proxy for the sea surface itself and can correct for depth attenuation using linear wave theory.
These properties are either measured by a surface buoy or by subsurface instruments, and they can be acquired using a variety of sensor technologies, including pressure sensors (z, dz/dx, dz/dy), accelerometers (x,y,z), tilt and angular rate sensors (dz/dx, dz/dy), and acoustic transducers and receivers (z, dz/dt, dx/dt, dy/dt).
Buoys that measure x,y,z are called “translational buoys,” and buoys that measure z, sea surface slopes dz/dy, and dz/dx are called “pitch-roll buoys.” Subsurface instruments that measure hori-zontal wave orbital velocity components, U and V, are often referred to as “PUVs,” where P refers to using a pressure sensor to measure z.
appenDix b: an inTroDuCTion To DireCTional Wave observaTions (ConTinueD)
Wave Sensor Technology ..............................................................................................................B-3
2.2 Sohowarethese3timeseriesrelatedtoS(f,θ)?
A fast Fourier transform (FFT) of the vertical displacement time series, z, yields an estimate of the wave energy or sea surface variance, as a function of wave frequency,
S(f), or the “wave frequency spectrum.”
In addition, at a fixed frequency, f, the directional distribution of wave energy, S(θ), can be ex-pressed as an infinite Fourier series,
S(f,θ)=S(f)[a1·cos(θ)+b1·sin(θ) +a2·cos(2θ) +b2·sin(2θ) +a3·cos(3θ)+b3·sin(3θ)+
a4·cos(4θ)+b4·sin(4θ)+…] (2)
Where a1, b1 , a2, b2, a3, b3,…. are “normalized directional Fourier coefficients” (See comment with earlier same change.) The term [a1·cos(θ)+b1·sin(θ)] is referred
to as the “first moment of the directional spectrum,” the a2 & b2 term the “second moment,” etc.
It is convenient to express S(θ) in this form because the covariance of the vertical time series and the two orthogonal horizontal time series (the co- and quadrature spectra or cross spectral matrix) are directly related to a1,b1,a2 and b2. We’ll avoid going into the time series analysis details here, but the important thing to understand is that most in situ directional wave instruments, no matter how accurate, only provide estimates of the lowest order moments of the full directional spectrum at a given wave frequency: a1, b1, a2 and b2.
It is possible to estimate higher directional moments with additional concurrent measurements of the sea surface or velocities with a known spatial separation. For example, the linear pressure sensor array at the Army Corps’ FRF in Duck, NC and acoustic doppler instruments with more than 3 beams. However, we will focus here on a1, b1, a2 and b2, as these have historically been challenging enough to measure accurately on a routine basis.
2.3 Sowhatcanyoudowiththelow-orderdirectionalFouriercoefficientsa1,b1,a2,b2?
There are several options, including:
The measured directional fourier coefficients can be used to derive 4 “estimator-free” sta-1. tistical parameters of S(θ),
mean direction – directional spread – skewness – kurtosis –
appenDix b: an inTroDuCTion To DireCTional Wave observaTions (ConTinueD)
Wave Sensor Technology ..............................................................................................................B-4
or, in traditional NDBC format
first-order mean direction ( – θ1) first-order directional spread ( – r1) – second-order mean direction (θ2) second-order directional spread ( – r2)
without additional assumptions.
The measured directional fourier coefficients can be used to constrain a “directional estima-2. tor” (e.g., MLM or MEM), which guesses at the remaining infinity-2 directional moments in Eq. 2 based on some “beauty principle” (e.g., smoothness or narrowness) to produce an estimate of S(θ).
The second moment directional fourier coefficient, 3. b2, calculated in a direction reference frame relative to the shoreline normal, can be used to estimate the alongshore radiation stress, Sxy ~ S(f)*b2(f). Sxy is a critical parameter for initializing alongshore current and sediment transport models.
Directional buoys and subsurface wave pressure and orbital velocity type instruments are all tech-nically “low resolution” directional devices, no matter how accurately they measure a1, b1, a2, b2. Nevertheless, accurate instruments do resolve the most important features of the underlying directional wave spectrum in many situations and contribute greatly to both applied wave predic-tion problems, as well as our scientific understanding of wind-wave generation, propagation, and evolution in shallow water.
CDIP’s experience with carefully tested and calibrated directional wave instruments suggests that useful estimates of S(θ) can be made with a1, b1, a2 and b2 when the directional spectrum at a giv-en wave frequency has a single peak (unimodal) that is either symmetric or skewed or two peaks (bimodal) that are both approximately symmetric but can have different sizes. Their usefulness decreases when the underlying directional spectrum becomes more complex, such as a bimodal distribution where one or both peaks are significantly skewed or distributions with more the two peaks (e.g., complex swell conditions inside island groups). Because we are only observing the lowest order directional moments of the wave spectrum, it is critical that a1,b1,a2 and b2 be mea-sured accurately for any research or practical applications that rely on estimating the underlying componentwaves,orindividualwaveevents,thatarepresentintheregionalwavefield.
3.0 Directional Wave Instrument Evaluation
Stakeholder use of directional wave observations has historically fallen into 2 catagories: Those interested mostly in a few parameters of the wave field that approximately describe the dominant waves and those interested in the underlying component waves or wave events.
appenDix b: an inTroDuCTion To DireCTional Wave observaTions (ConTinueD)
Wave Sensor Technology ..............................................................................................................B-5
The “dominant wave” users typically look at the significant wave height, Hs, peak wave period (also called dominant wave period), Tp, and the mean wave direction at the peak wave period, Dm @ Tp. These users are generally tolerant of modest errors in Tp and Dm, particularly when Hs is small. There are likely few, if any, directional wave instruments currently in use that cannot adequately satisfy this user base. Not recognizing that many users require only basic wave infor-mation has resulted in large regions with no wave measurements and an under-served “dominant wave” user. Today, Hs, Tp, and Dm can be reliably and adequately measured and transmitted for this user group.
The “component wave” users are more interested in observing the individual wave events in a re-gion or the wave energy in a particular f-θrange of S(f,θ).These stakeholders include scientists, engineers, surf forecasters, and, increasingly, marine weather forecasters in regions where only describing the dominant wave conditions is inadequate for marine and beach safety. Instrument accuracy is far more important to component wave users, and the selection of directional wave instrumentation requires a more careful evaluation of its performance. Wave instrument techni-cal specs (e.g., compass accuracy) are important, but they provide a partial picture as to how ac-curately an instrument can measure wave time series (typically three) relative to a fixed reference frame.
3.1 The bottom line: signal-to-noise and the First 5
The “common ground” of all in-situ wave measurement methods are 5 parameters
at each wave frequency:
1) Wave energy, S(f), and
2)-5) The Fourier directional coefficients a1(f), b1(f), a2(f), b2(f),
which in turn rely on the instrument measuring accurately the “Big 3” time series described in section 2. The First 5 offer the best way to intercompare different wave instruments and measure-ment technologies.
There are numerous ways that errors can be introduced into the measured time series, but the most common issue we have encountered when evaluating instruments is noise. More specifically, it is the signal-to-noise ratio (SNR) of the wave sensor output, and its impact on the resulting esti-mates of S, a1, b1, a2, b2. As in high quality audio equipment, directional wave instruments can be defined by their “fidelity.” Instruments with high fidelity can be used to resolve some of the finer details of S(f,θ),like the directional width of spectrum at a particular wave frequency and can more easily determine if the directional spectrum is bimodal or not. Low fidelity instruments will often return reasonable estimates of the mean wave direction (which is relatively insensitive to noise when the underlying spectrum is close to symmetric) but will overpredict directional spread and underpredict skewness and kurtosis. The resulting biases in estimates of S(f,θ)can seriously impact the utility of the data in wave research and applied modeling applications.
appenDix b: an inTroDuCTion To DireCTional Wave observaTions (ConTinueD)
Wave Sensor Technology ..............................................................................................................B-6
SNR levels are a function of:
What aspect of the passing waves you are trying to measure (1. e.g., sea surface displacement signals are often bigger than sea surface slope signals).
Wave energy (more energy = bigger signal).2.
Wave frequency (the lower the frequency, the lower the acceleration, slope and velocity 3. signals).
In general, the lower the wave frequency and the lower the wave energy, the lower the SNR and the poorer the directional wave measurements. Stated another way, small, long period waves are themostdifficulttomeasureaccuratelyowingtolowerSNRsinthemeasuredwavetimeseries. A well designed directional wave instrument has sensors on which response has been optimized to maintain as large a SNR as possible at low wave frequencies.
Methods for intercomparing the First 5 from different instruments will be discussed at the ACT meeting.
appenDix b: an inTroDuCTion To DireCTional Wave observaTions (ConTinueD)

Ref. No. [UMCES] CBL 07-105
Copies may be obtained from:ACT Headquarters
c/o University of Maryland Center of Environmental ScienceChesapeake Biological Laboratory
Post Office Box 38Solomons, Maryland 20688-0038
Email: [email protected]