Embed Size (px)
Citation preview
energies
Article
Wave Power Output Smoothing through the Use ofa High-Speed Kinetic Buffer
Brenda Rojas-Delgado 1 , Monica Alonso 1,* , Hortensia Amaris 1 and Juan de Santiago 2
1 Electrical Engineering Department, Universidad Carlos III de Madrid, 28911 Madrid, Spain;[email protected] (B.R.-D.); [email protected] (H.A.)
2 Division of Electricity, Department of Engineering Sciences, The Angstrom Laboratory, P.O. Box 534,SE-75121 Uppsala, Sweden; [email protected]
* Correspondence: [email protected]; Tel.: +34-91-624-8433
Received: 13 April 2019; Accepted: 6 June 2019; Published: 10 June 2019
Abstract: In this paper, a new control strategy for power output smoothing in a hybrid wave energyinstallation coupled to a flywheel energy storage system (FESS) is proposed. The control schemeis composed by three stages: a wave generator clustering process at the farm connection point;a power filtering process; and the control of the flywheel energy storage in order to improve thepower output of the hybrid wave farm. The proposed control is validated at the existing LysekilWave Energy Site located in Sweden, by using real generator measurements. Results show that theapplication of the flywheel energy storage system reduces the maximum peak power output fromthe wave energy installation by 85% and the peak/average power ratio by 76%. It is shown thatthe proposed system can reduce grid losses by 51%, consequently improving the energy efficiencyof the power network. The application of the proposed control strategy allows the hybrid wavepower plant to follow a power reference signal that is imposed by the grid operator. In addition,the study demonstrates that the application of the proposed control allows the hybrid wave powerplant to follow a power reference signal that is imposed by the grid operator. In addition, the studydemonstrates that the application of the proposed control enables a wave farm with flywheel energystorage to be a controllable, flexible resource in order to fulfill future grid code requirements formarine energy installations.
Keywords: wave energy; energy storage; flywheel; power take off (PTO); flywheel energy storagesystem (FESS)
1. Introduction
In 2016, the World Energy Council stated that the global marine generation capacity was92 PWh/year, which points to the possibility that wave energy could become more competitivecompared with other forms of renewable generation in the future [1]. Nevertheless, despite its viability,the costs are still high. The installation and operation of grid-connected wave energy plants stillneed to overcome technological barriers and gaps in important knowledge to meet economy of scalecriteria. Apart from the problems derived from generation unit costs, wave energy sources also facea variety of environmental, infrastructural, and socioeconomic obstacles, such as the uncertainty ofgrid-connected infrastructures, obstacles related to integration with the electricity market, and powerquality problems.
One of the most important barriers to effective wave energy integration with power networksis the high variability in the power generated by wave energy sources. It must be highlighted thatthese energy installations are located in coastal areas, which generally have weak grids that necessitatestrategies to manage their associated issues; such actions include voltage regulation, frequency leveling,
Energies 2019, 12, 2196; doi:10.3390/en12112196 www.mdpi.com/journal/energies

Energies 2019, 12, 2196 2 of 28
power factor correction, and harmonic mitigation. In addition, these wave energy installations lackspecific grid code technical requirements that define their specific power capabilities. Consequently,the existing grid codes have proved to be inadequate for wave energy installations [2].
The aforementioned barriers show that there is a need for efficient control tools to enhancethe regulation of power output by wave energy sources [2]. Comparatively few research has beendedicated to power smoothing at wave energy installations. Most of the research publications relatedto marine installations have focused on the design of the wave front-end interface [3–5], the study ofthe transmission technology [6], or the mechanical design [7–11].
Very few techniques have been proposed to improve the wave power output, and these can beclassified on the basis of whether they use an electrical energy storage system (ESS) to accomplish theirgoal [12]. Some studies have proposed clustering a set of wave energy converters (WECs) in orderto generate power that can be injected into the grid with reduced oscillations without needing to usean ESS. Power output aggregation also improves the on-shore connection system [13]. Other studieshave used ESSs to mitigate short-term voltage fluctuations. However, in these applications, it hasbeen found that the rating of the ESSs increases as the installed WEC power increases [14–16]. In [17],supercapacitors were used to improve wave farm power output at laboratory installations. However,only regular waves were considered, and the behavior of synthetic regular waves differs greatly fromreal wave conditions. From this aspect, it must be noted that the use of ESSs has proved to be effectivefor smoothing wave power output. In spite of this, the use of flywheels in marine energy installationsis very rare, mainly because it is not easy to coordinate the operation of wave energy generators bycontrolling the energy stored in the flywheel.
The contributions of this paper are threefold:
• The development of control methods for power output regulation at hybrid wave energy installationscombined with a flywheel is presented. The proposed control strategy can be used for wave poweroutput regulation in order to satisfy future grid codes for marine energy sources.
• The proposed control considers the application of flywheel ESSs for wave energy plants to smooththe power output delivered to the grid.
• It is worth highlighting that the developed control strategies were applied using data from anexisting wave emplacement, namely, the Lysekil Wave Energy Site located in Sweden.
The proposed control is able to improve not only the power injected into the grid but also thepower following capabilities of the wave power installation. The modeling and control were validatedat the experimental wave power plant located at the Lysekil Wave Energy Site developed by UppsalaUniversity in Sweden. To this end, data gathered from the real emplacement were later utilized toimplement the developed control algorithms.
2. Wave Energy Characteristics
Wave energy resources are three times the size of currently available resources and almost doublethe energy density, and they offer higher forecast accuracy when compared with wind and solarrenewable sources [3]. With respect to the annual production ratio, WECs work 90% of the hours ofthe year; this ratio is significantly greater than the 20–30% of other renewable generation technologies,such as solar and wind [12]. It is estimated that 10% of the energy consumed by the European continentcould be supplied solely by marine energy by the year 2050. However, despite the advantages thatwave energy presents and the availability of its resources, it is necessary to overcome a series ofchallenges: to become a competitive technology, a great investment in marine energy developmentmust be made so that the installation costs can be reduced, grid integration can be optimized, and gridcode requirements can be met [18].
• Wave energy is characterized by the height and frequency of the waves, which experience constantvariation; as a result, a marine installation’s power output does not comply with the quality criteria
Energies 2019, 12, 2196 3 of 28
required for electric grids. To improve the power quality of the delivered energy, it is possibleto install storage systems in marine emplacements or even group wave generators in a way thatallows oscillations of the power output of some units to be compensated by the power output ofother units in the same cluster.
• Wave direction is very changeable, and for this reason, it is necessary to carry out exhaustivestudies to determine the optimal location of the marine generation units’ mooring systems.
• With respect to grid connection requirements, there are no grid codes regulating the coupling ofmarine generation emplacements; therefore, the codes that have been used for wind installationsare applied instead. However, the variability in the power output that marine installations injectinto the grid must be considered because their behavior differs greatly from other installations.
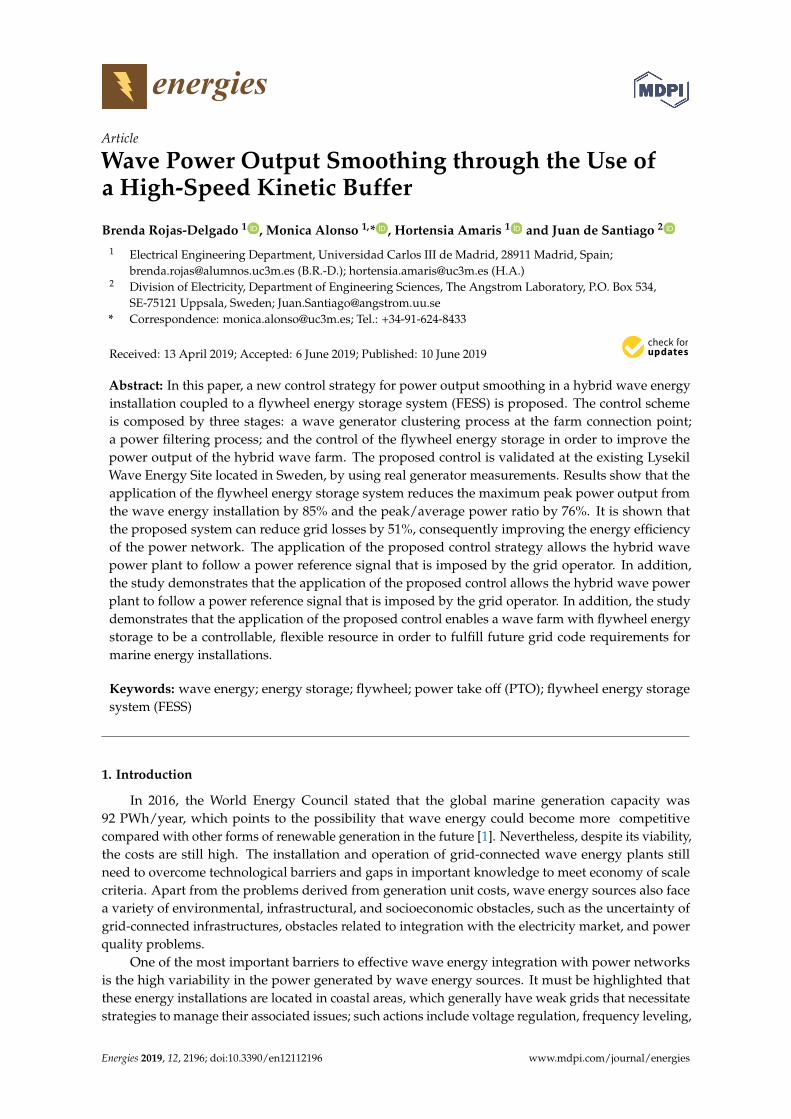
Figure 1 shows an example of the power output that corresponds to the permanent magnet lineargenerator WEC installation at the Lysekil Marine Platform in Sweden. In this case, there are three WECunits that are formed by a surface buoy connected to a linear generator moored to a foundation on theseabed [19–21]. It can be seen in Figure 1 that in a one-minute time interval, the power output of themarine installation shows great power oscillations. As it can be noted, marine production presents apeak power about 17 kW, which is equivalent to more than 5.8 times the mean power delivered to thegrid, i.e., 2.88 kW. There is great irregularity found in a WEC’s power production as a consequence ofthe variability in wave natural energy resources, and this irregularity makes the grid integration ofthis technology difficult to achieve.
0 10 20 30 40 50 60
Time (sec)
0
2
4
6
8
10
12
14
16
18
Pow
er
(kW
)
Figure 1. WEC’s power output for the Lysekil wave farm.
3. Wave Power Output Signal Improvement
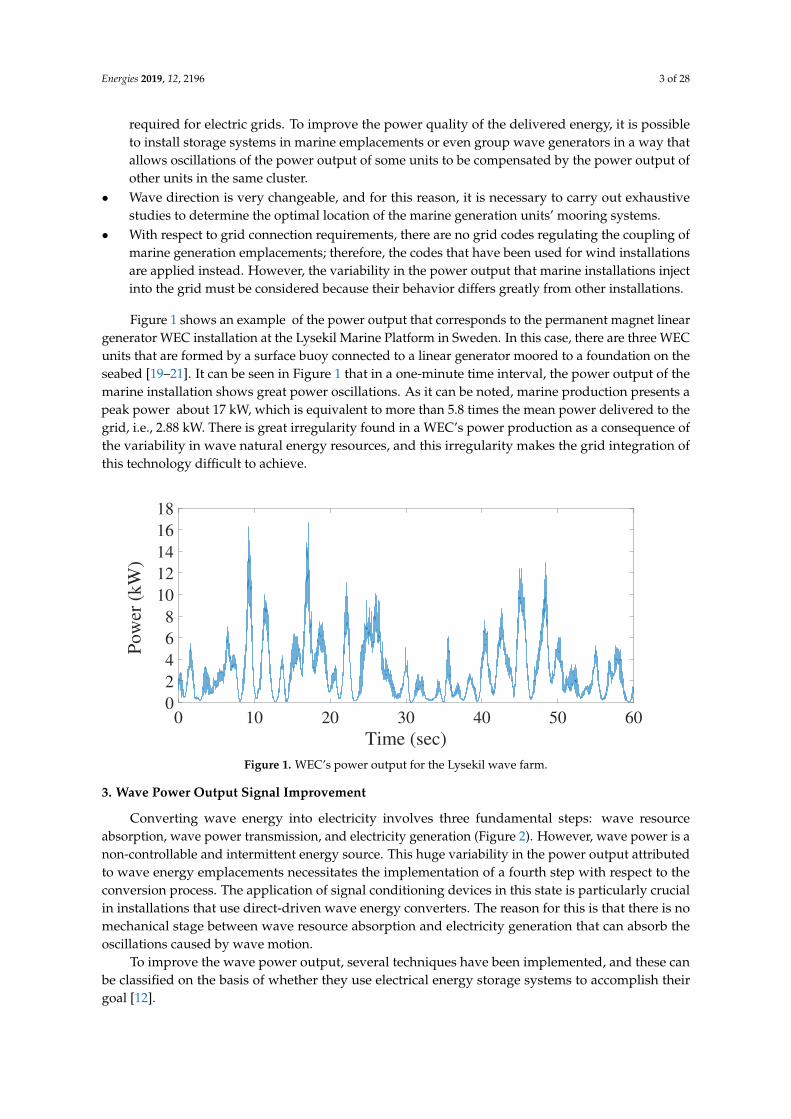
Converting wave energy into electricity involves three fundamental steps: wave resourceabsorption, wave power transmission, and electricity generation (Figure 2). However, wave power is anon-controllable and intermittent energy source. This huge variability in the power output attributedto wave energy emplacements necessitates the implementation of a fourth step with respect to theconversion process. The application of signal conditioning devices in this state is particularly crucialin installations that use direct-driven wave energy converters. The reason for this is that there is nomechanical stage between wave resource absorption and electricity generation that can absorb theoscillations caused by wave motion.
To improve the wave power output, several techniques have been implemented, and these canbe classified on the basis of whether they use electrical energy storage systems to accomplish theirgoal [12].
Energies 2019, 12, 2196 4 of 28
Figure 2. Transformation of wave resources into electrical energy.
Techniques that do not employ storage systems to improve the power output includethe following:
• The first approximation consists of clustering a set of WECs at the same connection point (PCC)in order to generate power that can be injected into the grid with reduced oscillations. This poweroutput aggregation also improves the on-shore connection system [22].
• Another option is the control of the wave power converter. The active control of the power take-off(PTO) system can improve the power output of a grid-connected marine emplacement [23].
• In those cases in which hydraulic PTOs are used, it is possible to reduce the power outputoscillations by means of water accumulators at sea level [24]. The system utilized by overtoppingreservoirs allows for a small power output regulation. Nevertheless, storing wave energy in itshydraulic form in other types of installations could lead to extra installation costs [25].
Among ESSs that have been used to mitigate short-term voltage fluctuations are thefollowing examples:
• Capacitors were used in [26], in which a power converter controlled the charge/dischargeoperation to smooth the power output oscillations of the marine installation. It was demonstratedthat the size of the capacitor depends on the size of the installed WEC power. Consequently, itsuse is restricted to small wave energy plants.
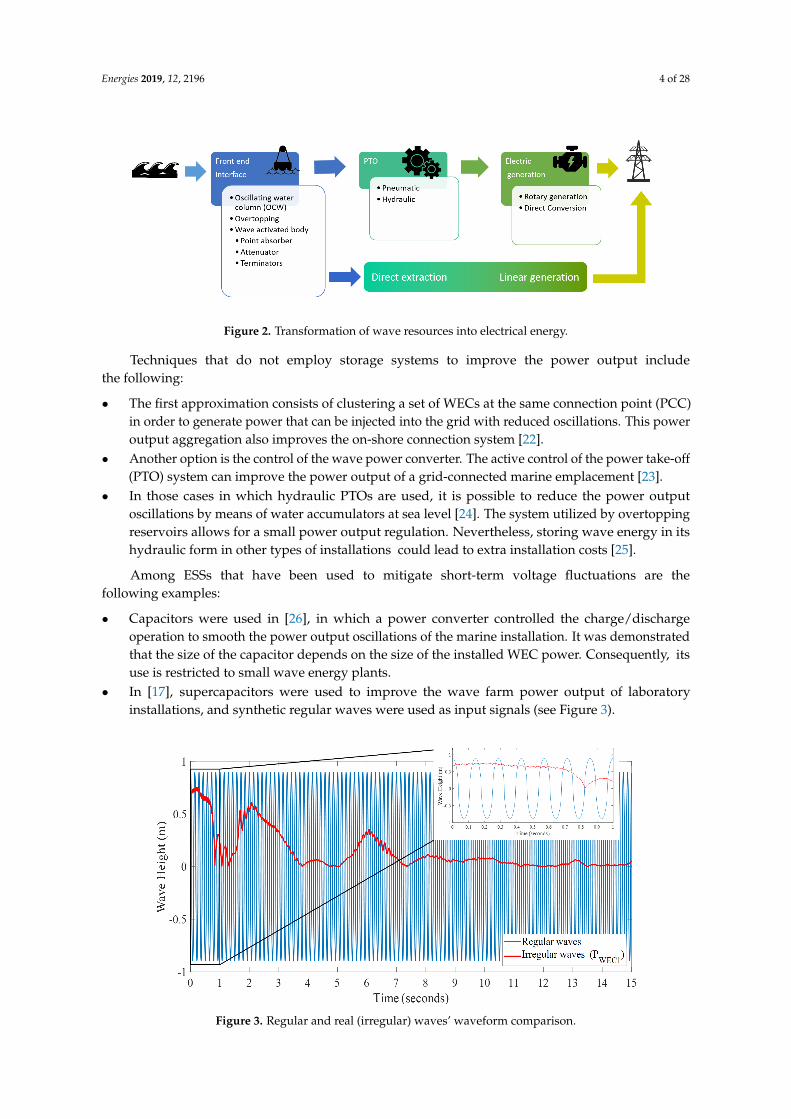
• In [17], supercapacitors were used to improve the wave farm power output of laboratoryinstallations, and synthetic regular waves were used as input signals (see Figure 3).
Figure 3. Regular and real (irregular) waves’ waveform comparison.

Energies 2019, 12, 2196 5 of 28
Energy storage systems coupled with wave installations must handle very a fast reaction timeand must be able to cope with hundreds of charge/discharge cycles per day [27].
4. Flywheel Energy Storage Systems
Power systems are currently experiencing a high penetration of small stochastic distributedgeneration units. Energy storage systems present themselves as promising alternatives for addressingthe great variability associated with the power output variability and power quality delivered to thegrid. This is because ESSs can either deliver a great amount of energy in short time periods or provideenergy to the power systems over longer periods [28]. According to [29], there are at least 11 types ofenergy storage systems with different specifications and different market shares. Overall, batteries arethe cheapest and most extended storage system, but flywheels have emerged as a very competitivetechnology. Power electronic converters have been applied extensively in wind power installations [30].They can be used for controlling variable-speed wind turbines and also for improving the reactivepower capability at the connection point [31]. The use of power electronic converters for power qualityapplications is normally related to voltage waveform quality [32] and the continuity of supply, but theyare not able to perform power smoothing without an additional storage system. This is an importantdistinction from a flywheel energy storage system (FESS), which can be used for either power qualitypurposes (as can be performed by power electronic equipment) or power output smoothing (whichcannot be performed by power electronic equipment). An FESS consists of a rotational mass that iscapable of storing an amount of kinetic energy that is directly proportional to the mass and the squareof its rotational speed. For energy production purposes, these rotational masses either store or deliverelectricity by means of converting the kinetic energy into electrical energy when coupled with a motoror generator.
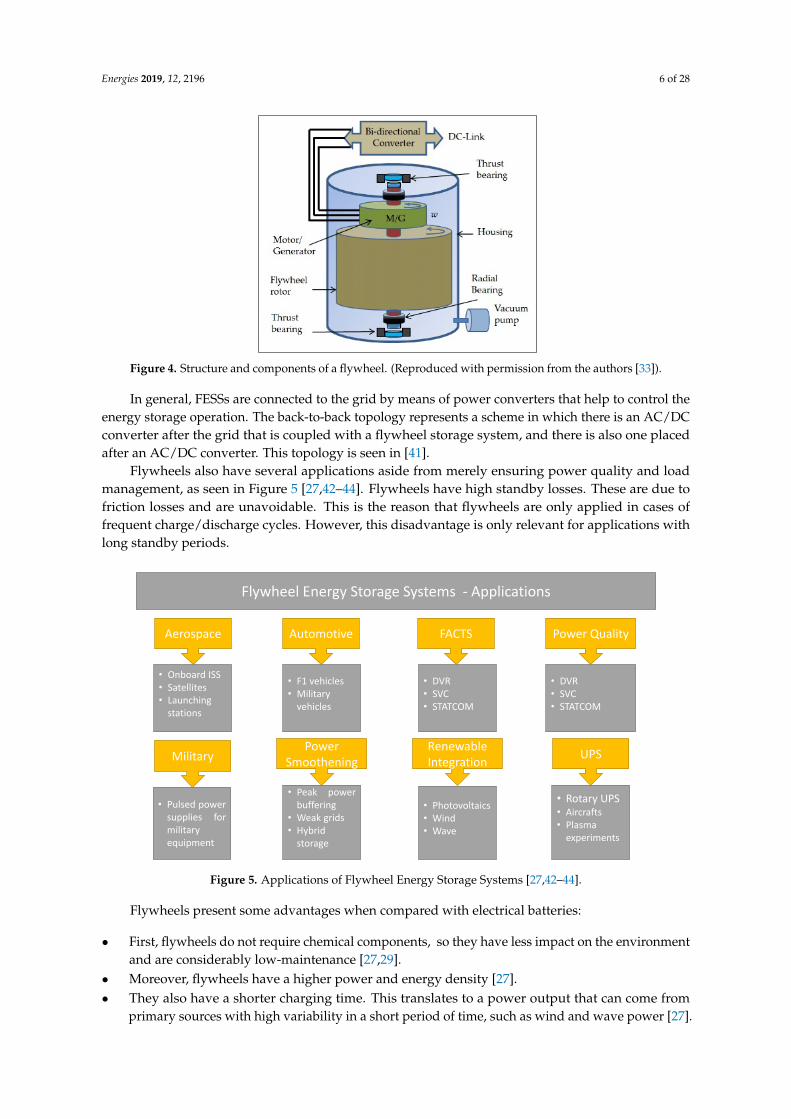
The main components of an FESS are as follows [33] (Figure 4):
• The primary component is a rotating mass that is commonly known as a flywheel. The rotatingmass is able to store kinetic energy, so the bigger the size of the flywheel, the greater the storedenergy. The stored kinetic energy is strongly dependent on the mass rotational speed.
• An electrical machine is in charge of transforming the mechanical energy to electrical energy orvice versa (generator/motor).
• Power electronics are used for controlling the performance of the electrical machine.• Magnetic bearings hold the flywheel’s weight.• An external inductor is used for improving the Total Harmonic Distortion (THD) that is created
by the generators of the permanent magnets in the electrical machine.
Several types of electrical machines can accompany the flywheel when the charge/dischargeprocess takes place. These types of machines include the permanent magnet synchronous machine(PMSM) [34], brushless DC electrical machine (BLDCM) [35], induction machine (IM) [36], switchedreluctance machine (SRM) [37], homopolar machine (HM) [38], synchronous machine (SM) [39],or bearingless electrical Machine (BM) [40]. Rotor bearings are classified as permanent (Passive)magnetic (PMB), active magnetic (AMB), and superconducting magnetic (SMB). Mechanical bearingshave practically fallen into disuse since the implementation of their magnetic counterparts.
Energies 2019, 12, 2196 6 of 28
Figure 4. Structure and components of a flywheel. (Reproduced with permission from the authors [33]).
In general, FESSs are connected to the grid by means of power converters that help to control theenergy storage operation. The back-to-back topology represents a scheme in which there is an AC/DCconverter after the grid that is coupled with a flywheel storage system, and there is also one placedafter an AC/DC converter. This topology is seen in [41].
Flywheels also have several applications aside from merely ensuring power quality and loadmanagement, as seen in Figure 5 [27,42–44]. Flywheels have high standby losses. These are due tofriction losses and are unavoidable. This is the reason that flywheels are only applied in cases offrequent charge/discharge cycles. However, this disadvantage is only relevant for applications withlong standby periods.
Aerospace
Flywheel Energy Storage Systems - Applications
Automotive FACTS Power Quality
MilitaryPower
SmootheningRenewable Integration
UPS
• F1 vehicles• Military
vehicles
• Onboard ISS• Satellites• Launching
stations
• DVR• SVC• STATCOM
• DVR• SVC• STATCOM
• Pulsed powersupplies formilitaryequipment
• Peak powerbuffering
• Weak grids• Hybrid
storage
• Photovoltaics• Wind• Wave
• Rotary UPS• Aircrafts• Plasma
experiments
Figure 5. Applications of Flywheel Energy Storage Systems [27,42–44].
Flywheels present some advantages when compared with electrical batteries:
• First, flywheels do not require chemical components, so they have less impact on the environmentand are considerably low-maintenance [27,29].
• Moreover, flywheels have a higher power and energy density [27].• They also have a shorter charging time. This translates to a power output that can come from
primary sources with high variability in a short period of time, such as wind and wave power [27].
Energies 2019, 12, 2196 7 of 28
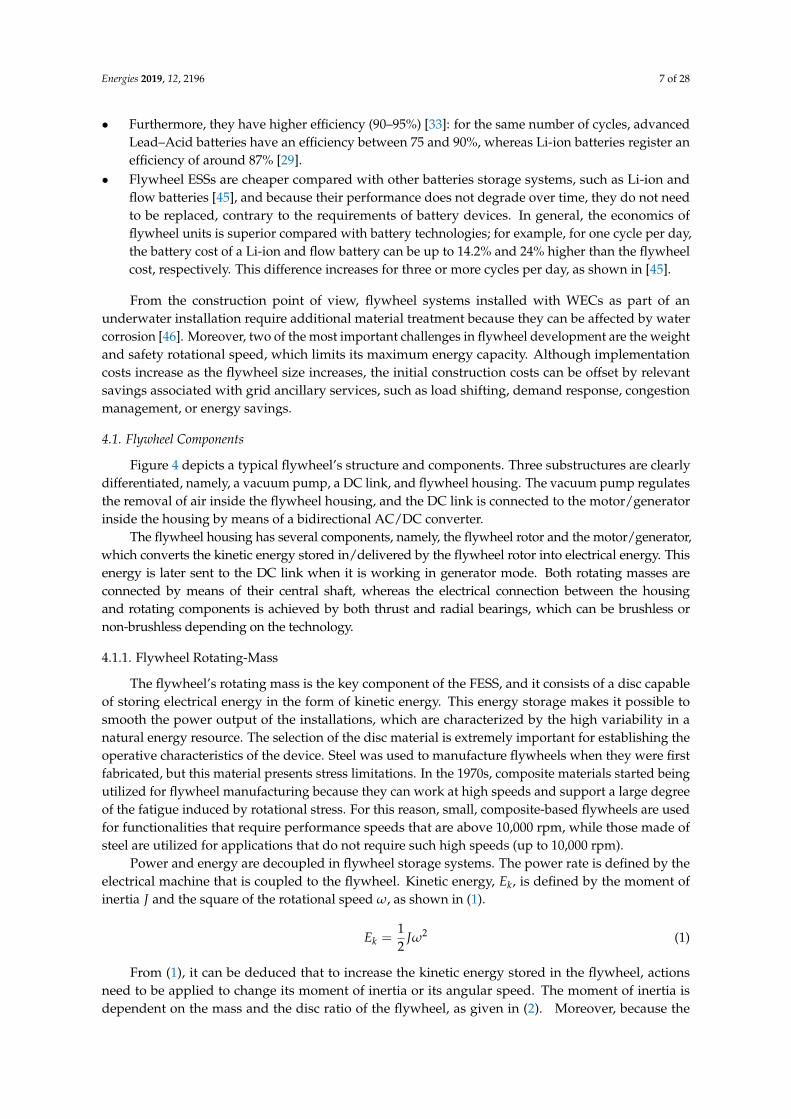
• Furthermore, they have higher efficiency (90–95%) [33]: for the same number of cycles, advancedLead–Acid batteries have an efficiency between 75 and 90%, whereas Li-ion batteries register anefficiency of around 87% [29].
• Flywheel ESSs are cheaper compared with other batteries storage systems, such as Li-ion andflow batteries [45], and because their performance does not degrade over time, they do not needto be replaced, contrary to the requirements of battery devices. In general, the economics offlywheel units is superior compared with battery technologies; for example, for one cycle per day,the battery cost of a Li-ion and flow battery can be up to 14.2% and 24% higher than the flywheelcost, respectively. This difference increases for three or more cycles per day, as shown in [45].
From the construction point of view, flywheel systems installed with WECs as part of anunderwater installation require additional material treatment because they can be affected by watercorrosion [46]. Moreover, two of the most important challenges in flywheel development are the weightand safety rotational speed, which limits its maximum energy capacity. Although implementationcosts increase as the flywheel size increases, the initial construction costs can be offset by relevantsavings associated with grid ancillary services, such as load shifting, demand response, congestionmanagement, or energy savings.
4.1. Flywheel Components
Figure 4 depicts a typical flywheel’s structure and components. Three substructures are clearlydifferentiated, namely, a vacuum pump, a DC link, and flywheel housing. The vacuum pump regulatesthe removal of air inside the flywheel housing, and the DC link is connected to the motor/generatorinside the housing by means of a bidirectional AC/DC converter.
The flywheel housing has several components, namely, the flywheel rotor and the motor/generator,which converts the kinetic energy stored in/delivered by the flywheel rotor into electrical energy. Thisenergy is later sent to the DC link when it is working in generator mode. Both rotating masses areconnected by means of their central shaft, whereas the electrical connection between the housingand rotating components is achieved by both thrust and radial bearings, which can be brushless ornon-brushless depending on the technology.
4.1.1. Flywheel Rotating-Mass
The flywheel’s rotating mass is the key component of the FESS, and it consists of a disc capableof storing electrical energy in the form of kinetic energy. This energy storage makes it possible tosmooth the power output of the installations, which are characterized by the high variability in anatural energy resource. The selection of the disc material is extremely important for establishing theoperative characteristics of the device. Steel was used to manufacture flywheels when they were firstfabricated, but this material presents stress limitations. In the 1970s, composite materials started beingutilized for flywheel manufacturing because they can work at high speeds and support a large degreeof the fatigue induced by rotational stress. For this reason, small, composite-based flywheels are usedfor functionalities that require performance speeds that are above 10,000 rpm, while those made ofsteel are utilized for applications that do not require such high speeds (up to 10,000 rpm).
Power and energy are decoupled in flywheel storage systems. The power rate is defined by theelectrical machine that is coupled to the flywheel. Kinetic energy, Ek, is defined by the moment ofinertia J and the square of the rotational speed ω, as shown in (1).
Ek =12
Jω2 (1)
From (1), it can be deduced that to increase the kinetic energy stored in the flywheel, actionsneed to be applied to change its moment of inertia or its angular speed. The moment of inertia isdependent on the mass and the disc ratio of the flywheel, as given in (2). Moreover, because the

Energies 2019, 12, 2196 8 of 28
cylinder volume is directly proportional to the ratio r and the height h, the moment of inertia can becalculated according to (3), where ρm is the material density of the flywheel’s rotating mass.
J =12
mr2 (2)
J =12
ρmπhr4 (3)
Similarly, useful energy can be obtained in two different ways. The first way is by using thedifference between the maximum and minimum rotational speeds, as defined in (4). The second way,which is given in (5), is based on the moment of inertia’s decomposition for a hollow cylinder, wherem is the cylinder mass, router is the outer radius, and rinner is the inner radius [33].
Ek =12
J(ω2max −ω2
min) (4)
Ek =12
mω2(r2outer − r2
inner) (5)
4.1.2. Magnetics Bearings
Magnetic bearings are located inside the FESS cavity, especially at the upper and lower parts ofthe disc that contains the flywheel’s rotating mass. The main function is to hold the weight of theflywheel disc, so it can thus be considered the main mechanical component of the FESS. The flywheeldisc is maintained between the two magnetic bearings by the repelling electromagnetic forces that aregenerated inside the housing, and there is no need for them to be in contact with the disc. For thisreason, flywheels that employ magnetic bearings have less frictional force than their mechanicalcounterparts; in addition, they can reach a higher rotational speed and have a longer life cycle andcapacity with minimal maintenance [28]. To limit the friction of the elements contained in the housing,the housing is filled with low-pressure air or helium [47]. The main inconvenience with magneticbearings is their control mechanism. When there are failures in the control system or overloads, it isnecessary to have an additional mechanical bearing system.
There are currently three types of magnetic bearings: passive, active, and superconducting.
• Passives: The main advantages of these elements are their low friction losses and low cost [48].However, they are used as backup bearings because their performance presents instabilities.
• Actives: These bearings are used as additional units to reduce rotor vibrations. Their mainadvantage is that they present higher controllability and longer life cycles than passive ones,but active magnetic bearings do present higher losses due to the existence of bias currents.Combining active and mechanical bearings is a good choice in terms of controllability, stability,viability, and costs [41].
• Lastly, superconducting magnetic bearings are the most widely utilized type in applicationsthat require high speed since they have more stability, longer life cycles, and lower losses.The main inconvenience is their very low operating temperature, which requires the additionof a cryogenic system that can provide these low temperatures. Consequently, the cost of theequipment increases [41].
4.1.3. Electrical Machine
The electrical machine plays a key role in FESSs because it acts as an electromechanical devicein charge of establishing the energy interchange between the flywheel and the grid. At the sametime, it converts electrical energy into mechanical energy and vice versa. In other words, the electricalmachine works as a generator when the electric grid demands energy from the flywheel, in whichcase the speed of the flywheel is reduced; when the machine needs to act as a motor to store energy in
Energies 2019, 12, 2196 9 of 28
the flywheel, its acceleration is increased. Permanent magnet synchronous machines (PMSGs) are themost commonly utilized electrical machines in FESSs because they present lower rotor losses, higherenergy densities, and higher efficiency compared with other electrical machines. They are used inapplications that require rotational speeds of about 50,000 rpm, but there are current developmentsthat can reach ultrahigh velocities (150,000–300,000 rpm) [49].
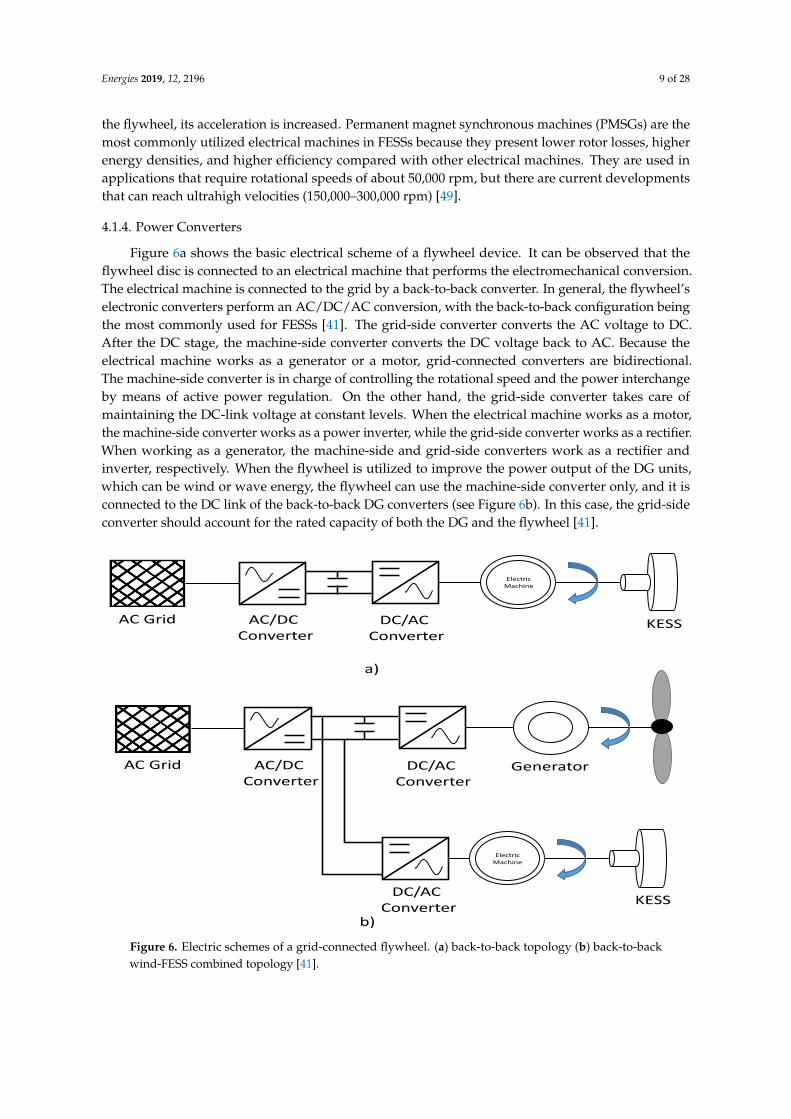
4.1.4. Power Converters
Figure 6a shows the basic electrical scheme of a flywheel device. It can be observed that theflywheel disc is connected to an electrical machine that performs the electromechanical conversion.The electrical machine is connected to the grid by a back-to-back converter. In general, the flywheel’selectronic converters perform an AC/DC/AC conversion, with the back-to-back configuration beingthe most commonly used for FESSs [41]. The grid-side converter converts the AC voltage to DC.After the DC stage, the machine-side converter converts the DC voltage back to AC. Because theelectrical machine works as a generator or a motor, grid-connected converters are bidirectional.The machine-side converter is in charge of controlling the rotational speed and the power interchangeby means of active power regulation. On the other hand, the grid-side converter takes care ofmaintaining the DC-link voltage at constant levels. When the electrical machine works as a motor,the machine-side converter works as a power inverter, while the grid-side converter works as a rectifier.When working as a generator, the machine-side and grid-side converters work as a rectifier andinverter, respectively. When the flywheel is utilized to improve the power output of the DG units,which can be wind or wave energy, the flywheel can use the machine-side converter only, and it isconnected to the DC link of the back-to-back DG converters (see Figure 6b). In this case, the grid-sideconverter should account for the rated capacity of both the DG and the flywheel [41].
KESS
Electric Machine
AC Grid AC/DC Converter
DC/AC Converter
AC Grid AC/DC Converter
DC/AC Converter
KESS
Electric Machine
Generator
DC/AC Converter
a)
b)
Figure 6. Electric schemes of a grid-connected flywheel. (a) back-to-back topology (b) back-to-backwind-FESS combined topology [41].

Energies 2019, 12, 2196 10 of 28
5. Lysekil Research Site
5.1. Location
According to the classification established by [50], the Lysekil wave farm (Lysekil Research Site,LRS) can be included in the group of the last “pre-commercial stage gate requirements test sites”.The installation is located on the west coast of Sweden, 100 km from the southwestern part of Göteborgcity and 2 km from the coast of Lysekil city. The location encompasses a surface of 40,000 m2 withcoordinates of 58 11′850′′ N 11 22′460′′ E and 58 11′630′′ N 11 22′460′′ E. The sea bottom is locatedat a depth of 24–25 m, and optimal conditions are created for mooring WEC devices [51]. The locationof the LRS is surrounded by islands; this allows the wave farm to have a good sea state, even in winter,with an energy density of 2.6 ± 0.3 kW/m [52]. Figure 7 shows the location of the installation and thesea state in the surroundings of the LRS. Figure 8 shows the wave climate matrix that corresponds tothe Lysekil wave farm location.
Figure 7. Location and state of the sea at the Lysekil marine facility [51,53].
Figure 8. Wave climate matrix at Lysekil research site [54].
The LRS started its operation in 2003, and the first measurements related to its sea states weretaken in 2004. In March 2006, the LRS installed the first buoy, known as L1; a 2.9-km-long wire connectsit to the measurement substation that is located on the Hermanö island at the southern point of the LRS.In 2009, two additional WEC devices, namely, L2 and L3, were installed [55]. Together with the WECs,21 environmental buoys were installed in 2007; the intention was to measure the impact of the WECunits on the marine surroundings of the installation and vice versa. Between 2009 and 2010, five new
Energies 2019, 12, 2196 11 of 28
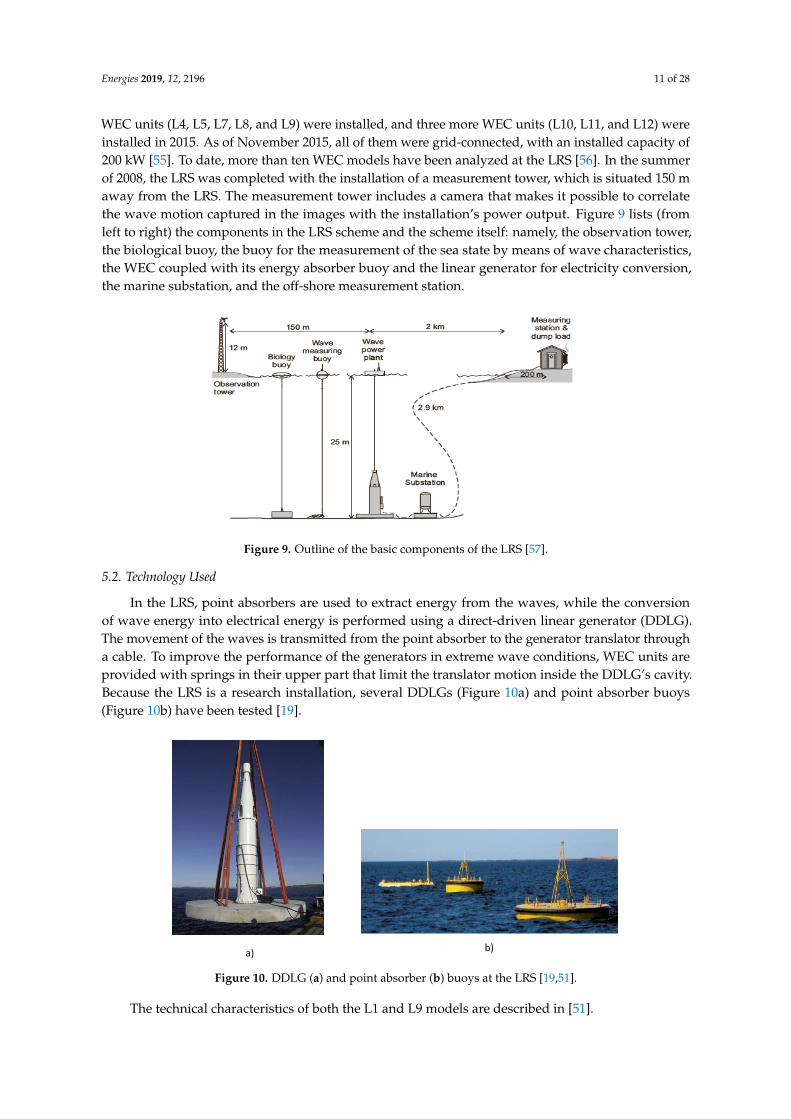
WEC units (L4, L5, L7, L8, and L9) were installed, and three more WEC units (L10, L11, and L12) wereinstalled in 2015. As of November 2015, all of them were grid-connected, with an installed capacity of200 kW [55]. To date, more than ten WEC models have been analyzed at the LRS [56]. In the summerof 2008, the LRS was completed with the installation of a measurement tower, which is situated 150 maway from the LRS. The measurement tower includes a camera that makes it possible to correlatethe wave motion captured in the images with the installation’s power output. Figure 9 lists (fromleft to right) the components in the LRS scheme and the scheme itself: namely, the observation tower,the biological buoy, the buoy for the measurement of the sea state by means of wave characteristics,the WEC coupled with its energy absorber buoy and the linear generator for electricity conversion,the marine substation, and the off-shore measurement station.
Figure 9. Outline of the basic components of the LRS [57].
5.2. Technology Used
In the LRS, point absorbers are used to extract energy from the waves, while the conversionof wave energy into electrical energy is performed using a direct-driven linear generator (DDLG).The movement of the waves is transmitted from the point absorber to the generator translator througha cable. To improve the performance of the generators in extreme wave conditions, WEC units areprovided with springs in their upper part that limit the translator motion inside the DDLG’s cavity.Because the LRS is a research installation, several DDLGs (Figure 10a) and point absorber buoys(Figure 10b) have been tested [19].
b)
a)b)
Figure 10. DDLG (a) and point absorber (b) buoys at the LRS [19,51].
The technical characteristics of both the L1 and L9 models are described in [51].
Energies 2019, 12, 2196 12 of 28
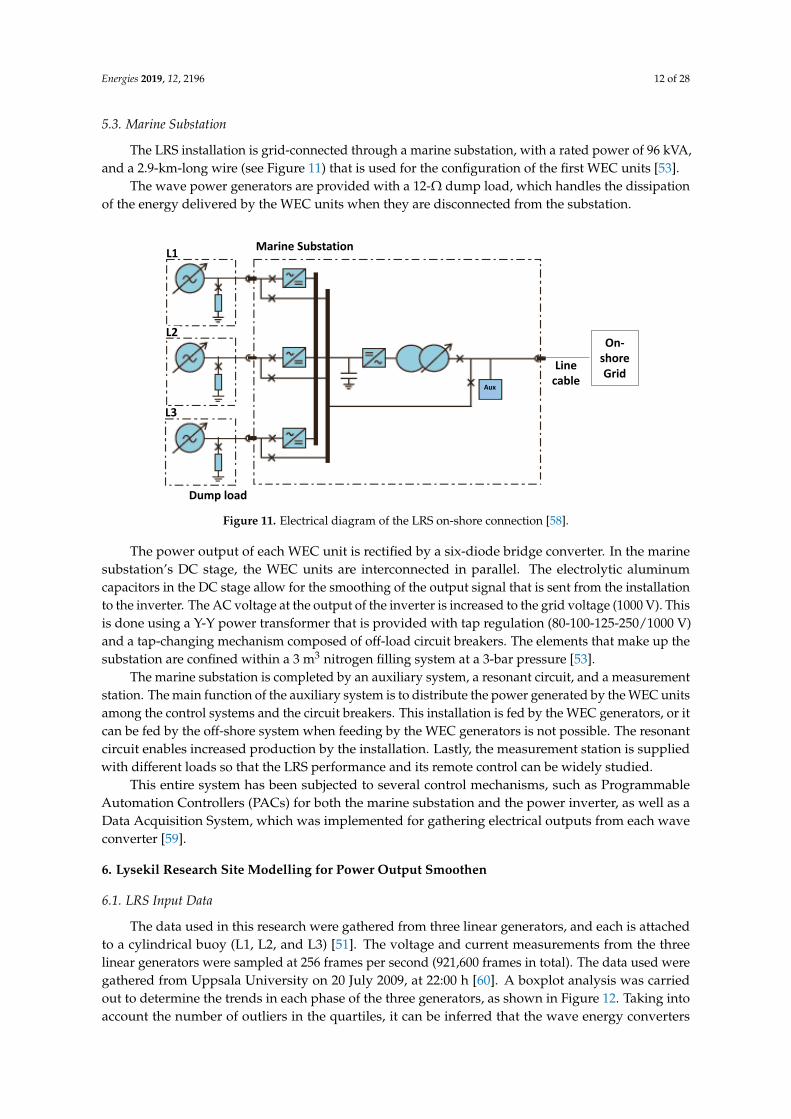
5.3. Marine Substation
The LRS installation is grid-connected through a marine substation, with a rated power of 96 kVA,and a 2.9-km-long wire (see Figure 11) that is used for the configuration of the first WEC units [53].
The wave power generators are provided with a 12-Ω dump load, which handles the dissipationof the energy delivered by the WEC units when they are disconnected from the substation.
On-shore Grid
Dump load
Line cable
Aux
Marine SubstationL1
L2
L3
Figure 11. Electrical diagram of the LRS on-shore connection [58].
The power output of each WEC unit is rectified by a six-diode bridge converter. In the marinesubstation’s DC stage, the WEC units are interconnected in parallel. The electrolytic aluminumcapacitors in the DC stage allow for the smoothing of the output signal that is sent from the installationto the inverter. The AC voltage at the output of the inverter is increased to the grid voltage (1000 V). Thisis done using a Y-Y power transformer that is provided with tap regulation (80-100-125-250/1000 V)and a tap-changing mechanism composed of off-load circuit breakers. The elements that make up thesubstation are confined within a 3 m3 nitrogen filling system at a 3-bar pressure [53].
The marine substation is completed by an auxiliary system, a resonant circuit, and a measurementstation. The main function of the auxiliary system is to distribute the power generated by the WEC unitsamong the control systems and the circuit breakers. This installation is fed by the WEC generators, or itcan be fed by the off-shore system when feeding by the WEC generators is not possible. The resonantcircuit enables increased production by the installation. Lastly, the measurement station is suppliedwith different loads so that the LRS performance and its remote control can be widely studied.
This entire system has been subjected to several control mechanisms, such as ProgrammableAutomation Controllers (PACs) for both the marine substation and the power inverter, as well as aData Acquisition System, which was implemented for gathering electrical outputs from each waveconverter [59].
6. Lysekil Research Site Modelling for Power Output Smoothen
6.1. LRS Input Data
The data used in this research were gathered from three linear generators, and each is attachedto a cylindrical buoy (L1, L2, and L3) [51]. The voltage and current measurements from the threelinear generators were sampled at 256 frames per second (921,600 frames in total). The data used weregathered from Uppsala University on 20 July 2009, at 22:00 h [60]. A boxplot analysis was carriedout to determine the trends in each phase of the three generators, as shown in Figure 12. Taking intoaccount the number of outliers in the quartiles, it can be inferred that the wave energy converters
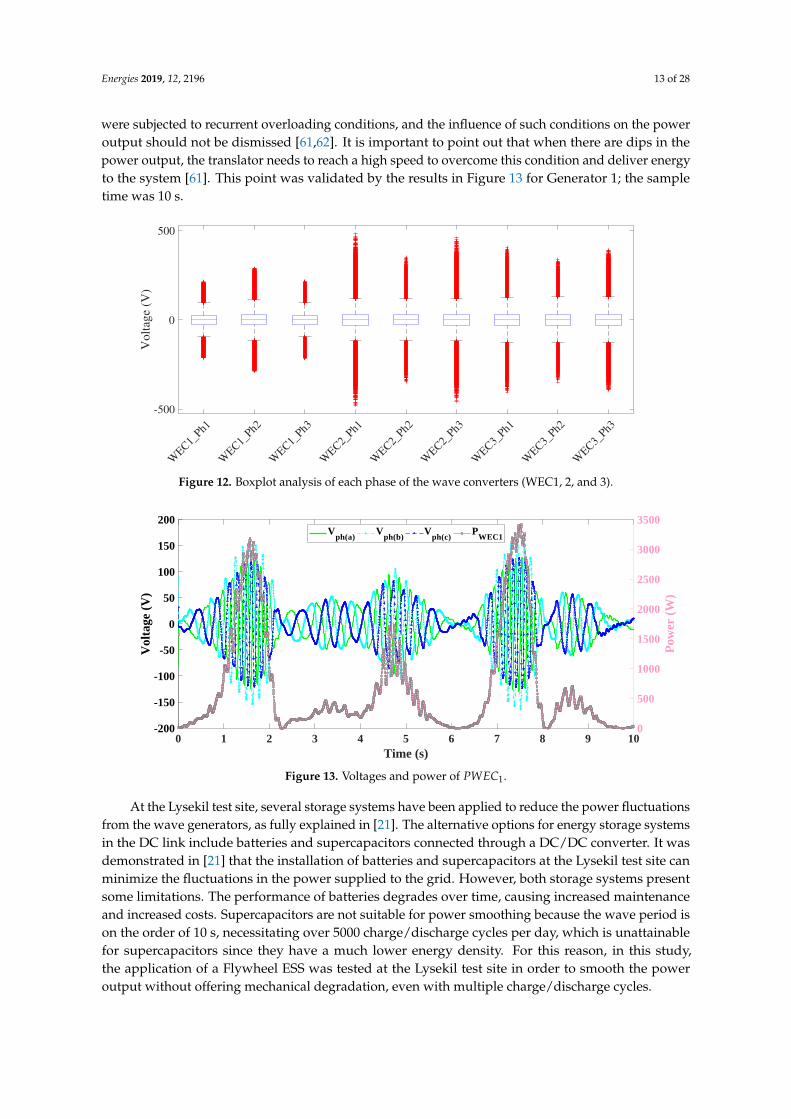
Energies 2019, 12, 2196 13 of 28
were subjected to recurrent overloading conditions, and the influence of such conditions on the poweroutput should not be dismissed [61,62]. It is important to point out that when there are dips in thepower output, the translator needs to reach a high speed to overcome this condition and deliver energyto the system [61]. This point was validated by the results in Figure 13 for Generator 1; the sampletime was 10 s.
WEC
1_Ph1
WEC
1_Ph2
WEC
1_Ph3
WEC
2_Ph1
WEC
2_Ph2
WEC
2_Ph3
WEC
3_Ph1
WEC
3_Ph2
WEC
3_Ph3
-500
0
500
Volt
age
(V)
Figure 12. Boxplot analysis of each phase of the wave converters (WEC1, 2, and 3).
0 1 2 3 4 5 6 7 8 9 10Time (s)
-200
-150
-100
-50
0
50
100
150
200
Vol
tage
(V
)
0
500
1000
1500
2000
2500
3000
3500
Pow
er (
W)
Vph(a)
Vph(b)
Vph(c)
PWEC1
Figure 13. Voltages and power of PWEC1.
At the Lysekil test site, several storage systems have been applied to reduce the power fluctuationsfrom the wave generators, as fully explained in [21]. The alternative options for energy storage systemsin the DC link include batteries and supercapacitors connected through a DC/DC converter. It wasdemonstrated in [21] that the installation of batteries and supercapacitors at the Lysekil test site canminimize the fluctuations in the power supplied to the grid. However, both storage systems presentsome limitations. The performance of batteries degrades over time, causing increased maintenanceand increased costs. Supercapacitors are not suitable for power smoothing because the wave period ison the order of 10 s, necessitating over 5000 charge/discharge cycles per day, which is unattainablefor supercapacitors since they have a much lower energy density. For this reason, in this study,the application of a Flywheel ESS was tested at the Lysekil test site in order to smooth the poweroutput without offering mechanical degradation, even with multiple charge/discharge cycles.

Energies 2019, 12, 2196 14 of 28
6.2. LRS Modelling
6.2.1. General Description
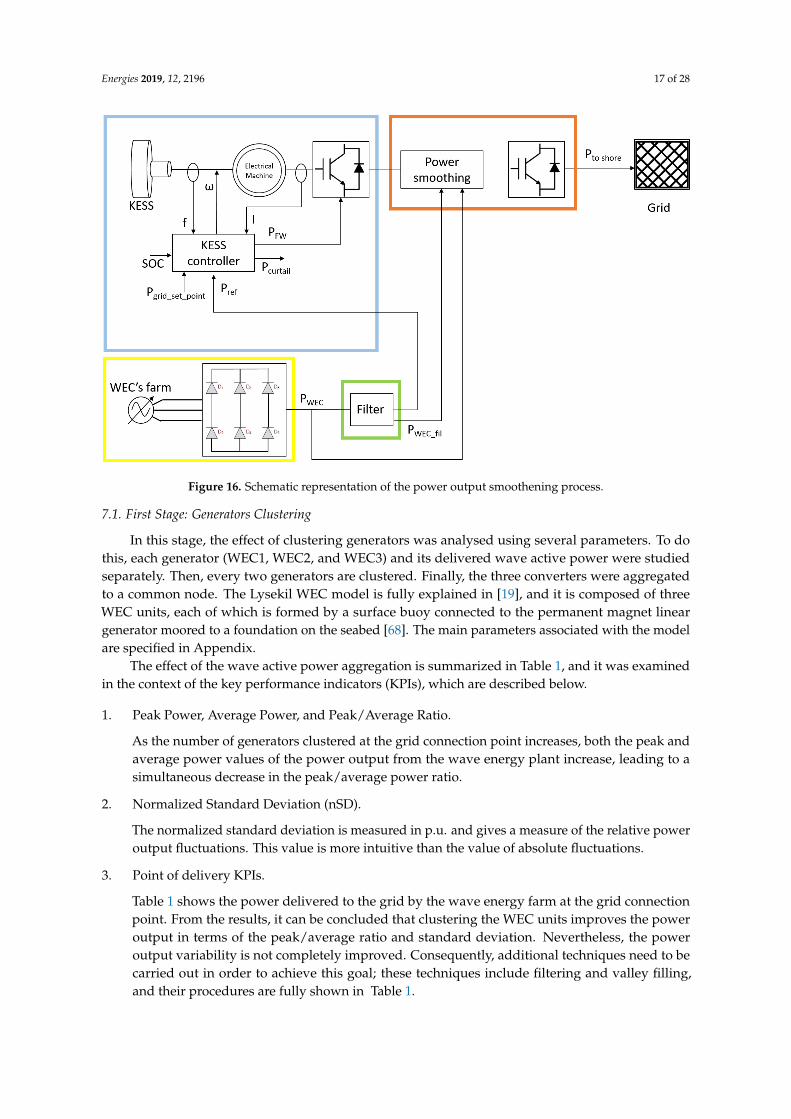
The general structure of the Lysekil Wave Farm and the proposed wave power smoothing systemis shown in Figure 14, which includes a wave farm, a filter, a Kinetic Energy Storage System (KESS),a DC/AC converter, and a marine transformer. Each block in the wave farm is described below:
1. The wave power farm consists of three WECs. For wave power output smoothing, the WECswere modeled with the measurement data collected from the three WECs located at the LysekilTest Site (see Figure 14, WEC’s Block) [56].
2. Filter: the purpose of the filter is to create a reference signal for the FESS in order to storewave energy in this device. To accomplish that, the filter decomposes the input signal (powerfrom WECs) into two components: one that corresponds to the smoothed power output andanother that corresponds to the fluctuating part of the signal and that must be stored in the FESS(Figure 14, Reference signal Block).
3. The KESS is formed by a high-speed flywheel that is connected to the DC link (see Figure 14,FESS Block).
4. The DC/AC inverter is an IGBT inverter that improves the wave farm power output by fillingthe power valleys with the energy stored in the KESS (see Figure 14, Grid-Side Converter Block).
5. Marine transformers are used for integrating the wave power output to the on-shore power grid.The transmission network at the Lysekil emplacement consists of two power transformers withfive winding taps connected at each extreme of a submarine transmission line. In this study, onlythe first transformer was considered [63].
The aforementioned elements can function collectively to feed an isolated or grid-connected system.
Figure 14. Circuit diagram applied of a linear wave energy system located in Lysekil Test Site.
6.2.2. WEC Units
Real power measurements of the three WEC units are used to demonstrate the KESS’s ability tosmooth the wave power output. Figure 15a) shows the sea state in terms of the buoy’s wave elevationduring the first half-hour of the study [60], and Figure 15b) represents the WEC power output registeredduring the first half-hour of the study. As can be seen in Figure 15a), the hour of study corresponds to acalm sea with a wave height that ranges between 27 and−22 cm, and Figure 15b) demonstrates that themedium power output is 2.55 kW.

Energies 2019, 12, 2196 15 of 28
Figure 15. Buoy wave elevation (a) and WECs’ power output (b) for the Lysekil wave farm.
6.2.3. Flywheel Model
In this study, the design data of a flywheel prototype, developed by Uppsala University, wereused [64]. This prototype comprises a hollow cylinder, radial magnetic bearings, and an electricalmachine that is capable of acting as either a motor or a generator. The kinetic energy that the FESSdelivers is governed by (1), and it has an established maximum discharge depth of 25% with respect tothe FESS’ storage capacity.
To minimize the device’s losses, two aspects were considered during the development ofthe model:
(a) First, the flywheel rotor is located inside a chamber, and it is suspended by magneticbearings that allows them to work at quasi-vacuum conditions. Therefore standby lossesare minimized [65].
(b) Secondly, the PMSM that is used as a motor/generator is composed of a coreless stator [66].
Finally, losses can be grouped and categorized as drag , electrical machine , and magneticbearings losses.
• Drag losses occur when the FESS model is operated between 15 and 30 krpm. In this speedrange, the air in the flywheel chamber develops a turbulent velocity regime. Under this condition,the power that dissipates because of the drag losses from a rotating cylinder in a concentricallycylindrical case can be expressed as (6) [67]:
Pd = ωRFd (6)

Energies 2019, 12, 2196 16 of 28
where R is the cylinder radius, and Fd is the frictional force on the cylinder. The force induced bythe viscous drag is expressed as (7):
Fd = λρπR3Lω2 (7)
where λ is the friction factor or drag coefficient obtained experimentally at low speed [64], ρ is theair density [64], and L is the cylinder length.
• For electrical machine losses in the FESS model, an electrical machine whose stator is coreless isconsidered; thus, the main source of losses in the machine is Joule losses, as expressed in (8):
Pi = RI2 (8)
• Lastly, the magnetic bearing losses associated with the magnetic bearing that is responsible forsustaining the flywheel rotor can be classified as hysteresis losses or eddy losses. At high flywheelspeeds, the eddy losses are those that surpass the hysteresis losses [64]; thus, for the developedFESS model, magnetic bearing losses are calculated according to (9), and these losses are directlyproportional to the square of the flywheel rotational speed.
Peddy = Keddy B2 f 2 (9)
where Keddy is a constant that depends on both the geometry and the material used in the magneticbearing’s design, B is the maximum magnetic flux, and f is the flywheel frequency.
6.2.4. Grid Connection
Both the KESS and WECs are connected to the grid through a grid-side converter (GSC) that israted to the nominal power of the KESS and WECs at the farm. The GSC is assumed to have a constantefficiency of 98.5% (see Figure 14). The 2.9 km sea transmission line that connects the offshore andonshore substations is a pi model with a line resistance of 0.21 Ω/km [51].
7. LRS Power Output Smoothening
The power output smoothing process presented in this paper has three main steps. In the firststep, the power output of several WECs is clustered at the wave farm connection point. Next, a filter isapplied to the output signal of the clustering process in order to determine the power reference signalthat must be stored in the flywheel. In the final step, a process of filling power valleys is implementedin order to achieve the reference power output signal given by a grid operator.
Figure 16 shows the complete block diagram of the proposed power output smoothing process.The experimental Lysekil Marine Platform in Sweden that is analyzed in this paper is formed by apermanent magnet linear generator WEC. Data used in this analysis come from a passive rectifierconnected to a load. The total power of the wave farm is equal to the sum of the power injected byeach individual WEC. Because there is no WEC regulation, the power output is highly stochastic,and this necessitates the use of the FESS system for power smoothing purposes. The flywheel controlis only coordinated with the filtering stage. The PI controller has been designed using the poleplacement technique tuned for the nominal values and results in Kp = 0.212 and Ki = 3.6. The yellowbox corresponds to the first step, the green box corresponds to the second step, and the blue boxcorresponds to the last step of the developed power smoothing process.
Energies 2019, 12, 2196 17 of 28
Figure 16. Schematic representation of the power output smoothening process.
7.1. First Stage: Generators Clustering
In this stage, the effect of clustering generators was analysed using several parameters. To dothis, each generator (WEC1, WEC2, and WEC3) and its delivered wave active power were studiedseparately. Then, every two generators are clustered. Finally, the three converters were aggregatedto a common node. The Lysekil WEC model is fully explained in [19], and it is composed of threeWEC units, each of which is formed by a surface buoy connected to the permanent magnet lineargenerator moored to a foundation on the seabed [68]. The main parameters associated with the modelare specified in Appendix.
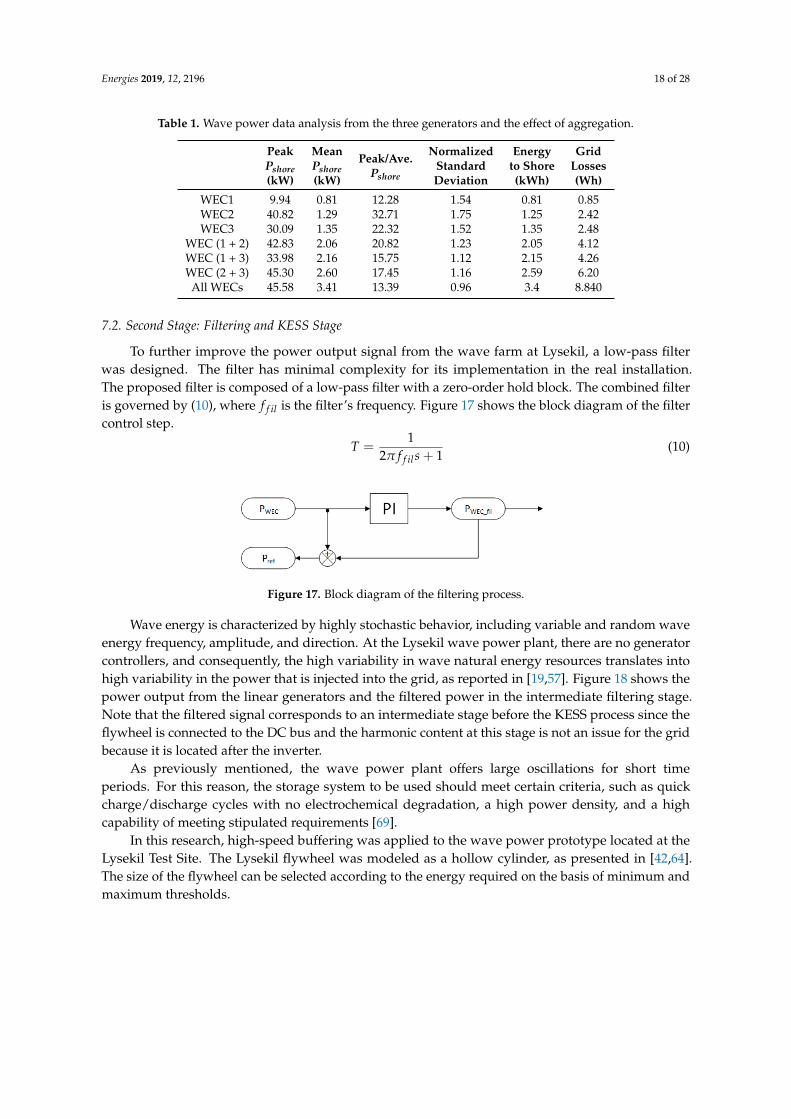
The effect of the wave active power aggregation is summarized in Table 1, and it was examinedin the context of the key performance indicators (KPIs), which are described below.
1. Peak Power, Average Power, and Peak/Average Ratio.
As the number of generators clustered at the grid connection point increases, both the peak andaverage power values of the power output from the wave energy plant increase, leading to asimultaneous decrease in the peak/average power ratio.
2. Normalized Standard Deviation (nSD).
The normalized standard deviation is measured in p.u. and gives a measure of the relative poweroutput fluctuations. This value is more intuitive than the value of absolute fluctuations.
3. Point of delivery KPIs.
Table 1 shows the power delivered to the grid by the wave energy farm at the grid connectionpoint. From the results, it can be concluded that clustering the WEC units improves the poweroutput in terms of the peak/average ratio and standard deviation. Nevertheless, the poweroutput variability is not completely improved. Consequently, additional techniques need to becarried out in order to achieve this goal; these techniques include filtering and valley filling,and their procedures are fully shown in Table 1.
Energies 2019, 12, 2196 18 of 28
Table 1. Wave power data analysis from the three generators and the effect of aggregation.
PeakPshore(kW)
MeanPshore(kW)
Peak/Ave.Pshore
NormalizedStandardDeviation
Energyto Shore(kWh)
GridLosses(Wh)
WEC1 9.94 0.81 12.28 1.54 0.81 0.85WEC2 40.82 1.29 32.71 1.75 1.25 2.42WEC3 30.09 1.35 22.32 1.52 1.35 2.48
WEC (1 + 2) 42.83 2.06 20.82 1.23 2.05 4.12WEC (1 + 3) 33.98 2.16 15.75 1.12 2.15 4.26WEC (2 + 3) 45.30 2.60 17.45 1.16 2.59 6.20All WECs 45.58 3.41 13.39 0.96 3.4 8.840
7.2. Second Stage: Filtering and KESS Stage
To further improve the power output signal from the wave farm at Lysekil, a low-pass filterwas designed. The filter has minimal complexity for its implementation in the real installation.The proposed filter is composed of a low-pass filter with a zero-order hold block. The combined filteris governed by (10), where f f il is the filter’s frequency. Figure 17 shows the block diagram of the filtercontrol step.
T =1
2π f f ils + 1(10)
Figure 17. Block diagram of the filtering process.
Wave energy is characterized by highly stochastic behavior, including variable and random waveenergy frequency, amplitude, and direction. At the Lysekil wave power plant, there are no generatorcontrollers, and consequently, the high variability in wave natural energy resources translates intohigh variability in the power that is injected into the grid, as reported in [19,57]. Figure 18 shows thepower output from the linear generators and the filtered power in the intermediate filtering stage.Note that the filtered signal corresponds to an intermediate stage before the KESS process since theflywheel is connected to the DC bus and the harmonic content at this stage is not an issue for the gridbecause it is located after the inverter.
As previously mentioned, the wave power plant offers large oscillations for short timeperiods. For this reason, the storage system to be used should meet certain criteria, such as quickcharge/discharge cycles with no electrochemical degradation, a high power density, and a highcapability of meeting stipulated requirements [69].
In this research, high-speed buffering was applied to the wave power prototype located at theLysekil Test Site. The Lysekil flywheel was modeled as a hollow cylinder, as presented in [42,64].The size of the flywheel can be selected according to the energy required on the basis of minimum andmaximum thresholds.

Energies 2019, 12, 2196 19 of 28
Figure 18. Results of the filtering control system over the wave power output.
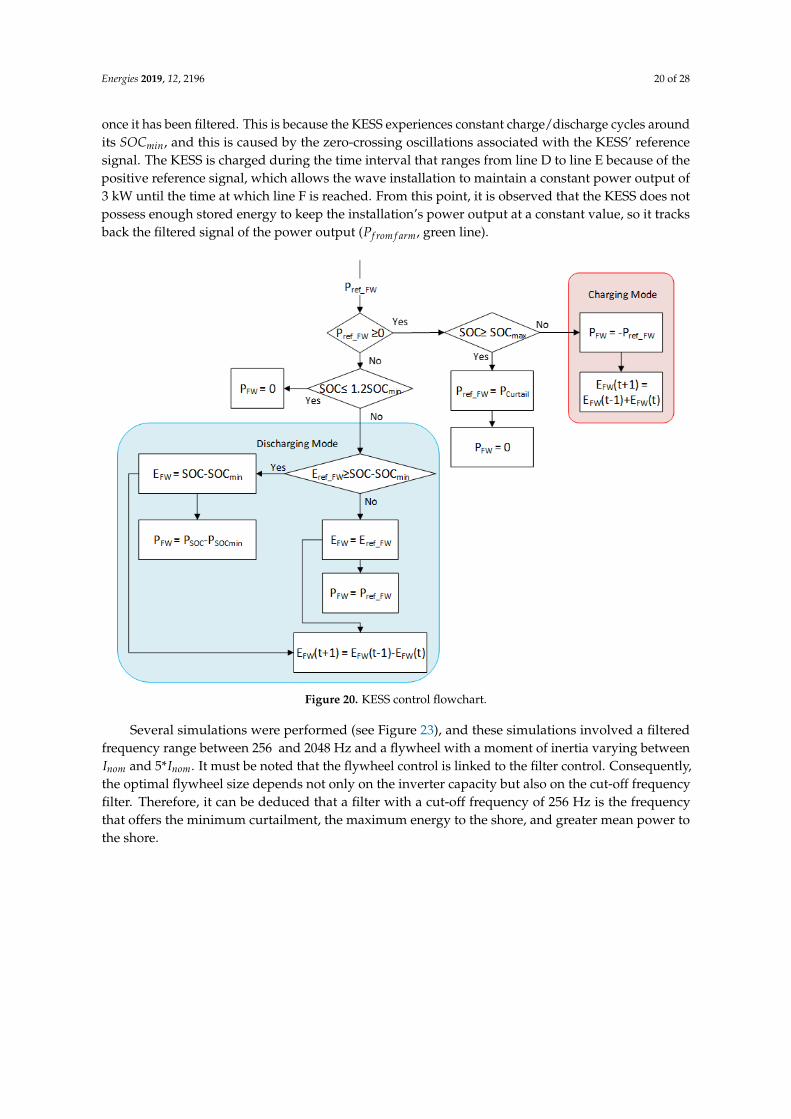
Figure 19 shows the block diagram of the flywheel energy storage control, and the charge anddischarge control strategy of the KESS is shown in Figure 20. A reference signal (Pre f−FW) is usedto control the energy storage of the flywheel. The difference between the output power of the WECarray (PWEC f arm ) and the filtered power (Pf il) is used as the power reference signal (Pre f−FW) of theflywheel. If PWEC f arm is larger than Pf il (Pre f−FW = PWEC f arm − Pf il > 0), the difference between bothsignals is sent as Pre f−FW to the KESS, and the flywheel stores energy. Once the KESS achieves itsmaximum state of charge (SOC) (0.9 p.u.), the excess power is curtailed (Pcurt = Pre f−FW − PnomFW ).If Pre f−FW = PWEC f arm − Pf il < 0, then the KESS is in discharge mode and the power injected into thesystem is equal to Pre f−FW . The KESS discharges energy until the SOCmin limit is achieved. In thisstudy, the SOCmin = 0.25 p.u. If SOCmin is reached, there is no possibility for the KESS to inject energyinto the system, so the PWEC is sent to the shore. This control strategy will be linked with the wavegenerator controller to smooth the wave power farm output.
Figure 19. Block diagram of the FESS control process.
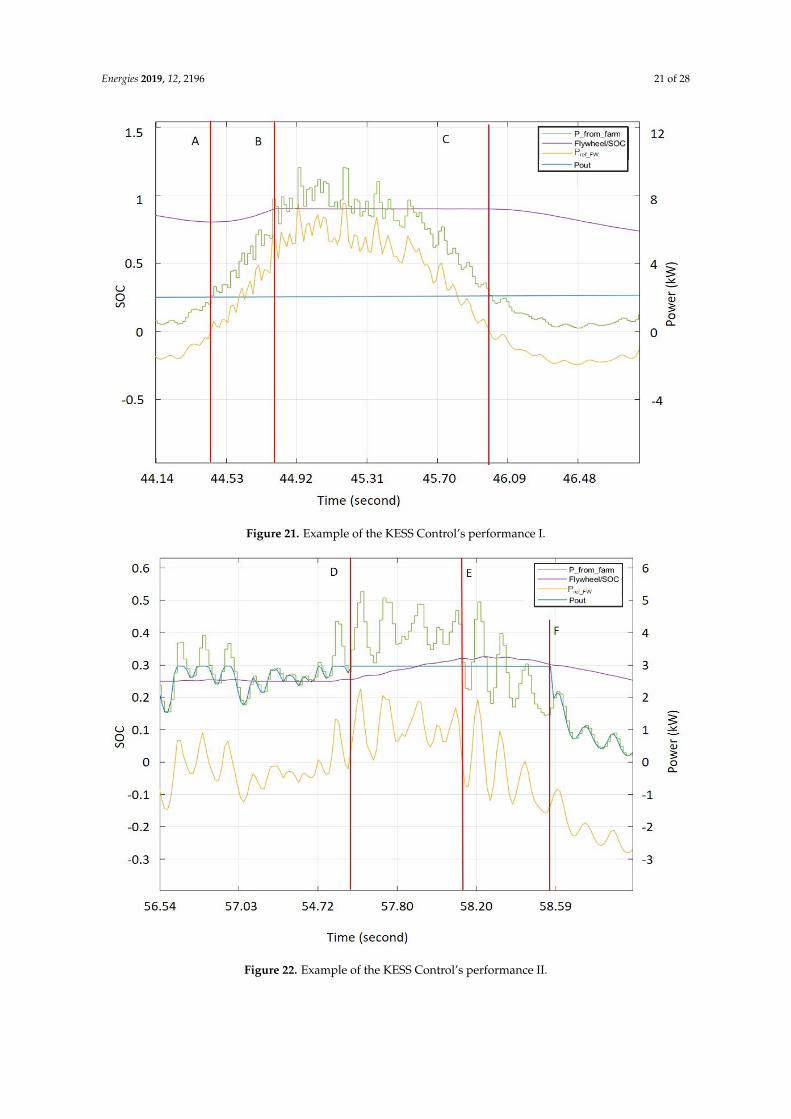
Figures 21 and 22 show an example of the control strategy in two different periods of time.The lines in Figure 21 (i.e., A, B, and C) and the lines in Figure 22 (i.e., D, E, and F) represent the timeintervals in which the flywheel performance experiences a change. The space between lines A and Bcorresponds to the KESS charge mode, in which the reference signals are positive (Pre f−FW , orangeline). Once the KESS achieves the maximum SOC (SOCmax=0.9*SOCnom) at line B, the power is thencurtailed, and the power to shore (Pout, blue line) remains constant with the energy fed by the KESS.At point C, the reference signal becomes negative, and the KESS system is in discharge mode. Figure 22shows a period of time in which the KESS charge and discharge mode is around the minimum KESSSOC. At the initial instance portrayed in Figure 22, the FESS SOC is situated at its minimum value(SOCmin=0.25*SOCnom). In the first instance of the simulation (i.e., up to line D), the installation’spower output (Pout, blue line) roughly follows the output reference signal of the wave emplacement
Energies 2019, 12, 2196 20 of 28
once it has been filtered. This is because the KESS experiences constant charge/discharge cycles aroundits SOCmin, and this is caused by the zero-crossing oscillations associated with the KESS’ referencesignal. The KESS is charged during the time interval that ranges from line D to line E because of thepositive reference signal, which allows the wave installation to maintain a constant power output of3 kW until the time at which line F is reached. From this point, it is observed that the KESS does notpossess enough stored energy to keep the installation’s power output at a constant value, so it tracksback the filtered signal of the power output (Pf rom f arm, green line).
Figure 20. KESS control flowchart.
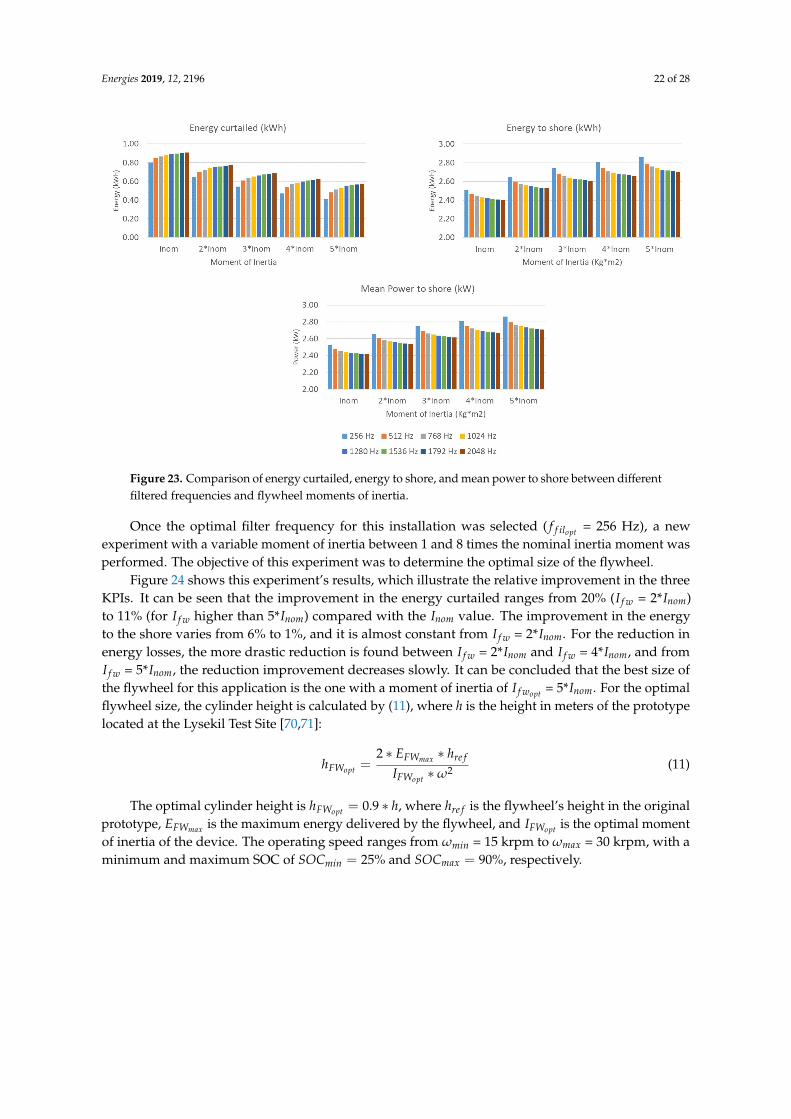
Several simulations were performed (see Figure 23), and these simulations involved a filteredfrequency range between 256 and 2048 Hz and a flywheel with a moment of inertia varying betweenInom and 5*Inom. It must be noted that the flywheel control is linked to the filter control. Consequently,the optimal flywheel size depends not only on the inverter capacity but also on the cut-off frequencyfilter. Therefore, it can be deduced that a filter with a cut-off frequency of 256 Hz is the frequencythat offers the minimum curtailment, the maximum energy to the shore, and greater mean power tothe shore.
Energies 2019, 12, 2196 21 of 28
Figure 21. Example of the KESS Control’s performance I.
Figure 22. Example of the KESS Control’s performance II.
Energies 2019, 12, 2196 22 of 28
Figure 23. Comparison of energy curtailed, energy to shore, and mean power to shore between differentfiltered frequencies and flywheel moments of inertia.
Once the optimal filter frequency for this installation was selected ( f f ilopt = 256 Hz), a newexperiment with a variable moment of inertia between 1 and 8 times the nominal inertia moment wasperformed. The objective of this experiment was to determine the optimal size of the flywheel.
Figure 24 shows this experiment’s results, which illustrate the relative improvement in the threeKPIs. It can be seen that the improvement in the energy curtailed ranges from 20% (I f w = 2*Inom)to 11% (for I f w higher than 5*Inom) compared with the Inom value. The improvement in the energyto the shore varies from 6% to 1%, and it is almost constant from I f w = 2*Inom. For the reduction inenergy losses, the more drastic reduction is found between I f w = 2*Inom and I f w = 4*Inom, and fromI f w = 5*Inom, the reduction improvement decreases slowly. It can be concluded that the best size ofthe flywheel for this application is the one with a moment of inertia of I f wopt = 5*Inom. For the optimalflywheel size, the cylinder height is calculated by (11), where h is the height in meters of the prototypelocated at the Lysekil Test Site [70,71]:
hFWopt =2 ∗ EFWmax ∗ hre f
IFWopt ∗ω2 (11)
The optimal cylinder height is hFWopt = 0.9 ∗ h, where hre f is the flywheel’s height in the originalprototype, EFWmax is the maximum energy delivered by the flywheel, and IFWopt is the optimal momentof inertia of the device. The operating speed ranges from ωmin = 15 krpm to ωmax = 30 krpm, with aminimum and maximum SOC of SOCmin = 25% and SOCmax = 90%, respectively.
Energies 2019, 12, 2196 23 of 28
Figure 24. Relative improvements in KPIs.
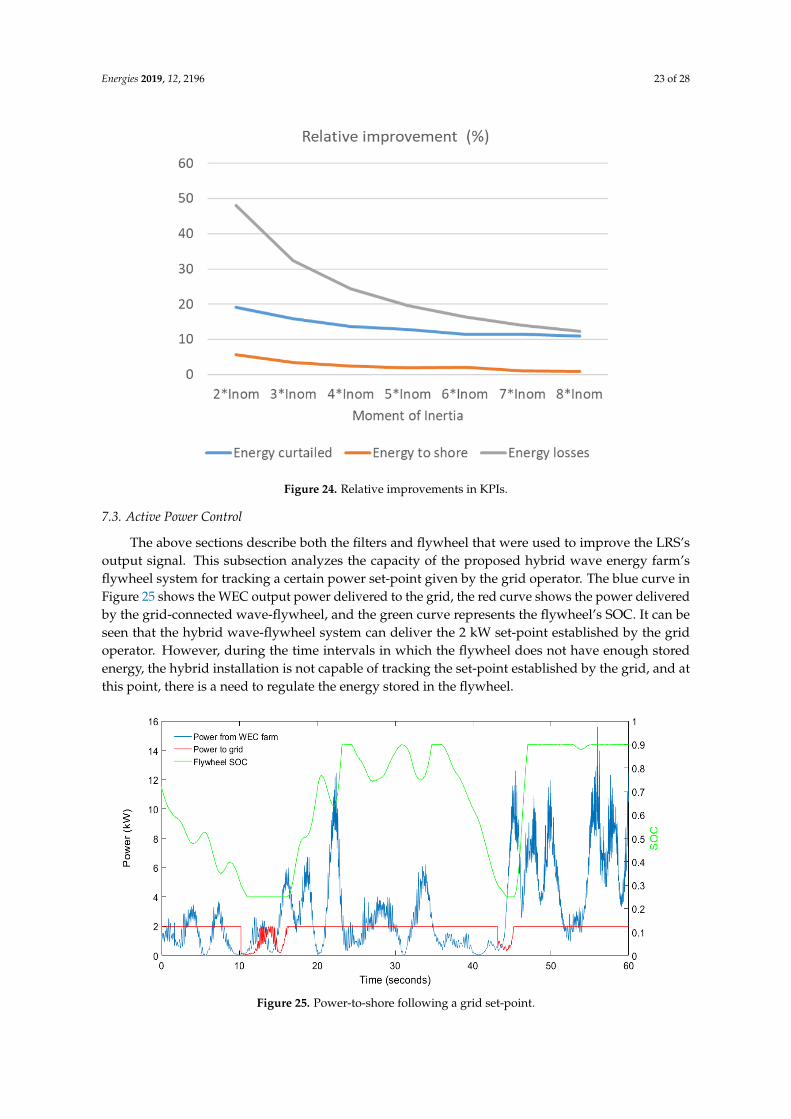
7.3. Active Power Control
The above sections describe both the filters and flywheel that were used to improve the LRS’soutput signal. This subsection analyzes the capacity of the proposed hybrid wave energy farm’sflywheel system for tracking a certain power set-point given by the grid operator. The blue curve inFigure 25 shows the WEC output power delivered to the grid, the red curve shows the power deliveredby the grid-connected wave-flywheel, and the green curve represents the flywheel’s SOC. It can beseen that the hybrid wave-flywheel system can deliver the 2 kW set-point established by the gridoperator. However, during the time intervals in which the flywheel does not have enough storedenergy, the hybrid installation is not capable of tracking the set-point established by the grid, and atthis point, there is a need to regulate the energy stored in the flywheel.
Figure 25. Power-to-shore following a grid set-point.

Energies 2019, 12, 2196 24 of 28
8. Discussion
Table 2 summarizes the KPIs associated with the wave power smoothing control proposed in thispaper. In analyzing Tables 1 and 2, the following conclusions can be drawn:
Table 2. Summarized results for different smoothening stages.
PeakPshore(kW)
MeanPshore(kW)
Peak/Ave.Pshore
GridLosses(Wh)
CurtailedEnergy(kWh)
Energyto Shore(kWh)
NormalizedStandardDeviation
WECclustering 45.58 3.41 13.39 8.84 − 3.40 0.96
LPF at 256 Hz 9.23 2.52 3.66 12.72 − 2.51 0.58KESS (3.18 kg.m2) 9.23 2.91 3.17 4.37 0.36 2.92 0.49
Active power control 4.56 2.68 1.71 3.47 0.70 2.68 0.44
1. First, aggregating a group of generators into one cluster results in a decreased Peak/Averagepower ratio and an improved normalized standard deviation (nSD).
2. In addition, two clustered wave generators share the same magnitude order when referencing thepeak values; this results in a notable increase in both the energy losses and the energy delivered tothe grid (to the shore). This can be seen in Table 1, in which the results of aggregating Generators2 and 3 are reported.
3. Furthermore, the cut-off frequency of the low-pass filter is critical for the smoothing process.The study found an optimal cut-off frequency of 256 Hz; it not only filters the output powerbut also reduces the energy curtailment. Increasing the cut-off frequency of the filter above thisoptimal value does not decrease the losses in the substation or flywheel, but it increases theenergy curtailment, which is not efficient.
4. Moreover, increasing the moment of inertia of the flywheel (that is, increasing the cylinderheight) results in a considerable decrease in the energy curtailment. Nevertheless, an appropriatecriterion for choosing the cylinder size could be based on the related improvement in (1) theenergy that is delivered to the shore and (2) the curtailed energy. This optimal value is achievedfor a moment of inertia that is equal to 3.18 kg m2, which corresponds to a flywheel size that isroughly 10% of the inverter’s size.
5. In conclusion, almost all of the analyzed KPIs are considerably improved if the aforementionedsmoothing techniques are carried out, such as the peak power to the shore, peak/meanpower to the shore ratio, normalized standard deviation, and grid connection losses, all ofwhich are decreased. These findings are a clear indicator of the effectiveness of the proposedsimulated approach.
9. Conclusions
Flywheels are found to be a good option for the smoothing process. It was confirmed that utilizingflywheel systems coupled to wave farms improves the power output, and the grid integration of thistechnology is improved accordingly.
In this paper, a hybrid wave/KESS installation control is proposed. This control combines waveenergy generator clustering and filtering techniques with the control of a flywheel in order to improvethe power output of the hybrid installation. The proposed control was applied at the Lysekil WaveEnergy Site located in Sweden by using real measurements gathered from the wave energy generators.It was established that the proposed control smooths the power output delivered by the marine energyinstallation to the grid and allows the connection of the wave/FESS installation to power grids, evenweak ones. Moreover, it was shown that the hybrid plant can follow a power reference signal imposedby the grid operator. Consequently, the proposed combination of the wave energy farm control andflywheel energy storage system can be grid-connected as a controllable distributed energy resource.

Energies 2019, 12, 2196 25 of 28
Therefore, the hybrid system is capable of offering enough flexibility to the distributed system operatorin terms of ancillary services.
Author Contributions: All authors contributed to the design and implementation of the research, to the analysisof the results and to the writing of the manuscript.
Funding: This research received no external funding
Conflicts of Interest: The authors declare no conflict of interest.
Appendix
WEC main parametersNominal power at 0.7 m/s 10 kWVoltage (line to line, rms at 0.7 m/s) , Vd 200 VGenerator resistance, RG 0.44 ± 1% OmegaGenerator inductance, LS 11.7 mHAir gap 3 mmSize of the magnet block 6.5 × 35 × 100 mm3
Pole width, wp 50 mmNumber of stator sides 4Vertical stator length 1264 mmVertical translator length 1867 mmTransator resp. stator width 400 mmTranslator weight 1000 kg
References
1. Organization for Economic Cooperation and Development (OECD). World Energy Outlook; Technical Report;International Energy Agency: Paris, France, 2016; ISBN: 978-92-64-26495-3.
2. Uihlein, A.; Magagna, D. Wave and tidal current energy—A review of the current state of research beyondtechnology. Renew. Sustain. Energy Rev. 2016, 58, 1070–1081. [CrossRef]
3. Falnes, J. A review of wave-energy extraction. Mar. Struct. 2007, 20, 185–201. [CrossRef]4. Prakash, S.; Mamun, K.; Islam, F.; Mudliar, R.; Pau’u, C.; Kolivuso, M.; Cadralala, S. Wave Energy Converter:
A Review of Wave Energy Conversion Technology. In Proceedings of the 3rd Asia-Pacific World Congresson Computer Science and Engineering, Nadi, Fiji, 5–6 December 2016; pp. 71–77.
5. Marine Energy—Wave Device The European Marine Energy Centre. 2019. Available online: http://www.emec.org.uk/marine-energy/wave-devices/ (accessed on 24 February 2019).
6. Hong, Y.; Waters, R.; Boström, C.; Eriksson, M.; Engström, J.; Leijon, M. Review on electrical control strategiesfor wave energy converting systems. Renew. Sustain. Energy Rev. 2014, 31, 329–342. [CrossRef]
7. Leijon, J. Simulation of a Linear Wave Energy Converter with Different Damping Control Strategies forImproved Wave Energy Extraction. Master’s Thesis, Uppsala University, Uppsala, Sweden, 2016.
8. Babarit, A.; Guglielmi, M.; Clément, A.H. Declutching control of a wave energy converter. Ocean Eng. 2009,36, 1015–1024. [CrossRef]
9. Brito, M.; Teixeira, L.; Canelas, R.B.; Ferreira, R.M.; Neves, M.G. Experimental and Numerical Studiesof Dynamic Behaviors of a Hydraulic Power Take-Off Cylinder Using Spectral Representation Method.ASME J. Tribol. 2017, 140, 021102. [CrossRef]
10. De O. Falcão, A.F. Modelling and control of oscillating-body wave energy converters with hydraulic powertake-off and gas accumulator. Ocean Eng. 2007, 34, 2021–2032.
11. De O. Falcão, A.F. Phase control through load control of oscillating-body wave energy converters withhydraulic PTO system. Ocean Eng. 2008, 35, 358–366.
12. Howlader, A.M.; Urasaki, N.; Yona, A.; Senjyu, T.; Saber, A.Y. A review of output power smoothing methodsfor wind energy conversion systems. Renew. Sustain. Energy Rev. 2013, 26, 135–146. [CrossRef]
13. Rahm, M.; Svensson, O.; Boström, C.; Waters, R.; Leijon, M. Experimental results from the operation ofaggregated wave energy converters. IET Renew. Power Gener. 2012, 6, 149–160. [CrossRef]

Energies 2019, 12, 2196 26 of 28
14. Venugopal, V.; Smith, G.H. The effect of wave period filtering on wave power extraction and device tuning.Ocean Eng. 2007, 34, 1120–1137. [CrossRef]
15. Godoy-Diana, R.; Czitrom, S.P. On the tuning of a wave-energy driven oscillating -water-column seawaterpump to polychromatic waves. Ocean Eng. 2007, 34, 2374–2384. [CrossRef]
16. Bedard, R.; Hagerman, G. E2I EPRI Assessment Offshore Wave Energy Conversion Devices; Electrical InnovationInstitute: Washington, DC, USA, 2004.
17. Moreno-Torres, P.; Blanco, M.; Navarro, G.; Lafoz, M. Power smoothing system for wave energy convertersby means of a supercapacitor-based energy storage system. In Proceedings of the 2015 17th EuropeanConference on Power Electronics and Applications (EPE’15 ECCE-Europe), Geneva, Switzerland, 8–10September 2015; pp. 1–9.
18. Blavette., A.; O’Sullivan, D.L.; Lewis, T.; Egan, M.G. Grid Integration of Wave and Tidal Energy. In Proceedingsof the International Conference on Offshore Mechanics and Arctic Engineering, Rotterdam, The Netherlands,19–24 June 2011; pp. 749–758.
19. Lejerskog, E.; Boström, C.; Hai, L.; Waters, R.; Leijon, M. Experimental results on power absorption from awave energy converter at the Lysekil wave energy research site. Renew. Energy 2015, 77, 9–14. [CrossRef]
20. Ma, T.; Yang, H.; Lu, L. Development of hybrid battery–supercapacitor energy storage for remote arearenewable energy systems. Appl. Energy 2015, 153, 56–62. [CrossRef]
21. Parwal, A.; Fregelius, M.; Temiz, I.; Göteman, M.; de Oliveira, J.G.; Boström, C.; Leijon, M. Energymanagement for a grid-connected wave energy park through a hybrid energy storage system. Appl. Energy2018, 231, 399–411. [CrossRef]
22. Krings, A.; Soulard, J. Overview and comparison of iron loss models for electrical machines. J. Electr. Eng.2010, 10, 162–169.
23. Barranger, J. Hysteresis and Eddy-Current Losses of a Transformer Lamination Viewed as an Application of thePoynting Theorem; NASA Technical Note (TN-D-3114); National Aeronautics and Space Administration:Washington, DC, USA, 1965.
24. Henderson, R. Design, simulation, and testing of a novel hydraulic power take-off system for the Pelamiswave energy converter. Renew. Energy 2006, 31, 271–283. [CrossRef]
25. Zhao, X.; Yan, Z.; Zhang, X.P. A wind-wave farm system with self-energy storage and smoothed poweroutput. IEEE Access 2016, 4, 8634–8642. [CrossRef]
26. Maslen, E.H.; Schweitzer, G. Magnetic Bearings: Theory, Design, and Application to Rotating Machinery; Springer:Berlin, Germany, 2009.
27. Bolund, B.; Bernhoff, H.; Leijon, M. Flywheel energy and power storage systems. Renew. Sustain. Energy Rev.2007, 11, 235–258. [CrossRef]
28. Arani, A.K.; Karami, H.; Gharehpetian, G.; Hejazi, M. Review of Flywheel Energy Storage Systems structuresand applications in power systems and microgrids. Renew. Sustain. Energy Rev. 2017, 69, 9–18. [CrossRef]
29. Infield, D.; Hill, J. Literature Review: Electrical Energy Storage for Scotland; University of Strathclyde: Glasgow,UK, 2015.
30. Amaris, H.; Alonso, M.; Alvarez, C. Reactive Power Management of Power Networks with Wind Generation;Springer: Berlin, Germany, 2013.
31. Amaris, H.; Alonso, M. Coordinated reactive power management in power networks with wind turbinesand FACTS devices. Energy Convers. Manag. 2011, 52, 2575–2586. [CrossRef]
32. Asociación Española de Normalización. UNE-EN 50160: Voltage Characteristics of Electricity Supplied byPublic Electricity Networks; Technical Report; Asociación Española de Normalización: Madrid, Spain, 2011;2011/A1:2015.
33. Amiryar, M.E.; Pullen, K.R. A review of flywheel energy storage system technologies and their applications.Appl. Sci. 2017, 7, 286. [CrossRef]
34. Diaz-Gonzalez, F.; Bianchi, F.D.; Sumper, A.; Gomis-Bellmunt, O. Control of a flywheel energy storagesystem for power smoothing in wind power plants. IEEE Trans. Energy Convers. 2014, 29, 204–214. [CrossRef]
35. Gurumurthy, S.R.; Agarwal, V.; Sharma, A. Optimal energy harvesting from a high-speed brushless DCgenerator-based flywheel energy storage system. IET Electr. Power Appl. 2013, 7, 693–700. [CrossRef]
36. Wang, L.; Yu, J.Y.; Chen, Y.T. Dynamic stability improvement of an integrated offshore wind andmarine-current farm using a flywheel energy-storage system. IET Renew. Power Gener. 2011, 5, 387–396.[CrossRef]

Energies 2019, 12, 2196 27 of 28
37. Park, J.D.; Kalev, C.; Hofmann, H.F. Control of high-speed solid-rotor synchronous reluctance motor/generatorfor flywheel-based uninterruptible power supplies. IEEE Trans. Ind. Electron. 2008, 55, 3038–3046. [CrossRef]
38. Li, W.; Chau, K.; Ching, T.; Wang, Y.; Chen, M. Design of a high-speed superconducting bearingless machinefor flywheel energy storage systems. IEEE Trans. Appl. Supercond. 2015, 25. [CrossRef]
39. Sihler, C.; Miri, A.M. A stabilizer for oscillating torques in synchronous machines. IEEE Trans. Ind. Appl.2005, 41, 748–755. [CrossRef]
40. Recheis, M.N.; Schweighofer, B.; Fulmek, P.; Wegleiter, H. Selection of magnetic materials for bearinglesshigh-speed mobile flywheel energy storage systems. IEEE Trans. Magn. 2014, 50, 1–4. [CrossRef]
41. Faraji, F.; Majazi, A.; Al-Haddad, K. A comprehensive review of Flywheel Energy Storage System technology.Renew. Sustain. Energy Rev. 2017, 67, 477–490.
42. Abrahamsson, J.; Hedlund, M.; Kamf, T.; Bernhoff, H. High-speed kinetic energy buffer: Optimization ofcomposite shell and magnetic bearings. IEEE Trans. Ind. Electron. 2014, 61, 3012–3021. [CrossRef]
43. Ibarra-Berastegi, G.; Sáenz, J.; Ulazia, A.; Serras, P.; Esnaola, G.; Garcia-Soto, C. Electricity production,capacity factor, and plant efficiency index at the Mutriku wave farm (2014–2016). Ocean Eng. 2018, 147, 20–29.[CrossRef]
44. Tedeschi, E.; Santos-Mugica, M. Modeling and control of a wave energy farm including energy storage forpower quality enhancement: The bimep case study. IEEE Trans. Power Syst. 2014, 29, 1489–1497. [CrossRef]
45. California Energy Commission. Flywheel Systems for Utility Scale Energy Storage: A Transformative FlywheelProject for Commercial Readiness; Technical Report; California Energy Commission: Union City, CA, USA, 2019.
46. Zhou, Z.; Benbouzid, M.; Charpentier, J.F.; Scuiller, F.; Tang, T. A review of energy storage technologies formarine current energy systems. Renew. Sustain. Energy Rev. 2013, 18, 390–400. [CrossRef]
47. Hebner, R.; Beno, J.; Walls, A. Flywheel batteries come around again. IEEE Spectr. 2002, 39, 46–51. [CrossRef]48. Bleuler, H.; Sandtner, J.; Regamey, Y.J.; F Barrot, A. Passive Magnetic Bearings for Flywheels. Solid Mechanics
and Its Applications 2005. Available online: http://www.researchgate.net/publication/228554073_Passive_Magnetic_Bearings_for_Flywheels (accessed on 24 February 2019).
49. Wang, W.; Hofmann, H.; Bakis, C.E. Ultrahigh speed permanent magnet motor/generator for aerospaceflywheel energy storage applications. In Proceedings of the IEEE International Conference on ElectricMachines and Drives, San Antonio, TX, USA, 15 May 2005; pp. 1494–1500.
50. International Energy Agency. Implementing Agreement on Ocean Energy Systems; Technical Report; IEA-OESExecutive Committee: Lisbon, Portugal, 2009.
51. Boström, C. Electrical Systems for Wave Energy Conversion. Ph.D. Thesis, Uppsala University, Uppsala,Sweden, 2011.
52. Waters, R.; Engström, J.; Isberg, J.; Leijon, M. Wave climate of the Swedish west coast. Renew. Energy 2009,34, 1600–1606. [CrossRef]
53. Rahm, M.; Boström, C.; Svensson, O.; Grabbe, M.; Bulow, F.; Leijon, M. Offshore underwater substation forwave energy converter arrays. IET Renew. Power Gener. 2010, 4, 602–612. [CrossRef]
54. Rémouit, F.; Chatzigiannakou, M.A.; Bender, A.; Temiz, I.; Sundberg, J.; Engström, J. Deployment andMaintenance of Wave Energy Converters at the Lysekil Research Site: A Comparative Study on the Use ofDivers and Remotely-Operated Vehicles. J. Mar. Sci. Eng. 2018, 6, 39. [CrossRef]
55. Melo, A.B.; Villate, J.L. Annual Report 2016; Technical Report; Executive Committee of Ocean Energy Systems:Lisbon, Portugal, 2016.
56. Lysekil Wave Energy Site. 2018. Available online: https://tethys.pnnl.gov/annex-iv-sites/lysekil-wave-energy-site (accessed on 6 May 2018).
57. Leijon, M.; Boström, C.; Danielsson, O.; Gustafsson, S.; Haikonen, K.; Langhamer, O.; Strömstedt, E.;Stålberg, M.; Sundberg, J.; Svensson, O.; et al. Wave energy from the North Sea: Experiences from the Lysekilresearch site. Surv. Geophys. 2008, 29, 221–240. [CrossRef]
58. Lejerskog, E.; Gravråkmo, H.; Savin, A.; Strömstedt, E.; Tyrberg, S.; Haikonen, K.; Krishna, R.; Boström, C.;Rahm, M.; Ekström, R.; et al. Lysekil research site, Sweden: A status update. In Proceedings of the 9thEuropean Wave and Tidal Energy Conference, Southampton, UK, 5–9 September 2011.
59. Svensson, O.; Boström, C.; Rahm, M.; Leijon, M. Description of the control and measurement system used inthe low voltage marine substation at the Lysekil research site. In Proceedings of the 8th European Wave andTidal Energy Conference, Uppsala, Sweden, 7–10 September 2009.

Energies 2019, 12, 2196 28 of 28
60. Mätdata-Islandsberg. 2018. Available online: http://islandsberg.angstrom.uu.se/ (accessed on22 April 2018).
61. Boström, C.; Waters, R.; Lejerskog, E.; Svensson, O.; Stalberg, M.; Stromstedt, E.; Leijon, M. Study of a waveenergy converter connected to a nonlinear load. IEEE J. Ocean. Eng. 2009, 34, 123–127. [CrossRef]
62. Castellucci, V.; García-Terán, J.; Eriksson, M.; Padman, L.; Waters, R. Influence of sea state and tidal heighton wave power absorption. IEEE J. Ocean. Eng. 2017, 42, 566–573. [CrossRef]
63. Waters, R.; Stålberg, M.; Danielsson, O.; Svensson, O.; Gustafsson, S.; Strömstedt, E.; Eriksson, M.;Sundberg, J.; Leijon, M. Experimental results from sea trials of an offshore wave energy system. Appl. Phys.Lett. 2007, 90, 034105. [CrossRef]
64. Hedlund, M. Electrified Integrated Kinetic Energy Storage. Ph.D. Thesis, Uppsala University, Uppsala,Sweden, 2017.
65. Hedlund, M.; Abrahamsson, J.; Pérez-Loya, J.J.; Lundin, J.; Bernhoff, H. Eddy currents in a passive magneticaxial thrust bearing for a flywheel energy storage system. Int. J. Appl. Electromagn. Mech. 2017, 54, 389–404.[CrossRef]
66. Hedlund, M.; Lundin, J.; de Santiago, J.; Abrahamsson, J.; Bernhoff, H. Flywheel energy storage forautomotive applications. Energies 2015, 8, 10636–10663. [CrossRef]
67. Gorland, S.H.; Kempke, E.E., Jr.; Lumannick, S. Experimental Windage Losses for Close Clearance RotatingCylinders in the Turbulent Flow Regime; Technical Report; NASA Technical Memorandum: Washington, DC,USA, 1970.
68. Bostrom, C.; Leijon, M. Operation analysis of a wave energy converter under different load conditions.IET Renew. Power Gener. 2011, 5, 245–250. [CrossRef]
69. Larsson, K. Investigation of a Wave Energy Converter with a Flywheel and a Corresponding GeneratorDesign. Master’s Thesis, Chalmers University of Technology, Göteborg, Sweden, 2012.
70. Abram, N.J.; McGregor, H.V.; Tierney, J.E.; Evans, M.N.; McKay, N.P.; Kaufman, D.S.; Thirumalai, K.;Martrat, B.; Goosse, H.; Phipps, S.J.; et al. Early onset of industrial-era warming across the oceans andcontinents. Nature 2016, 536, 411. [CrossRef]
71. Tornelli, C.; Zuelli, R.; Marinelli, M.; Rezkalla, M.M.; Heussen, K.; Morch, A.Z.; Cornez, L.; Zaher, A.S.;Catterson, V. Key Requirements for Future Control Room Functionality; Technical Report, The ELECTRA EUResearch Project; University of Oldenburg: Oldenburg, Germany, 2015.
c© 2019 by the authors. Licensee MDPI, Basel, Switzerland. This article is an open accessarticle distributed under the terms and conditions of the Creative Commons Attribution(CC BY) license (http://creativecommons.org/licenses/by/4.0/).